

Abstract
Bioenergetic membranes are the key cellular structures responsible for coupled energy-conversion processes, which supply ATP and important metabolites to the cell. Here, we report the first 100-million atom-scale model of an entire photosynthetic organelle, a chromatophore membrane vesicle from a purple bacterium, which reveals the rate-determining steps of membrane-mediated energy conversion. Molecular dynamics simulations of this bioenergetic organelle elucidate how the network of bioenergetic proteins influences membrane curvature and demonstrates the impact of thermal disorder on photosynthetic excitation transfer. Brownian dynamics simulations of the quinone and cytochrome c2 charge carriers within the chromatophore interior probe the mechanisms of nanoscale charge transport under various pH and salinity conditions. Reproducing phenotypic properties from atomistic details, a rate-kinetic model evinces that low-light adaptations of the bacterium emerge as a spontaneous outcome of optimizing the balance between the chromatophore’s structural integrity and robust energy conversion. Put together, the hybrid structure determination and systems-level modeling of the chromatophore, in conjunction with optical spectroscopy, illuminate the chemical and organizational design principles of biological membranes that foster energy storage and transduction in living cells. Parallels are drawn with the more universal mitochondrial bioenergetic machinery, from whence molecular-scale insights on the mechanism of cellular aging are inferred. This endeavor made feasible through the advent of petascale supercomputers, paves the way to first-principles modeling of whole living cells.
Introduction
Living cells are brimming with the activity of hundreds of macromolecular complexes fulfilling their biological functions. Housed within subcellular compartments, the so-called cell organelles, these complexes form an intricate circuitry of physicochemical reactions, which give rise to remarkable biological phenotypes such as growth, adaptation to environmental changes and co-accommodation of competing functions. A physical model of the emergence of phenotypic properties from detailed atomistic interactions is expected to offer direct insights on the rules of life (Camargo, 2018). However, showing only limited progress in this direction (Goh et al., 2016), atomic-level investigations of cellular processes have thus far been impeded by the sheer complexity of the network of interactions, the timescales of a cell cycle, and the lack of essential experiment-inferred information.
Bolstered by groundbreaking developments in high-resolution imaging (Rust et al., 2006) and cryo-electron microscopy (Cheng, 2015), atomic structures of many key protein complexes are now experimentally accessible. However, structures alone provide limited information about the function of these complexes, in particular, how they interact with each other in large-scale networks. Bioinformatics and systems-biology approaches integrating libraries of existing experimental data have attempted to predict phenotypes from genotypes (Karr et al., 2012). The resulting models are, however, plagued by false-positives, often originating from experimental errors or mathematical heuristics (Korte and Farlow, 2013). Cell-scale models conceived from first principles can resolve the physical and chemical events that underlie the emergent phenotypes and ultimately render a comprehensive picture of the cellular machinery in action.
Here, we employ an array of physics-based approaches to decipher the functional circuitry of a bacterial energy-harvesting organelle, the photosynthetic chromatophore (Allen, 2017; Blankenship, 2014). With hundreds of proteins embedded in a vesicular membrane (Fig. 1), the chromatophore from Rhodobacter sphaeroides (Rba. sphaeroides) absorbs sunlight to produce ATP. We explore in atomistic detail the pathways of energy metabolism within the chromatophore vesicle to determine how light-specific phenotypes of purple bacteria emerge from collective action of cooperating proteins. Our simulations identify the mechanisms that bioenergetic protein networks commonly exploit to minimize energy dissipation, recover from environmental stresses and avoid apoptosis. More broadly, we elucidate how the physicochemical reactions within a membrane-based cellular organelle are wired to preserve the delicate balance between structural integrity and robust energy conversion.
Fig. 1: Physical model of chromatophore.
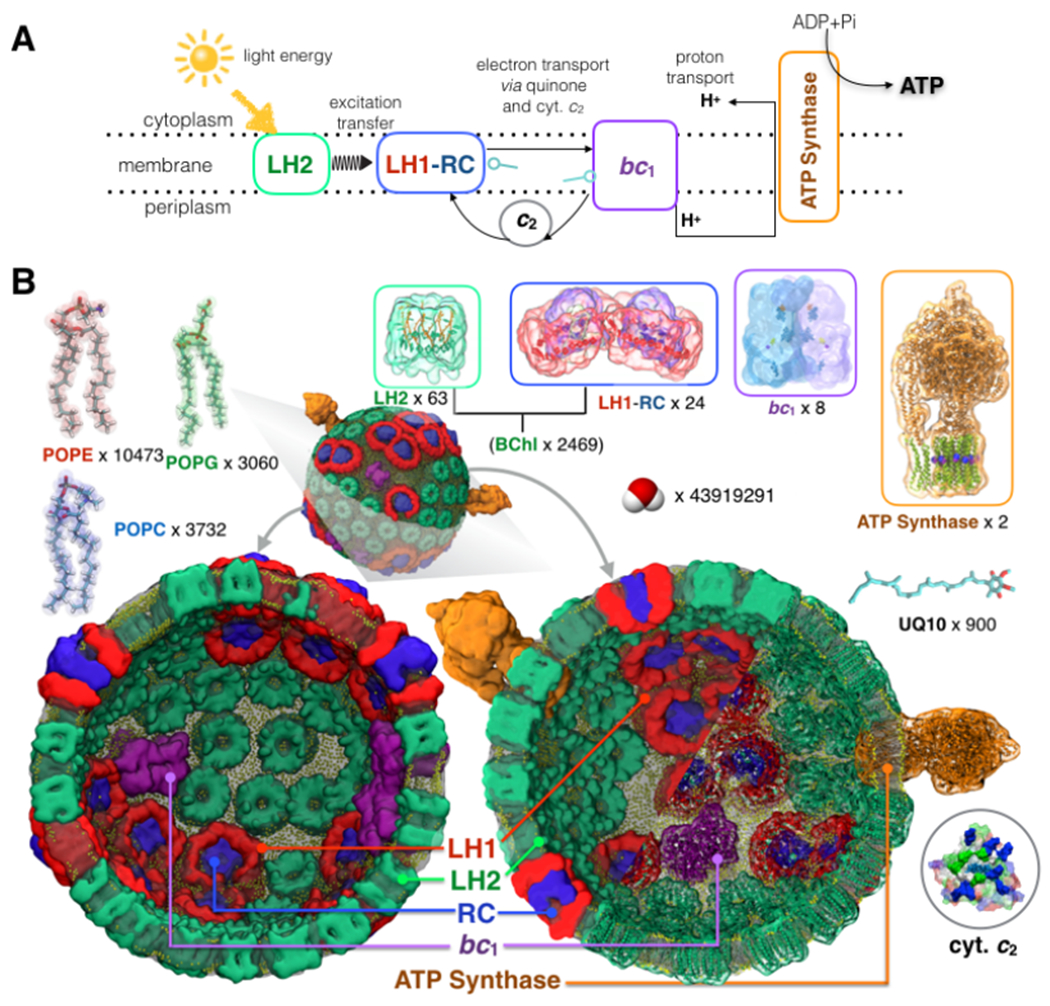
(A) Photosynthetic energy conversion in a purple bacteria chromatophore. Light energy absorbed by light-harvesting LH2 and LH1 complexes is channeled to the reaction center (RC), where a charge separation is stabilized as a reduced quinone, and the electron hole is filled by reduced cytochrome c2 (cyt. c2). Subsequent turnovers of the cytochrome bc1 complex generate a proton-motive force, which drives ATP synthesis. (B) All-atom model of a photosynthetic organelle chromatophore of purple bacterium Rba. sphaeroides. Illustrated using two halves of a transverse-section, the final configuration of the all-atom model obtained after 0.5 μs of explicit solvent all-atom equilibrium MD simulation. The model features 82 bioenergetic complexes (63 light-harvesting LH2 complexes [green], 11 dimeric and 2 monomeric RC-LH1 complexes [LH1:red; RC:blue], 4 cytochrome bc1 complex dimers [magenta], and 2 ATP synthases [orange]), together with 4011 light absorbing antenna molecules (2469 bacteriochlorophylls and 1542 carotenoid) embedded in a membrane of approximately 17200 lipid molecules (lipid phosphate indicated in yellow). The vesicle is embedded in a rectangular volume of explicit water (shown in SI) and 4624 sodium ions to ensure neutrality. The simulation system consists of 136,833,034 atoms and measures 112 nm x 112 nm x 112 nm.
Results
A physical model of the chromatophore
The bacterial chromatophore converts light into ATP in a multi-step process (Fig. 1A, Supp-Movie 1.1–1.2). First, light is absorbed by the LH2 and LH1 light-harvesting complexes, then the energy migrates to the reaction center (RC), eliciting a separation of positive and negative electrical charges. The outcome is a membrane bound reduced quinone (quinol), which leaves the RC and diffuses to the cytochrome bc1 complex, where a proton-motive force is generated, which drives synthesis of ATP. Docking of reduced cytochrome c2 fills the electron hole in the RC and resets the system for another charge separation. We have developed several first-principle models that reflect the complexity of these coupled energy-conversion processes and link the microscopic configuration of the proteins within the chromatophore membrane to the rate of ATP synthesis, and, hence, to the phenotype of the bacterium.
We built the all-atom structural model of the Rba. sphaeroides chromatophore, Fig. 1B, based on earlier models (Sener et al., 2007; Sener et al., 2010), and atomic-force microscopy (Bahatyrova et al., 2004; Olsen et al., 2008; Adams and Hunter, 2012; Cartron et al., 2014), electron microscopy (Qian et al., 2008; Cartron et al., 2014), crystallography (Qian et al., 2013), mass spectrometry (Jackson et al., 2012; Cartron et al., 2014; Woronowicz and Niederman, 2010), and optical spectroscopy data (summarized in Supplementary Note 1). The 136-million-atom fully hydrated chromatophore vesicle had an average inner diameter of 52 nm (Adams and Hunter, 2012) and contained 82 bioenergetic complexes, together with 4011 light-absorbing antenna molecules embedded in a membrane of 17200 lipid molecules containing 22% POPC, 22% POPG, and 56% POPE on the outer, cytoplasmic side of the vesicle, and 24% POPC, 10% POPG, and 66% POPE on the inner, periplasmic side (Cartron et al., 2014). In addition, 600 quinone (ubiquinone-10) charge carriers were uniformly placed within the membrane, whereas another 300 were placed in the vicinity of the quinone-binding bc1 and RC-LH1 complexes (Sener et al., 2016).
The initial all-atom model of the chromatophore was simulated using all-atom molecular dynamics (MD) (Karplus and Petsko, 1990) for more than half of a microsecond, using NAMD (Phillips et al., 2005) on the Titan Supercomputer at Oakridge National Laboratory (Figs. S1–S7). The simulation revealed changes in local curvature and composition in the lipid membrane surrounding the proteins and characterized the dynamics of quinone molecules in the membrane. The resulting molecular configurations were used for large-scale QM/MM simulations to determine the effect of membrane disorder on light absorption (Olbrich et al., 2010), as well as continuum electrostatics calculations (Baker et al., 2001) and Brownian dynamics (BD) simulations (Ermak and McCammon, 1978), which elucidated the principles of directional charge transport within the vesicle. Finally, rates of individual processes were integrated into a kinetic model of ATP synthesis. This integrated model captures the emergence of light-adaptation phenotypes in purple bacteria starting from all-atom details.
Segregation of proteins enables heterogeneous membrane curvature
Analysis of the MD trajectory illuminated that the shape of a chromatophore vesicle departs from that of an ideal sphere, displaying distinct protein-sculpted features on the surface (Fig. 2). Specifically, the local curvature in the vicinity of the LH1-dimers or the hexagonally-packed LH2 complexes is closed (convex), with a radius of 200-250 Å, while that in the vicinity of the bc1 complex is flatter, with a curvature radius of 400-500 Å (Fig. 2A–B). A 40 μs coarse-grained MD simulation carried out using the MARTINI force field (Marrink et al., 2007) confirmed the curvature modulations observed in the 0.5-μs all-atom MD simulation (Fig. 2C, and Supplementary Methods 3 and 8), reinforcing our conclusion that the shape of bc1-complex dimers is compatible with that of a flat membrane.
Fig. 2: MD simulation reveals protein-specific heterogeneity of membrane curvature.
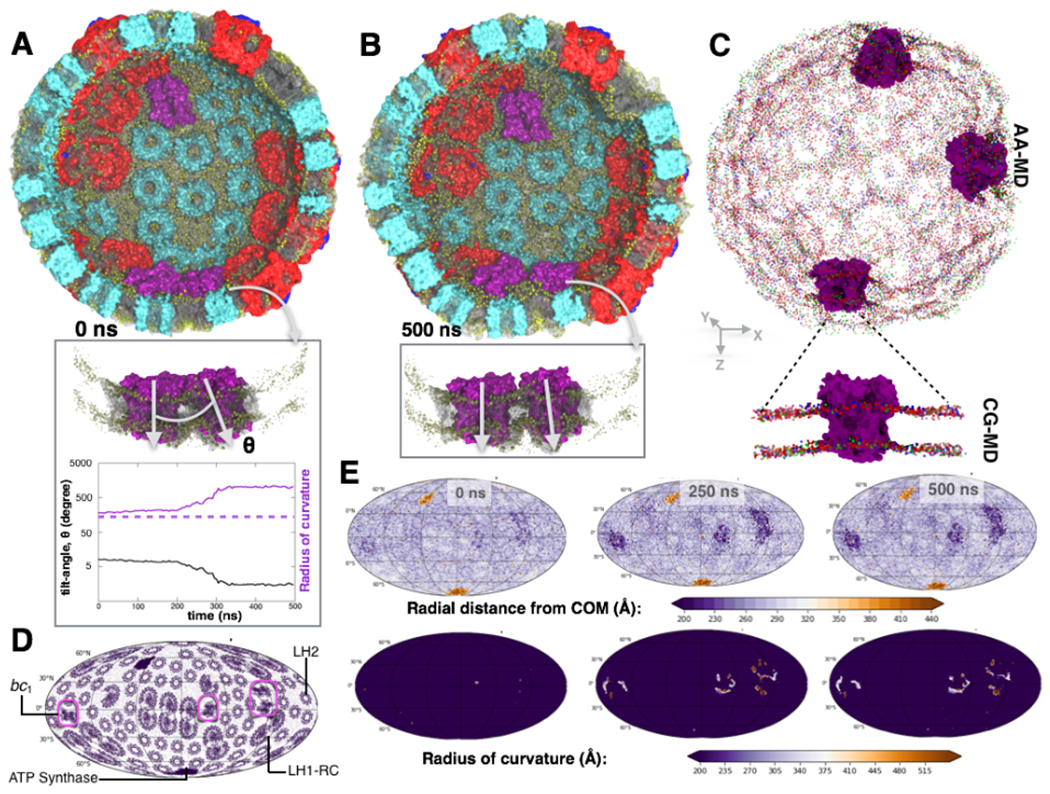
Snapshots of the chromatophore vesicle at the beginning (A) and after 500 ns (B) of the MD simulation. The membrane is nearly flat in the vicinity of the bc1 complexes [magenta] but convex near other proteins (also see Figs. S8 and S10). (Insets) Zoom-in view of two proximal bc1 complexes that are found to induce the highest degree of local membrane curvature change. Tilt-angle, θ, between these two proximal bc1 complexes decrease during the simulation, reflecting a gradual increase in the local radius of curvature (tilt angle-radius of curvature relationship discussed in Supplementary Method 7: Eq. 3). Dotted-line indicates the radius of the membrane vesicle at the beginning of the MD simulation (see Fig. S6c). (C) Flat-to-convex curvature in the vicinity of the bc1 complexes observed in the all-atom (AA) and coarse-grained (CG) MD simulations; phosphate head-groups of POPE, POPG, POPC are labeled as red, green and blue beads respectively. (D) 2D-Mollweide projection map of the chromatophore vesicle annotated with the locations of all four membrane protein types. (E) (upper panels) Mollweide maps of the chromatophore membrane illustrating the radial distances of its atoms to the vesicle’s center of mass at 0, 250 and 500 ns of the AA MD simulation. The distance is the highest for the ATP synthase motors that protrude the most, the smallest for the bc1-rich areas, and almost uniform across the rest of the chromatophore membrane. (lower panels) Local radius of curvature obtained at every point on the chromatophore membrane derived with a 2-D curve fitting protocol (Supplementary Method 7: Eqs. 1–2) at 0, 250 and 500 ns of AA MD. The radius of curvature is uniform across the chromatophore membrane, except for the bc1-rich patches where the membrane is considerably flatter, and the radius exceeds 500 Å.
Differences in membrane curvature near the LH1, LH2 and bc1 complexes (Fig. 2D–E) are a manifestation of the uneven hydrogen bonds that they form with the lipid head groups at the cytoplasmic and periplasmic sides of the chromatophore bilayer (Supplementary Notes 2 and 3, and Figs. S8–S19). The RC-LH1 dimers and the hexagonally-packed LH2 complexes form three to four-fold more hydrogen bonds on the cytoplasmic side of the chromatophore than on the periplasmic side, thus introducing curvature in the membrane (Olsen et al., 2008). In contrast, the hydrogen-bond mismatch is minimal for the bc1 complexes, eliciting a flatter topography in its vicinity. This protein-induced reshaping of the chromatophore membrane (Fig. 2E) supports the hypothesis of a segregation of bc1 from LH1 and LH2 complexes, derived from AFM experiments (Kumar et al., 2017). We find that the proteins endowed with strong curvature dependence, such as the dimeric RC-LH1-PufX and LH2 of Rba. sphaeroides (Olsen et al., 2008), are packed together into a spherical arrangement (Chandler et al., 2008), whereas the ones agnostic to curvature, namely bc1, are sequestered within isolated membrane domains that become locally flat. Thus, deviation of the membrane from an ideal sphere (Noble et al., 2018) allows co-localization of groups of proteins into neighborhoods with distinct curvature-dependent functions.
To decrypt the effect of membrane disorder and local membrane curvature on the major membrane protein complex, LH2, large-scale QM/MM simulations were performed at the ZINDO/S-CIS level of theory for the atomic models extracted from the all-atom MD simulations. These simulations showed that the light-absorbing rings of LH2 B800 bacteriochlorophylls deviate from their crystallographic orientations by tilt angles ranging between 0 to 30° about the transition-dipole axis (Fig. 3A–B). Such a reorientation of the B800 rings has been implicated in the enhancement of the energy transfer rate between the B800 and B850 rings (Ogren et al., 2018). The QM/MM computations indicate a selective broadening of the B800 absorption band, relative to B850 (Figs. 3C, S20–22), as well as a wider distribution of the ring-averaged excitation energies. The 10-meV width of the excitation energy distribution (Fig. S23) is similar to those previously extracted from pump-probe experiments, namely 7.4 and 9.4 meV (Stross et al, 2016). Our simulation identifies two factors that influence reorientation and spectral broadening of B800. First, curvature-specific rearrangement of the N-terminal domains of LH2 at the protein-lipid interface reorients the B800 pigments (Fig. 3D). Second, the lipid tails in the local environment of B800 are 1.25 to 2-fold more disordered than those in a flat membrane (Fig. S24 (Yesylevskyy et al., 2017), which allows fluctuation in the orientation of B800 pigments and consequent broadening of inter-pigment couplings. In contrast, the B850 rings are minimally exposed to the lipid tails and little line-broadening is observed. Altogether, the selective reorientation of pigments and broadening of their absorption spectrum accentuate the role of the lipid environment in modulating light absorption characteristics of the chromatophore.
Fig. 3: Thermal disorder in the chromatophore membrane modifies inter-pigment excitation transfer.
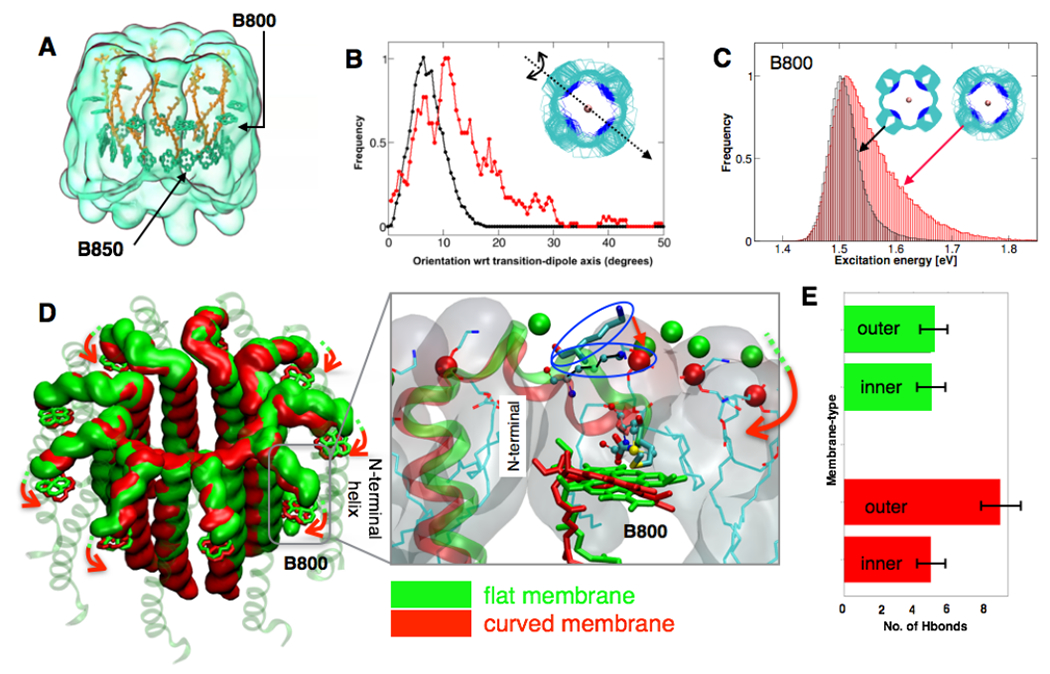
(A) The structure of LH2 pigments indicating the arrangement of B800 and B850 bacteriochlorophyll molecules. Each LH2 complex is composed of a ring of nine B800 molecules oriented perpendicularly to nine B850α and nine B850β molecules. (B) Orientation of the B800 pigments relative to their crystallographic geometry (PDB ID: 1NKZ) about the transition-dipole, NB-ND axis (inset) (Ogren et al., 2018) for LH2 in flat membrane (black) vs. in the chromatophore (red). A statistical shift is observed in the chromatophore towards B800 orientation angles of 11° relative to the crystallographic geometry. (C) Distributions of excitation energies in bacteriochlorophyll B800 for the simulation of a single ring in a flat membrane (black) and for all rings in the chromatophore (red), indicating line-broadening. (C-inset) Scatter diagram of the B800 molecules depicting a broader range of orientations in the chromatophore than in the flat-membrane (also shown in Fig. S22). (D) Large-scale conformational transition observed when LH2 is simulated in a flat (green) vs. a curved (red) membrane due to reorientation of the C-termini helices. (inset) A close-up view of the N-terminal helix showing arginine residues (represented in CPK and outlined in blue) engage in the formation of additional hydrogen bonds with the phosphate head-groups (indicated in red) to induce curvature. Accommodation of these interactions ensues in a reorganization of the N-termini which directly coordinates with the Mg2+ ion of B800, reorienting the porphyrin ring. Minimal reorganization is observed on a flat membrane (indicated in green). (E) Distribution of hydrogen bonds between the LH2 with phosphate-head groups showing a mismatch on the curved membrane, which induces the conformational changes depicted in (D).
The quinone pool employs two distinct modes of diffusion for mediating membrane-wide charge transfer
Charge-carrier quinone molecules offer conduits of energy transfer between the integral-membrane complexes of the chromatophore by shuttling electrons from RC-LH1 to bc1 (Fig. 1A). The diffusion and binding dynamics of the quinone is, therefore, expected to invoke barriers on which the energy-conversion efficiency of the entire network hinges (Sener et al, 2016). These charge-transfer processes were simulated with all-atom detail to probe the rate-determining step of energy conversion from sunlight intake to ATP output.
Simulated diffusion of 900 quinone molecules in the chromatophore brings to light the two distinct types of motion the quinones perform within a membrane, namely swimming and diving, Fig. 4A. Potential of mean force (PMF) calculations (Supplementary Method 6 and Fig. S24) indicate that the dione head groups of the swimming quinones are located within the plane of the lipid head groups, whereas those of the diving quinones are found near the membrane midplane (Fig. 4B). The calculated diffusion coefficient of the swimming quinones, 7.7×10⁻⁸ cm2/sec, is comparable to that of bulk lipids. In contrast, the diving quinones diffuse at least three-times faster than the swimming ones, 2.1×10⁻⁷ cm2/sec (Fig. S25). While both numbers are well within the range 10−6-10−8 cm2/sec of measured quinone diffusivities from a variety of experiments, such as fluorescence quenching (Bernardo et al., 1998), our computations clearly distinguish between the two distinct diffusion mechanisms that collectively contribute to this apparently wide range of experimental values. Employing the PMF of Fig. 4B and integrating the two modes of quinone dynamics into a spatially dependent diffusion map (see Methods: BD simulations and Supplementary Method 9), BD simulations were performed to measure the rate of diffusive quinone transport within the chromatophore. These computations yielded a mean first passage time of 101 μs for the quinone movement between the RC-LH1 and the bc1-complex (Fig. S26).
Fig. 4: Dynamics of quinone molecules reveals a two-state model for membrane-mediated charge transport.
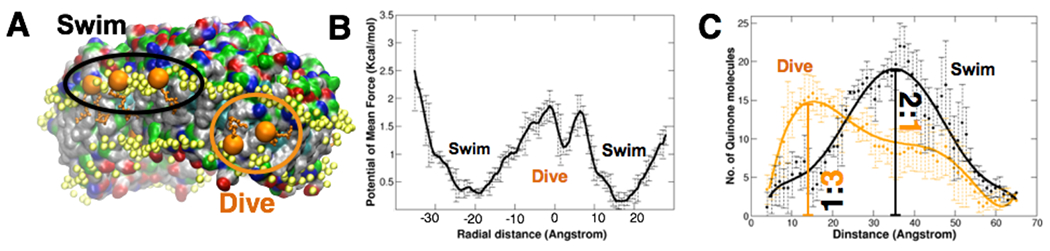
(A) Snapshot in the vicinity of an LH1 protein illustrating the two modes of charge-carrier quinone arrangement within the chromatophore membrane. Denoted “swimming” and “diving” respectively, the former involves diffusion with the quinone head-group (orange beads) in the same plane as those of the lipids (yellow beads), while the latter features passage of the head-group through the intra-membrane space lined by lipid tails. (B) Potential of mean force (PMF) of a quinone molecule as a function of its placement within the vesicle membrane. The radial distance coordinate was defined along a line passing through the center of the chromatophore and the local midplane of the membrane; the membrane midpoint is located at 0 Å. The two most stable regions (at +/−20 Å) correspond to swimming quinones on the inner and outer leaflets of the chromatophore membrane, while inter-membrane location also provide a transient stability to the quinones in the diving state. (C) Number of quinones as a function of distance from the surface of the RC-LH1 protein. The swimming quinones are more abundant at larger distances from the protein, whereas diving quinones are found predominantly near the protein surface. Smooth solid lines represent 6th-order polynomial fits to the average quinone count per 1 Å distance bin (black or orange circles).
Remarkably, the ratio of swimming-to-diving quinones depends on the local protein content of the chromatophore membrane. Presented in Fig. 4C, the swimming-to-diving quinone ratio is approximately 2:1 in lipid-rich environments, away from the protein complexes. This ratio switches to 1:3 in the vicinity of the proteins with a majority of quinones diving to the membrane mid-plane. Employing the Szabo-Schulten-Schulten equation (Szabo et al., 1980), we determined the interconversion time from swimming to diving to approximately 220 ns (Supplementary Method 10). The two modes of quinone dynamics entail the following model of membrane-mediated charge transport in the chromatophore: (i) quinones primarily swim in bulk membranes with head groups parallel to the lipid head groups. In the chromatophore, this diffusive motion spans the sub-millisecond timescale. (ii) Close to the protein complexes they sense the electric field created by the binding pockets (Fig. S25) and move towards the middle of the membrane within a few hundreds of nanoseconds. Since most of the quinone binding pockets are buried within the membrane, diving provides an energetically feasible pathway for the quinone to access these pockets with minimal reorganization of the proteins. A swimming quinone would require more substantial protein reorganization to elicit binding, slowing down electron transport. (iii) Finally, the diving-quinone diffuses into the binding pocket.
A typical quinone turnover process includes its unbinding from the bc1 complex, migration to the RC-LH1, encounter with the external face of this complex, finding the single pore adjacent to PufX (Qian et al., 2013), moving through the “breathing” pore past up to ten already trapped quinones in the space between RC and the inner face of LH1, then finally the docking into the RC quinone binding site. A simple model excluding the impact of cooperative inter-quinone interactions indicates that the binding time for quinone to the RC-LH1 is about 8 ms (Aird et al., 2007); accounting for the cooperative interactions offsets the binding kinetic by ca. 1 ms (Comayras et al., 2005b). In contrast, the association rate of the quinol to bc1 is an order of magnitude faster than that of quinone to RC (Bazil et al., 2013). With the RC to bc1 diffusion time of 101 μs determined here, we infer that the rate-determining step is not the nm-scale diffusion of the quinone in the bilayer, even while traversing the densely packed LH2 environment (Cartron et al 2014), but rather its Å-scale binding to RC-LH1, and the associated conformational changes in the QB quinone-binding pocket.
The result is consistent with findings from fluorescence spectrometry and redox titrations that when one-third of the RCs were inhibited, the extent of the quinone pool was decreased by about 10%, implying RC-quinone interaction and not quinone diffusion as a rate-determining process (Comayras et al., 2005a). Furthermore, at low temperatures (−20 °C) when their mobility is reduced, multiple turnovers of the quinones still occur, determined by the rate of the reaction at the RC (200 ms, an order of magnitude slower than observed at room temperature) (Comayras et al., 2005b). Since quinones are ubiquitous to multiple bioenergetic networks, the turnover dynamics simulated here is expected to have important functional consequences. For instance, in the inner mitochondrial membrane, quinol molecules are continuously oxidized close to the so-called P-side of the membrane, whereas quinones are reduced on the N-side, complemented with the release and uptake of protons, respectively (Wikström et al., 2015). A quinone population formed upon oxidation on the P-side, such as by the activity of mitochondrial bc1, would undergo a flip to reach the N-side and be reduced by complex I. Such a scenario would require that quinones flip rapidly in the inner mitochondrial membrane, which is critical for optimal turnover of the entire electron transport chain.
Robust electrostatic environment within chromatophore’s solvated interior sustains unidirectional cyt. c2 dynamics
The interior of the chromatophore, the so-called periplasm, sequesters cyt. c2 molecules, which shuttle electrons from the bc1 back to RC-LH1. This step closes the electron chain that began with the aforementioned transport of electrons and protons from RC-LH1 to bc1 via the quinones (Fig. 1A). Recognition, binding and unbinding of cyt. c2 to the integral-membrane complexes are driven by the charge state of the chromatophore vesicle (Singharoy et al., 2016). We characterized this charge state by using the Adaptive Poisson Boltzmann Solver, APBS (Baker et al., 2001). Between pH values of 6 and 7, and periplasmic salt concentrations of 0.15 to 0.95 M, the effective charge of the chromatophore model is found to be conserved (Fig. 5A). This conserved charge-state allows cyt. c2 turnover to be functionally robust across multiple environmental conditions.
Fig. 5: Phase diagram of chromatophore activity showcases design principles for efficient organelle-scale single-electron transport.
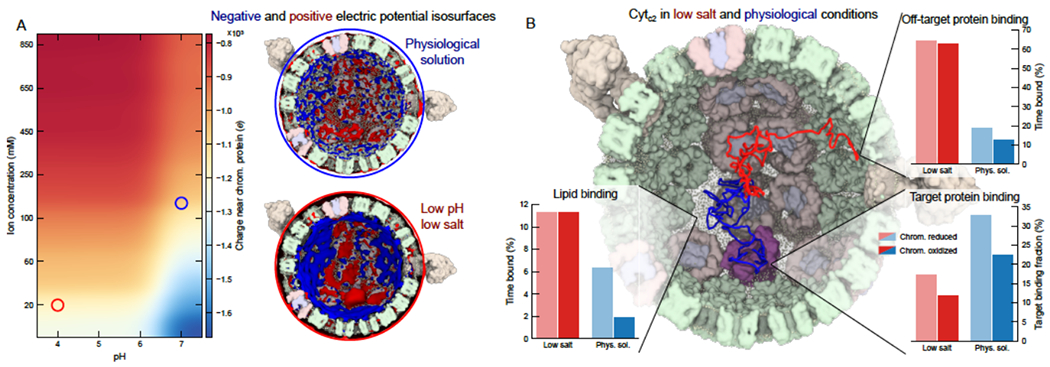
(A) Dependence of chromatophore electrostatics on pH and ion concentration. The heatmap at left shows the average charge of the chromatophore, including solvent and fixed contributions, within 1 nm of the membrane surface. The charge was calculated using APBS. The images of the chromatophore at right depict 0.1 (blue) and −0.1 (red) kT electrostatic isosurfaces for low salinity (pH 4, 0.02 M; bottom, red circle) and physiological conditions (pH 7, 0.15 mM; top, red circle). (B) Effect of solution conditions on cyt. c2 targeting efficiency from BD simulations. The central image depicts two independent representative traces of cyt. c2 moving through reduced chromatophores in low salinity (red trace) and physiological conditions (blue trace). Electrostatic potentials representing the chromatophores were obtained from APBS. For each condition, 500 simulations of a single cyt. c2 were performed, each simulation lasting 10 μs. The cyt. c2 molecules were all initially in the center of the chromatophore. The trajectories provided the time the cyt. c2 spent within 1 nm of off-target proteins, lipids and target proteins, as depicted in the bar charts at left. Although surface binding is enhanced overall, the targeting efficiency, or the ratio of the likelihood of being in contact with a target-protein compared to an off-target protein, is considerably lowered under low salinity conditions, as shown in the bar chart on the right.
The influence of the charge state of the chromatophore lumen on cyt. c2 dynamics was further investigated using BD simulations. The aim was to determine how the mechanism of cyt. c2 binding is attuned to maintaining a preferred direction of electron transport within reduced and oxidized chromatophores. In the reduced chromatophore, the heme-groups in the bc1 complexes were modeled as reduced, RC was kept neutral, and cyt. c2 was oxidized. In the oxidized chromatophore, the electronic charge is removed from the bc1 and placed onto the cyt. c2 heme, and the RC was also set to oxidized. The average electrostatic maps derived at pH 7 and 0.15-0.25 M salinity were employed as the driving potentials in BD.
The association times of cyt. c2 to the bc1 and the RC-LH1 complex measured to be, respectively, 13 and 70 ns in BD simulations at 0.15 M salinity (Figs. S27–S28). Additionally, the times for reversible cyt. c2 binding (combining its association and dissociation times) of bc1 and RC were found to be 1 and 0.2 ms, respectively, using umbrella sampling simulations (Fig. S30). Under reducing conditions, the association between the reduced bc1 complex and the oxidized cyt. c2 is favored (Figs. 5B and S29). In contrast, the affinity of reduced cyt. c2 for the RC-LH1 complex increases within the oxidized chromatophore. As a consequence, the cyt. c2 in a reduced chromatophore can recognize the bc1 surface, dock onto it, and accept an electron from it. Release of the electrons from the bc1 to cyt. c2 resets the local chromatophore environment to an oxidizing one, within which the electron-rich cyt. c2 now targets the acceptor RC-LH1 complexes, facilitating a directional bc1 to RC-LH1 electron transport. The reverse electron-transport pathway (unbinding of the reduced cyt. c2 from RC and rebinding to bc1) is rendered unfavorable by redox-induced changes in the protein-protein interfacial interactions (Fig. S30): the cyt. c2-RC interactions in a reduced chromatophore are weaker than those under oxidizing conditions (Vasilev et al., 2013), and conversely, the cyt. c2-bc1 interactions within a reduced chromatophore are stronger than those under oxidizing conditions. As a result, the electron will remain with bc1 under reducing conditions and movement to RC is avoided. Electron-bifurcation within the bc1 complex creates a proton gradient, bolstering the thermodynamic feasibility of energy conversion only in the forward direction of ATP synthesis. Under oxidizing conditions, the electron will hop onto cyt. c2 and move towards any of the available RC-LH1 complexes, closing the electron chain (Authenrieth et al., 2004).
Environmental stress switches the rate-determining step for ATP generation
The electrostatic landscape presented in Fig. 5A depicts a number of distinct biological scenarios. The physiological conditions for chromatophore function are at pH 7 and 0.15 M salinity. A low pH corresponds to an over-acidification of the membrane – a condition that can arise due to high illumination when proton turnover by bc1 exceeds its consumption by ATP synthase (Fig. S1 (Geyer et al., 2010)). Low salinity of the medium, on the other hand, is generally ascribed to aging and apoptosis artifacts in bioenergetic networks (Yu and Choi, 2000). Since the dynamics of quinone is independent of the charge state of the chromatophore (Madeo and Gunner, 2005), BD simulations of cyt. c2 were repeated for 10 ms at pH 4 and 0.02 M salinity to investigate the mechanisms of electron transport under stress.
Higher levels of non-specific cyt. c2 binding were observed under low-pH and low-salinity conditions, compared to physiological conditions – an observation that was expected because the effective charge of the chromatophore is highest in the former case (Figs. 5A). Surprisingly, a significant number of trajectories indicate that cyt. c2 binds to the anionic POPG lipids of the chromatophore membrane instead of the target proteins. Thus, cyt. c2 binding to the bc1 and the RC-LH1 complex is only marginally enhanced under low-pH and low-salt conditions, resulting in an overall decrease in the recognition/targeting-efficiency of cyt. c2 (ratio of the likelihood of cyt. c2 being in contact with a bc1 or RC compared to it being in contact with the rest of the chromatophore (Figs. 5B)). Under physiological conditions, however, charges from the lipids are effectively screened out and the targeting efficiency of cyt. c2 vastly improves, allowing efficient bc1 RC-LH1 charge transport to sustain a healthy rate of ATP synthesis downstream. In line with EPR measurements (Sarewicz et. al., 2008), the cyt. c2-bc1 and cyt. c2-RC association times increase respectively to 27 and 25 μs at 0.02 M salinity relative to 13 and 70 ns at 0.15 M. Similarly, the cyt. c2 turnover, or reversible binding time, increases from 1 ms to 71 ms (Figs. S30–S31). Since the binding time of quinone is 8 ms (Aird et al., 2007), slower than that of cyt. c2 under physiological conditions (Gerencér et al., 1999), quinone turnover at RC-LH1 is clearly the rate-limiting charge-transfer step in native chromatophores. However, at 0.02 M salinity, the barrier against cyt. c2 unbinding is significantly higher (Fig. S30). Thus, under salt-stress the rate-determining event switches from quinone- to cyt. c2 turnover.
The slower timescale for cyt. c2 turnover at low salt-strengths enhances the statistical probability of electron leakage in this bioenergetics network. For example, potential entrapment of the cyt. c-based electron carriers by anionic lipids now increases (Fig. 5), promoting the feasibility of free-radicals in the cell membrane (Yu and Choi, 2000). A fraction of the electron flux is diverted from the photosynthetic energy-conversion cycle into the formation of reactive free-radical species. Such dissipation of the electron transport manifests itself in a concomitant loss of the proton gradient across the bc1 complex. A reduction in the overall yield as well as in the rate of the synthesized ATP ensues. This finding bears a remarkable similarity with mitochondrial bioenergetics. Low-salinity enhances anionic lipid-binding of cyt. c, and prevents their release from the inner-mitochondrial membrane, triggering apoptosis or aging of the ATP-starved cells (Yu and Choi, 2000; Green, 2005). Analogous to the dynamics of cyt. c2 in the chromatophore, cyt. c in native salt conditions is released by the mitochondrial membrane and normal operation of the network resumes.
Architecture of the chromatophore supports low light-adaptation phenotypes
The emergence of phenotypic properties from all-atom dynamics was captured by employing a rate-kinetic model of energy turnover. The ATP production rate, kATP, of a chromatophore is found to be
where I is the intensity of incident sunlight, q is the quantum yield, nRC is the number of RC-LH1 complexes, and τ is the time of electron transport between RC-LH1 and bc1 (further details are provided in Supplementary Note 5 and (Sener et al., 2016)). Under physiological conditions, τ represents the quinone cycling time at the RC-LH1. However, at pH 4 and 0.02 M salinity i.e. under conditions of salt stress, the rate-determining step for electron transport switches, and τ is now determined by the kinetics of cyt. c2 turnover at bc1. Our all-atom model of the chromatophore together with MD and BD simulations offer direct measurements of these turnover times, reported already in the previous sections. Embellishing a model that predicts cell-scale properties starting from a full-atomistic picture, the kinetic relationship is exploited hereafter to study ATP turnover of the chromatophore as a function of light intensity and vesicle composition.
Light-induced phenotypes of purple phototrophic bacteria are broadly classified into low- and high-light adaptations (Adams and Hunter, 2012; Hitchcock et al., 2017). As the intensity of incident light increases, the number of the RC-LH1, bc1 and LH2 changes, and the count of vesicles per cell decreases to maintain a steady rate of ATP generation by the chromatophore, and subsequently the growth and doubling times of the bacteria. When τ is limited by the quinone-turnover time of 8 ms (Aird et al., 2007) and nRC = 24 (according to our structural model of the chromatophore), the kATP starts saturating at 112 sec−1 for light intensities equal to 1% of full sunlight (Fig. 6A–D). At higher light intensities, this rate slowly increases to 160 sec−1. Therefore, our model manifests a low-light adaptation of the chromatophore, which saturates ATP generation under high-light conditions. Since typical illumination levels in the aquatic habitat of purple bacteria can be very low, i.e., about 1-3% of full sunlight, we find that their photosynthetic machinery is perfectly attuned to work for phenotypes growing under low-light conditions. The computed low-light ATP production rate agrees well with the value of 130 sec−1 determined by flash-photolysis experiments (Clark et al., 1983). Inability of the bc1 and RC-LH1 complexes to jointly turnover more than τ−1 quinones per second (125 quinones, when τ = 8ms) results in the saturation of the ATP yield. Consequently, in a hypothetical chromatophore with three times as many bc1 complexes, nearly equal to the number of RC-LH1, quinone-turnover becomes less rate-limiting and the ATP yield improves to 245 sec−1(Fig. S34). However, with such high bc1 content, an apparently two-fold more efficient chromatophore will overflow the vesicle with protons at sustained light intensity, reducing the pH, and, thus, harming the integrity of the chromatophore membrane and its proteins (Geyer at al., 2010). Put together, the low-light phenotype is suboptimal for ATP yield, due to the 1:3 stoichiometry between the bc1 to RC-LH1 complexes. This loss in energy is compensated, nonetheless, by the establishment of a robust electrostatic environment across a range of pH values (6-7) and salt conditions (0.15-0.95 M), as observed in our model (Fig. 5A). Our spectroscopic experiment confirms that the LH2:LH1 and bc1:LH1 ratios remain unchanged in fully functional chromatophores within the salinity range of 0.08 to 0.35 M (Fig. 6E–F). Thus, both computations and experiments establish that the low-light adaptation of the chromatophore remains robust across a wide range of electrostatic environments.
Fig. 6: Kinetic model of ATP turnover predicts light-absorption phenotype of purple bacteria.
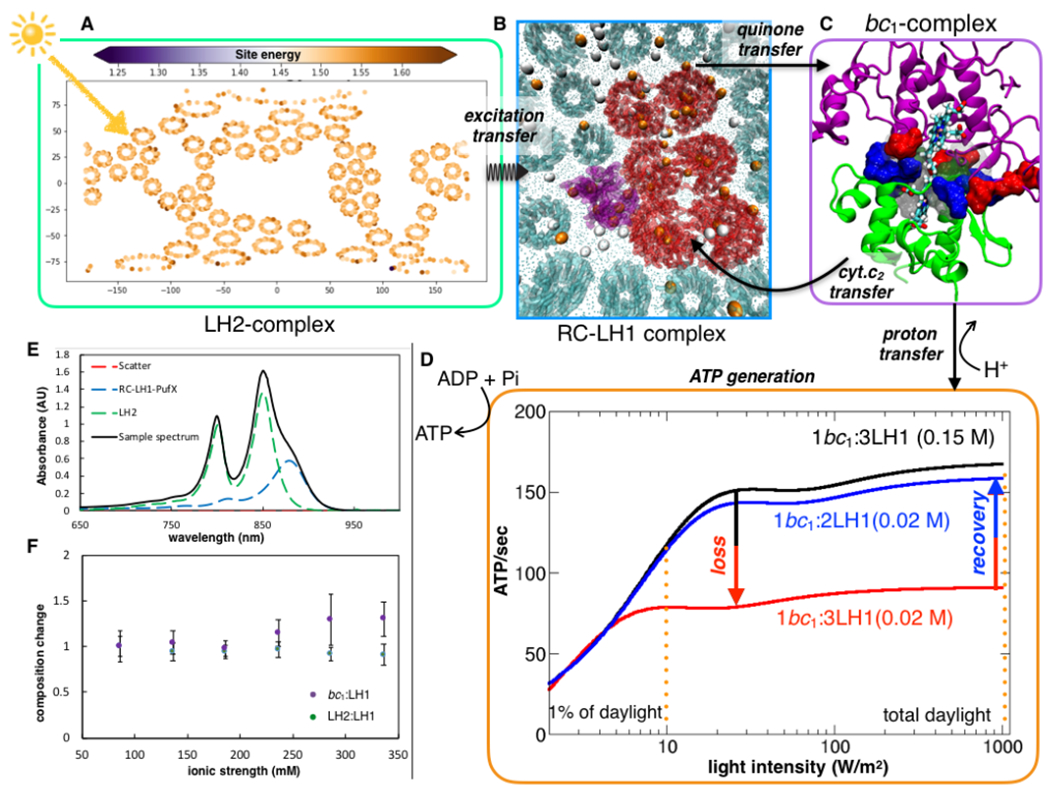
(A) Influence of environment on average excitation energies of the Bacteriochlorophyll-B 800 pigments. The variation in the average excitation energies of B800 among the different LH2 rings due to the thermal disorder captured by the MD simulation mapped spatially using a 2D-Mollweide projection. (B) Following excitation transfer, charge-separation at RC-LH1 releases electrons, which charge-carrier quinone molecules transfer to the bc1 complex. Membrane-wide view of swimming (white) and diving (orange) quinone molecules illustrate that the former is more probable away from the protein-lipid interface, while the latter is significant close to the protein networks. The diving quinones stabilized by the positive electrostatic potential in the vicinity of the proteins (Fig. S25). (C) Closing the electron-chain, a second carrier, cyt. c2, binds to the bc1, abstracts an electron, and diffuses back to RC-LH1. (D) Oxidation of the reduced quinone by bc1 is accompanied by an accumulation of the proton motive force, driving ATP synthesis. ATP production rate is presented as a function of incident sunlight intensity, showing saturation under low-light conditions. At low salt strengths, enhancement of cyt. c2 turnover times, reduces ATP production rate by 2-fold. The model indicates an increment in ATP production when the bc1: LH1 composition changes from 1:3 to 1:2. (E) Spectroscopic results indicate the change in LH2:LH1 and bc1:LH1 ratio with respect to that at the physiological 0.15 M salt concentration is minimal for salinity range between 0.10 and 0.35 M (F), indicating a robust architecture for energy conversion across these conditions. At 0.15 M the LH2:LH1 is 1:2.6 and bc1:LH1 is 1:3.
The computational model is tested under conditions of salt stress. Aside from the apoptotic stresses discussed above, low salinity is an environment relevant to the chromatophore also under native conditions (Lavergne et al., 2009). At low-salt conditions (0.02 M), when the cyt. c2-mediated electron transfer time, τ, is equal to 71 ms, the kinetic model predicts an ATP yield of 66 sec−1 (Fig. 6D), i.e., about one-third of that under a salt strength of 0.15 M. Nevertheless, when the bc1 to RC-LH1 ratio increases in the model from 1:3 to 1:2 the physiological ATP activity is revived even at low salt strengths. Achieving more bc1 per RC-LH1 necessitates denser protein packing within the same vesicle volume. This dense arrangement in a hypothetical bc1-rich membrane compensates for the loss in the rate of electron transport by enhancing the probability of productive cyt. c2–bc1 recognition and resurrects a steady ATP yield.
The bc1-rich model offers clues on the functioning of analogous bioenergetic membranes. A dense packing of proteins in the mitochondrion induces the formation of supercomplexes referred to as the respirasome (Letts et al., 2016). Remarkably similar to our model for the bc1-rich chromatophore, respirasome formation avoids apoptotic low-salt stress towards ATP generation by improving the targetable characteristics of cyt. c. At 0.15 M salt and beyond, where most experiments are performed, including those reported herein, our model demonstrates that dielectric screening is sufficient to ensure targetability of cyt. c2, thus, avoiding the need for any RC-bc1 supercomplex. These conditions have been studied extensively in spectroscopic experiments, which show that (i) the relative bc1 to RC-LH1 and LH2 to RC-LH1 ratios remain unchanged beyond 0.15 M, and up to 0.35 M (Fig. 6F), and (ii) the absence of supercomplex formation. Still, our model does not discount the possibility that tighter bc1-RC-LH1 complexes could form and predicts the correct conditions for tracking them in future experiments.
Discussion
We have developed a comprehensive organelle-scale model, which describes the interwoven energy-conversion processes in purple bacterial photosynthesis and accounts for the cooperation between the constituent proteins in terms of molecular interactions. The entire network of physicochemical events is cast as three mutually coupled reactions: light-harvesting, diffusive charge transport, and protein conformational transitions. The rate-determining reactions are identified and simulated in all-atom detail to elucidate how coupling between multiple components of the network tunes the kinetic barrier of the rate-determining steps. We find that the curvature of the chromatophore membrane segregates groups of proteins with distinct functions into separate domains, and thermal disorder of the lipids tune the efficiency of excitation transfer. The protein conformations support the creation of an electrostatic environment, which enables robust recognition and binding kinetics of quinones and cyt. c2 charge carriers to their targets and a directional electron flow. At larger spatiotemporal scales, the diffusion and binding rates are integrated into a kinetic model, which reports on the emergence of a phenotype (Hitchcock et al., 2017). We find that the protein composition and density within the chromatophore are optimized to ensure adaptability of the low-light phenotypes across a diverse range of environmental conditions, even at the cost of suboptimal ATP yield. The mechanism responsible for avoiding energy dissipation is broadly applicable to the mitochondrial electron chain.
A common prerequisite for predicting the phenotypes from atoms is the availability of structural data. No mathematical heuristic is imposed on the coupling between the physicochemical events, as causality between processes at different spatiotemporal scales is explicit during the atom-resolved MD and BD simulations. Such atoms-to-phenotype models enable discovery of biological design principles, the underlying physics of which can extend beyond the system of interest, and predictions of testable phenotypic properties across a broad range of environmental conditions. Indeed, the computational prediction of the chromatophore’s robust action was spectroscopically tested across a range of environmental concentrations. Corroborating the model, our experiments establish the existence of low-light absorbing phenotypes even under salt-stressed conditions. The model further brings to the fore new energy-conversion pathways with non-native protein composition.
Methods and Materials
MD simulations.
As summarized in Fig. S2, the modeling began with a protein-only structure of the chromatophore vesicle derived from AFM, electron microscopy and mass spectrometric data (Cartron et al., 2014), and MD-equilibrated structures of individual POPC-embedded LH1-RC, LH2 (Chandler at al., 2008), bc1 (Singharoy et al., 2016) and ATP synthase models (Singharoy et al., 2017). Each protein within the chromatophore scaffold was overlaid with its membrane-embedded counterpart. Then the original protein inside the chromatophore was replaced by the equilibrated model with one ring of lipid around it. To uniformly construct a lipid bilayer on protein-excluded areas of the chromatophore surface, these ring-encased proteins were overlaid with a POPC-only lipid vesicle of radius 30 nm; a 2 Å exclusion radius, employed for the lipid placement around protein-lipid rings, suffices to avoid unfavorable steric interactions between the proteins and the lipids. Use of protein-lipid ring for membrane embedding instead of a protein-only embedding avoided completely the formation of ring-piercing artifacts. Some unfavorable overlap remained due to the inter-twining of the lipid tails. Direct minimization was unable to remove this artifact. The inter-carbon distances in the lipid tail were shrunk till the intertwining was removed (tcl script is provided with the SI). Thereafter, brute-force energy minimization within NAMD resurrected the length of the lipid tails, but now avoiding the unphysical twining effect.
The resulting vesicle was immersed in a water droplet, wherein the lipid molecules could relax under spherical boundary conditions for a period of 2 ns (0.5 ns with the lipid-head and the proteins constrained to initial position, and the remaining 1.5 ns with just the protein constrained). The partially equilibrated lipids were then heterogenized by randomly mutating the PC-head groups to PG and PE (Chandler et al., 2014) under compositional restraints of 22 % POPC, 22 % POPG and 56 % POPE on the outer (cytoplasmic) side and 24 % POPC, 10 % POPG and 66 % POPE on the inner (periplasmic) side, consistent with lipid measurements in photosynthetic bacterial membranes. In addition, 900 charge-carrier quinone molecules were randomly introduced in the membrane, 600 of uniformly distributed and the other 300 were co-located in the vicinity of the quinone-binding bc1 and LH1 complexes. Finally, the lipid and quinone-corrected chromatophore model was placed inside a water cube of dimensions 110 nm. All overlapping water molecules within 1.4 Å of the chromatophore vesicle were removed, and the solvated system was ionized to neutrality, constituting a simulation system of size 136 M atoms. An octagonal box is presented here for visualization of the system, as rendering of the complete system is not yet feasible due to hardware limitations.
Initial MD simulation of the 136 M-atom system developed instabilities within the first ns (Fig. S3). These instabilities, manifested as protein and/or lipid-excluded holes on the chromatophore surface, result from a combination of (i) inaccurate number of lipid molecules and (ii) water molecules on either side of the initial chromatophore membrane. Described in Supplementary Method 1, 15 ns and 25 ns of separate constrained MD simulations were performed on NCSA’s BlueWaters supercomputer to recover the correct lipid and water density. These simulations leveraged the LipidWrapper (Durrant and Amaro, 2014) and gridforces capabilities of NAMD (Wells et al., 2007). A 500-ns MD simulation ensued on OLCF’s Titan under NPT conditions. Details of the production run, including all simulation parameters are provided in the Supplementary Method 1 section of SI. A total of 4096 to 8192 nodes were employed at a time to run the simulations (Fig. S7).
QM/MM simulations.
Based on the equilibrated MD trajectory, QM/MM calculations were employed to obtain an estimate of the static disorder and lipid curvature on the light-absorption characteristics of the chromatophore. 200 snapshots from a trajectory being 50 ps apart were analyzed. The gap between the ground and the Qy excited state was determined for all 1701 BChls within LH2 rings for each of these snapshots. For this purpose, we employed the ZINDO/S-CIS approach (Zerner’s Intermediate Neglect of Differential Overlap with parameters for spectroscopic properties combined with the configuration interaction formalism at the single configuration level), where the asymmetric environment of the bacteriochlorophylls was simulated by MM point charges of nearby residues to determine the vertical excitation energies of the individual pigments (Olbrich et al, 2010). Further details are provided in Supplementary Method 2.
MARTINI simulations.
In the CG simulation, the cytochrome bc1 complex was embedded in a membrane model representative of the chromatophore composition. The structure of the bc1 complex was retrieved from the Protein Data Bank (PDB), PDB ID 2QJY. Cofactors such as the hemes and iron-sulfur molecules found in the bc1 crystal structure were not included in the CG simulation. The composition of the chromatophore membrane consists of an asymmetric distribution of lipids in the cytoplasmic side (upper leaflet: 22 % POPG, 22% POPC, 56 % POPE) and periplasmic side (lower leaflet: 10% POPG, 24% POPC, 66% POPE), which represents the same lipid composition as found on the full atomistic chromatophore membrane.
CG-MD simulations were carried out under NPT conditions using GROMACS simulation package version 5.1.1 with the Martini v2.2 force field parameters, and standard simulation settings. The CG system is ca. 21 × 21 nm in the membrane plane (x and y) and contains 57,354 particles in total. The system was simulated for 40 μs of production run with position restraints applied to the backbone beads of the proteins using a force constant of 1 kJ mol−1 nm−2. Density map analysis were performed using g_mydensity and averaged over the final 5 µs of the simulation. Additional details are provided in Supplementary Method 3.
Electrostatic calculations.
Frames were selected every 100 ps over the final 250 ns of the MD simulation. There were minimal large-scale structural changes during this part of the trajectory (Fig. 2). APBS (Baker et al., 2001) computations were performed to solve the nonlinear Poisson Boltzmann equation on each of these frames, using a grid size of 5133, providing nearly 1 Å resolution to the electrostatic potential maps. Detailed parameters, including input files are provided with the supporting information. Parallel APBS runs were performed employing the comet supercomputer with the big_pb2.py script, also provided with the supporting information. The 2500 electrostatic potentials were averaged to generate input profiles for the BD simulation. The same procedure was repeated for constructing electrostatic potentials and charge density maps in the range 0 to 0.85 M and pH 4 to 7, to obtain all points shown in Fig 5A. Further details of the APBS input parameters are provided in Supplementary Method 4.
BD simulations.
Brownian dynamics simulations were used to monitor the motions of quinone and cyt. c2 molecules on the time scale of hundreds of microseconds. All BD simulations were performed using an in-house-developed GPU-accelerated Brownian dynamics simulation code, Atom Resolved Brownian Dynamics (ARBD) (Comer and Aksimentiev, 2012).
A 2.8-ms simulation of 5000 independent quinone molecules moving through an idealized representation of the lipid bilayer of the chromatophore permitted the estimation of the lower-bound diffusion-limited timescale of quinone cycling. Each quinone molecule was treated as an isotropic point-like particle with a diffusion coefficient of 7.7 ×10⁻⁸ cm2/s (representative of slow swimming quinone derived from Fig. 4D). Interactions between quinone molecules were neglected and the chromatophore was represented using a rotationally isotropic potential derived using Boltzmann inversion from the radially- and temporally-averaged distribution of the centers of mass of quinone particles observed in all-atom simulation of the chromatophore. The temperature was set to 300 K during the simulation, and integration of the coordinates was performed using a 1 ps timestep. The coordinates of the quinone molecules were written every 10 nanoseconds for subsequent analysis described in Fig. S26.
Rigid body simulations of cyt. c2 were performed under six different conditions, namely (1) pH 4 and 0.02 M salinity, (2) pH 7 and 0.15 M salinity, and (3) pH 7 and 0.25 M salinity, for both the reduced and oxidized chromatophore. For each condition, 500 independent 10-μs trajectories were generated with a single cyt. c2 molecule starting at the center of the chromatophore. The cyt. c2 molecules were modeled as rigid body particles. At each timestep, a torque and force were evaluated based on the configuration of the system, allowing the update of position and orientation for the rigid body using a symplectic integrator. The mass and moments of inertia of cyt. c2 were calculated directly from the atomic coordinates. The program Hydropro was used to estimate the diagonal components of the diffusion tensor from the atomic coordinates by replacing each surface atom with a sphere subject to Stokes drag. The diffusion tensor was then transformed to translational and rotational friction coefficients according to the Stokes–Einstein relation. These provided Langevin forces and torques at each timestep that kept the system at 300 K. Further details on the BD setup is provided in Supplementary Method 5.
Umbrella sampling simulations.
Bias-exchange umbrella sampling (BEUS) simulations were performed along the lowest non-equilibrium work path derived from steered MD (SMD) trajectories of cyt. c2 dissociation from bc1 and RC. Details of these steering simulation have been published separately (Singharoy et al., 2016). The BEUS simulations for both the pathways were performed employing the inter-heme CBC distance as the collective variable. To ensure sufficient window overlap in BEUS simulations, the number of 34 windows employed were employed along the dissociation path. An exchange was attempted every 1 ps between each image and one of its two nearest neighboring images in an alternating fashion. Ten replicas per image were employed for 10-ns long BEUS simulations. A force constant of 5 kcal/mol/ Å2 is employed to restrain geometrically the position of the umbrellas along the inter-heme distance axis. Thereafter our generalized weighted Histogram methodology (Singharoy et al., 2017) was employed to re-weight the ensemble and determine the potential of mean force (PMF) profiles (Fig. S30). Details on the protocol and error analysis is provided in Supplementary Method 6. Introducing the free-energy profiles in the Szabo-Schulten equation yields a bc1 and RC association time of cyt. c2 equal to, respectively, 50 ns and 180 ns at 0.15 M salinity, which is comparable to the timescale extracted from the BD simulations.
Lipid analysis.
Cytbc1 SMALPs and Rba. sphaeroides chromatophores were prepared and analyzed by thin layer chromatography (TLC) and phosphate quantification as previously described (Swainsbury et al, 2018), with the exception that lipid band intensities were plotted as a fraction of the total.
Spectroscopic Measurements.
Wild-type Rba. sphaeroides cells were used to inoculate 1 L M22+ medium (Hunter and Turner, 1988) supplemented with 0, 50, 100, 150 or 200 mM NaCl. Cells were grown under 30 µMol s−1 m−2 illumination from Orsam Classic 116W halogen bulbs for 48 hr at room temperature (21 ˚c). Cells were harvested at 4000 RCF (avg) for 30 min and pellets were resuspended in ~10 mL 20 mM tris pH 8 per gram of wet cell mass with a few crystals of DNAseI and Lysozyme added (Sigma-Aldrich). Cells were broken by passage through a French pressure cell (AmInCo, USA) twice at 20000 PSI and insoluble debris was removed by centrifugation at 18459 RCF (avg) for 15 min. Membranes were prepared by layering clarified cell lysate above 40/15% sucrose step gradients followed by centrifugation at 57031 RCF (avg) for 10 hr at 4 ˚c followed by harvesting of the membrane band from the 40/15% interface.
The LH1, LH2 and cytbc1 content was estimated as described in (Swainsbury et al, 2018). Briefly, membranes were diluted to OD5 at 850 nm in 20 mM tris pH 8 and spectra were collected in a 4 mm path length cuvette. These spectra were deconvoluted by fitting spectra of pure RC-LH1-PufX, LH2 and a scatter curve to estimate the concentrations of RC-LH1 and LH2 in the samples (see Ref 33 for a detailed description). Next, spectra were collected in a 1 cm path length cuvette before and after the addition of a few grains of dithionite generating oxidized and reduced spectra. The cytbc1 content was estimated from reduced-oxidized difference spectra using extinction coefficients ε561–575 of 22 mM−1 cm−1 and ε551-540 of 19 mM−1 cm−1, for b- and c-type heme, respectively.
Supplementary Material
Acknowledgements
AS acknowledges start-up award funds from Arizona State University, grants from Moore Foundation, Lightworks Foundation and Flinn foundation. ET, AA, CM, AS, CC, BI, IT, DC, JES and JP acknowledge NIH grants P41-GM104601 (PI: ET) and NIH R01-GM067887 (PI: ET). CM, TVP, ZLS and AA, acknowledges the Center for Physics of Living Cells (NSF PHY-1430124). MS and ZLS also acknowledges NSF funding through MCB1616790. Work in DPT’s group is supported by the Natural Sciences and Engineering Research Council (Canada) with further support from the Canada Research Chairs Program and Alberta Innovates Technology Futures. DPT and KHDM acknowledge Compute Canada funded by the Canada. UK acknowledges grant KL 1299/12-1 of the of the Deutsche Forschungsgemeinschaft (DFG). Foundation of Innovation and partners for computational resources. DJKS and CNH acknowledges acknowledge research grant BB/M000265/1 from the Biotechnology and Biological Sciences Research Council (UK). CNH was also supported by an Advanced Award 338895 from the European Research Council. The study reported was funded also by the Photosynthetic Antenna Research Center (PARC), an Energy Frontier Research Center supported by the US Department of Energy, Office of Science, and Office of Basic Energy Sciences under Award Number DE-SC0001035 (to CNH and KS). This research used resources of the Oak Ridge Leadership Computing Facility, which is supported by the Office of Science, US Department of Energy (DE-AC05-00OR22725).
References
- Adams PG, and Hunter CN (2012) Adaptation of intracytoplasmic membranes to altered light intensity in Rhodobacter sphaeroides. Biochim. Biophys. Acta 1817, 1616–27. [DOI] [PubMed] [Google Scholar]
- Aird A, Wrachtrup J, Schulten K, and Tietz C (2007). Possible pathway for ubiquinone shuttling in Rhodospirillum rubrum revealed by molecular dynamics simulation. Biophys. J 92, 23–33. [DOI] [PMC free article] [PubMed] [Google Scholar]
- Allen JP (2017). Design of energy-transducing artificial cells. Proc. Natl. Acad. Sci 114, 3790–3791. [DOI] [PMC free article] [PubMed] [Google Scholar]
- Authenrieth F, Tajkhorshid E, Schulten K, and Luthey-Schulten Z Role of water in transient cytochrome c2 docking Journal of Physical Chemistry B, 108, 20376–20387, 2004 [Google Scholar]
- Bahatyrova S, Frese RN, Werf KOVD, Otto C, Hunter CN and Olsen JD (2004). Flexibility and Size Heterogeneity of the LH1 Light Harvesting Complex Revealed by Atomic Force Microscopy. Journal of Biological Chemistry 279, 21327–21333. [DOI] [PubMed] [Google Scholar]
- Baker NA, Sept D, Joseph S, Holst MJ, and McCammon JA (2001). Electrostatics of nanosystems: application to microtubules and the ribosome. Proc. Natl. Acad. Sci 98, 10037–41. [DOI] [PMC free article] [PubMed] [Google Scholar]
- Bazil JN, Vinnakota KC, Wu F, and Beard DA (2013). Analysis of the kinetics and bistability of ubiquinol:cytochrome c oxidoreductase. Biophys. J 105, 343–355. [DOI] [PMC free article] [PubMed] [Google Scholar]
- Bernardo SD, Fato R, Casadio R, Fariselli P, and Lenaz G (1998). A high diffusion coefficient for coenzyme Q10 might be related to a folded structure. FEBS Lett. 426, 1873–3468. [DOI] [PubMed] [Google Scholar]
- Blankenship RE (2014). Molecular mechanisms of photosynthesis. 2nd ed Chichester, West Sussex: John Wiley & Sons, Inc. [Google Scholar]
- Camargo C (2018). Physics makes rules, evolution rolls the dice. Science. 361, 236. [Google Scholar]
- Cartron ML, Olsen JD, Sener M, Jackson PJ, Brindley AA, Qian P, Dinkman MJ, Leggett GJ, Schulten K, and Hunter NC (2014). Integration of energy and electron transfer processes in the photosynthetic membrane of Rhodobacter sphaeroides. Biochem. Biophys. Acta 1837, 1769–80. [DOI] [PMC free article] [PubMed] [Google Scholar]
- Chandler DE, Strümpher J, Sener M, Scheuring S, and Schulten K (2014). Light Harvesting by Lamellar Chromatophores in Rhodospirillum photometricum. Biophys. J 106, 2503–2510. [DOI] [PMC free article] [PubMed] [Google Scholar]
- Chandler DE, Hsin J, Harrison CB, Gumbart J, and Schulten K (2008). Intrinsic Curvature Properties of Photosynthetic Proteins in Chromatophores. Biophys. J 95, 2822–2836. [DOI] [PMC free article] [PubMed] [Google Scholar]
- Cheng Y (2015). Single-particle cryo-EM at crystallographic resolution. Cell. 161, 450–457. [DOI] [PMC free article] [PubMed] [Google Scholar]
- Clark AJ, Cotton NPJ, Jackson JB (1983). The relation between membrane ionic current and ATP synthesis in chromatophores from Rhodopseudomonas capsulata. Biochim. Biophys. Acta 723, 440–453. [Google Scholar]
- Comer J, and Aksimentiev A (2012). Predicting the DNA sequence dependence of nanopore ion current using atomic-resolution Brownian dynamics. J. Phys. Chem. C 116, 3376–3393. [DOI] [PMC free article] [PubMed] [Google Scholar]
- Comayras F, Jungas C and Lavergne J(2005a). Functional Consequences of the Organization of the Photosynthetic Apparatus in Rhodobacter sphaeroides: I. quinone domains and excitation transfer in chromatophores and reaction center antenna complexes. Journal of Biological Chemistry 280, 11203–11213. [DOI] [PubMed] [Google Scholar]
- Comayras F, Jungas C and Lavergne J (2005b). Functional Consequences of the Organization of the Photosynthetic Apparatus in Rhodobacter sphaeroides: II. a study of pufx- membranes. Journal of Biological Chemistry 280, 11214–11223. [DOI] [PubMed] [Google Scholar]
- Crofts AR (2004). The Cytochrome bc1 Complex: Function in the Context of Structure. Annual Review of Physiology 66, 689–733. [DOI] [PubMed] [Google Scholar]
- Durrant J, and Amaro R (2012). LipidWrapper: An Algorithm for Generating Large-Scale Membrane Models of Arbitrary Geometry. PLOS Comp. Biol 10, e1003720. [DOI] [PMC free article] [PubMed] [Google Scholar]
- Ermak DL and Mccammon JA (1978). Brownian dynamics with hydrodynamic interactions. The Journal of Chemical Physics 69, 1352–1360. [Google Scholar]
- Gerencsér L, Laczkó G and Maróti P (1999). Unbinding of Oxidized Cytochromecfrom Photosynthetic Reaction Center ofRhodobacter sphaeroidesIs the Bottleneck of Fast Turnover†. Biochemistry 38, 16866–16875. [DOI] [PubMed] [Google Scholar]
- Geyer T, Mol X, Blass S, and Helms V (2010). Bridging the gap: linking molecular simulations and systemic descriptions of cellular compartments. PLoS One 5, e14070. [DOI] [PMC free article] [PubMed] [Google Scholar]
- Goh BC, Hadden JA, Bernardi RC, Singharoy A, McGreevy R, Rudack T, Cassidy CK, and Schulten K (2016). Computational methodologies for real-space structural refinement of large macromolecular complexes. Annu. Rev. Biophys 45, 253–278. [DOI] [PMC free article] [PubMed] [Google Scholar]
- Green DR (2005) Apoptotic Pathways: Ten Minutes to Dead. Cell. 121 671–674. [DOI] [PubMed] [Google Scholar]
- Hitchcock A, Hunter NC, Sener M (2017). Determination of cell doubling times from the return-on-investment time of photosynthetic vesicles based on atomic detail structural models. J. Phys. Chem. B 121, 3787–3797 [DOI] [PMC free article] [PubMed] [Google Scholar]
- Hunter CN, and Turner G (1988). Transfer of Genes Coding for Apoproteins of Reaction Centre and Light-harvesting LH1 Complexes to Rhodobacter sphaeroides. Microbiol. 134, 1471–1480. [Google Scholar]
- Jackson PJ, Lewis HJ, Tucker JD, Hunter CN and Dickman MJ (2012). Quantitative proteomic analysis of intracytoplasmic membrane development in Rhodobacter sphaeroides. Molecular Microbiology 84, 1062–1078. [DOI] [PubMed] [Google Scholar]
- Jungas C, Ranck JL, Rigaud JL, Joliot P, Vermeglio A (1999). Supramolecular organization of the photosynthetic apparatus of Rhodobacter sphaeroides. EMBO J. 18, 534–542. [DOI] [PMC free article] [PubMed] [Google Scholar]
- Karplus M, and Petsko GA (1990). Molecular dynamics simulations in biology. Nature. 347, 631–639. [DOI] [PubMed] [Google Scholar]
- Karr JR, Sanghvi JC, Macklin DN, Gutschow MV, Jacob JM, Bolival B, Assad-Garcia N, Glass JI, and Covert MW (2012). A Whole-Cell computational model predicts phenotype from penotype. Cell. 150, 389–401. [DOI] [PMC free article] [PubMed] [Google Scholar]
- Korte A, and Farlow A (2013). The advantages and limitations of trait analysis with GWAS: a review. Plant Methods. 9, 29. [DOI] [PMC free article] [PubMed] [Google Scholar]
- Kumar S, Cartron ML, Mullin N, Qian P, Leggett GJ, Hunter CN, and Hobbs JK (2017). Direct Imaging of Protein Organization in an Intact Bacterial Organelle Using High-Resolution Atomic Force Microscopy. ACS Nano 11, 126–133. [DOI] [PMC free article] [PubMed] [Google Scholar]
- Lavergne J, Verméglio A and Joliot P (2009). Functional Coupling Between Reaction Centers and Cytochrome bc1 Complexes In The purple phototrophic bacteria, Dordrecht: Springer. [Google Scholar]
- Letts JA, Fiedorczuk K, and Sazanov LA (2016). The architecture of respiratory supercomplexes. Nature 537, 644–648. [DOI] [PubMed] [Google Scholar]
- Madeo J and Gunner MR (2005). Modeling Binding Kinetics at the QA Site in Bacterial Reaction Centers. Biochemistry. 44, 10994–11004. [DOI] [PMC free article] [PubMed] [Google Scholar]
- Marrink SJ, Risselada HJ, Yefimov S, Tieleman DP and de Vries AH The MARTINI force field: Coarse grained model for biomolecular simulations. (2007). J. Phys. Chem. B 111, 7812–7824. [DOI] [PubMed] [Google Scholar]
- Noble JM, Lubieniecki J, Savitzky BH, Plitzko J, Engelhardt H, Baumeister W and Kourkoutis LF Connectivity of the centermost chromatophores in Rhodobacter sphaeroides bacteria. (2018). Mol. Microbiol 109, 812–825. [DOI] [PubMed] [Google Scholar]
- Ogren J, Tong AL, Gordon SC, Chenu A, Lu Y Blankenship RE, Cao J and Schlsu-Cohen GS (2018). Impact of the lipid bilayer on energy transfer kinetics in the photosynthetic protein LH2. Chem. Sci 9, 3095–3104. [DOI] [PMC free article] [PubMed] [Google Scholar]
- Olbrich C and Kleinekathöfer U (2010). Time-dependent Atomistic View on the Electronic Relaxation in Light-harvesting System II, J. Phys. Chem. B 114, 12427–12437. [DOI] [PubMed] [Google Scholar]
- Olsen JD, Tucker JD Timney JT, Qian P, Vassilev C, and Hunter CN (2008). The Organization of LH2 Complexes in Membranes from Rhodobacter sphaeroides. J. Biol. Chem 283, 30772–30779. [DOI] [PMC free article] [PubMed] [Google Scholar]
- Phillips JC, Braun R, Wang W, Gumbart J, Tajkhorshid E, Villa E, Christophe C, Skeel RD, Kale L and Schulten K (2005). Scalable molecular dynamics with NAMD. J. Comp. Chem 26, 1781–1802. [DOI] [PMC free article] [PubMed] [Google Scholar]
- Qian P, Papiz MZ, Jackson PJ, Brindley AA, Ng IW, Olsen JD, Dickman MJ, Bullough PA and Hunter CN (2013). Three-Dimensional Structure of the Rhodobacter sphaeroides RC-LH1-PufX Complex: Dimerization and Quinone Channels Promoted by PufX. Biochemistry 52, 7575–7585. [DOI] [PubMed] [Google Scholar]
- Qian P, Bullough PA, and Hunter CN (2008). Three-dimensional reconstruction of a membrane-bending complex: The RC-LH1-PufX core dimer of Rhodobacter sphaeroides. J. Biol. Chem 283, 14002–14011. [DOI] [PubMed] [Google Scholar]
- Rust MJ, Bates M, and Zhuang X (2006). Sub-diffraction-limit imaging by stochastic optical reconstruction microscopy (STORM). Nat. Methods 3, 793–796. [DOI] [PMC free article] [PubMed] [Google Scholar]
- Sarewicz M, Borek A, Daldal F, Froncisz W, and Osyczka A (2008) Demonstration of short-lived complexes of cytochrome c with cytochrome bc1 by EPR spectroscopy: Implications for the mechanism of interprotein electron transfer. J. Biol. Chem 283, 24826–36. [DOI] [PMC free article] [PubMed] [Google Scholar]
- Sener M, Strumpfer J, Singharoy A, Schulten K, and Hunter NC (2016). Overall energy conversion efficiency of a photosynthetic vesicle. eLife. 5, e09541. [DOI] [PMC free article] [PubMed] [Google Scholar]
- Sener M, Strumpfer J, Timney JA, Freiberg A, Hunter CN, and Schulten K (2010). Photosynthetic Vesicle Architecture and Constraints on Efficient Energy Harvesting. Biophys. J 99, 67–75. [DOI] [PMC free article] [PubMed] [Google Scholar]
- Sener MK, Olsen JD, Hunter CN, and Schulten K (2007). Atomic-level structural and functional model of a bacterial photosynthetic membrane vesicle. Proc. Natl. Acad. Sci 104, 15723–15728. [DOI] [PMC free article] [PubMed] [Google Scholar]
- Singharoy A, Chipot C, Moradi M, and Schulten K (2017). Chemomechanical Coupling in Hexameric Protein–Protein Interfaces Harnesses Energy within V-Type ATPases. J. Am. Chem. Soc 139, 293–310. [DOI] [PMC free article] [PubMed] [Google Scholar]
- Singharoy A, Barragan A, Thangapandian S, Tajkhorshid E, Schulten K (2016). Binding Site Recognition and Docking Dynamics of a Single Electron Transport Protein: Cytochrome c2. J. Am. Chem. Soc 138, 12077–12089. [DOI] [PMC free article] [PubMed] [Google Scholar]
- Stross C, Van der Kamp MW, Oliver TAA, Harvey JN, Linden N, and Manby FR (2016). How static disorder mimics decoherence in anisotropy pump-probe experiments on purple-bacteria light harvesting complexes. J. Phys. Chem. B 120, 11449. [DOI] [PubMed] [Google Scholar]
- Swainsbury DJK, Proctor M, Hitchcock A, Cartron M, Qian P, Martin E, Jackson PJ, Madsen J, Armes SP, and Hunter CN (2018). Probing the local lipid environment of the Rhodobacter sphaeroides cytochrome bc1 and Synechocystis sp. PCC 6803 cytochrome b6f complexes with styrene maleic acid. BBA Bioenerg. 1859, 215. [DOI] [PMC free article] [PubMed] [Google Scholar]
- Szabo A, Luthey-Schulten Z, Schulten K (1980). First passage time approach to diffusion controlled reaction. J. Chem. Phys 72, 4350 [Google Scholar]
- Vasilev C, Brindley AA, Olsen JD, Saer RG, Beatty JT and Hunter CN (2013). Nano-mechanical mapping of the interactions between surface-bound RC-LH1-PufX core complexes and cytochrome c 2 attached to an AFM probe. Photosynthesis Research 120, 169–180. [DOI] [PMC free article] [PubMed] [Google Scholar]
- Wells D, Abramkina V and Aksimentiev A (2007). Exploring transmembrane transport through alpha-hemolysin with grid-steered molecular dynamics. J. Chem. Phys 127, 125101. [DOI] [PMC free article] [PubMed] [Google Scholar]
- Wikström M, Sharma V, Kaila VRI, Hosler JP and Hummer G (2015). New Perspectives on Proton Pumping in Cellular Respiration. Chemical Reviews 115, 2196–2221. [DOI] [PubMed] [Google Scholar]
- Woronowicz K, and Niederman RA (2010). Proteomic analysis of the developing intracytoplasmic membrane in Rhodobacter sphaeroides during adaptation to low light intensity. Adv. Exp. Med. Biol 675, 161–78. [DOI] [PubMed] [Google Scholar]
- Yesylevskyy SO, Rivel T, and Ramseyer C (2017). The influence of curvature on the properties of the plasma membrane. Insights from atomistic molecular dynamics simulations. Sci. Rep 7, 16078. [DOI] [PMC free article] [PubMed] [Google Scholar]
- Yu SP, and Choi DW (2000). Ions, volume, and apoptosis. Proc. Natl. Acad. Sci 97, 9360–9362. [DOI] [PMC free article] [PubMed] [Google Scholar]
Associated Data
This section collects any data citations, data availability statements, or supplementary materials included in this article.