

Abstract
The Src homology phosphatase 2 (SHP2) is a cytoplasmic enzyme that mediates signaling induced by multiple receptor tyrosine kinases, including signaling by the epidermal growth factor receptor (EGFR) family (EGFR1–4 or the human homologs HER1–4). In EGFR (HER1) and EGFR2 (HER2) signaling, SHP2 increases the half-life of activated Ras by blocking recruitment of Ras GTPase-activating protein (RasGAP) to the plasma membrane through dephosphorylation of docking sites on the receptors. However, it is unclear how SHP2 selectively recognizes RasGAP-binding sites on EGFR and HER2. In this report, we show that SHP2-targeted pTyr residues exist in a specific amino acid context that allows selective binding. More specifically, we show that acidic residues N-terminal to the substrate pTyr in EGFR and HER2 mediate specific binding by the SHP2 active site, leading to blockade of RasGAP binding and optimal signaling by the two receptors. Molecular modeling studies revealed that a peptide derived from the region of pTyr992-EGFR packs well and makes stronger interactions with the SHP2 active site than with the SHP1 active site, suggesting a built-in mechanism that enables selective substrate recognition by SHP2. A phosphorylated form of this peptide inhibits SHP2 activity in vitro and EGFR and HER2 signaling in cells, suggesting inhibition of SHP2 protein tyrosine phosphatase activity by this peptide. Although we do not expect this peptide to be a strong inhibitor by itself, we foresee that the insights into SHP2 selectivity described here will be useful in future development of active-site small molecule-based inhibitors.
Keywords: signal transduction, receptor tyrosine kinase, breast cancer, phosphatase, inhibitor, EGF signaling, EGFR, HER2, Peptide inhibitor, SHP2
Introduction
The Src homology phosphatase 2 (SHP2)2 is a cytosolic enzyme that is known to play a positive role in receptor tyrosine kinase (RTK) signaling (1–6). Structurally, SHP2 is composed of two tandemly arranged SH2 domains in the N-terminal region and a phosphotyrosyl phosphatase (PTP) domain in the C-terminal region (7, 8). Although the SH2 domains mediate binding to interaction partners, the PTP domain catalyzes dephosphorylation reactions on target substrates. Furthermore, SH2 domain-mediated interactions regulate the enzyme activity of SHP2 (9).
Because of its positive role in RTK signaling, the importance of SHP2 in different types of cancers has been studied. A large body of literature shows that SHP2 promotes the tumorigenic and/or metastatic properties of breast, lung, gastric, cervical, and brain cancers (10–14). In breast cancer, SHP2 is overexpressed in HER2-positive and triple-negative breast cancer subtypes (15, 16) and promotes cell proliferation and transformation in culture (17–20) and tumorigenesis and metastasis in vivo (15, 21). These findings have led to recent efforts aimed at targeting SHP2 in different types of cancers. However, there is a significant knowledge gap that has hampered progress in successfully targeting SHP2 for the treatment of different cancers.
To date, several SHP2 active-site inhibitors have been published (22–26). This work has unveiled several common challenges for targeting the SHP2 active site. First, moieties used to mimic phosphotyrosine tend to be charged, rendering compounds impermeable to the cell membrane. Second, selectivity of these compounds has become a major issue because the active sites of PTPs are well-conserved (27). Thus, many drugs that target SHP2 tend to target other PTPs, especially its homolog SHP1. This is an especially important issue to overcome because SHP1 is a negative mediator of signaling (28). The most selective active-site inhibitors for SHP2 have been shown to achieve ∼20-fold selectivity for SHP2 over SHP1 (24), which leaves significant room for improvement.
Using substrate trapping with a catalytically inactive mutant of SHP2, we have previously identified Tyr992 in EGFR, Tyr1023 in HER2, and Tyr397 in FAK as biological substrates when they are phosphorylated (1, 6, 29, 30). However, we did not study how SHP2 selectively dephosphorylates these pTyr substrates among the several phosphorylation sites in each of these molecules. A previous report suggested that substrate recognition by PTPs, including SHP2, is determined by elements of the sequence surrounding the pTyr (31). However, the intermolecular determinants of selective substrate binding to SHP2 have not been elucidated. Crystal structures of small molecule inhibitor-bound to SHP2 have been published (26), but it is still not clear whether the interactions are specific because comparisons were not made between binding to SHP2 and other PTPs. In the current study, we have compared the amino acid contexts of substrates and nonsubstrates and conducted site-directed mutagenesis and binding studies to validate the differences. We have also conducted functional studies in cells to further validate the importance of substrate recognition by the SHP2 active site for mediating signaling. Furthermore, using computational docking experiments, we have assessed how an isolated substrate peptide can selectively bind to the SHP2 active site over that of SHP1, which was validated by in silico and site-directed mutagenesis of the SHP2 active site. Finally, we have conducted proof-of-concept studies using isolated peptides as inhibitors of SHP2 function.
Results
SHP2 substrate pTyr are preceded by acidic residues
We have previously identified Tyr992 in EGFR, Tyr1023 in HER2, and Tyr397 in FAK as biological substrates for SHP2 when they are phosphorylated (1, 6, 29, 30). Each of these molecules have multiple Tyr phosphorylation sites, but SHP2 dephosphorylates only one. How SHP2 discriminates between substrates and nonsubstrates was not studied. As an initial approach, we aligned sequences surrounding the substrate and nonsubstrate pTyr sites in EGFR, HER2, and FAK and found enrichment in acidic amino acids immediately N-terminal to the target Tyr residues as a common trend (Fig. 1). For instance, Tyr992 in EGFR is preceded by three acidic amino acids of the four immediately N-terminal to it, but the remaining Tyr phosphorylation sites have relatively fewer acidic residues at this position. The same is true for Tyr1023 of HER2 and Tyr397 of FAK. A further peculiarity is the presence of an Asp or a Glu at the −2 position in the SHP2 substrate sites when compared with the nonsubstrate sites within each protein (Fig. 1). These findings suggest that the acidic residues N-terminal to the target Tyr residues might be important for substrate recognition by SHP2.
Figure 1.
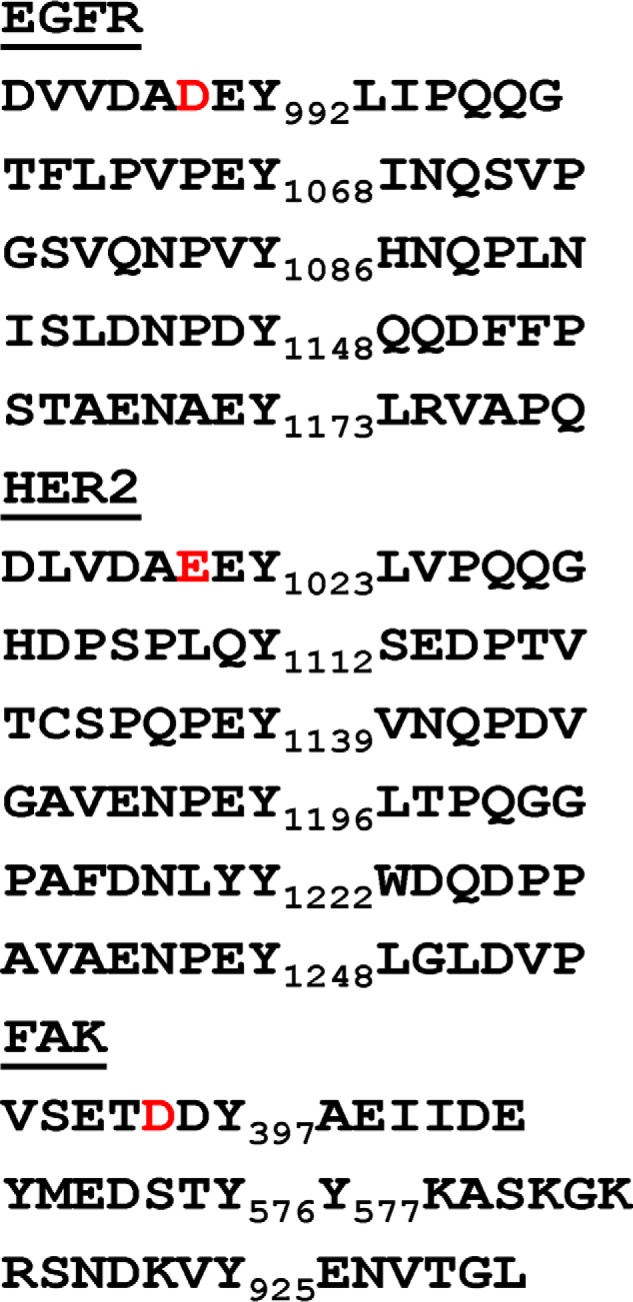
Alignment of amino acid sequences surrounding known Tyr phosphorylation sites in EGFR, HER2, and FAK. The numbers next to each Y represent the actual amino acid numbers within each molecule. For the purpose of uniform description of surrounding amino acids among the different SHP2 substrates, we have used the target Tyr residue as a reference to assign negative and positive numbers to residues N-terminal and C-terminal to it, respectively. The unique acidic amino acids in the −2 position are shown in red.
Acidic residues mediate selective binding to SHP2
Based on the sequence data in Fig. 1, we reasoned that the unique acidic residues at the −2 position N-terminal to the SHP2 substrate Tyr residues in each molecule might play critical roles for substrate recognition by SHP2. To test this possibility, we introduced an Asp-to-Ala mutation at position 990 in EGFR (D990A-EGFR) and a Glu-to-Ala mutation at position 1021 in HER2 (E1021A-HER2) by site-directed mutagenesis and performed binding studies as described by us previously (1, 6, 30). This technique utilizes the substrate-trapping mutant of SHP2, termed double-mutant SHP2 (DM-SHP2) that harbors D425A and C459S mutations, which is PTPase-dead but forms stable complexes with biological substrates in cells (29). Note that the WPD lop Asp and the nucleophile Cys in the active site of SHP2 and in the active sites of many Cys-based PTPs are important for dephosphorylation reactions but not so much for initial substrate binding (32).
Given the significance of EGFR and HER2 in breast cancer, we focused on these proteins to determine how SHP2 recognizes the target Tyr residues, Tyr992 and Tyr1023, when they are phosphorylated. The previously produced mutants of EGFR (Y992F-EGFR) and HER2 (Y1023F-HER2) (1, 6) were included as negative controls for the binding studies. We have used 3T3 fibroblasts and MCF-10A breast epithelial cells to express EGFR and HER2 proteins, respectively, because they have very low levels of the respective endogenous proteins. The WT and mutant forms of each protein were expressed by retroviral transduction as described previously (33). Cells transduced with vector alone or the different EGFR and HER2 constructs were grown to near confluence before overnight serum starvation followed by vanadate treatment and EGF stimulation to enhance phosphorylation of EGFR and HER2 proteins. Cleared lysates were subjected to affinity precipitation (AP) with the GST fusion of the PTP domain of the DM-SHP2 (DM-PTP) and immunoblotting (IB) with anti-EGFR or anti-HER2 antibodies. Although the WT proteins (WT-EGFR and WT-HER2) were able to bind to the DM-PTP, the D990A-EGFR and the E1021A-HER2 did not (Fig. 2, A and B). As expected, the Y992F-EGFR and Y1023F-HER2 proteins that lacked the essential Tyr residues did not interact with the DM-PTP. As a specificity control, binding studies were performed using the GST fusion of the PTP domain of the trapping mutant of SHP1 (TM-PTP), which is a homolog of SHP2. The results showed a relatively weak binding of all EGFR and HER2 proteins (both mutant and WT forms) to TM-PTP (Fig. 2, C and D). Analysis of corresponding total cell lysates for EGFR and HER2 showed comparable expression (Fig. 2, E and F, top panels). Further reprobing for β-actin showed comparable protein levels in all lanes (Fig. 2, E and F, bottom panels). These findings suggest that acidic residues at the −2 position of Y992-EGFR and Y1023-HER2 are essential for interaction with the SHP2 active site.
Figure 2.

Site-directed mutagenesis and binding studies. A, AP of EGFR proteins with the GST fusion of the PTP domain of the substrate-trapping mutant of SHP2 (DM-PTP). As shown, mutation of Asp990 to Ala (D/A) in EGFR abolished binding to DM-PTP. The Y992F-EGFR (Y/F) was used as a negative control. B, AP of HER2 proteins with DM-PTP. As shown, mutation of Glu1021 to Ala (E/A) in HER2 abolished binding to DM-PTP. As expected, the negative control Y1023F-HER2 (Y/F) was not precipitated by the DM-PTP. C, AP of EGFR proteins with the GST fusion of the PTP domain of the substrate-trapping mutant of SHP1 (TM-PTP). D, AP of HER2 proteins with TM-PTP. E, mutation of Asp990 to Ala (D/A) in EGFR did not affect phosphorylation on Tyr992 (pY992). F, mutation of Glu1021 to Ala (E/A) in HER2 did not affect phosphorylation on Tyr1221/1222 (pY1221/1222). G, lysates of MCF-10A cells expressing vector alone (Vec), WT-HER2 (WT), Y1023F-HER2 (Y/F), or E1021A-HER2 (E/A) were subjected to IP with anti-RasGAP and IB with anti-HER2 antibodies. Vec, vector alone; WT, WT EGFR or HER2; Y/F, Y992F-EGFR or Y1023F-HER2; D/A, D990A-EGFR; E/A, E1021A-HER2. The numbers on the left-hand side of each figure show molecular mass markers.
It is possible that mutation of acidic residues leads to blockade of Tyr phosphorylation, which in turn leads to loss of binding to the DM-PTP. To rule out this possibility, we determined the state of EGFR and HER2 phosphorylation on Tyr992 and Tyr1023, respectively. Phosphorylation of EGFR at Tyr992 was directly tested by IB because a specific antibody that recognizes pTyr992 is available. Both WT-EGFR and D990A-EGFR were phosphorylated on Tyr992, suggesting that the Asp in the −2 position is not essential for EGF-induced phosphorylation (Fig. 2E, middle panel). As expected, the Y992F-EGFR (Y/F) was not detected by the anti-pTyr992 antibody, confirming the specificity of the antibody. Hence, the lack of interaction by the D990A-EGFR to the SHP2 active site was not caused by lack of phosphorylation.
With regard to HER2, we could not directly test whether or not the Glu1021-to-Ala mutation affected HER2 phosphorylation on Tyr1023 because a specific antibody is unavailable. For this, we employed two complementary approaches to assess effect of the mutation on phosphorylation. First, we used co-immunoprecipitation (co-IP) with RasGAP as a readout for phosphorylation of HER2 on Tyr1023. Note that phosphorylation of HER2 on Tyr1023 (pY11023-HER2) mediates RasGAP binding through SH2 domains (6). MCF-10A cells expressing vector alone, WT-HER2, Y1023F-HER2, and E1021A-HER2 were serum-starved overnight, stimulated with EGF for 10 min, lysed, centrifuged, and subjected to IP with anti-RasGAP and IB with anti-HER2 antibodies. The E1021A-HER2 protein interacted with RasGAP as efficiently as the WT-HER2 protein, suggesting that the mutation did not affect phosphorylation on this site (Fig. 2G and Fig. S1). As expected, the Y1023F-HER2 did not interact with RasGAP because of mutation of the essential Tyr residue to Phe.
To complement the RasGAP interaction data, we determined overall HER2 phosphorylation by IB with a specific antibody that recognizes HER2 phosphorylation on Tyr1221/1222, which is commercially available. The results showed comparable phosphorylation of all HER2 proteins, including E1021A-HER2, WT-HER2, and Y1023F-HER2 proteins (Fig. 2F, middle panel). Together, data in Fig. 2 (F and G) suggest that the Glu1021-to-Ala mutation did not affect phosphorylation of HER2 on Tyr1023 and consequently of its interaction with RasGAP.
Mutation of Asp990 in EGFR or Glu1021 in HER2 leads to loss of signaling and cell transformation potency
Next, we sought to determine whether mutations that abrogate binding to the SHP2 active site while preserving RasGAP interaction would have an impact on cellular signaling and transformation. The effect on signaling was determined by analyzing ERK1/2 and Akt activation in cells treated with EGF for variable time points. Although expression of the Y992F-EGFR and the Y1023F-HER2 mutants led to enhanced and sustained activation, expression of the D990A-EGFR and the E1021A-HER2 mutants led to suboptimal and short-lived activation when compared with signaling induced by the corresponding WT proteins (Fig. 3, A and D, and Figs. S2 and S3). Probing for total Akt and ERK2 showed comparable protein levels in all lanes. To compare the IB findings further, band densities of pAkt and pERK1/2 from the three independent experiments were determined. For these comparisons, the band density of the unstimulated vector-alone sample was used as a reference to estimate fold changes in EGF-induced signaling across the experimental groups. These analyses confirmed the IB image data and revealed the short-lived nature of the signaling induced by the −2 position EGFR and HER2 mutants and the sustained signaling by the Tyr-to-Phe mutants when compared with the respective WT proteins. Because the differences in signaling properties are more apparent at the 1-h time point and thereafter, we have used this time point to make comparisons. For instance, EGF-induced pAkt levels at the 1-h time point for the WT-EGFR, the D990A-EGFR, and the Y992F-EGFR were ∼7-, 3-, and 11-fold over the unstimulated vector alone sample, respectively (Fig. 3B). Also, the EGF-induced pERK1/2 levels at the 1-h time point for the WT-EGFR, the D990A-EGFR, and the Y992F-EGFR were ∼8-, 4-, and 13-fold over the unstimulated vector alone sample, respectively (Fig. 3C). Very similar trends in pAkt and pERK1/2 levels were observed in HER2-expressing MCF-10A cells except that the signaling intensity both for pAkt and pERK1/2 was higher when compared with EGFR-expressing cells (Fig. 3, E and F).
Figure 3.

Effect of EGFR and HER2 mutations on signaling and cell transformation. A, 3T3 cells expressing vector, WT-EGFR, D990A-EGFR, and Y992F-EGFR were serum-starved overnight and stimulated with EGF for 10 min to 4 h. Total cell lysates were then analyzed with the indicated antibodies by IB. B, line graph showing band density of pAkt levels from three independent experiments in vector and EGFR-expressing 3T3 cells. C, line graph showing band density of pEK1/2 levels from three independent experiments in vector and EGFR-expressing 3T3 cells. D, MCF-10A cells expressing vector, WT-HER2, E1021A-HER2, and Y1023F-HER2 were serum-starved overnight and stimulated with EGF for 10 min to 4 h. Total cell lysates were then analyzed with the indicated antibodies by IB. E, line graph showing band density of pAkt levels from three independent experiments in vector and HER2-expressing MCF-10A cells. F, line graph showing band density of pERK1/2 levels from three independent experiments in vector and HER2-expressing MCF-10A cells. G, bar graph showing colony numbers formed by 3T3 cells expressing vector alone or the different EGFR proteins. H, bar graph showing colony numbers formed by MCF-10A cells expressing vector alone or the different HER2 proteins. Bars in G and H represent means ± S.D. (standard deviation) of colony numbers obtained from visual counting in 10 randomly collected microscopic field images under the 4× objective. Vec, vector alone; WT, WT EGFR or HER2; Y/F, Y992F-EGFR or Y1023F-HER2; D/A, D990A-EGFR; E/A, E1021A-HER2. The numbers on the left-hand side of A and D show molecular mass markers.
To further compare the differences in signaling property, we have calculated fold differences in pAkt and pERK1/2 levels and p values at the 1-h time point. When compared with vector-expressing cells, EGF-induced pAkt levels in WT-EGFR, D990A-EGFR, and Y992F-EGFR were 4.5-fold (p: 0.002), 1.5-fold (p:0.05), and 9.1-fold (p: 0.0002) higher, respectively. Similarly, EGF-induced pERK1/2 levels in WT-EGFR, D990A-EGFR, and Y992F-EGFR were 5.05-fold (p: 0.001), 1.6-fold (p:0.03), and 9.6-fold (p: 0.0001) higher, respectively. The trends were similar in MCF-10A cells expressing the HER2 proteins except that the signaling intensity was much higher, respectively. Accordingly, EGF-induced pAkt levels in WT-HER2, E1021A-HER2, and Y1023F-HER2 were 11.13-fold (p: 0.0003), 2.6-fold (p:0.05), and 11.7-fold (p: 0.0001) higher. Similarly, EGF-induced pERK1/2 levels in WT-HER2, E1021A-HER2, and Y1023F-HER2 were 11.42-fold (p: 0.0002), 2.7-fold (p:0.02), and 14.7-fold (p: 0.0001) higher, respectively. These findings clearly show that mutation of the −2 position acidic residues that abolish recognition by the SHP2 enzyme active site leads to a less efficient downstream signaling by these RTKs, which in turn suggests the importance SHP2 dephosphorylation of pTyr992 in EGFR and pTyr1023 in HER2 to mediate signaling.
The consequence of the signaling defect by the −2 position EGFR and HER2 mutants on cell biology was determined by anchorage-independent growth in soft agar, an assay commonly used to determine state of cell transformation. In general, overexpression of EGFR, including the Y992F-EGFR, was less efficient in inducing transformation as evidenced by formation of only small-sized colonies (Fig. S4). Nonetheless, it was possible to discern relative differences among the three EGFR proteins. When compared with the vector-expressing cells that did not form any viable colonies, the WT-EGFR, Y992F-EGFR, and D990A-EGFR cells formed ∼24, 35, and 13 colonies per filed under the 4× microscopic objective, respectively (Fig. 3G). On the other hand, all of the HER2 proteins were more transforming than EGFR but with significant differences primarily in colony number; that is, the WT-HER2 and the Y1023F-HER2 proteins showed better proficiency than the E1021A-HER2 (Fig. S5). More specifically, the WT-HER2, Y1023F-HER2, and D1021A-HER2 cells formed ∼30, 47, and 15 colonies per field under the 4× microscopic objective (Fig. 3H). Overall, these results suggest that acidic amino acids at the −2 position mediate binding to SHP2, which in turn dephosphorylates pTyr992 in EGFR and pTyr1023 in HER2 to promote signaling and cell transformation.
Molecular modeling predicts binding determinants of the SHP2 active site and substrate
To obtain further insight on substrate binding to the SHP2 active site, we performed molecular docking studies using the molecular modeling program YASARA, version 18.3.23 (34). A 6–amino acid–long pTyr peptide derived from residues surrounding Tyr992 of EGFR, depicted as DADEpYL, was docked into the SHP2 active site of Protein Data Bank (PDB) entry 2SHP with SH2 domains stripped from the structure. At least 2000 runs were performed, and the most favorable conformation was selected to predict the interaction. First, we have presented the SHP2 PTP domain as an electron-filled structure and that of the peptide as a stick structure to show details of amino acid side chain orientations (Fig. 4A). We ensured that the pTyr was situated inside the active site near the nucleophilic Cys (yellow spot), an essential feature of the PTP catalytic mechanism (35). Upon binding, the peptide packs itself deep into the active site and forms an almost perfect fit into the cleft (Fig. 4A and Fig. S6). The same peptide was docked into the SHP1 active site, the homolog of SHP2, but with distinct biological roles (36, 37). Although the pTyr group of the peptide is inserted into the active site cleft, most of the side chains fell outside the cleft and made extended and shallow interactions (Fig. 4C and Fig. S6). These findings show that the DADEpYL peptide binds differently to the SHP2 and SHP1 active sites.
Figure 4.

Molecular modeling studies. A, Tyr-phosphorylated form of a hexa-peptide derived from amino acids surrounding Tyr992 of EGFR, depicted as DADEpYL, was docked into the active site of SHP2. Electron-filled structure of SHP2. B, a two-dimensional diagram was drawn, using a flattened peptide structure and circles representing the SHP2 active site residues to show details of the specific interactions. The corresponding key shows the types of interaction (polar, acidic, basic, greasy or hydrophobic, acceptor, donor, etc.). C, the hexapeptide DADEpYL was docked into the active site of SHP1, and shown as electron-filled structure for SHP1 and stick structure for peptide. D, a two-dimensional diagram, showing a flattened peptide structure and circles representing the SHP1 active site residues to show details of the specific interactions. E, the combined mutation of Arg362, Lys364, and Lys366 to Ala in DM-PTP caused a binding away of the peptide from the substrate pocket. The space-filled structure shows the side chain of Cys459 with the yellow-colored sulfur atom. F, AP of WT EGFR with the GST fusion of the PTP domain of the substrate-trapping mutant of SHP2 (DM-PTP) and mutant DM-PTP (mDM-PTP). As shown, mDM-PTP that lacked Arg362, Lys364, and Lys366 could not bind to EGFR. G, AP of WT HER2 with DM-PTP and mDM-PTP. Again, mDM-PTP could not bind to HER2. H, total EGFR protein levels were comparable in both input total cell lysates, and Tyr992 was phosphorylated upon EGF stimulation. I, total HER2 protein was comparable in both input total cell lysates, and HER2 was phosphorylated on Tyr1221/1222 upon EGF stimulation. The numbers on the left-hand side of F–I show molecular mass markers.
To show the specifics of the SHP2-peptide interaction, a two-dimensional diagram was drawn, using a flattened peptide structure and circles representing the SHP2 active site residues (Fig. 4B). The colors of the circles depict whether the residue is acidic, basic, polar, or hydrophobic, whereas the arrows show acceptors or donors of the interactions. In these data, actual amino acid numbers in the SHP2 protein were used to refer to residues in the active site, whereas a position in reference to the pTyr was used to assign numbers to the residues in the peptide. Accordingly, residues N-terminal to the pTyr were assigned with negative numbers, whereas those positioned C-terminal to the pTyr were assigned positive numbers. Amino acid residues in the SHP2 active site and in the peptide made numerous electrostatic and hydrogen-bonding interactions, particularly between the Arg and the Lys residues of the SHP2 active site and the acidic residues of the substrate peptide; the major interaction energies with ΔG of −2 or above are presented in Table 1. The predicted binding energies between the Asp of the peptide in the −2 position and Arg362 and Lys366 of the SHP2 active site were −4.9 and −8.7 kcal/mol, respectively. Other predicted interactions included contacts between Lys364 and backbone O of −3 Ala (−9.9 kcal/mol), between Gly464 and the phosphate moiety of the pTyr (−8.1 kcal/mol), and between Arg465 and the phosphate moiety of the pTyr (−6.55 kcal/mol). Overall, the interaction energy was predicted to be approximately −38.15 kcal/mol.
Table 1.
Computed interactions energies between the SHP2 active site and the DADEpYL peptide
| SHP2 to peptide interactions | E |
|---|---|
| kcal/mol | |
| Arg362 to −2 Asp and backbone O | −4.9 |
| Lys364 to backbone O of −3 Ala | −9.9 |
| Lys366 to −2 Asp and O of −3 Ala | −8.7 |
| Arg465 to phosphate and −1 Glu | −6.55 |
| Gly464 backbone to phosphate | −8.1 |
| Total predicted binding energy | −38.15 |
As mentioned above, the DADEpYL peptide interacted differently with the active site area of SHP1. For instance, the −4 Asp interacts with Lys273 (−3.8 kcal/mol), which lies outside the active site cleft (Fig. 4D and Table 2). The active site residues Arg360 and Lys362 of SHP1, which correspond to Lys364 and Lys366 of SHP2, interact with the +1 backbone of the peptide (−3.1 and −2.2 kcal/mol, respectively). Also, the active site Arg461 interacts with the phosphate moiety of the peptide (−4.7 kcal/mol). Furthermore, Gln506 makes moderate to weak interaction with the phosphate moiety of the peptide (−3.2 kcal/mol). However, Lys358 that corresponds to Arg362 of SHP2 is not close enough to make any interactions. Importantly, the SHP1 active site makes no major interaction with the −2 Asp, confirming the lack of dependence on this residue as observed in Fig. 2 (C and D). The overall interaction energy was estimated to be approximately −17.0 kcal/mol (Table 2), which is lower by more than 2-fold over that of the SHP2 binding energy.
Table 2.
Computed interactions energies between the SHP1 active site and the DADEpYL peptide
| SHP1 to peptide interactions | E |
|---|---|
| kcal/mol | |
| Lys273 to −4 Asp | −3.8 |
| Arg360 to +1 backbone and −1 Glu | −3.1 |
| Lys362 to +1 backbone | −2.2 |
| Arg461 to phosphate | −4.7 |
| Gln506 to phosphate | −3.2 |
| Total predicted binding energy | −17.0 |
To determine the importance of the SHP2 active site residues, we performed in silico mutation and docking studies. Particularly, we focused on Arg362, Lys364, and Lys366, which make critical interactions with the peptide. Mutation of each residue led to loss of the specific interactions (Fig. S7). The combined mutation of all three residues to Ala led to an extended and relatively shallow binding of the peptide away from the active site (Fig. 4E). To validate the modeling data, the three positively charged residues (Arg362, Lys364, and Lys366) were mutated to Ala in tandem in the GST fusion substrate-trapping mutant of SHP2 (mDM-PTP) and used for binding with WT-EGFR and WT-HER2 that were induced for autophosphorylation by EGF stimulation (Fig. 4, H and I). Consistent with data in Fig. 2, the DM-PTP effectively affinity precipitated both EGFR and HER2, but the mDM-PTP failed to do so (Fig. 4, F and G), confirming the in silico mutation and docking data in Fig. 4E. These findings suggest that the three positively charged residues in the SHP2 active site play critical roles for specific interaction with substrate.
A substrate-derived peptide can inhibit SHP2 PTPase activity in vitro
Based on the molecular modeling data that showed specific binding of the DADEpYL peptide to the SHP2 active site, we hypothesized that the isolated peptide might selectively inhibit SHP2 PTPase activity. To test this possibility, we first predicted a potential inhibition constant (Ki) of the peptide toward SHP2 PTPase activity using Autodock tools. The results showed 9.72 μm for SHP2 and 641 μm for SHP1 (Table 3). Docking a nonsubstrate peptide in which the −2 Asp was replaced by Ala (DAAEpYL) resulted in a drastic loss in the predicted Ki to SHP2 with no significant change to SHP1 (Table 3).
Table 3.
Predicted and experimental inhibition constant (Ki) for SHP2 and SHP1 by substrate-derived peptides
The closeness of the predicted and the experimental Ki values suggests the reproducibility of the findings.
| PTP | Predicted Ki | Experimental Ki |
|---|---|---|
| μm | μm | |
| DADEpYL | ||
| SHP1 | 641 | 630.0 |
| SHP2 | 9.72 | 11.97 |
| DAAEpYL | ||
| SHP1 | 650 | No measureable effect |
| SHP2 | 611.38 | 856.8 |
To confirm this prediction, the DADEpYL peptide was used as a competitive inhibitor in SHP2 and SHP1 PTPase reactions that utilized difluoromethylumbelliferyl phosphate (DiFMUP) as an artificial substrate. The DAAEpYL peptide that showed very low predicted Ki for both SHP2 and SHP1 was used as a nonbinding control. The GST fusions of the PTP domains of WT SHP2 and SHP1 were purified as described under “Materials and methods” and in a previous report (38). The PTPase activity was determined in the presence of peptide concentrations, ranging from 100 nm to 2.4 mm. The inhibitory constant Ki for the peptide against SHP2 was found to be ∼11.97 μm, whereas it was 630.0 μm for SHP1, an ∼52-fold selectivity for SHP2 rather than SHP1 (Table 3). The nonsubstrate peptide DAAEpYL that lacks charges of the −2 Asp was ineffective in inhibiting SHP2 PTPase activity (Ki = 856.8 μm), which is consistent with the predicted Ki values (Table 3). On the other hand, the effect of the mutant peptide on SHP1 PTPase activity was unchanged or similar to the WT peptide (Table 3). These data support the hypothesis that an isolated peptide substrate can inhibit SHP2 PTP activity, but not SHP1 activity. They also suggest that the conserved acidic amino acids at the −2 position are especially important for inhibiting SHP2 PTPase activity. Because the DADEpYL peptide is not resistant to dephosphorylation, the inhibitory effect may come from reduced enzyme turnover.
Treating breast cancer cells with the DADEpYL peptide suppresses EGF-induced signaling
Because the DADEpYL peptide selectively inhibits SHP2 PTPase activity, we hypothesized that it may also suppress SHP2-mediated signaling in cells. To test this possibility, the DADEpYL peptide was synthesized in fusion with the cell-penetrating peptide of the Tat protein (39) at the N terminus. The nonbinding DAAEpYL peptide conjugated with the same Tat sequence was used as a nonbinding control. To visualize internalization, both the test and the control peptides were conjugated with FITC at the N terminus.
The MCF-10A breast epithelial cells that express normal level of EGFR and the BT474 breast cancer cells that overexpress HER2 were used for testing the effect of the peptides. Cells in serum-free medium were treated with 5 μg per ml of either peptide or the solvent PBS for 1 h and then stimulated with EGF in a time-course fashion, ranging from 10 min to 4 h. Fluorescence imaging of unstimulated and EGF-stimulated (10 min) cells after washing with PBS confirmed efficient internalization (Fig. 5, A and B). Total cell lysates were then analyzed by immunoblotting for effect on activation of ERK1/2 and Akt. Treating both cells with the DADEpYL peptide significantly inhibited activation of both Akt and ERK1/2 at the 10-min time point and thereafter. On the other hand, treating cells with the DAAEpYL peptide did not show any effect on signaling similar to those treated with PBS (Fig. 5, C and F, and Figs. S8 and S9), suggesting that the nonbinding control peptide is ineffective. Reblotting for total ERK2 and Akt proteins showed comparable protein levels in all lanes. These findings suggest that the DADEpYL peptide suppresses EGF-induced signaling.
Figure 5.

Effect of the isolated SHP2 substrate peptide on signaling. A, fluorescent images of MCF-10A cells transduced with the control DAAEpYL and the test DADEpYL peptides. B, fluorescent images of BT474 breast cancer cells transduced with the same control and test peptides. Note that each peptide is conjugated to the Tat1 cell-penetrating peptide and FITC. The images show both unstimulated and EGF stimulated (10 min) cells. C, effect of the control and the test peptides on EGF-induced signaling as compared with the solvent PBS in MCF-10A cells. D, line graph showing band density of pAkt levels in MCF-10A cells. E, line graph showing band density of pERK1/2 levels in MCF-10A cells. F, effect of the control and test peptides on EGF-induced signaling in BT474 cells. G, line graph showing band density of pAkt levels in BT474 cells. H, line graph showing band density of pERK1/2 levels in BT474 cells. The white bars at the right-hand bottom corner of A and B represent 100 μm. The numbers on the left-hand side of C and F show molecular mass markers.
To support the qualitative IB image findings with quantitative data, the band densities of pAkt and pERK1/2 levels from the three independent experiments presented in Fig. 5 (C and F) and Figs. S8 and S9 were determined. As can be surmised from the IB images as well as from the band density graphs, EGF-induced ERK1/2 and Akt activation in MCF-10A cells spikes at ∼10 min and goes down to ∼40% in less than 1 h. On the other hand, EGF stimulation in the HER2-positive BT474 breast cancer cell line leads to a more sustained signaling, most probably because of overexpression of HER2, which is resistant to degradation (33). To maintain uniformity, we have used the 10-min time point in both cells for comparing the effect of the peptides on signaling. EGF-induced pAkt levels in PBS and control peptide–treated MCF-10A cells at the 10-min time point were ∼15- and 16-fold, respectively, but the values at the corresponding time point in the DADEpYL-treated cells was only 5-fold (Fig. 5D). Also, pERK1/2 levels in PBS and control peptide–treated MCF-10A cells at the 100min time point were ∼17- and 16-fold, respectively, but the value in the DADEpYL-treated cells at the corresponding time point was only 6-fold. To further compare the effect of the peptides, we have calculated fold differences and p values between PBS treated and peptide-treated cells at the 10-min time point for both pAkt and pERK1/2. Although no significant difference was observed between the PBS- and control peptide (DAAEpYL)–treated cells (1.3-fold for pAkt, p = 0.4, and 1.7-fold for pERK1/2, p = 0.06), there was a significant difference between the PBS- and DADEpYL-treated cells (10.5-fold for pAkt, p = 0.0002, and 11.6-fold for pERK1/2, p = 0.0001). Hence, the DADEpYL peptide inhibits signaling in MCF-10A cells.
As mentioned above, activation of both Akt and ERK1/2 was sustained for at least 4 h in the BT474 HER2-positive breast cancer cell line (Fig. 5, G and H). At the 10-min time point, the pAkt levels in PBS- and control peptide–treated cells were ∼14-fold for both, whereas the pERK1/2 levels were 16- and 17-fold, respectively. On the other hand, the pAkt and the pERK1/2 levels in DADEpYL-treated cells were ∼3.5- and 5.5-fold, respectively. To further compare the effect of the peptides in BT474 cells, we have calculated fold differences and p values. Although no significant difference was observed between the PBS- and control peptide (DAAEpYL)–treated cells (0.6-fold for pAkt, p = 0.6, and 1.5-fold for pERK1/2, p = 0.2), there was a significant difference between the PBS- and DADEpYL-treated cells (9.5-fold for pAkt, p = 0.001 and 10.3-fold for pERK1/2, p = 0.0007). Hence, the DADEpYL peptide is also effective in inhibiting EGF-induced signaling in BT474 cells.
Overall, data presented in Fig. 5 and Figs. S8 and S9 suggest that the DADEpYL peptide suppresses EGF-induced signaling, at least transiently, most likely through interfering with the SHP2 phosphatase activity, which is known to be important for mediating RTK-induced signaling, including EGFR and HER2 (1, 6).
Discussion
Part of the challenge for identifying selective active-site inhibitors of SHP2 is a lack of understanding of the key molecular interactions that mediate the selective binding of the enzyme to its substrates in cells. The present study presents a model to help understand these molecular interactions in some detail. From our previous publications that identified and characterized SHP2 substrates (1, 6, 30), we were able to discover common trends in primary amino acid sequences surrounding SHP2 target phosphotyrosine residues in EGFR, HER2, and FAK (Fig. 1). From these sequences, it was possible to discern relative enrichment of the immediate N-terminal region of the SHP2 target Tyr residues in acidic amino acids. Because the active sites of PTPs, including the active site of SHP2, are surrounded by positively charged residues (40), it was logical to think that acidic residues surrounding the SHP2 substrates are important for specific binding. Particularly, the −2 acidic residue is unique to SHP2 substrates when compared with nonsubstrates within each molecule (Fig. 1). These observations were the basis for experimentally testing the importance of acidic residues for binding to the SHP2 active site.
Using site-directed mutagenesis and AP, we have shown that the unique Asp and Glu residues preceding Tyr992 in EGFR (Asp990) and Tyr1023 in HER2 (Glu1021) are critical for substrate recognition by the SHP2 active site (Fig. 2, A and B). However, they are not required for binding to SHP1 (Fig. 2, C and D) or for autophosphorylation of the corresponding Tyr residues and interaction with RasGAP (Fig. 2, E–G, and Fig. S1). These findings are consistent with an important role for the acidic residues at the −2 position in specific enzyme–substrate binding. Indeed, mutation of these residues in EGFR and HER2 led to inefficient activation of the Ras-ERK and the phosphatidylinositol 3-kinase–Akt signaling pathways (Fig. 3, A–F, and Figs. S2 and S3), suggesting a lack of dephosphorylation by SHP2. The lack of dephosphorylation is suggested to enhance the negative regulator role of RasGAP on Ras, leading to suboptimal and short-lived signaling (1, 6, 41). These changes in signaling capacity were also reflected in cell transformation efficiency as determined by anchorage-independent growth in soft agar (Fig. 3, G and H, and Figs. S4 and S5). Taken together, these findings show that acidic residues N-terminal to the SHP2 target pTyr, particularly those at the −2 position, are important for recognition by the active site.
Molecular docking studies revealed that the DADEpYL peptide packs deep into the SHP2 active site (Fig. 4A and Fig. S6), but not with the SHP1 active site (Fig. 4C and Fig. S6). The differences in binding strength were further revealed by the predicted binding energies described in Tables 1 and 2 (−38.15 kcal/mol for SHP2 versus −17.0 kcal/mol for SHP1). Particularly, the interaction of the peptide through the −2 Asp with the SHP2 active site provided the strongest binding energy (−24.7 kcal/mol), but interaction of this residue with the corresponding region in SHP1 was weaker or absent. To test the significance of the SHP2 active site residues in substrate recognition, we first carried out in silico mutation of the three positively charged residues (Arg362, Lys364, and Lys366) that make critical interaction with the peptide and conducted docking studies. Although individual mutations reduced binding energy, combinatorial mutations disrupted binding to the active site (Fig. 4E and Fig. S7). To validate the in silico findings, site-directed mutagenesis and binding studies were conducted. The results confirmed that mutation of the three positively charged residues abrogates binding (Fig. 5, F and G). Hence, the positively charged residues in the SHP2 active site situated in a unique context are essential for specific interaction with substrates. However, our results cannot exclude the potential contribution of additional residues far away from the active site in mediating substrate binding.
The extended interaction of the peptide with mDM-PTP in the in silico docking data has some similarity to the binding of the peptide to the SHP1 active site. In fact, a previous study that determined the structure of SHP1 bound to substrate peptides derived from SHPS1 shows similar extended interactions (42). In that study, the peptides that bind better to SHP1 do not bear acidic residues at the −2 position. Our data combined with this prior report suggest that the SHP1 active site has subtle differences from SHP2 in substrate recognition; that is, although enrichment in acidic residues particularly in the −2 position is needed for SHP2, such sequences may not be essential for SHP1. Overall, the docking and binding data suggest that the SHP2 active site recognizes target substrates in the context of (D/E)X(D/E)(D/E)pY motif.
The DADEpYL peptide or its extended version has been previously shown to bind to PTP1B (43, 44), a PTP known to play a negative regulator role in RTK signaling, including EGFR and the insulin receptor. However, the critical role of the −2 Asp in binding to PTP1B has not been determined. In fact, Ala substitution of the −1 Glu led to enhanced binding (43), suggesting that enrichment in acidic amino acids may not be important. Also, PTP1B does not seem to discriminate between the different autophosphorylation sites in EGFR (43), whereas SHP2 does (Fig. 1). Future studies are needed to determine the relative binding property of the DADEpYL peptide to PTP1B and other PTPs to settle these questions.
The predicted as well as the experimental Ki values (Table 3) showed that the DADEpYL peptide has a more than 52-fold preference for SHP2 than SHP1. This selectivity was lost when the −2 Asp was replaced with Ala, confirming the critical role this acidic residue plays in selective enzyme–substrate interactions. However, this effect was not observed in enzyme assays involving SHP1, suggesting that acidic residues at this position are not important for SHP1 binding.
In theory, the DADEpYL peptide cannot be resistant to dephosphorylation by SHP2, but it does not seem to be readily dephosphorylated because it inhibits PTPase activity in vitro and SHP2-mediated signaling in cells. We speculate that the inhibitory effect of the peptide comes from a reduced enzyme turnover rate in dephosphorylating an isolated peptide as compared with dephosphorylating a natural substrate (whole protein), leading to a measureable temporal inhibition. It is possible that the binding of an isolated peptide might be slightly different from the binding of a full-length substrate in positioning the phosphate for nucleophilic attach by the catalytic Cys459.
Our data hint that phosphorylation mimicking peptides derived from the DADEpYL sequence may be useful for specific inhibition of SHP2. That the DADEpYL peptide conjugated to the cell-penetrating Tat1 sequence inhibits EGF-induced activation of the Ras-ERK and the phosphatidylinositol 3-kinase–Akt signaling pathways (Fig. 5 and Figs. S8 and S9) is very promising, because the findings are consistent with prior reports that used dominant-negative SHP2 expression or shRNA silencing (1, 15). Although we do not expect this peptide to be a strong inhibitor by itself, we foresee that the insights into SHP2 selectivity described here will be useful in future development of active-site small molecule-based inhibitors.
Materials and methods
Cells, cell culture, and reagents
The immortalized mammary epithelial cell line MCF-10A, the NIH 3T3 fibroblasts, and the BT474 breast cancer cells were purchased from American Tissue Culture Collection. The MCF-10A cells were cultured in Dulbecco's modified Eagle's medium supplemented with 10 μg/ml recombinant human insulin, 20 ng/ml EGF (PeproTech), 0.5 μg/ml hydrocortisone, 100 ng/ml cholera toxin (Sigma), and 5% horse serum, and the 3T3 and BT474 cells were grown in Dulbecco's modified Eagle's medium and RPMI-based growth medium supplemented with 10% fetal bovine serum, respectively. Other reagents used included the DiFMUP kit (Invitrogen) and GSH-Sepharose beads (GE Healthcare). The anti-HER2, anti-EGFR, and anti-SHP2 antibodies were from BD Biosciences, the anti-β-actin and the anti-FLAG antibodies were from Sigma–Aldrich, and the anti-phospho-ERK 1/2 and anti-phospho-Akt antibodies were from Cell Signaling, Inc.
Recombinant GST fusion SHP2 and SHP1 proteins
The substrate-trapping double mutant SHP2 (DM-SHP2) produced by mutation of Asp425 to Ala and Cys459 to Ser was reported previously (29). Also, the constructs for the expression of GST fusion of the PTP domains of DM-SHP2 and WT-SHP2 were reported previously (6). The SHP1 cDNA in pCMV-SPORT6 was purchased from American Tissue Culture Collection. Mutation of the catalytic residue Cys453 to Ser in SHP1 was accomplished by site-directed mutagenesis, using the sense (5′-ATCATCGTGCACAGCAGCGCCGGCATC-3′) and antisense (5′-GATGCCGGCGCTGCTGTGCACGATGAT-3′) primers and the Stratagene protocol. The GST fusions of the PTP domains of WT and C453S SHP1 were produced by PCR amplification and ligation into the pGEX-KG vector at the BamHI and HindIII sites. The sense primer with BamHI restriction site was 5′-AATTTTTGGATCCAATCCTATGCTGCGGCAGCCGTACTATG-3′, and the antisense primer with HindIII restriction site and a stop codon was 5′-AATTTTAAGCTTACTTCCTCTTGAGGGAAC-3′. The protocol for expressing and purifying GST fusion proteins and quantifying was described previously (6).
Expression of EGFR and HER2 proteins
Mutation of EGFR and HER2 Tyr phosphorylation sites was reported previously (1, 6). For mutating Asp990 to Ala in EGFR, the sense and the antisense primers were 5′-GTGGTGGATGCCGGCCGAGTACCTCATC-3′ and 5′-GATGAGGTACTCGGCGGCATCCACCAC-3′, respectively, and for mutating Glu1021 to Ala in HER2, the sense and the antisense primers were 5′-GGACCTGGTGGATGCTGCGGAGTATCTGGTACCCCAGCAG-3′ and 5′-CTGCTGGGGTACCAGATA CTCCGCAGCATCCACCAGGTCC-3′, respectively. A Stratagene site-directed mutagenesis kit was used for introducing the mutations (catalog no. 600250). Both the WT and mutant cDNAs of EGFR were transferred into the REBNA/IRES/GFP viral vector at XhoI and NotI sites as reported previously (1). The forward primer with Kozac and XhoI site was 5′-TTTTCTCGAGCGCCACCATGCG ACCCTCCGGGAC-3′, and the reverse primer with NotI site and stop codon was 5′-TTTGCGGCCGCTCATGC TCCAATAAATTCACTGCTTTG-3′. In case of HER2, a forward primer with Kozac and SalI site (5′-TTTGTCGACCGCCACCATCGCAGCT-3′) and a reverse primer with stop codon and NotI site (5′-TTTTGCGGCCGCCTATTTATCATCATCAT-3′) as reported previously (6) were used. Because XhoI has a restriction site in HER2 cDNA, we used SalI for creating compatible overhangs. Retroviruses that carry cDNA constructs for the different EGFR and HER2 proteins were generated and used to infect 3T3 and MCF-10A cells for stable expression as described previously (6, 33).
Immunoprecipitation and immunoblotting
The cells were lysed in a buffer containing 20 mm Tris-HCl (pH 7.4), 150 mm NaCl, 1 mm EDTA, 1% Triton X-100, 10% glycerol, and 50 mm NaF supplemented with 10 μg/ml each of aprotinin, leupeptin, and phenylmethylsulfonyl fluoride for inhibition of proteases, and 10 mm sodium orthovanadate for inhibition of phosphatases. For immunoprecipitation, the lysates were cleared by centrifugation at 12,000 rpm, incubated overnight with a primary antibody, and then precipitated using protein G–Sepharose beads. The beads were washed three times with cell lysis buffer and denatured by boiling with Laemmli sample buffer. The same denaturation procedure was used for analyzing total cell lysates. Denatured proteins were separated on 8% or 10% PAGE, immobilized onto a nitrocellulose membrane, blocked with 3% BSA in TBS containing 1% Tween 20 (TBST), and stained with a primary antibody overnight at 4 °C. Next, the membranes were washed three times with TBST, incubated with horseradish peroxidase-conjugated secondary antibodies in 5% milk, washed three times with TBST, and visualized by the chemiluminescence method (Pierce).
Preparation of GST fusion SHP2 and SHP1 proteins
Production of the GST fusion of the PTP domains of WT-SHP2 and substrate-trapping double mutant (D425A and C459S) SHP2, which is referred to as DM-SHP2, was reported previously (6). The GST fusion of the PTP domain of SHP1 was produced by PCR-based amplification and subcloning into pGEX-KG vector, using the sense primer with BamHI restriction site (5′-GGATCCAATCCTATGCTGCGGCAGCCGTACTA-3′) and the antisense primer with HindIII site and a stop codon (5′-AAGCTTCTAACTTCCTCTTGAGGGAAC-3′). The GST fusion of TM-SHP1 was created by introducing Cys453-to-Ser mutation, using the Agilent Technologies kit (catalog no. 200524) and the following sense and antisense primers (5′-ATCATCGTGCACAGCAGCGCCGGCATC-3′ and 5′-GATGCCGGCGCTGCTGTGCACGATGAT-3′). The underlined codons represent the Cys-to-Ser mutation. To determine the importance of the three basic residues (Arg362, Lys364, and Lys366), which are involved in substrate binding to the SHP2 active site, we conducted tandem site-directed mutagenesis in the GST-DM-PTP and compared binding properties. These sense and the antisense primers for introducing the mutations were 5′-GACCACCCGAGAGGTGGAGGCAGGCGCGAACGCATGCGTCCCATACTGGCCCGAG-3′ and 5′-CTCGG GCCAGTATGGGTCGCATGCGTTCGCGCCTGCCTCCACCTCTCGGGTGGTC-3, respectively. The underlined codons in the sense primer represent the R362A, the K364A, and the K366A mutations.
Affinity precipitation
The following protocol was used for preparing cell lysates and performing AP studies. Briefly, the cells at 80% confluence were incubated with 1 mm vanadate for 30 min before stimulating with EGF (100 ng/ml) for 10 min. The lysates were then incubated with purified GST-DM-SHP2 and TM-SHP1 overnight at 4 °C, and the resulting complexes were captured by incubating the mixture with GSH–Sepharose beads for 2 h at 4 °C. The beads were then washed four times with lysis buffer before adding Laemmli sample buffer and boiling. The denatured samples were then subjected to separation by SDS-PAGE and analysis by immunostaining (IB).
Anchorage-independent growth assay
The soft agar assay was performed as described previously (20). Briefly, 6-cm cell culture plates were coated with 0.5% agar in growth medium. Approximately 1 × 10⁵ cells were suspended in growth medium that was mixed with melted agar to a final concentration of 0.5% and were then poured onto the agar bed. After 2 weeks of incubation, phase contrast pictures were taken from 10 fields at a 4× objective per plate, using the same quadrant in each case under an Olympus IX71 microscope equipped with DP30 digital camera and Microsuite basic edition software. The colonies in each image were counted visually, and the values were used to compare transformation efficiency by the EGFR or the HER2 proteins. Colony numbers are presented as bar graphs using means ± S.D. of replicates. Also, representative images are presented for visual appreciation.
Molecular docking
The phosphopeptide corresponding to the synthesized peptide used in the kinetics assays was built in InsightII (Accelrys, Inc.) and saved as a PDB. The docking preprocessing and data analysis were performed in Autodock Tools, and the grid and docking calculations were carried out by Autogrid4 and Autodock4 (45, 46). Nonpolar hydrogens were removed from the peptide, and Kollman charges were added. The relaxed enzyme PDB was then loaded, and an 80 × 80 × 80 grid box with 0.375 Å grid spacing was placed around the point defined by the sulfur of the catalytic cysteine offset in the x direction by 16 Å. Electrostatic maps for the ligand were calculated based on this grid, and then the genetic algorithm was applied to search for the best predicted binding structure of the peptide. In each case a minimum of 2000 runs were attempted. Default parameters were used for the genetic algorithm with a few exceptions. First, population size was increased to 400, and the number of energy evaluations was set at a high number to allow for the maximum number of generations, which was set at 27,000. Autodock tools were then used to identify the best predicted binding pose. A two-dimensional ligand interaction diagram was prepared from the PDB file of the docked pose, as implemented by a two-dimensional interaction diagram program in MOE 2019.0101 (Chemical Computing Group).
Preparation of peptides to inhibit SHP2 function
A hexapeptide with phosphorylated tyrosine (DADEpYL) was synthesized and used as a competitive inhibitor for SHP2 in enzyme reactions. A peptide containing Ala in place of Asp at position −2 (DAAEpYL) was used as a control. These peptides were chemically synthesized by Genscript (Piscataway, NJ). For inhibition of SHP2 in cells, the peptides were conjugated with the Tat1-derived cell-penetrating peptide sequence (39) at the N terminus. To track cellular uptake, the peptides were further conjugated with FITC at the N terminus.
In vitro phosphatase activity assay
Purified PTP domains of SHP2 and SHP1 lacking the regulatory SH2 domains were diluted to a concentration of 5 nm with phosphatase reaction buffer (50 mm HEPES, 100 mm NaCl, and 2 mm EDTA, pH7.2). DiFMUP was used as an artificial substrate at a concentration of 20 μm or 35 μm, corresponding to the Km for SHP2 and SHP1, respectively (47). The DADEpYL or the DAAEpYL peptides at 100 nm to 2.64 mm in 2× serial concentration increase was used to assess the approximate concentration for 50% inhibition. GraphPad Prism was used to calculate the IC50 value. Ki was calculated based on the Cheng–Prusoff equation: IC50 = Ki(1 + [S]/Km).
Author contributions
Z. H. and Y. M. A. conceptualization; Z. H., W. J. G., and Y. M. A. data curation; Z. H., W. J. G., and Y. M. A. formal analysis; Z. H. and Y. M. A. supervision; Z. H. and Y. M. A. funding acquisition; Z. H. and W. J. G. validation; Z. H., W. J. G., and Y. M. A. investigation; Z. H., W. J. G., and Y. M. A. visualization; Z. H., W. J. G., and Y. M. A. methodology; Z. H. and Y. M. A. writing-original draft; Z. H. and Y. M. A. project administration; Z. H. and Y. M. A. writing-review and editing; W. J. G. and Y. M. A. resources.
Supplementary Material
This work was supported by NCI, National Institute of Health Grant CA213996 (to Y. M. A.). This work was also supported in part by a predoctoral fellowship (to Z. H.) from the DOD–CDMRP (Department of Defense - Congressionally Directed Medical Research Program) Breast Cancer Research Program. The authors declare that they have no conflicts of interest with the contents of this article. The content is solely the responsibility of the authors and does not necessarily represent the official views of the National Institutes of Health.
This article contains Figs. S1–S9.
- SHP2
- Src homology phosphatase 2
- RTK
- receptor tyrosine kinase
- EGFR
- epidermal growth factor receptor
- GAP
- GTPase-activating protein
- PTP
- phosphotyrosyl phosphatase
- AP
- affinity precipitation
- IB
- immunoblotting
- TM
- trapping mutant
- IP
- immunoprecipitation
- PDB
- Protein Data Bank (PDB) entry 2SHP
- DiFMUP
- difluoromethylumbelliferyl phosphate
- ERK
- extracellular signal-regulated kinase
- DM
- double mutant.
References
- 1. Agazie Y. M., and Hayman M. J. (2003) Molecular mechanism for a role of SHP2 in epidermal growth factor receptor signaling. Mol. Cell. Biol. 23, 7875–7886 10.1128/MCB.23.21.7875-7886.2003 [DOI] [PMC free article] [PubMed] [Google Scholar]
- 2. Ahmed Z., George R., Lin C. C., Suen K. M., Levitt J. A., Suhling K., and Ladbury J. E. (2010) Direct binding of Grb2 SH3 domain to FGFR2 regulates SHP2 function. Cell. Signal. 22, 23–33 10.1016/j.cellsig.2009.08.011 [DOI] [PubMed] [Google Scholar]
- 3. Hadari Y. R., Kouhara H., Lax I., and Schlessinger J. (1998) Binding of Shp2 tyrosine phosphatase to FRS2 is essential for fibroblast growth factor-induced PC12 cell differentiation. Mol. Cell. Biol. 18, 3966–3973 10.1128/MCB.18.7.3966 [DOI] [PMC free article] [PubMed] [Google Scholar]
- 4. Li J., Reed S. A., and Johnson S. E. (2009) Hepatocyte growth factor (HGF) signals through SHP2 to regulate primary mouse myoblast proliferation. Exp. Cell Res. 315, 2284–2292 10.1016/j.yexcr.2009.04.011 [DOI] [PMC free article] [PubMed] [Google Scholar]
- 5. Wu J. H., Goswami R., Cai X., Exum S. T., Huang X., Zhang L., Brian L., Premont R. T., Peppel K., and Freedman N. J. (2006) Regulation of the platelet-derived growth factor receptor-β by G protein–coupled receptor kinase-5 in vascular smooth muscle cells involves the phosphatase Shp2. J. Biol. Chem. 281, 37758–37772 10.1074/jbc.M605756200 [DOI] [PubMed] [Google Scholar]
- 6. Zhou X., and Agazie Y. M. (2009) Molecular mechanism for SHP2 in promoting HER2-induced signaling and transformation. J. Biol. Chem. 284, 12226–12234 10.1074/jbc.M900020200 [DOI] [PMC free article] [PubMed] [Google Scholar]
- 7. Feng G. S., Hui C. C., and Pawson T. (1993) SH2-containing phosphotyrosine phosphatase as a target of protein-tyrosine kinases. Science 259, 1607–1611 10.1126/science.8096088 [DOI] [PubMed] [Google Scholar]
- 8. Feng G. S., and Pawson T. (1994) Phosphotyrosine phosphatases with SH2 domains: regulators of signal transduction. Trends Genet 10, 54–58 10.1016/0168-9525(94)90149-X [DOI] [PubMed] [Google Scholar]
- 9. Hof P., Pluskey S., Dhe-Paganon S., Eck M. J., and Shoelson S. E. (1998) Crystal structure of the tyrosine phosphatase SHP-2. Cell 92, 441–450 10.1016/S0092-8674(00)80938-1 [DOI] [PubMed] [Google Scholar]
- 10. Cao M., Gao D., Zhang N., Duan Y., Wang Y., Mujtaba H., and Wang Y. (2019) Shp2 expression is upregulated in cervical cancer, and Shp2 contributes to cell growth and migration and reduces sensitivity to cisplatin in cervical cancer cells. Pathol. Res. Practice 215, 152621 10.1016/j.prp.2019.152621 [DOI] [PubMed] [Google Scholar]
- 11. Dardaei L., Wang H. Q., Singh M., Fordjour P., Shaw K. X., Yoda S., Kerr G., Yu K., Liang J., Cao Y., Chen Y., Lawrence M. S., Langenbucher A., Gainor J. F., Friboulet L., et al. (2018) SHP2 inhibition restores sensitivity in ALK-rearranged non–small-cell lung cancer resistant to ALK inhibitors. Nat. Med. 24, 512–517 10.1038/nm.4497 [DOI] [PMC free article] [PubMed] [Google Scholar]
- 12. Della Corte C. M., Gay C. M., Byers L. A., and Morgillo F. (2019) ILK and SHP2 expression identify a poor prognostic cohort of EGFR-mutant lung cancer. Ebiomedicine 39, 5–6 10.1016/j.ebiom.2018.12.008 [DOI] [PMC free article] [PubMed] [Google Scholar]
- 13. Sun X., Zhang J., Wang Z., Ji W., Tian R., Zhang F., and Niu R. (2017) Shp2 plays a critical role in IL-6–induced EMT in breast cancer cells. Int. J. Mol. Sci. 18, E395 10.3390/ijms18020395 [DOI] [PMC free article] [PubMed] [Google Scholar]
- 14. Wong G. S., Zhou J., Liu J. B., Wu Z., Xu X., Li T., Xu D., Schumacher S. E., Puschhof J., McFarland J., Zou C., Dulak A., Henderson L., Xu P., O'Day E., et al. (2018) Targeting wild-type KRAS-amplified gastroesophageal cancer through combined MEK and SHP2 inhibition. Nat. Med. 24, 968–977 10.1038/s41591-018-0022-x [DOI] [PMC free article] [PubMed] [Google Scholar]
- 15. Matalkah F., Martin E., Zhao H., and Agazie Y. M. (2016) SHP2 acts both upstream and downstream of multiple receptor tyrosine kinases to promote basal-like and triple-negative breast cancer. Breast Cancer Res. 18, 2 10.1186/s13058-015-0659-z [DOI] [PMC free article] [PubMed] [Google Scholar]
- 16. Zhou X., Coad J., Ducatman B., and Agazie Y. M. (2008) SHP2 is up-regulated in breast cancer cells and in infiltrating ductal carcinoma of the breast, implying its involvement in breast oncogenesis. Histopathology 53, 389–402 10.1111/j.1365-2559.2008.03103.x [DOI] [PubMed] [Google Scholar]
- 17. Aceto N., Sausgruber N., Brinkhaus H., Gaidatzis D., Martiny-Baron G., Mazzarol G., Confalonieri S., Quarto M., Hu G., Balwierz P. J., Pachkov M., Elledge S. J., van Nimwegen E., Stadler M. B., and Bentires-Alj M. (2012) Tyrosine phosphatase SHP2 promotes breast cancer progression and maintains tumor-initiating cells via activation of key transcription factors and a positive feedback signaling loop. Nat. Med. 18, 529–537 10.1038/nm.2645 [DOI] [PubMed] [Google Scholar]
- 18. Hanafusa H., Torii S., Yasunaga T., Matsumoto K., and Nishida E. (2004) Shp2, an SH2-containing protein-tyrosine phosphatase, positively regulates receptor tyrosine kinase signaling by dephosphorylating and inactivating the inhibitor Sprouty. J. Biol. Chem. 279, 22992–22995 10.1074/jbc.M312498200 [DOI] [PubMed] [Google Scholar]
- 19. Zhao H., and Agazie Y. M. (2015) Inhibition of SHP2 in basal-like and triple-negative breast cells induces basal-to-luminal transition, hormone dependency, and sensitivity to anti-hormone treatment. BMC Cancer 15, 109 10.1186/s12885-015-1131-2 [DOI] [PMC free article] [PubMed] [Google Scholar]
- 20. Zhou X. D., and Agazie Y. M. (2008) Inhibition of SHP2 leads to mesenchymal to epithelial transition in breast cancer cells. Cell Death Differ. 15, 988–996 10.1038/cdd.2008.54 [DOI] [PubMed] [Google Scholar]
- 21. Zhao H., Martin E., Matalkah F., Shah N., Ivanov A., Ruppert J. M., Lockman P. R., and Agazie Y. M. (2019) Conditional knockout of SHP2 in ErbB2 transgenic mice or inhibition in HER2-amplified breast cancer cell lines blocks oncogene expression and tumorigenesis. Oncogene 38, 2275–2290 10.1038/s41388-018-0574-8 [DOI] [PMC free article] [PubMed] [Google Scholar]
- 22. Chen L., Pernazza D., Scott L. M., Lawrence H. R., Ren Y., Luo Y., Wu X., Sung S.-S., Guida W. C., Sebti S. M., Lawrence N. J., and Wu J. (2010) Inhibition of cellular Shp2 activity by a methyl ester analog of SPI-112. Biochem. Pharmacol. 80, 801–810 10.1016/j.bcp.2010.05.019 [DOI] [PMC free article] [PubMed] [Google Scholar]
- 23. Chen L., Sung S. S., Yip M. L., Lawrence H. R., Ren Y., Guida W. C., Sebti S. M., Lawrence N. J., and Wu J. (2006) Discovery of a novel shp2 protein tyrosine phosphatase inhibitor. Mol. Pharmacol. 70, 562–570 10.1124/mol.106.025536 [DOI] [PubMed] [Google Scholar]
- 24. Hellmuth K., Grosskopf S., Lum C. T., Würtele M., Röder N., von Kries J. P., Rosario M., Rademann J., and Birchmeier W. (2008) Specific inhibitors of the protein tyrosine phosphatase Shp2 identified by high-throughput docking. Proc. Natl. Acad. Sci. U.S.A. 105, 7275–7280 10.1073/pnas.0710468105 [DOI] [PMC free article] [PubMed] [Google Scholar]
- 25. Yu Z.-H., Chen L., Wu L., Liu S., Wang L., and Zhang Z.-Y. (2011) Small molecule inhibitors of SHP2 tyrosine phosphatase discovered by virtual screening. Bioorg. Med. Chem. Lett. 21, 4238–4242 10.1016/j.bmcl.2011.05.078 [DOI] [PMC free article] [PubMed] [Google Scholar]
- 26. Zhang X., He Y., Liu S., Yu Z., Jiang Z. X., Yang Z., Dong Y., Nabinger S. C., Wu L., Gunawan A. M., Wang L., Chan R. J., and Zhang Z. Y. (2010) Salicylic acid based small molecule inhibitor for the oncogenic Src homology-2 domain containing protein tyrosine phosphatase-2 (SHP2). J. Med. Chem. 53, 2482–2493 10.1021/jm901645u [DOI] [PMC free article] [PubMed] [Google Scholar]
- 27. Barr A. J. (2010) Protein tyrosine phosphatases as drug targets: strategies and challenges of inhibitor development. Future Med. Chem. 2, 1563–1576 10.4155/fmc.10.241 [DOI] [PubMed] [Google Scholar]
- 28. Shultz L. D., Rajan V., and Greiner D. L. (1997) Severe defects in immunity and hematopoiesis caused by SHP-1 protein-tyrosine-phosphatase deficiency. Science 15, 302–307 10.1016/S0167-7799(97)01060-3 [DOI] [PubMed] [Google Scholar]
- 29. Agazie Y. M., and Hayman M. J. (2003) Development of an efficient “substrate-trapping” mutant of Src homology phosphotyrosine phosphatase 2 and identification of the epidermal growth factor receptor, Gab1, and three other proteins as target substrates. J. Biol. Chem. 278, 13952–13958 10.1074/jbc.M210670200 [DOI] [PubMed] [Google Scholar]
- 30. Hartman Z. R., Schaller M. D., and Agazie Y. M. (2013) The tyrosine phosphatase SHP2 regulates focal adhesion kinase to promote EGF-induced lamellipodia persistence and cell migration. Mol. Cancer Res. 11, 651–664 10.1158/1541-7786.MCR-12-0578 [DOI] [PMC free article] [PubMed] [Google Scholar]
- 31. Ren L., Chen X., Luechapanichkul R., Selner N. G., Meyer T. M., Wavreille A. S., Chan R., Iorio C., Zhou X., Neel B. G., and Pei D. (2011) Substrate specificity of protein tyrosine phosphatases 1B, RPTPalpha, SHP-1, and SHP-2. Biochemistry 50, 2339–2356 10.1021/bi1014453 [DOI] [PMC free article] [PubMed] [Google Scholar]
- 32. Barford D., Das A. K., and Egloff M. P. (1998) The structure and mechanism of protein phosphatases: insights into catalysis and regulation. Annu. Rev. Biophys. Biomol. Struct. 27, 133–164 10.1146/annurev.biophys.27.1.133 [DOI] [PubMed] [Google Scholar]
- 33. Hartman Z., Zhao H., and Agazie Y. M. (2013) HER2 stabilizes EGFR and itself by altering autophosphorylation patterns in a manner that overcomes regulatory mechanisms and promotes proliferative and transformation signaling. Oncogene 32, 4169–4180 10.1038/onc.2012.418 [DOI] [PMC free article] [PubMed] [Google Scholar]
- 34. Krieger E., and Vriend G. (2014) YASARA View-molecular graphics for all devices-from smartphones to workstations. Bioinformatics 30, 2981–2982 10.1093/bioinformatics/btu426 [DOI] [PMC free article] [PubMed] [Google Scholar]
- 35. Mohi M. G., and Neel B. G. (2007) The role of Shp2 (PTPN11) in cancer. Curr. Opin. Genet. Dev. 17, 23–30 10.1016/j.gde.2006.12.011 [DOI] [PubMed] [Google Scholar]
- 36. O'Reilly A. M., and Neel B. G. (1998) Structural determinants of SHP-2 function and specificity in Xenopus mesoderm induction. Mol. Cell. Biol. 18, 161–177 10.1128/MCB.18.1.161 [DOI] [PMC free article] [PubMed] [Google Scholar]
- 37. Tenev T., Keilhack H., Tomic S., Stoyanov B., Stein-Gerlach M., Lammers R., Krivtsov A. V., Ullrich A., and Böhmer F. D. (1997) Both SH2 domains are involved in interaction of SHP-1 with the epidermal growth factor receptor but cannot confer receptor-directed activity to SHP-1/SHP-2 chimera. J. Biol. Chem. 272, 5966–5973 10.1074/jbc.272.9.5966 [DOI] [PubMed] [Google Scholar]
- 38. Montalibet J., Skorey K. I., and Kennedy B. P. (2005) Protein tyrosine phosphatase: enzymatic assays. Methods 35, 2–8 10.1016/j.ymeth.2004.07.002 [DOI] [PubMed] [Google Scholar]
- 39. Borrelli A., Tornesello A. L., Tornesello M. L., and Buonaguro F. M. (2018) Cell penetrating peptides as molecular carriers for anti-cancer agents. Molecules 23, E295 [DOI] [PMC free article] [PubMed] [Google Scholar]
- 40. Barr A. J., Ugochukwu E., Lee W. H., King O. N., Filippakopoulos P., Alfano I., Savitsky P., Burgess-Brown N. A., Müller S., and Knapp S. (2009) Large-scale structural analysis of the classical human protein tyrosine phosphatome. Cell 136, 352–363 10.1016/j.cell.2008.11.038 [DOI] [PMC free article] [PubMed] [Google Scholar]
- 41. Cleghon V., Feldmann P., Ghiglione C., Copeland T. D., Perrimon N., Hughes D. A., and Morrison D. K. (1998) Opposing actions of CSW and RasGAP modulate the strength of Torso RTK signaling in the Drosophila terminal pathway. Mol. Cell 2, 719–727 10.1016/S1097-2765(00)80287-7 [DOI] [PubMed] [Google Scholar]
- 42. Yang J., Cheng Z., Niu T., Liang X., Zhao Z. J., and Zhou G. W. (2000) Structural basis for substrate specificity of protein-tyrosine phosphatase SHP-1. J. Biol. Chem. 275, 4066–4071 10.1074/jbc.275.6.4066 [DOI] [PubMed] [Google Scholar]
- 43. Milarski K. L., Zhu G., Pearl C. G., McNamara D. J., Dobrusin E. M., MacLean D., Thieme-Sefler A., Zhang Z. Y., Sawyer T., Decker S. J., Dixon J. E., and Saltiel A. R. (1993) Sequence specificity in recognition of the epidermal growth-factor receptor by protein-tyrosine Phosphatase-1b. J. Biol. Chem. 268, 23634–23639 [PubMed] [Google Scholar]
- 44. Tonks N. K. (2003) PTP1B: from the sidelines to the front lines!. FEBS Lett. 546, 140–148 10.1016/S0014-5793(03)00603-3 [DOI] [PubMed] [Google Scholar]
- 45. Morris G. M., Green L. G., Radić Z., Taylor P., Sharpless K. B., Olson A. J., and Grynszpan F. (2013) Automated docking with protein flexibility in the design of femtomolar “click chemistry” inhibitors of acetylcholinesterase. J. Chem. Inf. Model. 53, 898–906 10.1021/ci300545a [DOI] [PMC free article] [PubMed] [Google Scholar]
- 46. Vermeulen N. P. E., de Graaf C., van Lipzig M. M. H., and Feenstra A. F. (2004) Automated docking and molecular dynamics simulations of substrate binding in cytochromes P450. Drug Metab. Rev. 36, 15 [Google Scholar]
- 47. Chen L., Sung S. S., Yip M. L., Lawrence H. R., Ren Y., Guida W. C., Sebti S. M., Lawrence N. J., and Wu J. (2006) Discovery of a novel shp2 protein tyrosine phosphatase inhibitor. Mol. Pharmacol. 70, 562–570 10.1124/mol.106.025536 [DOI] [PubMed] [Google Scholar]
Associated Data
This section collects any data citations, data availability statements, or supplementary materials included in this article.