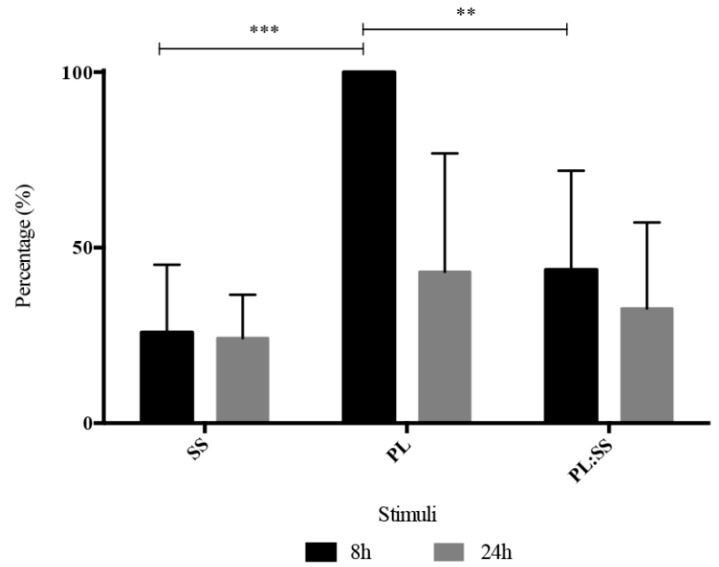
Figure 6.
WB analysis of Cyclin D1. Level of Cyclin D1 expression 8 and 24 h after stimulation of synchronized BMSC with SS, PL and with PL:SS. Results are expressed as percentage of the highest expression observed 8 h after stimulation with PL. Levels of Cyclin D1 expression were determined by Western Blot. We performed WB analysis on three different primary cell cultures, *** p < 0.001, ** p < 0.01.

