

Abstract
The increasing availability of large healthcare databases is fueling an intense debate on whether real-world data should play a role in the assessment of the benefit-risk of medical treatments. In many observational studies, for example, statin users were found to have a substantially lower risk of cancer than in meta-analyses of randomized trials. While such discrepancies are often attributed to a lack of randomization in the observational studies, they may be explained by flaws that can be avoided by explicitly emulating a target trial. Using the electronic health records of 733,804 UK adults, we emulated a target trial of statins and cancer and compared our estimates with those obtained using previously applied analytic approaches. Over the 10-year follow-up, 28,408 individuals developed cancer. Under the target trial approach, estimated observational analogs of intention-to-treat and per-protocol 10-year cancer-free survival differences were −0.5% (95% CI −1.0%, 0.0%) and −0.3% (95% CI −1.5%, 0.5%), respectively. By contrast, previous analytic approaches yielded estimates that appeared strongly protective. Our findings highlight the importance of explicitly emulating a target trial to reduce bias in the effect estimates derived from observational analyses.
Keywords: Causal inference, target trial, electronic health records, intention-to-treat analysis, inverse-probability weighting, per-protocol analysis
Randomized trials are the preferred approach to evaluate the benefit-risk of clinical interventions. However, randomized trials may not be feasible for all causal questions in all populations and, even when feasible, may not provide timely answers to inform clinical, policy, and regulatory decisions. The limitations of randomized trials to support decision making are most evident when the goal is to evaluate long-term harms and benefits or to estimate effects in subgroups of individuals. In these cases, the analysis of observational data provides an opportunity to generate evidence to inform decisions.1
Specifically, the increasing availability of large healthcare databases, combined with recent computational and analytic developments, is fueling an intense debate on whether observational data from electronic health records can play a role in the assessment of the benefit-risk of medical treatments.2–5 For example, the US Food and Drug Administration recently released a strategic framework for a Real-World Evidence Program to explore the use of observational data to support regulatory decisions about drug effectiveness.6
The debate has largely revolved around a key concern with observational studies that the treatment strategies under comparison are not randomly assigned, which could result in confounded effect estimates.5 That is, differences in risk between treatment groups may be explained by differences between the individuals in each group rather than by the effect of treatment. Careful measurement of and adjustment for major confounders can ameliorate, but never eliminate, this concern. As a result, when observational studies and randomized trials produce conflicting results, the discrepancy is often attributed to lack of randomization in the observational studies.
However, this emphasis on confounding often blinds critics to other fundamental, and ubiquitous, flaws in the analyses of observational data which can result in substantial selection bias and immortal time bias. Unlike lack of randomization, these flaws can be easily prevented by designing the observational analysis to explicitly emulate a (hypothetical) pragmatic target trial.7
Many observational studies, for example, have reported a lower cancer risk among statin users compared with nonusers.8–19 Some of these studies, published in leading journals, reported cancer risk reductions as large as 50-65%.9,12,15 Not only is the large magnitude of this apparent benefit implausible, but subsequent analyses of randomized trials suggested no effect of statins on cancer incidence.20,21 As expected, critics of the observational studies attributed their failure to confounding bias due to lack of randomization.22,23 However, confounding is unlikely to explain strong associations between a treatment (statin) and an outcome (cancer) that was not an intended effect of the treatment.24
Here we show that the failure of observational studies results from deviating from basic principles of study design rather than from lack of randomization. To do so, we implement a 4-step approach.
First, we specify the protocol of a target trial to estimate the effect of statins on cancer incidence among adults with low-density lipoprotein (LDL) cholesterol below 5 mmol/L. Table 1 summarizes the key components of the target trial protocol (see also Methods). Briefly, the eligibility criteria include age ≥30, no history of cancer, no statin contraindication, no statin prescription within the past year, and LDL cholesterol <5 mmol/L; and the treatment strategies to be compared are initiation of any statin therapy at baseline and continuation over follow-up until the development of a contraindication (hepatic impairment or myopathy) and no initiation of statin therapy over follow-up unless there is an indication (LDL cholesterol ≥5 mmol/L). Participants are followed for up to 10 years or until cancer diagnosis.
Table 1.
Specification and emulation of a target trial of statin therapy and cancer risk using CALIBER observational data
| Protocol component | Target trial specification | Target trial emulation |
|---|---|---|
| Eligibility criteria | • Age ≥30 between 1 January 1998 and 29 February 2016 • No history of cancer (except nonmelanoma skin cancer) • No statin contraindication (hepatic impairment or myopathy) • No statin prescription within the past year • LDL cholesterol <5 mmol/L • At least one year of up-to-standard data in a CPRD practice • At least one year of potential follow-up Baseline is defined as the first month in which all eligibility criteria are met. |
Same. We defined hepatic impairment as a code for hepatic failure or ALT ≥120 IU/L, and myopathy as codes for its symptoms: muscle aches, pain, or weakness. We also required information on lab values measured during the past year and on lifestyle factors during the past four years. |
| Treatment strategies | (1) Initiation of any statin therapy at baseline and continuation over follow-up until the development of a contraindication (hepatic impairment or myopathy) (2) No initiation of statin therapy over follow-up until the development of an indication (LDL cholesterol ≥5 mmol/L) When clinically warranted during the follow-up, patients and their physicians will decide whether to start, stop, or switch therapy. Participants must have a primary care consultation at least once every four years to assess prognostic factors associated with adherence. |
Same. We defined the date of medication initiation to be the first date of a prescription. We calculated discontinuation dates using the daily dose and quantity of pills in the prescription. We considered treatment to be continuous if there was a gap of less than 30 days between successive prescriptions. |
| Treatment assignment | Individuals are randomly assigned to a strategy at baseline and will be aware of the strategy to which they have been assigned. | We classified individuals according to the strategy that their data were compatible with at baseline and attempted to emulate randomization by adjusting for baseline confounders. |
| Outcomes | Total cancer and seven site-specific cancers: female breast, colorectal, hematological, melanoma, lung, prostate, urothelial. | Same. |
| Follow-up | Starts at baseline and ends at the month of first cancer diagnosis, death, loss to follow-up (transfer out of the practice or incomplete follow-up [four years after the last recorded confounder values]), 10 years after baseline, or administrative end of follow-up (end of practice data collection or 29 February 2016), whichever happens first. | Same. |
| Causal contrasts | Intention-to-treat effect. Per-protocol effect. |
Observational analog of intention-to-treat and per-protocol effect. |
| Statistical analysis | Intention-to-treat analysis. Per-protocol analysis: censor participants if and when they deviate from their assigned treatment strategy and apply inverse-probability weights to adjust for pre- and post-baseline prognostic factors associated with adherence. Subgroup analyses by baseline age, sex, and cardiovascular disease status. |
Same intention-to-treat and per-protocol analyses with sequential emulation and additional adjustment for baseline covariates. Same subgroup analyses. |
Abbreviations: ALT, alanine transaminase; CPRD, Clinical Practice Research Database; LDL, low-density lipoprotein.
Second, we use a large observational database to emulate this target trial of statins and cancer. We show that the effect estimates from the observational data are comparable to those from the randomized trials.
Third, we use the same observational data to replicate the analytic approach of a previous observational study that reported a substantially lower cancer risk among statin users compared with nonusers. We show that flaws in the analysis, in the form of deviations from an adequate target trial emulation, lead to the implausible estimates that were previously reported.12
Fourth, to show the generality of our approach, we repeated the analysis to emulate a target trial of statin therapy and type 2 diabetes (rather than cancer). We selected type 2 diabetes as an alternative outcome because the magnitude of the intention-to-treat effect of statins on diabetes is well established from randomized trials (odds ratio: 1.09, 95% CI 1.02, 1.17)25 and can therefore be used as a benchmark. We show that the target trial approach leads to observational estimates compatible with the known effect of statins on diabetes and that the same analytic flaws lead to implausible estimates for diabetes.
RESULTS
Emulating a target trial of statins and cancer
We explicitly emulated the target trial of statins and cancer (Table 1) using Clinical Practice Research Database (CPRD) primary care electronic health records accessed through the CALIBER resource.26,27 We mirrored each protocol component as closely as possible, with several modifications to accommodate the use of observational data. For example, to assess baseline confounders, we required information on lab values measured during the past year and lifestyle factors during the past four years. We classified individuals into two groups according to their prescription records at baseline. We assumed these groups were exchangeable at baseline conditional on the covariates in Table 2. The analysis proceeded as for the target trial, with additional adjustment for these baseline covariates (in an attempt to emulate randomization) and with sequential emulation (for statistical efficiency, see Methods).
Table 2.
Baseline characteristics of eligible individuals when emulating a target trial of statin therapy and cancer risk, CALIBER, 1999-2015*.
| Characteristic, mean (SD) or %† | Initiators (187,630) |
Non-initiators (12,923,081) |
|---|---|---|
| Age (years) | 64.1 (11.7) | 59.3 (13.8) |
| Female, % | 45 | 54 |
| Body mass index (kg/m2) | 29.1 (5.8) | 28.3 (5.8) |
| Smoking status, % | ||
| Never | 46 | 55 |
| Former | 34 | 29 |
| Current | 20 | 16 |
| Low-density lipoprotein cholesterol (mmol/L) | 3.3 (1.0) | 3.2 (0.8) |
| High-density lipoprotein cholesterol (mmol/L) | 1.4 (0.4) | 1.5 (0.4) |
| Coronary heart disease, % | 9 | 3 |
| Hypertension, % | 31 | 25 |
| Cerebrovascular disease, % | 2 | 1 |
| Other cardiovascular disease‡, % | 21 | 18 |
| Diabetes, % | 28 | 11 |
| Antihypertensive use§, % | 62 | 38 |
| Aspirin use, % | 28 | 9 |
| Hormonal replacement therapy, % of women | 2 | 2 |
| Oral contraceptive use, % of women | 2 | 4 |
| Referrals in the past three months, ≥2, % | 4 | 2 |
Baseline ranges from January 1999 to February 2015.
Each individual may contribute to more than one trial.
Includes acute rheumatic fever, chronic rheumatic heart disease, pulmonary heart disease, and other circulatory disease.
Includes all primary care prescriptions from British National Formulary chapters 2.2.1 thiazides and related diuretics, 2.2.3 potassium-sparing diuretics and aldosterone antagonists, 2.2.4 potassium-sparing diuretics with other diuretics, 2.4 beta-adrenoceptor blocking drugs, 2.5 hypertension and heart failure, 2.6.2 calcium-channel blockers.
Figure 1 shows a flowchart of participant selection, and Table 2 shows baseline characteristics of the 733,804 eligible individuals. Compared with statin non-initiators at baseline, statin initiators were, on average, older and had higher LDL cholesterol and BMI, and included more men, current smokers, antihypertensive and aspirin users, and individuals with cardiovascular disease and diabetes. Over the 10-year follow-up (mean 4 years), 28,408 individuals developed cancer, including 4,287 female breast, 3,091 colorectal, 2,770 hematological, 1,302 melanoma, 2,993 lung, 4,486 prostate, and 1,615 urothelial cancers.
Figure 1.
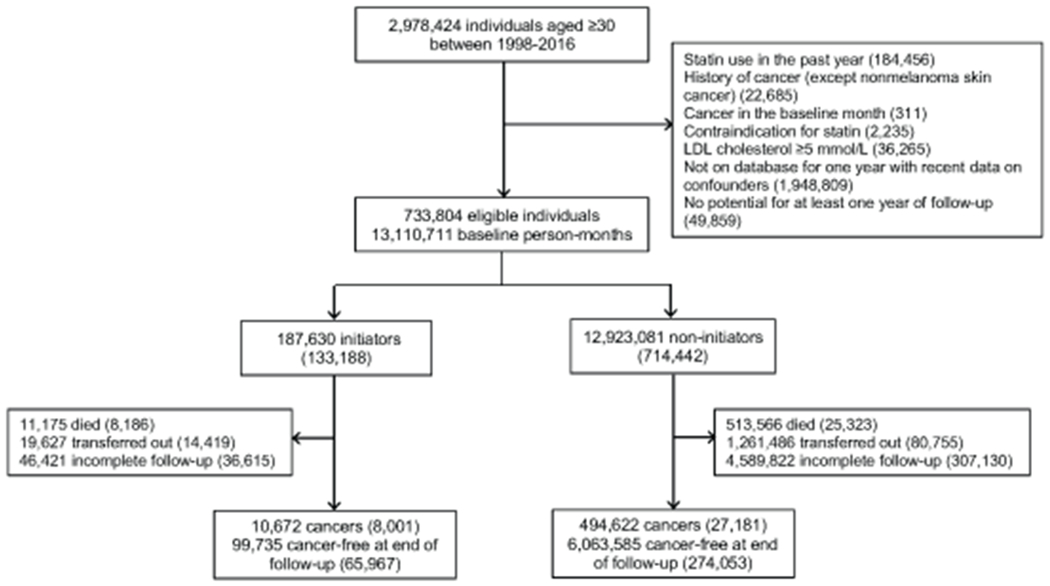
Flowchart for selection of eligible individuals from CALIBER when emulating a target trial of statin therapy and cancer risk, 1999-2016. Numbers in parentheses represent unique individuals in each group. Counts of initiator and non-initiator individuals do not sum to the total number of eligible individuals because some eligible individuals contributed to both groups in different nested emulated trials.
Table 3 shows the estimated 10-year cancer-free survival differences and hazard ratios for cancer comparing statins with no statins. The estimated observational analog of the intention-to-treat 10-year cancer-free survival difference was −0.5% (95% CI −1.0%, 0.0%) for total cancer, and ranged from −0.3% to 0.0% across cancer sites. The estimated observational analog of the per-protocol 10-year cancer-free survival difference was −0.3% (95% CI −1.5%, 0.5%) for total cancer, and ranged from −0.3% to 0.3% across cancer sites. Cancer-free survival curves under each strategy were almost overlapping (Figure 2). Estimates for total cancer were similar in subgroups defined at baseline by age, sex, and coronary heart disease status (Extended Data 1). Estimates were also similar under several sensitivity analyses for potential misclassification, residual confounding, and selection bias due to loss to follow-up (Extended Data 2–6).
Table 3.
Estimated 10-year standardized cancer-free survival differences and hazard ratios* for cancer comparing statin therapy with no statin therapy, CALIBER, 1999-2016.
| Number of incident cancers |
10-year survival difference (%) | 95% CI | Hazard ratio | 95% CI | ||
|---|---|---|---|---|---|---|
| Initiators† | Non-initiators† | |||||
| Intention-to-treat‡ | ||||||
| Total cancer | 8,001 | 27,181 | −0.5 | −1.0, 0.0 | 1.02 | 0.99, 1.05 |
| Breast, female | 859 | 4,166 | −0.1 | −0.5, 0.3 | 1.00 | 0.92, 1.09 |
| Colorectal | 893 | 2,958 | −0.1 | −0.3, 0.1 | 1.04 | 0.95, 1.13 |
| Hematological | 761 | 2,657 | 0.0 | −0.2, 0.2 | 0.96 | 0.88, 1.06 |
| Melanoma | 338 | 1,250 | −0.1 | −0.2, 0.1 | 1.06 | 0.93, 1.20 |
| Lung§ | 1,021 | 2,826 | −0.1 | −0.3, 0.1 | 1.08 | 0.99, 1.17 |
| Prostate | 1,344 | 4,263 | −0.3 | −0.7, 0.3 | 1.02 | 0.95, 1.09 |
| Urothelial | 564 | 1,522 | 0.0 | −0.2, 0.1 | 1.09 | 0.98, 1.21 |
| Per-protocol‖ | ||||||
| Total cancer | 5,834 | 20,626 | −0.3 | −1.5, 0.5 | 1.01 | 0.96, 1.06 |
| Breast, female | 603 | 3,465 | 0.0 | −0.7, 0.7 | 0.97 | 0.85, 1.11 |
| Colorectal | 643 | 2,224 | 0.0 | −0.4, 0.3 | 1.00 | 0.86, 1.16 |
| Hematological | 543 | 2,035 | 0.3 | −0.1, 0.6 | 0.84 | 0.71, 1.00 |
| Melanoma | 253 | 978 | −0.1 | −0.2, 0.2 | 1.16 | 0.88, 1.53 |
| Lung§ | 723 | 1,996 | −0.3 | −0.7, 0.1 | 1.13 | 0.96, 1.32 |
| Prostate | 993 | 3,179 | −0.3 | −1.2, 0.9 | 0.98 | 0.85, 1.13 |
| Urothelial | 414 | 1,059 | 0.1 | −0.3, 0.3 | 1.13 | 0.91, 1.41 |
Abbreviation: CI, confidence interval.
Adjusted for age, sex, BMI, smoking status, LDL cholesterol, HDL cholesterol, months since last measure of LDL, months since last measure of HDL, coronary heart disease, hypertension, cerebrovascular disease, other cardiovascular disease, diabetes, antihypertensive use, aspirin use, number of referrals in the past three months. Estimates for breast and colorectal cancer additionally adjusted for hormone replacement therapy and oral contraceptive use. Estimated survival differences were standardized to the joint distribution of the baseline covariates.
The number of events in the initiator and non-initiator groups do not sum to the total number of events because some individuals contributed as events to both groups in different nested emulated trials.
Comparing statin initiation at baseline with no statin initiation at baseline.
Non-small cell lung cancer.
Comparing statin initiation at baseline and continuation over follow-up unless contraindicated with no statin initiation over follow-up unless indicated.
Figure 2.
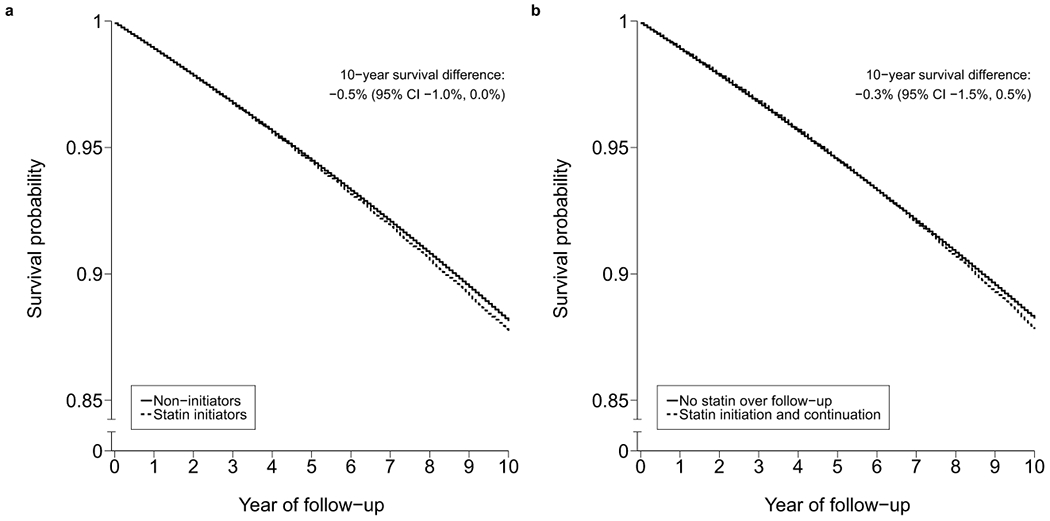
Standardized cancer-free survival curves comparing statin therapy with no statin therapy estimated by an observational analog to an (a) intention-to-treat analysis and (b) per-protocol analysis, CALIBER, 1999-2016.
Comparison with previous observational analyses
A previous observational study estimated an odds ratio for lung cancer of 0.23 (95% CI 0.20, 0.26) comparing long-term statin users (>4 years) with nonusers, which suggests a 77% lower risk of lung cancer among long-term statin users compared with nonusers.12
This study deviated from its corresponding target trial in two key ways. The investigators classified individuals based on their observed duration of statin therapy over follow-up (in this case, using postbaseline information to assign baseline treatment status). They also included individuals who were using statins before baseline (though they did not use pre-baseline therapy to quantify total duration of use). Other observational studies reporting implausible estimates deviated from their respective target trials in similar and additional ways.9,15
To assess the cumulative impact of these two deviations from the target trial on the estimates, we replicated them in our own data analysis with total cancer as the outcome. We assigned individuals to the initiator group if they used statins for >4 years over follow-up and to the non-initiator group if they never used statins. Additionally, we removed our eligibility criteria of no statin prescriptions within the past year and LDL cholesterol <5 mmol/L.
When we classified individuals based on their observed duration of statin therapy over follow-up, the estimated hazard ratio for total cancer was 0.22 (95% CI 0.21, 0.23) comparing statin use for >4 vs. 0 years. When we additionally included prevalent users at baseline, the corresponding hazard ratio was 0.23 (95% CI 0.22, 0.24). In contrast, the hazard ratios estimated under the target trial approach were close to null (1.02 intention-to-treat, 1.01 per-protocol). These analytic decisions led to similar estimates for lung cancer (0.26 [95% CI 0.23, 0.30] comparing statin use for >4 vs. 0 years, and 0.27 [95% CI 0.25, 0.29] when additionally including prevalent users).
Statins and diabetes
After specifying and emulating a target trial of statin therapy and type 2 diabetes (using the same observational data with an additional eligibility criterion of no history of diabetes), we estimated an intention-to-treat hazard ratio of 1.11 (95% CI 0.98, 1.25) comparing statins with no statins, which is close to the 1.09 estimate from a meta-analysis of randomized trials.25 After modifying the analysis to incorrectly classify individuals based on their observed duration of statin therapy (>4 vs. 0 years), the hazard ratio estimate was 0.2 (Extended Data 7). Estimates decreased with increasing observed duration of statin use.
DISCUSSION
After emulating a target trial using the electronic health records of 733,804 adults with up to 10 years of follow-up, we found little indication that statin therapy influences cancer incidence. This finding is consistent with meta-analyses of randomized trials.20,21 By contrast, after mimicking the approach of previous observational analyses,12 we found apparently protective estimates of an implausible magnitude.
A basic tenet of any trial, including a target trial emulated using observational data, is the alignment of eligibility and treatment assignment with time zero of follow-up (baseline).7 We replicated common flaws in observational analyses that unhitch treatment assignment from time zero by classifying individuals based on observed treatment duration over follow-up and including prevalent users at baseline. The former flaw resulted in a striking so-called protective estimate (hazard ratio for lung cancer: 0.26, 95% CI 0.23, 0.30), as in the previously published study (odds ratio: 0.23, 95% CI 0.20, 0.26),12 which is likely the result of immortal time bias, because classification as a long-term user necessitates having survived without cancer and remained under follow-up for a long time.7 The additional inclusion of prevalent users had a small influence on this estimate possibly because, as in the particular study whose analysis we replicated, pre-baseline statin use was not counted toward treatment duration. In general, the inclusion of prevalent users at baseline may contribute to selection bias, due to the selection of individuals who received treatment for some time before baseline and remained at risk and under follow-up at baseline.28
Our approach of explicitly specifying the protocol of the target trial and its observational emulation ensures synchronization of eligibility and treatment assignment with time zero, and therefore prevents these biases. This emulation approach has also helped to resolve randomized-observational discrepancies in other settings. A prominent example is the effect of estrogen plus progestin therapy on coronary heart disease among postmenopausal women in the US. Observational analyses found a lower risk among prevalent users compared with nonusers of hormone therapy at baseline,29 whereas a large randomized trial found a higher risk among women assigned to initiate hormone therapy vs. placebo, especially during the first year after initiation.30 A reanalysis of the observational data that emulated the randomized trial yielded similar intention-to-treat effect estimates, suggesting that the discrepancies were largely due to different analytic approaches rather than unmeasured confounding.31,32
Our study has several additional strengths. The size, follow-up, and breadth of data in the electronic health records allowed us to quantify the relation between statins and site-specific cancers in a population-based sample with adjustment for many potential confounders. The length of follow-up (up to 10 years with a mean 4 years) allowed us to capture slowly-progressing cancers. Also, our analytic approach allowed us to estimate both relative and absolute risks under sustained strategies that realistically depend on evolving clinical characteristics. We performed several sensitivity analyses to address potential misclassification, residual confounding, and selection bias. Lastly, our analyses of type 2 diabetes confirm that the target trial approach can reproduce effect estimates from trials for outcomes other than cancer, and that the same analytic flaws described above will result in severe bias for diabetes as well as for cancer.
Our study also had some limitations. A key challenge with the analysis of real-world data is that individuals are not randomly assigned to the treatment strategies under study, which may result in confounded effect estimates. To successfully emulate randomization, we need to adjust for all baseline confounders required to achieve comparability of the treatment groups. Because not much confounding by indication is expected for cancer outcomes, estimating the effect of statins on cancer seems a suitable aim for a study based on real-world data. We were also limited by our reliance on prescription records and diagnosis codes, which may contribute to measurement error and residual confounding. However, previous validation studies have confirmed a high proportion of recorded cancers (95%) and other diagnoses in our study data.33,34 We were unable to assess subtypes of site-specific cancers, which prevented us from studying the previously reported inverse association between statins and advanced, but not total, prostate cancer (relative risk: 0.77, 95% CI 0.64, 0.93).35 However, prostate cancers are expected to be more advanced at diagnosis in the UK compared with the US given the absence of a national screening program.36 Finally, CPRD does not capture the purchase of over-the-counter low-dose statins, which have been available since 2004. However, a nationally representative study reported that only 0.7% were using over-the-counter statins, of whom 72% were also using prescribed statins, and any related misclassification of non-initiators is therefore expected to be minimal.37
In summary, our findings suggest that statin therapy does not influence cancer incidence and that explicitly emulating a target trial helped us reduce the discrepancies between the effect estimates from observational analyses and randomized trials. Importantly, our analysis highlights the crucial role of factors other than randomization in explaining discrepant observational versus randomized effect estimates. Though obtaining better effect estimates from observational data is not necessarily helpful when effect estimates from randomized trials are available, analyses like ours provide general guidance for causal analyses of observational data when randomized trials are not yet, or will not be, available. In those cases, the choice is between making decisions based on sensible analyses of high-quality observational data and making decisions based on no human data.
METHODS
Protocol for target trial
We specified a target trial with the following protocol components (see also Table 1):
Eligibility criteria:
age ≥30 between 1 January 1998 and 29 February 2016, no history of cancer (except nonmelanoma skin cancer), no statin contraindication (hepatic impairment or myopathy), no statin prescription within the past year, LDL cholesterol <5 mmol/L, at least one year of up-to-standard data in a Clinical Practice Research Database (CPRD) practice, and at least one year of potential follow-up. Baseline is defined as the first month in which all eligibility criteria are met.
Treatment strategies.
The dynamic strategies to be compared are: (i) initiation of any statin therapy at baseline and continuation over follow-up until the development of a contraindication (hepatic impairment or myopathy), and (ii) no initiation of statin therapy over follow-up unless there is an indication (LDL cholesterol ≥5 mmol/L). When clinically warranted during the follow-up, patients and their physicians will decide whether to start, stop, or switch therapy. Participants must have a primary care consultation at least once every four years to assess prognostic factors associated with adherence.
Treatment assignment.
Individuals are randomly assigned to a strategy at baseline and will be aware of the strategy to which they have been assigned.
Outcomes.
The outcomes of interest are total cancer and seven site-specific invasive cancers: female breast, colorectal, hematological (leukemia, lymphoma), melanoma, lung (non-small cell), prostate, urothelial (bladder, ureters, renal pelvis).
Follow-up.
Each individual is followed from baseline until the month of first cancer diagnosis, death, loss to follow-up (transfer out of the practice or incomplete follow-up [four years after the last recorded confounder values]), 10 years after baseline, or administrative end of follow-up (end of practice data collection or 29 February 2016), whichever happens first.
Causal contrasts (i.e., estimands):
the intention-to-treat effect of being assigned to statin initiation vs. no initiation at baseline and the per-protocol effect of statin initiation and continuation over follow-up unless a contraindication develops vs. no initiation over follow-up unless an indication develops.
Statistical analysis:
Pooled logistic regression to estimate intention-to-treat and per-protocol effects via hazard ratios and standardized survival curves.
The intention-to-treat effect is estimated by fitting a pooled logistic regression model containing an indicator of assigned strategy and a flexible function of months since randomization (linear and quadratic terms). Given a low monthly risk of the outcome, the odds ratio from this model approximates a hazard ratio from a Cox model comparing those assigned to treatment initiation vs. no initiation.38
The per-protocol effect is estimated by fitting this pooled logistic regression model to the data after censoring participants if and when they deviate from their assigned treatment strategy. Specifically, participants in the initiator group are censored when they stop statins (in the absence of a contraindication) and participants in the non-initiator group are censored when they start statins (in the absence of an indication). Time-varying nonstabilized inverse-probability weights are used to adjust for the time-varying confounding that may occur when adherence depends on treatment history and shares common causes with the outcome.39 Participants who stop statins because of a contraindication or start statins because of an indication are not censored and their weights remain constant from that time until the end of follow-up.
Absolute risks under each strategy are estimated by fitting these pooled logistic regression models with an added product term between treatment and follow-up time. The predicted values from these models are used to estimate 10-year cancer-free survival under each strategy.
To identify potential subgroups of patients for whom the treatment strategies may be most beneficial, analyses are conducted separately in subsets of the study population defined at baseline according to age (<70 vs. ≥70 years), sex, and coronary heart disease status (yes vs. no).
Target trial emulation
We emulated this target trial using CPRD primary care electronic health records accessed through the CALIBER resource.26,27 The CPRD database includes approximately 7% of the UK population and patients are broadly representative of the UK general population in terms of age and sex.40 Data on demographics, lifestyle, symptoms, diagnoses, clinical examination findings, laboratory test results, referrals, and prescriptions are recorded by general practitioners. Diagnoses are recorded using Read terms, which map to The International Health Terminology Standards Development Organization Systematized Nomenclature of Medicine Clinical Terms (SNOMED-CT).41 Clinical phenotypes are derived using algorithms that combine information on diagnoses, symptoms, laboratory values, physiological measures, prescriptions, and procedures which are created and validated using an established methodology.42,43
Eligibility criteria.
We applied all eligibility criteria to individuals in CPRD who had lab values measured during the past year and lifestyle factors during the past four years. Figure 1 shows a flowchart of participant selection.
Treatment strategies.
We defined the date of medication initiation to be the first date of a prescription. We calculated discontinuation dates using the daily dose and quantity of pills in the prescription. We considered treatment to be continuous if there was a gap of less than 30 days between successive prescriptions.
Treatment assignment.
We classified individuals into two groups according to the strategy that their data were compatible with at baseline. We assumed groups were exchangeable at baseline conditional on baseline covariates: demographics (age, sex), lifestyle characteristics (BMI, smoking status), laboratory measurements (LDL and HDL cholesterol and time since their last measurement), diagnoses (coronary heart disease, hypertension, cerebrovascular disease, other cardiovascular disease, diabetes), concomitant medication use (antihypertensives, aspirin; hormone replacement therapy and oral contraceptives for breast and colorectal cancer analyses), and healthcare utilization (number of any referrals in the past three months).
Outcomes.
Cancer diagnoses were recorded as Read codes in primary care. Previous validation studies have confirmed a high proportion of cancers recorded in this database (95%).33
Follow-up.
Same as for the target trial.
Causal contrasts.
Observational analogs of the intention-to-treat and per-protocol effects.
Statistical analysis.
We emulated the target trial as a series of trials starting at each of the 194 months between January 1999 and February 2015, such that each individual may participate in multiple trials. This accommodates the fact that individuals may meet the eligibility criteria at several times over follow-up and is more statistically efficient than choosing just one of those times as time zero.44 We used pooled logistic regression to pool data over all 194 emulated trials and estimate intention-to-treat and per-protocol effects.
To estimate the intention-to-treat effect, we fit the pooled logistic regression model previously described but also including the baseline covariates. To estimate the per-protocol effect, the inverse probability weights were a function of time-varying covariates (updated values of the baseline covariates and an indicator for cancer at a site other than the one of interest for site-specific cancer analyses). We truncated estimated weights at their 99th percentile to prevent outliers from affecting our analyses. We standardized estimated survival probabilities to the joint distribution of the baseline covariates. See Extended Data 8 for details on covariates.
We used nonparametric bootstrapping with 500 samples to calculate percentile-based 95% confidence intervals for survival difference estimates, including all individuals in the initiator group and, for computational efficiency, a randomly sampled 10% of individuals in the non-initiator group. For hazard ratio estimates, we used robust variances to calculate conservative 95% confidence intervals.
Sensitivity analyses.
We assessed the robustness of our estimates to various analytic decisions. Specifically, we (1) increased the maximum gap between successive prescriptions from 30 to 60 days, (2) additionally adjusted for clinically-recorded physical activity, alcohol consumption, family history of cancer, practice region (at the Strategic Health Authority level), influenza vaccination in the past year, and cancer screening in the past year as potential confounders, (3) instead adjusted for ever-diagnosis with cardiovascular disease and diabetes by carrying forward indicators, (4) truncated weights at their 99.5th percentile, and (5) additionally applied weights for censoring due to loss to follow-up.
Comparison with previous observational analyses
We replicated the analytic approach of a previous observational study that reported a substantially lower cancer risk among statin users compared with nonusers. The estimated odds ratio of 0.23 (95% CI 0.20, 0.26) in this study suggests a 77% lower risk of lung cancer among long-term statin users (>4 years) compared with nonusers.12
This study deviated from its corresponding target trial in two key ways. First, the investigators classified individuals based on their observed duration of statin therapy over follow-up (in this case, using postbaseline information to assign baseline treatment status). Second, they included individuals who were using statins before baseline (though they did not use pre-baseline therapy to quantify total duration of use). Other observational studies reporting implausible estimates deviated from their respective target trials in similar and additional ways.9,15
To assess the cumulative impact of these two deviations from the target trial on the estimates, we implemented them sequentially in our own data analysis with total cancer as the outcome. First, we assigned individuals to the initiator group if they used statins for >4 years over follow-up and to the non-initiator group if they never used statins. Second, we additionally removed our eligibility criteria of no statin prescriptions within the past year and LDL cholesterol <5 mmol/L. We fit unweighted pooled logistic regression models to estimate hazard ratios adjusted for baseline and time-varying covariates.
Statins and diabetes
To show the generality of our approach, we repeated the analysis to emulate a target trial of statin therapy and type 2 diabetes (using the same data with an additional eligibility criterion of no history of diabetes) and also replicated the analytic flaws described above for this alternative outcome.
All analyses were conducted using SAS 9.4 (SAS Institute, Inc., Cary, NC, USA).
Details on models and inverse-probability weighting
Estimating the intention-to-treat hazard ratio.
In our target trial, the intention-to-treat effect is the effect of being assigned to treatment initiation vs. no initiation at baseline on the risk (or rate) of cancer. Estimating its observational analog requires adjustment for baseline confounders. To do this, we fit a pooled logistic regression model containing an indicator of observed treatment initiation and potential confounders measured in the baseline month of each emulated trial. Under the assumptions of no unmeasured confounding given the included covariates and a low monthly risk of the outcome within levels of those covariates, the exponentiated coefficient of the treatment indicator (i.e., exp(α1)) validly estimates the intention-to-treat hazard ratio (averaged over follow-up) that would be seen in a target trial with a similar adherence pattern as the CPRD data. Estimates were similar when we additionally applied inverse-probability weights to this model to adjust for potential selection bias due to loss to follow-up.
The overbar indicates the history of a covariate from the start of follow-up.
The superscript T indicates a transpose of a vector of parameters.
| Ym+t+1 | Indicator for the outcome of interest at month t+1 of monthly emulated trial m, where m=0,1,…,193 |
| α0,m+t | Time-varying intercept, estimated as a constant plus linear and quadratic terms for both the baseline month m and follow-up month t of the emulated trial |
| Am | Indicator for treatment group |
| Lm | Vector of potential confounders at the start of emulated trial m for each individual |
Estimating the per-protocol hazard ratio.
In our target trial, the per-protocol effect is the effect of adhering to the assigned treatment strategies on the risk (or rate) of cancer. Estimating it or its observational analog requires adjustment for baseline confounders and time-varying confounders.
First, we censored patients if and when they deviated from their assigned treatment strategy. That is, we censored patients in the initiator group when they discontinued statin therapy (unless a contraindication developed) and censored patients in the non-initiator group when they initiated statin therapy (unless an indication developed). We fit the below pooled logistic regression model to this censored data, additionally applying time-varying nonstabilized inverse-probability weights to adjust for time-varying confounding. We truncated weights at their 99th percentile to prevent outliers with extreme weights from affecting our estimates. Under the same assumptions described in the previous section, the exponentiated coefficient of the treatment indicator (i.e., exp(β1)) validly estimates the per-protocol hazard ratio.
The overbar indicates history of the variable.
The superscript T indicates a transpose of a vector of parameters.
| Ym+t+1 | Indicator for the outcome of interest at month t+1 of monthly emulated trial m, where m=0,1,…,193 |
| β0,m+t | Time-varying intercept, estimated as a constant plus linear and quadratic terms for both the baseline month m and follow-up month t of the emulated trial |
| Am | Indicator for treatment group |
| Lm | Vector of potential confounders at the start of emulated trial m for each individual |
Subject-specific time-varying nonstabilized inverse-probability weights.
Informally, the denominator of this weight at time t is the probability that an individual received her observed treatment history given her covariate history by t. The application of these weights creates a pseudo-population in which treatment is independent of the measured confounders at all time points.
To estimate the denominator, we fit two separate models to allow the probabilities to differ according to prior treatment status.
The first model was fit to person-months who were untreated in the previous month (i.e., Ak−1 = 0):
The second model was fit to person-months who were treated in the previous month (i.e., Ak−1 = 1):
Covariate history was summarized by baseline L0 and the most recent measurement of Lk.
Because we allowed a 30-day gap after the end of a treatment prescription, we excluded the first person-month after treatment initiation from the weight models (because the probability of treatment in that period was 1). Individuals stopped contributing to the weight models once they deviated from their assigned strategy for a clinically allowable reason (i.e., once someone in the initiator group developed a contraindication, and once someone in the non-initiator group developed an indication). The final weight for each individual at each time point was the product of the weights for that individual up until that time.
Estimating standardized survival curves and survival differences.
We estimated survival curves and 10-year survival differences by fitting the pooled logistic regression models described above with an added product term between treatment and time.
Intention-to-treat analysis:
Per-protocol analysis:
Point estimates were the same when including separate product terms for m and t. We used the predicted probabilities from these models to estimate the probability of survival at time m + t for individual i under strategy a, , conditional on the individual’s baseline confounders Li,m.
We standardized the survival probabilities at each time point to the empirical distribution of the confounders at baseline,
where n is the number of non-unique individuals in all monthly trials.
Extended Data
Extended Data 1.
Estimated hazard ratios* for cancer comparing statin therapy with no statin therapy, stratified by age, sex, and coronary heart disease status, CALIBER, 1999-2016.
| Intention-to-treat hazard ratio | 95% CI | Per-protocol hazard ratio† | 95% CI | |
|---|---|---|---|---|
| Subgroup | ||||
| Female | 0.99 | 0.95, 1.04 | 0.97 | 0.89, 1.05 |
| Male | 1.05 | 1.01, 1.09 | 1.04 | 0.97, 1.11 |
| Age <70 years | 0.99 | 0.95, 1.04 | 0.97 | 0.90, 1.06 |
| Age ≥70 years | 0.99 | 0.96, 1.03 | 0.95 | 0.89, 1.02 |
| Coronary heart disease | 0.95 | 0.87, 1.04 | 0.99 | 0.82, 1.19 |
| No coronary heart disease | 1.03 | 1.00, 1.06 | 1.01 | 0.96, 1.07 |
Abbreviation: CI, confidence interval.
Adjusted for age, sex, BMI, smoking status, LDL cholesterol, HDL cholesterol, months since last measure of LDL, months since last measure of HDL, coronary heart disease, hypertension, cerebrovascular disease, other cardiovascular disease, diabetes, antihypertensive use, aspirin use, number of referrals in the past three months.
Comparing statin initiation at baseline and continuation over follow-up unless contraindicated with no statin initiation over follow-up unless indicated.
Extended Data 2.
Sensitivity analysis with 60-day, rather than 30-day, maximum gap between successive prescriptions: Estimated hazard ratios* for cancer comparing statin therapy with no statin therapy, CALIBER, 1999-2016.
| Intention-to-treat hazard ratio | 95% CI | Per-protocol hazard ratio† | 95% CI | |
|---|---|---|---|---|
| Cancer incidence | ||||
| Total cancer | 1.03 | 1.00, 1.05 | 1.01 | 0.96, 1.06 |
| Breast, female | 0.99 | 0.92, 1.08 | 0.98 | 0.86, 1.11 |
| Colorectal | 1.05 | 0.97, 1.13 | 0.99 | 0.86, 1.14 |
| Hematological | 0.97 | 0.89, 1.06 | 0.86 | 0.73, 1.01 |
| Melanoma | 1.05 | 0.92, 1.19 | 1.19 | 0.93, 1.52 |
| Lung‡ | 1.09 | 1.01, 1.17 | 1.11 | 0.97, 1.28 |
| Prostate | 1.01 | 0.95, 1.08 | 0.97 | 0.86, 1.10 |
| Urothelial | 1.09 | 0.98, 1.21 | 1.12 | 0.92, 1.36 |
Abbreviation: CI, confidence interval.
Adjusted for age, sex, BMI, smoking status, LDL cholesterol, HDL cholesterol, months since last measure of LDL, months since last measure of HDL, coronary heart disease, hypertension, cerebrovascular disease, other cardiovascular disease, diabetes, antihypertensive use, aspirin use, number of referrals in the past three months. Estimates for breast and colorectal cancer additionally adjusted for hormone replacement therapy and oral contraceptive use.
Comparing statin initiation at baseline and continuation over follow-up unless contraindicated with no statin initiation over follow-up unless indicated.
Non-small cell lung cancer.
Extended Data 3.
Sensitivity analysis additionally adjusting for physical activity, alcohol consumption, family history of cancer, practice region, influenza vaccination in the past year, and cancer screening in the past year: Estimated hazard ratios* for cancer comparing statin therapy with no statin therapy, CALIBER, 1999-2016.
| Intention-to-treat hazard ratio | 95% CI | Per-protocol hazard ratio† | 95% CI | |
|---|---|---|---|---|
| Cancer incidence | ||||
| Total cancer | 1.00 | 0.95, 1.04 | 0.96 | 0.89, 1.04 |
| Breast, female | 1.02 | 0.89, 1.16 | 0.92 | 0.75, 1.14 |
| Colorectal | 1.00 | 0.87, 1.15 | 0.92 | 0.73, 1.16 |
| Hematological | 0.98 | 0.84, 1.15 | 0.79 | 0.61, 1.03 |
| Melanoma | 0.98 | 0.80, 1.22 | 1.02 | 0.69, 1.50 |
| Lung‡ | 1.09 | 0.96, 1.24 | 1.23 | 0.98, 1.56 |
| Prostate | 0.90 | 0.81, 1.01 | 0.80 | 0.66, 0.98 |
| Urothelial | 0.98 | 0.80, 1.19 | 0.93 | 0.66, 1.30 |
Abbreviation: CI, confidence interval.
Adjusted for age, sex, BMI , smoking status, LDL cholesterol, HDL cholesterol, months since last measure of LDL, months since last measure of HDL, coronary heart disease, hypertension, cerebrovascular disease, other cardiovascular disease, diabetes, antihypertensive use, aspirin use, number of referrals in the past three months. Estimates for breast and colorectal cancer additionally adjusted for hormone replacement therapy and oral contraceptive use.
Comparing statin initiation at baseline and continuation over follow-up unless contraindicated with no statin initiation over follow-up unless indicated.
Non-small cell lung cancer.
Extended Data 4.
Sensitivity analysis adjusting for ever-diagnosis with cardiovascular disease and diabetes by carrying forward indicators: Estimated hazard ratios* for cancer comparing statin therapy with no statin therapy, CALIBER, 1999-2016.
| Intention-to-treat hazard ratio | 95% CI | Per-protocol hazard ratio† | 95% CI | |
|---|---|---|---|---|
| Cancer incidence | ||||
| Total cancer | 1.02 | 0.99, 1.05 | 0.99 | 0.94, 1.05 |
| Breast, female | 1.00 | 0.92, 1.09 | 0.98 | 0.85, 1.12 |
| Colorectal | 1.04 | 0.95, 1.13 | 1.01 | 0.87, 1.18 |
| Hematological | 0.97 | 0.88, 1.07 | 0.85 | 0.72, 1.02 |
| Melanoma | 1.05 | 0.92, 1.19 | 1.12 | 0.83, 1.51 |
| Lung‡ | 1.07 | 0.99, 1.16 | 1.12 | 0.95, 1.31 |
| Prostate | 1.02 | 0.95, 1.09 | 0.94 | 0.81, 1.09 |
| Urothelial | 1.08 | 0.97, 1.20 | 1.08 | 0.86, 1.35 |
Abbreviation: CI, confidence interval.
Adjusted for age, sex, BMI , smoking status, LDL cholesterol, HDL cholesterol, months since last measure of LDL, months since last measure of HDL, coronary heart disease, hypertension, cerebrovascular disease, other cardiovascular disease, diabetes, antihypertensive use, aspirin use, number of referrals in the past three months. Estimates for breast and colorectal cancer additionally adjusted for hormone replacement therapy and oral contraceptive use.
Comparing statin initiation at baseline and continuation over follow-up unless contraindicated with no statin initiation over follow-up unless indicated.
Non-small cell lung cancer.
Extended Data 5.
Sensitivity analysis truncating weights at their 99.5th percentile: Estimated hazard ratios* for cancer comparing statin therapy with no statin therapy, CALIBER, 1999-2016.
| Per-protocol hazard ratio† | 95% CI | |
|---|---|---|
| Cancer incidence | ||
| Total cancer | 1.01 | 0.95, 1.08 |
| Breast, female | 0.97 | 0.83, 1.14 |
| Colorectal | 1.04 | 0.86, 1.27 |
| Hematological | 0.82 | 0.66, 1.01 |
| Melanoma | 1.13 | 0.77, 1.66 |
| Lung‡ | 1.14 | 0.94, 1.39 |
| Prostate | 1.00 | 0.84, 1.20 |
| Urothelial | 1.11 | 0.85, 1.46 |
Abbreviation: CI, confidence interval.
Adjusted for age, sex, BMI, smoking status, LDL cholesterol, HDL cholesterol, months since last measure of LDL, months since last measure of HDL, coronary heart disease, hypertension, cerebrovascular disease, other cardiovascular disease, diabetes, antihypertensive use, aspirin use, number of referrals in the past three months. Estimates for breast and colorectal cancer additionally adjusted for hormone replacement therapy and oral contraceptive use.
Comparing statin initiation at baseline and continuation over follow-up unless contraindicated with no statin initiation over follow-up unless indicated.
Non-small cell lung cancer.
Extended Data 6.
Sensitivity analysis additionally applying weights for censoring due to loss to follow-up: Estimated hazard ratios* for cancer comparing statin therapy with no statin therapy, CALIBER, 1999-2016.
| Intention-to-treat hazard ratio | 95% CI | Per-protocol hazard ratio† | 95% CI | |
|---|---|---|---|---|
| Cancer incidence | ||||
| Total cancer | 1.01 | 0.97, 1.05 | 1.00 | 0.92, 1.09 |
| Breast, female | 1.04 | 0.94, 1.17 | 0.95 | 0.75, 1.20 |
| Colorectal | 0.96 | 0.85, 1.07 | 0.99 | 0.78, 1.25 |
| Hematological | 1.03 | 0.89, 1.20 | 0.89 | 0.67, 1.16 |
| Melanoma | 0.88 | 0.71, 1.09 | 0.87 | 0.54, 1.41 |
| Lung‡ | 1.06 | 0.97, 1.16 | 1.20 | 0.93, 1.55 |
| Prostate | 0.97 | 0.86, 1.09 | 1.00 | 0.80, 1.25 |
| Urothelial | 1.13 | 0.96, 1.32 | 1.12 | 0.79, 1.59 |
Abbreviation: CI, confidence interval.
Adjusted for age, sex, BMI, smoking status, LDL cholesterol, HDL cholesterol, months since last measure of LDL, months since last measure of HDL, coronary heart disease, hypertension, cerebrovascular disease, other cardiovascular disease, diabetes, antihypertensive use, aspirin use, number of referrals in the past three months. Estimates for breast and colorectal cancer additionally adjusted for hormone replacement therapy and oral contraceptive use.
Comparing statin initiation at baseline and continuation over follow-up unless contraindicated with no statin initiation over follow-up unless indicated.
Non-small cell lung cancer.
Extended Data 7.
Estimated hazard ratios* and 95% confidence intervals for total cancer and type 2 diabetes comparing statin therapy with no statin therapy, when emulating a target trial and when replicating the approach of previous observational analyses, CALIBER, 1999-2016.
| Emulating a target trial | Replicating the approach of previous observational analyses: Classifying individuals by observed duration of statin use over follow-up (months)† | ||||||
|---|---|---|---|---|---|---|---|
| Intention-to-treat hazard ratio | 0 | >0 – 6 | >6 – 12 | >12 – 24 | >24 – 48 | >48 | |
| Total cancer | 1.02 (0.99, 1.05) | 1 | 1.00 (0.95, 1.05) | 0.92 (0.87, 0.98) | 0.88 (0.84, 0.93) | 0.58 (0.56, 0.61) | 0.22 (0.21, 0.23) |
| Type 2 diabetes‡ | 1.11 (0.98, 1.25) | 1 | 1.45 (1.38, 1.52) | 1.07 (1.01, 1.14) | 1.04 (0.99, 1.09) | 0.59 (0.56, 0.62) | 0.19 (0.18, 0.20) |
Abbreviation: CI, confidence interval.
Adjusted for age, sex, BMI, smoking status, LDL cholesterol, HDL cholesterol, months since last measure of LDL, months since last measure of HDL, coronary heart disease, hypertension, cerebrovascular disease, other cardiovascular disease, antihypertensive use, aspirin use, number of referrals in the past three months.
Estimates are from analyses excluding prevalent statin users at baseline.
We emulated a single target trial rather than a sequence of trials. To calculate percentile-based 95% confidence intervals, we used bootstrapping with 500 samples, including all individuals in the initiator group and, for computational efficiency, a randomly sampled 10% of individuals in the non-initiator group.
Extended Data 8.
Covariates used in the primary and sensitivity analyses when emulating a target trial of statin therapy and cancer risk, CALIBER, 1999-2016.
| Covariates | Functional form | Categories |
|---|---|---|
| Time-fixed | ||
| Age | Linear | N/A |
| Sex | Indicator | Female/Male |
| UK practice region | 10 categories | North East |
| North West | ||
| Yorkshire & The Humber | ||
| East Midlands | ||
| West Midlands | ||
| East of England | ||
| South West | ||
| South Central | ||
| London | ||
| South East Coast | ||
| Family history of cancer | Indicator | Yes/No |
| Month of baseline | Linear, quadratic | N/A |
| Time-varying | ||
| Month of follow-up | Linear, quadratic | N/A |
| BMI | Linear | N/A |
| Smoking status | 3 categories | Never |
| Former | ||
| Current | ||
| Physical activity | 2 categories | Inactive/Gentle |
| Moderate/Vigorous | ||
| Alcohol consumption | 5 categories | Non-drinker |
| Ex-drinker | ||
| Occasional/current drinker | ||
| Excess/binge drinker | ||
| Not specified | ||
| LDL cholesterol (and months since last measure) | Linear | N/A |
| HDL cholesterol (and months since last measure) | Linear | N/A |
| Coronary heart disease | Indicator | Yes/No |
| Hypertension | Indicator | Yes/No |
| Cerebrovascular disease | Indicator | Yes/No |
| Other cardiovascular disease | Indicator | Yes/No |
| Diabetes | Indicator | Yes/No |
| Cancer (at a site other than the one of interest) | Indicator | Yes/No |
| Antihypertensive use | Indicator | Yes/No |
| Aspirin use | Indicator | Yes/No |
| Hormone replacement therapy | Indicator | Yes/No |
| Oral contraceptive use | Indicator | Yes/No |
| Number of referrals in past three months | 3 categories | 0 |
| 1 | ||
| ≥2 | ||
| Influenza vaccination in past year | Indicator | Yes/No |
| Cancer screening in past year | Indicator | Yes/No |
Acknowledgements
This research was partly supported by NIH grant P01 CA134294. B.A.D. is supported by an ASISA Fellowship.
Footnotes
Competing interests
The authors declare no competing interests.
Data availability
This study is based in part on data from the Clinical Practice Research Datalink obtained under license from the UK Medicines and Healthcare products Regulatory Agency. The data are provided by patients and collected by the UK National Health Service (NHS) as part of their care and support. The interpretation and conclusions contained in this study are those of the authors alone. Because electronic health records are classified as sensitive data by the UK Data Protection Act, information governance restrictions (to protect patient confidentiality) prevent data sharing via public deposition. Data are available with approval through the individual constituent entities controlling access to the data. Specifically, the primary care data can be requested via application to the Clinical Practice Research Datalink (https://www.cprd.com).
Code availability
Access to the computer code used in this research is available by request to the corresponding author.
Ethical approval
The CPRD has been granted generic ethics approval for observational studies that make use of only anonymized data and linked anonymized National Health Service healthcare data (Multiple Research Ethics Committee ref. 05/MRE04/87). This study was approved by the Medicines and Healthcare Products Regulatory Agency Independent Scientific Advisory Committee (protocol 16_221, approved 14 February 2017).
Reporting summary
Further information on research design is available in the Life Sciences Reporting Summary linked to this article.
References
- 1.Hernán MA & Robins JM Using big data to emulate a target trial when a randomized trial is not available. Am J Epidemiol 183, 758–764, doi: 10.1093/aje/kwv254 (2016). [DOI] [PMC free article] [PubMed] [Google Scholar]
- 2.Soni PD et al. Comparison of Population-Based Observational Studies With Randomized Trials in Oncology. J Clin Oncol 37, 1209–1216, doi: 10.1200/JCO.18.01074 (2019). [DOI] [PMC free article] [PubMed] [Google Scholar]
- 3.Visvanathan K et al. Untapped Potential of Observational Research to Inform Clinical Decision Making: American Society of Clinical Oncology Research Statement. J Clin Oncol 35, 1845–1854, doi: 10.1200/JCO.2017.72.6414 (2017). [DOI] [PubMed] [Google Scholar]
- 4.Hemingway H et al. Big data from electronic health records for early and late translational cardiovascular research: challenges and potential. Eur Heart J 39, 1481–1495, doi: 10.1093/eurheartj/ehx487 (2018). [DOI] [PMC free article] [PubMed] [Google Scholar]
- 5.Gerstein HC, McMurray J & Holman RR Real-world studies no substitute for RCTs in establishing efficacy. Lancet 393, 210–211, doi: 10.1016/S0140-6736(18)32840-X (2019). [DOI] [PubMed] [Google Scholar]
- 6.Framework for FDA’s Real-World Evidence Program. (U.S. Food and Drug Administration, 2018). [Google Scholar]
- 7.Hernán MA, Sauer BC, Hernandez-Diaz S, Platt R & Shrier I Specifying a target trial prevents immortal time bias and other self-inflicted injuries in observational analyses. J Clin Epidemiol 79, 70–75, doi: 10.1016/j.jclinepi.2016.04.014 (2016). [DOI] [PMC free article] [PubMed] [Google Scholar]
- 8.Graaf MR, Beiderbeck AB, Egberts AC, Richel DJ & Guchelaar HJ The risk of cancer in users of statins. J Clin Oncol 22, 2388–2394, doi: 10.1200/JCO.2004.02.027 (2004). [DOI] [PubMed] [Google Scholar]
- 9.Poynter JN et al. Statins and the risk of colorectal cancer. N Engl J Med 352, 2184–2192, doi: 10.1056/NEJMoa043792 (2005). [DOI] [PubMed] [Google Scholar]
- 10.Friis S et al. Cancer risk among statin users: a population-based cohort study. Int J Cancer 114, 643–647, doi: 10.1002/ijc.20758 (2005). [DOI] [PubMed] [Google Scholar]
- 11.Chen MJ et al. Statins and the risk of pancreatic cancer in Type 2 diabetic patients--A population-based cohort study. Int J Cancer 138, 594–603, doi: 10.1002/ijc.29813 (2016). [DOI] [PubMed] [Google Scholar]
- 12.Khurana V, Bejjanki HR, Caldito G & Owens MW Statins reduce the risk of lung cancer in humans: a large case-control study of US veterans. Chest 131, 1282–1288, doi: 10.1378/chest.06-0931 (2007). [DOI] [PubMed] [Google Scholar]
- 13.Clancy Z et al. Statins and colorectal cancer risk: a longitudinal study. Cancer Causes Control 24, 777–782, doi: 10.1007/s10552-013-0160-x (2013). [DOI] [PubMed] [Google Scholar]
- 14.Pradelli D et al. Statins use and the risk of all and subtype hematological malignancies: a meta-analysis of observational studies. Cancer Med 4, 770–780, doi: 10.1002/cam4.411 (2015). [DOI] [PMC free article] [PubMed] [Google Scholar]
- 15.Shannon J et al. Statins and prostate cancer risk: a case-control study. Am J Epidemiol 162, 318–325, doi: 10.1093/aje/kwi203 (2005). [DOI] [PubMed] [Google Scholar]
- 16.Flick ED et al. Statin use and risk of colorectal cancer in a cohort of middle-aged men in the US: a prospective cohort study. Drugs 69, 1445–1457, doi: 10.2165/00003495-200969110-00004 (2009). [DOI] [PubMed] [Google Scholar]
- 17.Flick ED et al. Statin use and risk of prostate cancer in the California Men’s Health Study cohort. Cancer Epidemiol Biomarkers Prev 16, 2218–2225, doi: 10.1158/1055-9965.EPI-07-0197 (2007). [DOI] [PubMed] [Google Scholar]
- 18.Hoffmeister M, Chang-Claude J & Brenner H Individual and joint use of statins and low-dose aspirin and risk of colorectal cancer: a population-based case-control study. Int J Cancer 121, 1325–1330, doi: 10.1002/ijc.22796 (2007). [DOI] [PubMed] [Google Scholar]
- 19.Boudreau DM et al. The association between 3-hydroxy-3-methylglutaryl conenzyme A inhibitor use and breast carcinoma risk among postmenopausal women: a case-control study. Cancer 100, 2308–2316, doi: 10.1002/cncr.20271 (2004). [DOI] [PubMed] [Google Scholar]
- 20.Cholesterol Treatment Trialists, C. et al. Lack of effect of lowering LDL cholesterol on cancer: meta-analysis of individual data from 175,000 people in 27 randomised trials of statin therapy. PLoS One 7, e29849, doi: 10.1371/journal.pone.0029849 (2012). [DOI] [PMC free article] [PubMed] [Google Scholar]
- 21.Dale KM, Coleman CI, Henyan NN, Kluger J & White CM Statins and cancer risk: a meta-analysis. Jama 295, 74–80, doi: 10.1001/jama.295.1.74 (2006). [DOI] [PubMed] [Google Scholar]
- 22.Maisonneuve P & Lowenfels AB Statins and the risk of colorectal cancer. N Engl J Med 353, 952–954; author reply 952-954 (2005). [PubMed] [Google Scholar]
- 23.Setoguchi S, Avorn J & Schneeweiss S Statins and the risk of colorectal cancer. N Engl J Med 353, 952–954; author reply 952-954, doi: 10.1056/NEJMc051738 (2005). [DOI] [PubMed] [Google Scholar]
- 24.Miettinen OS The need for randomization in the study of intended effects. Stat Med 2, 267–271 (1983). [DOI] [PubMed] [Google Scholar]
- 25.Sattar N et al. Statins and risk of incident diabetes: a collaborative meta-analysis of randomised statin trials. Lancet 375, 735–742, doi: 10.1016/S0140-6736(09)61965-6 (2010). [DOI] [PubMed] [Google Scholar]
- 26.Denaxas SC et al. Data resource profile: cardiovascular disease research using linked bespoke studies and electronic health records (CALIBER). Int J Epidemiol 41, 1625–1638, doi: 10.1093/ije/dys188 (2012). [DOI] [PMC free article] [PubMed] [Google Scholar]
- 27.Denaxas S et al. UK phenomics platform for developing and validating electronic health record phenotypes: CALIBER. J Am Med Inform Assoc, doi: 10.1093/jamia/ocz105 (2019). [DOI] [PMC free article] [PubMed] [Google Scholar]
- 28.Robins JM, Hernán MA & Rotnitzky A Effect modification by time-varying covariates. Am J Epidemiol 166, 994–1002, doi: 10.1093/aje/kwm231 (2007). [DOI] [PubMed] [Google Scholar]
- 29.Grodstein F et al. Postmenopausal estrogen and progestin use and the risk of cardiovascular disease. N Engl J Med 335, 453–461, doi: 10.1056/NEJM199608153350701 (1996). [DOI] [PubMed] [Google Scholar]
- 30.Manson JE et al. Estrogen plus progestin and the risk of coronary heart disease. N Engl J Med 349, 523–534, doi: 10.1056/NEJMoa030808 (2003). [DOI] [PubMed] [Google Scholar]
- 31.Hernán MA & Robins JM Authors’ response, part I: observational studies analyzed like randomized experiments: best of both worlds. Epidemiology 19, 789–792, doi: 10.1097/EDE.0b013e318188e85f (2008). [DOI] [PMC free article] [PubMed] [Google Scholar]
- 32.Hernán MA et al. Observational studies analyzed like randomized experiments: an application to postmenopausal hormone therapy and coronary heart disease. Epidemiology 19, 766–779, doi: 10.1097/EDE.0b013e3181875e61 (2008). [DOI] [PMC free article] [PubMed] [Google Scholar]
- 33.Margulis AV et al. Validation of cancer cases using primary care, cancer registry, and hospitalization data in the United Kingdom. Epidemiology 29, 308–313, doi: 10.1097/EDE.0000000000000786 (2018). [DOI] [PMC free article] [PubMed] [Google Scholar]
- 34.Herrett E, Thomas SL, Schoonen WM, Smeeth L & Hall AJ Validation and validity of diagnoses in the General Practice Research Database: a systematic review. Br J Clin Pharmacol 69, 4–14, doi: 10.1111/j.1365-2125.2009.03537.x (2010). [DOI] [PMC free article] [PubMed] [Google Scholar]
- 35.Bonovas S, Filioussi K & Sitaras NM Statin use and the risk of prostate cancer: a meta-analysis of 6 randomized clinical trials and 13 observational studies. Int J Cancer 123, 899–904, doi: 10.1002/ijc.23550 (2008). [DOI] [PubMed] [Google Scholar]
- 36.Collin SM et al. Prostate-cancer mortality in the USA and UK in 1975–2004: an ecological study. Lancet Oncol 9, 445–452, doi: 10.1016/S1470-2045(08)70104-9 (2008). [DOI] [PMC free article] [PubMed] [Google Scholar]
- 37.Mainous AG 3rd, Baker R, Everett CJ & King DE Impact of a policy allowing for over-the-counter statins. Qual Prim Care 18, 301–306 (2010). [PubMed] [Google Scholar]
- 38.Thompson WA Jr. On the treatment of grouped observations in life studies. Biometrics 33, 463–470 (1977). [PubMed] [Google Scholar]
- 39.Hernán MA, Lanoy E, Costagliola D & Robins JM Comparison of dynamic treatment regimes via inverse probability weighting. Basic Clin Pharmacol Toxicol 98, 237–242, doi: 10.1111/j.1742-7843.2006.pto_329.x (2006). [DOI] [PubMed] [Google Scholar]
- 40.Herrett E et al. Data Resource Profile: Clinical Practice Research Datalink (CPRD). Int J Epidemiol 44, 827–836, doi: 10.1093/ije/dyv098 (2015). [DOI] [PMC free article] [PubMed] [Google Scholar]
- 41.O’Neil M, Payne C & Read J Read Codes Version 3: a user led terminology. Methods Inf Med 34, 187–192 (1995). [PubMed] [Google Scholar]
- 42.Morley KI et al. Defining disease phenotypes using national linked electronic health records: a case study of atrial fibrillation. PLoS One 9, e110900, doi: 10.1371/journal.pone.0110900 (2014). [DOI] [PMC free article] [PubMed] [Google Scholar]
- 43.Kuan V et al. A chronological map of 308 physical and mental health conditions from 4 million individuals in the English National Health Service. The Lancet Digital Health 1, e63–e77 (2019). [DOI] [PMC free article] [PubMed] [Google Scholar]
- 44.García-Albéniz X, Hsu J & Hernán MA The value of explicitly emulating a target trial when using real world evidence: an application to colorectal cancer screening. Eur J Epidemiol 32, 495–500, doi: 10.1007/s10654-017-0287-2 (2017). [DOI] [PMC free article] [PubMed] [Google Scholar]