Abstract
The volume and variety of manufactured chemicals is increasing, although little is known about the risks associated with the frequency and extent of human exposure to most chemicals. The EPA and the recent signing of the Lautenberg Act have both signaled the need for high-throughput methods to characterize and screen chemicals based on exposure potential, such that more comprehensive toxicity research can be informed. Prior work of Mitchell et al. using multicriteria decision analysis tools to prioritize chemicals for further research is enhanced here, resulting in a high-level chemical prioritization tool for risk-based screening. Reliable exposure information is a key gap in currently available engineering analytics to support predictive environmental and health risk assessments. An elicitation with 32 experts informed relative prioritization of risks from chemical properties and human use factors, and the values for each chemical associated with each metric were approximated with data from EPA’s CP_CAT database. Three different versions of the model were evaluated using distinct weight profiles, resulting in three different ranked chemical prioritizations with only a small degree of variation across weight profiles. Future work will aim to include greater input from human factors experts and better define qualitative metrics.
Introduction
Little is known about the risks associated with the life cycles of the vast majority of chemical compounds (Egeghy et al., 2012; Wilson & Schwarzman, 2009). Given that risk is a function of both hazard and exposure, this uncertainty stems from the paucity of reliable information regarding the toxicity, and even greater uncertainty about the frequency and extent of an individual’s contact with a specific compound given typical utilizations of that chemical (e.g., cosmetics, cleaning products, etc.) and individuals’ use patterns given the intended utilization (herein “human factors”). Before passage of the Toxic Substances Control Act of 1976 (TSCA), chemicals entered commerce without formal risk assessment. Since then, the decision regarding the entry of a new chemical into commerce has relied on screening-level risk assessment, a simplified method of risk assessment that can be conducted with limited data and seeks to address uncertainty by conservatively overestimating a chemical’s risk. Upon entry into the marketplace, however, the approved chemical may be used for purposes other than for which it is approved. The Lautenberg Act, signed by President Obama in June 2016, mandates risk assessments for the 85,000 chemicals in the TSCA inventory. The Act requires detailed risk information for chemicals if they are identified as high priority, lacking information, one of TSCA’s 83 potential candidates for risk assessment designated as “work plan” chemicals, or company-requested chemicals. As of the time of the legislation’s signing, less than 2% of chemicals that fit into these categories have detailed risk information associated with them in TSCA. The need for an efficient and comprehensive method for screening and assessing these chemicals is now even more pertinent (Denison, 2016). A variety of high-resolution, high-throughput tools are under development within the EPA. They range from those already targeting the chemical toxicity and potential human exposure for data-poor chemicals to filling data gaps with read-across methods like GenRA (Shah, Liu, Judson, Thomas, & Patlewicz, 2016). A database that would integrate chemical, exposure, and bioactivity information about a particular chemical—currently known as the RapidTox Dashboard—is also in development and a beta is expected to be released soon (Crofton, 2016). However, few tools currently exist that are able to provide an appropriate level of detail to prioritize future study at nominal cost in terms of time and money for evaluating large numbers of chemicals (Csiszar et al., 2016).
Addressing the need of the federal, state, and other agencies to protect human health and safety in this data-poor environment, high-throughput methods are being developed to characterize and screen chemicals based on exposure potential, with the intention of guiding more comprehensive exposure and toxicity research. However, the analytics to support risk assessments often lack reliable exposure information, so they often default to broad assumptions based on a chemical’s inherent properties, for example, assuming that a persistent and bioaccumulating chemical will have the highest exposure potential. To address this analytics gap, we present a refinement of one such method that builds on prior high-throughput screening efforts (Mitchell et al., 2013) to combine exposure and toxicity considerations with input from subject-matter experts in both human factors and physicochemical properties using multicriteria methods and a web-based expert elicitation protocol. This was done by eliciting expert opinion on the relative importance of a suite of human and physicochemical factors for prioritizing toxicity research on manufactured chemicals. In fact, an ancillary area of methodological research of this investigation was the translation of EPA’s expert elicitation guidelines (U.S. Environmental Protection Agency Office of the Science Advisor, 2012) to a virtual, webinar format. The EPA guidance was exclusively directed to face-to-face, on-site formats. As such, a system consisting of read-ahead materials and an interactive instrument was developed in preparation of the webinars (see Online Appendix 2). Results of a case study with the completed tool are presented using a previously defined 51-chemical sample.
Background
The amount and variety of chemicals manufactured have been steadily increasing, resulting in human exposure through air, food, water, and product usage (Wilson & Schwarzman, 2009). Although manufactured chemical use continues to increase in all sectors of the economy, there are gaps in available exposure and toxicity data that limit efforts to identify those chemicals that may pose the greatest threats to human and ecological health (Egeghy et al., 2012). Reliable data are limited for even common chemicals used in everyday products (e.g., cleaning agents, air fresheners) concerning human exposure potential. The lack of resources needed for chemical assessment has driven the need to prioritize which chemicals to assess more thoroughly.
The U.S. EPA Office of Chemical Safety and Pollution Prevention has been developing and augmenting methods for the prioritization of existing chemicals for risk assessment via the use of more reliable exposure information to complement existing hazard information and increasingly available high-throughput toxicity screening results. Recently, the Office of Chemical Safety and Pollution Prevention performed a prioritization to identify 83 “TSCA Work Plan Chemicals” as potential risk assessment candidates, using stakeholder input to establish both screening criteria and data sources. In a two-step process, chemicals were assessed on the basis of their exposure potential, hazard, persistence, and bioaccumulation. The first step involved the identification and selection of 1,235 chemicals meeting one or more criteria, primarily known reproductive or developmental effects; persistent, bioaccumulative, and toxic (PBT) properties; known carcinogenicity; and presence in children’s products. The number of chemicals was narrowed to 345 potential candidates once those not regulated under the TSCA and those with physical and chemical characteristics that do not generally present health hazards were excluded. The second step employed a linear-additive multicriteria decision analysis model (Section 2.1) to score each chemical based on three characteristics: hazard, exposure, and persistence or bioaccumulation. Of the 345 candidates, chemicals that scored highest were identified as work plan chemicals, while those that could not be scored as the result of lacking data were identified as candidates for further data gathering (Mitchell et al., 2013).
To address the much needed ability for chemical prioritization on data-poor chemicals, the EPA’s Office of Research and Development launched the ExpoCast (Rapid Chemical Exposure & Dose Research | Safer Chemicals Research | US EPA, 2016) program to advance development of novel methodologies for evaluating chemicals based on their biologically relevant potential for human exposure. Combined with toxicity information from ToxCast (Richard et al., 2016), a complementary program, the EPA will be able to screen and prioritize chemicals based on cutting-edge experimental and computational methodologies. The ExpoCast model challenge (U.S. Environmental Protection Agency Office of the Science Advisor, 2012) was organized, challenging several scientists to develop their own exposure-based prioritization methods on a small set of well-characterized chemicals. The results of the model challenge pointed to the need for transparent, rigorous methods that are amenable to incorporating varied types of information. A team from the U.S. Army Engineer Research & Development Center (ERDC) was asked to develop a prioritization tool using methods from the field of decision analysis, drawing upon parameters used in the other exposure screening models, notably (Mitchell et al., 2013). A virtual expert elicitation was conducted using a web-based survey tool that walked individuals through the process of weighting a multicriteria decision analysis model of exposure risk.
Multi-Criteria Decision Analysis
Multicriteria decision analysis (MCDA) (Belton & Stewart, 2002; Keeney & Raiffa, 1976; Linkov & Moberg, 2012) is a suite of tools that can help to support complex decisions that require consideration of multiple factors. MCDA methods are rooted in risk and decision science, providing a systematic and analytical approach for integrating potentially disparate sources of information while acknowledging uncertainty and risk preferences. Using MCDA, decisionmakers are better able to address the uncertainty and potentially conflicting objectives by evaluating, rating, and comparing different alternatives, based on multiple criteria, combining both qualitative and quantitative data and information sources. MCDA aims to provide decisionmakers with clarity as to the nature of the tradeoffs inherent in their decision problems through the evaluation and relative prioritization of alternatives. Applications of MCDA are increasing and span across interdisciplinary risk management issues in scientific and technical domains (Collier, Trump, Wood, Chobanova, & Linkov, 2016; Kurth, Larkin, Keisler, & Linkov, 2017; Malloy, Trump, & Linkov, 2016), from alternative assessments (Malloy et al., 2017) in broadly defined risk-based decision making to specific applications in infrastructure (Karvetski, Lambert, & Linkov, 2009) and economics (Linkov et al., 2006) to policy making and environmental science (Cegan, Filion, Keisler, & Linkov, 2017; Kiker, Bridges, Varghese, Seager, & Linkov, 2005).
Present Effort
The present effort advances the work of Mitchell et al. (2013) in developing models useful for high-throughput exposure assessment for chemical prioritization. They identified two needs: (1) characterizing the most important physicochemical and human factors that increase the likelihood of exposure; and (2) weighting those factors based on expert judgment. To meet those needs, this study provides a decision analytic framework (Belton & Stewart, 2002; Keeney & Raiffa, 1976; Linkov & Moberg, 2012) for identifying chemicals for further risk-based screening in a high-throughput manner (Mitchell et al., 2013). The development of a high-level, initial screening tool using MCDA is detailed later.
Methods
Decision Model
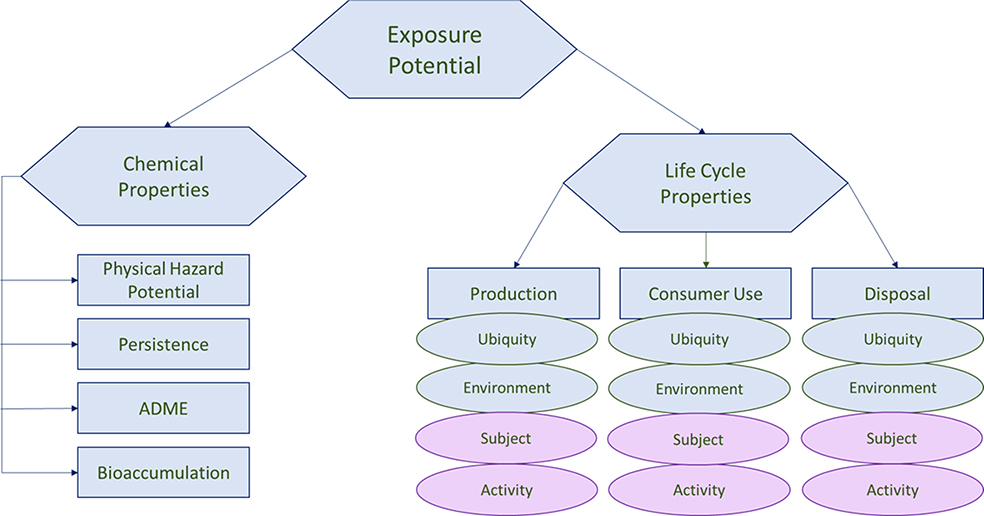
The decision model from Mitchell et al. (2013) was improved in several ways (Fig. 1). Chemical property metrics related to chemical properties, or the properties of a chemical that contribute to the exposure potential for human beings, were unchanged for this iteration, but data used to assess each chemical on these properties were reviewed for accuracy and completeness. As a result, 42 of 51 chemicals were retained for further analysis. Next, the half of the model dedicated to life cycle properties, or the characteristics of a chemical’s use throughout its life ranging from production to disposal, has been enhanced (Table I). Each chemical’s exposure potential is described in terms of its chemical properties and by its life cycle properties, shown in detail in Fig. 1. The life cycle properties metrics, however, were edited to reflect additional considerations. Life cycle properties are defined by exposure potential at three major stages in the life cycle: production, consumer use, and disposal. Production refers to the stage in the chemical-producing process that results in human exposure; consumer use refers to the stage in the chemical or product use period that results in human exposure; and disposal refers to the stage in the product or product receptacle disposal that results in human exposure. Metrics that could be used to define exposure in each of the life cycle stages were then determined, fitting in four distinct categories: ubiquity, or how widespread the chemical is; activity, or how the physical activity performed when using the chemical affects exposure; subject, or how physiological and social characteristics of the anticipated user affect exposure; and environment, or how chemical use affects human exposure via environmental pathways. These criteria are further defined in Online Appendix 1. Although life cycle property metrics were approximated by subject-matter experts, the model’s core taxonomy is a synthesis of prior attempts at identifying and categorizing chemical exposure factors (Egeghy, Vallero, & Cohen Hubal, 2011; Mitchell et al., 2013).
Figure 1.
Model developed to assess exposure potential. The elements in blue are taken from Mitchell et al. (2011). New elements are in pink.
Table 1:
Criteria and Definitions from the Web Survey
| Criterion | Definition |
|---|---|
| Chemical properties | Properties of a chemical that contribute to the exposure potential for human beings. |
| Physical hazard potential | Assessed in terms of flammability and reactivity. Thresholds as established by NFPA 0–7. |
| Persistence | Assessed in terms of chemical half-lives in soil, sediment, air, and water. Thresholds established by (1) EPA: Design for the Environment Program Alternatives; (2) Clean Production Action: The Green for Safer Chemicals Version 1.0. |
| ADME | Assessed in terms of the human body's ability to absorb (A), distribute (D), metabolize (M), and excrete (E) the chemical. Thresholds and values derived using QikProp v3.0, based on 24-hour exposure period. |
| Bioaccumulation | Assessed in terms of bioconcentration factor (BCF), octanol–water partition coefficient (Kow), and/or molecular weight. Thresholds established by (1) EPA: Design for the Environmental Program Alternatives; (2) Clean Production Action: The Green Screen for Safer Chemicals Version 1.0; and (3) Euro Chlor: Bioaccumulation: Definitions and Implications. |
| Life cycle properties | The characteristics of a chemical's use throughout its life, ranging from production to product end-of-life. |
| Production | Factors in production that create potential for exposure in human beings. |
| Consumer use | Factors in consumer use that create potential for exposure in human beings. |
| Disposal | Factors in disposal that create potential for exposure in human beings. |
| Human use metrics | Factors associated with exposure potential for each of the life cycle stages. |
| Ubiquity | How widespread the use of the chemical is in the (production, consumer use, disposal) life cycle area. |
| Environment | The external environment of use in the (production, consumer use, disposal) life cycle area. |
| Subject | Characteristics about the expected subject (user) of the chemical in the (production, consumer use, disposal) life cycle stage. |
| Activity | The physical activities when using the chemical that influence exposure in the (production, consumer use, disposal) life cycle area. |
Note: Subcriteria are indented.
The exposure score E for chemical or product alternative a is calculated as:
where ai is the score of alternative a on criterion i evaluated on the basis of some metric (e.g., Kow) f(ai) is the value function that normalizes the score based on its minimum and maximum values on a scale [0,1] with higher scores indicating potentially greater risk and need for screening, and w1 is our preference for considering risk(s) from criterion i relative to other criteria. All wi are subject to the constraint ∑wi = 1 for each tier of the model, and weights across levels of the value hierarchy are combined by multiplying each child weight by its parent until a single vector of i weights is remaining, thus complying with the form above. The resulting exposure score E(a) ranges on a scale [0,1) where higher values indicate greater potential for exposure and greater likelihood of subsequent hazard.
Expert Elicitation
A convenience sample of experts in human and physiochemical exposure factors was identified through professional connections of the fourth and eighth authors and contacted with the request that they take part in a web survey for a project conducted by the EPA and U.S. Army Corps of Engineers. They were sent materials explaining the goals of the project, the process of expert elicitation, and instructions on how to navigate the website for the survey. A total of 32 experts completed the web survey. In terms of organizational affiliation, six reported their affiliation as EPA, 14 reported their affiliation as non-EPA, and 12 did not disclose. Concerning expertise, 20 self-identified as experts in chemical properties, three as human factors experts, and the remaining nine selected “other” or did not answer the question. This sample size is on the order employed by other expert elicitation research (Bridges et al., 2013; U.S. Environmental Protection Agency Office of the Science Advisor, 2012; Wood, Kovacs, Bostrom, Bridges, & Linkov, 2012).
The survey asked experts to use the Max100 method for assigning relative preference. The Max100 method of elicitation was used as it has been shown to have a high level of reliability and has been reported as being easier and simpler to use than comparable elicitation methods (Bottomley & Doyle, 2001). Participants were first asked to rank the decision model criteria in order of importance, and then to assign a score of 100 to the top criteria. Remaining criteria within each segment of the model were then assigned a score from 0 to 99, expressing how much less that criterion was valued in comparison to the top-ranked criterion. At each stage they were allowed to insert comments explaining how they chose to rank the criteria, and each of the criteria included a definition to reduce confusion (Table I). Pop-ups were embedded into the survey that reminded participants of definitions for each criteria, and data validation controls were put in place to ensure that each participant understood and provided information consistent with the Max100 approach.
At the conclusion of the survey, participants were given space to report their comments or concerns about the survey and asked to report additional criteria to be considered. Experts were first asked to compare the importance of chemical properties and life cycle properties in evaluating human exposure. They were then asked to compare subcriteria of chemical properties (physical hazard potential, persistence, bioaccumulation, and ADME) and life cycle properties subcriteria (production, consumer use, and disposal). Finally, experts were asked to compare ubiquity, environment, subject, and activity in each of the life cycle properties subcriteria (Fig. 1).
Of the 32 experts, two did not follow instructions for the Max100 method. The first provided a score of 100 for one criterion in each cluster and gave no value or a value of zero for others. The second provided scores that summed to 100. Since it was unclear in both cases what their intent would have been if using the Max100 method properly, their data were discarded. Two additional experts did not provide weights for life cycle properties data, their other scores were retained. From the remaining responses normalized weights for each criterion and subcriterion were calculated reflecting relative preference for each criterion/subcriterion. Though a small subset of the interviewees deviated from the instructions, this does not suggest that this deviation factors a stable direction of influence into the results. The job of the expert is to provide his or her best professional judgment in lieu of firm quantitative evidence, and we do not believe any stability would be gained by removing the deviated data from the rest of the sample.
Human Factors Metrics
Mitchell et al. defined metrics measuring chemical ubiquity and activity for the three life cycle stages; however, no metrics had been created to evaluate chemical subject and environment. Thus, this update of the Mitchell et al. model includes an additional three metrics that capture both subject and environmental effects on exposure for each of the life cycle stage subcriteria. To encapsulate the effects of subject on exposure, a count of the number of use categories from U.S. EPA’s CPCat (Dionisio et al., 2015) was used to estimate the number of different contexts in which a subject might come into contact with the chemical in question. Metrics were developed to assess general likelihood of exposure based on potential uses (category count), and to measure exposure specifically to babies and children by counting the number of occurrences of Baby_use and Child_use categories for each chemical. These counts were tabulated for each life cycle stage are described in Table II.
Table 2:
Description of New Metrics and Their Relationship to Each Life Cycle Stage
| Metric (Metric Category) | Definition | Production, Consumer Use, Disposal |
|---|---|---|
| Category Count (Subject) | To account for chemical activity, a count of the number of instances in each relevant category is used here. | • P: count all categories • C: count all use categories • D: count all categories where a significant amount of chemical will be disposed |
| Baby_use and Child_use Count (Subject) | To account for exposure to sensitive populations, the number of child-centric use categories are counted. | • P: n/a • C: count of Baby_use or Child_use • D: n/a |
| Type of Space (Environment) | • (1) Present primarily in an outdoor space. • (2) Present primarily in a large indoor space. • (3) Present primarily in a small indoor space. |
• P: Default value of “2” • C: Default value of “3” • D: Default value of “1” |
For environment, the type of space metric (Table II) assumes default values for each stage in the life cycle, which means that the values qualitatively selected for that part of the model do not differ chemical to chemical. Production is always assumed to occur in a large indoor space, such as a manufacturing facility; consumer use is always assumed to occur in a small indoor space, such as a home; and disposal is always assumed to occur outdoors. Although we understand that these assumptions will not be true for each chemical, we were unable to devise a way to identify the chemicals that stray from these assumptions without further guidance. However, we believe Type of Space to be the best approximation of the environmental category that we currently have, and left it in as a placeholder until better data to properly populate the Type of Space metric can be acquired or a comparable concept can be substituted.
Results
Weight Results
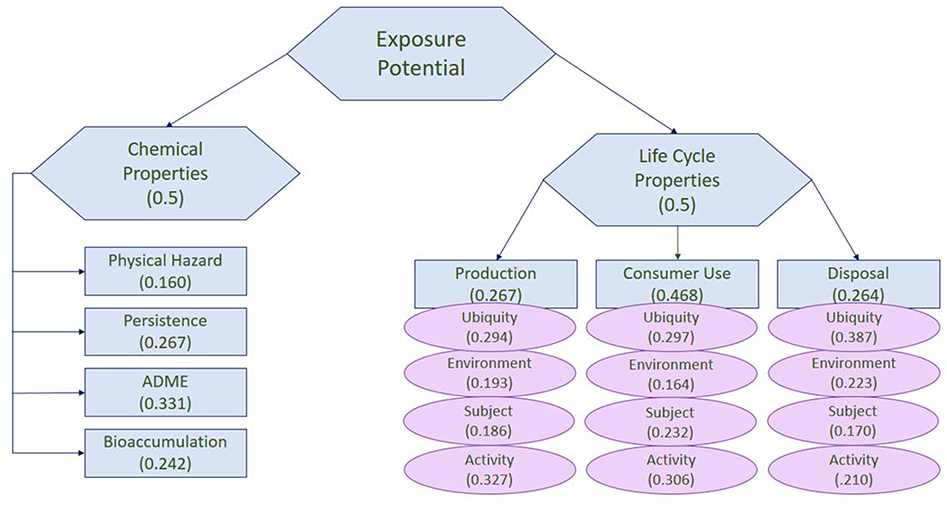
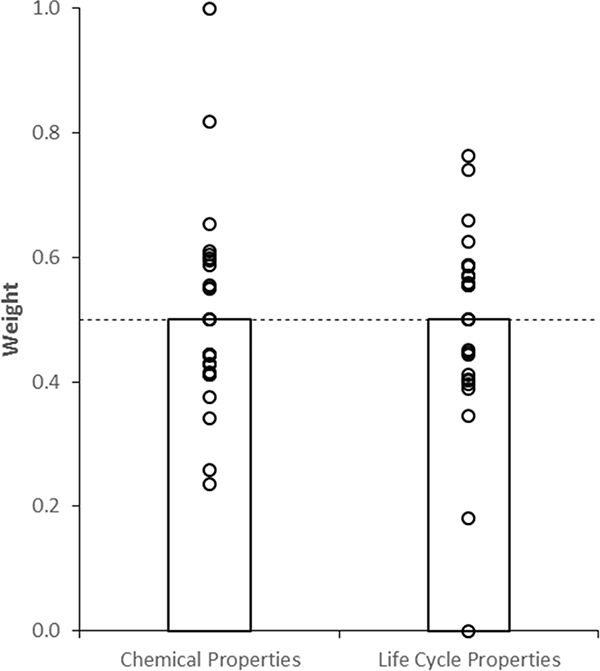
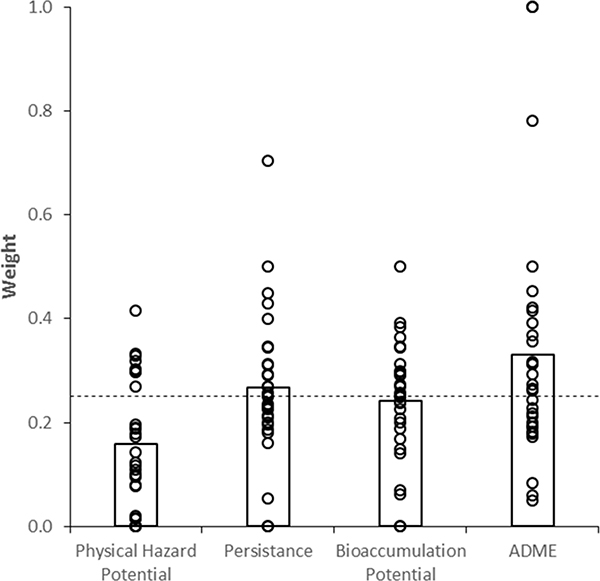
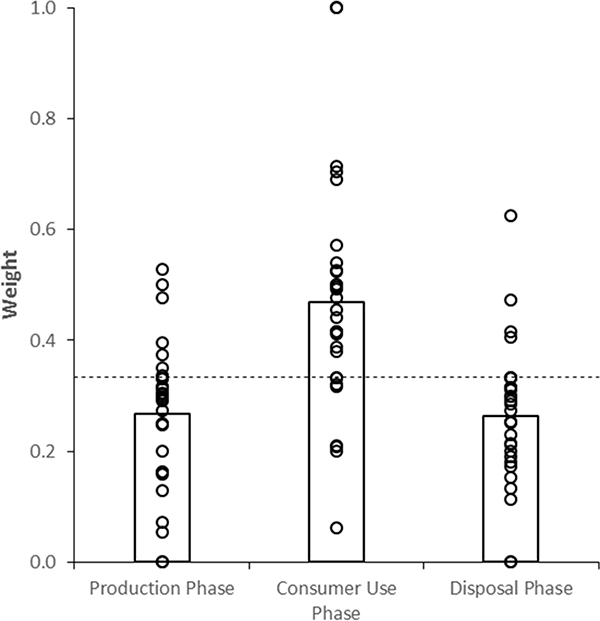
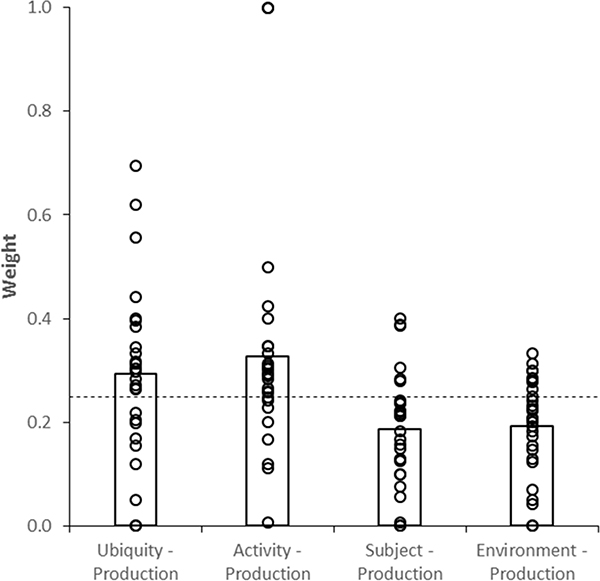
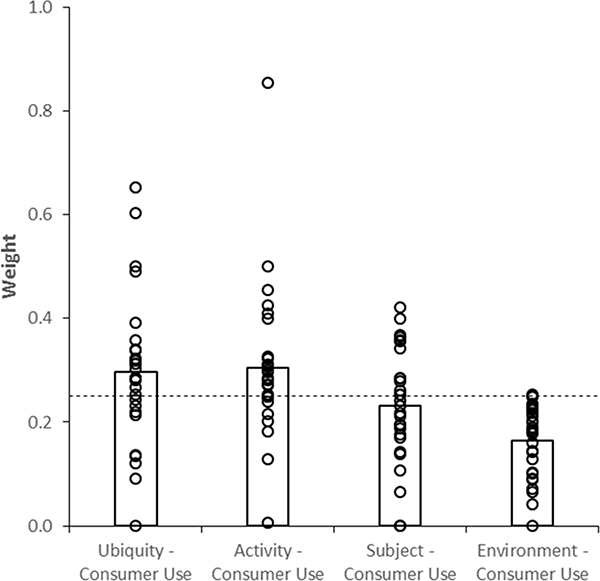
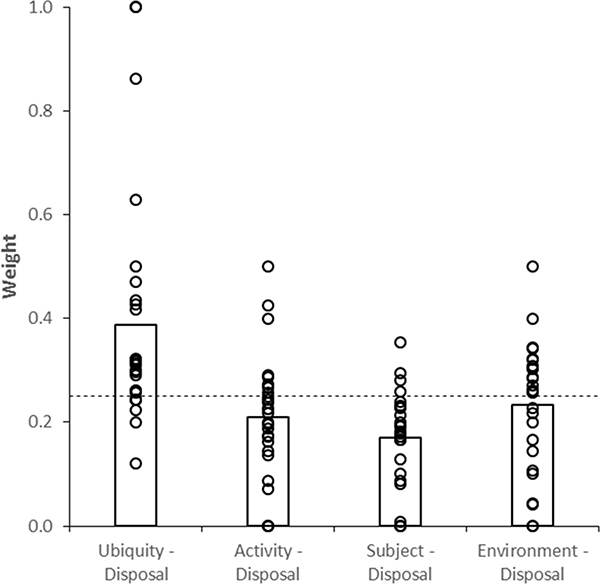
Weights were calculated as the average of the responses received from the web survey (Figure 2). Weight results were compared to an equal-weight model where no differential preference was expressed across criteria. One-sample t-tests were conducted to identify differences between expected weights if no preference was expressed, and the weights expressed by the expert sample. Chemical Properties and Life Cycle Properties were weighted equally by experts (Figure 3). Of the Chemical Properties, Physical Hazard Potential was determined to be the least important criterion, M = 0.16, t(29) = −4.03, p < 0.001 (Figure 4). Of the Life Cycle criteria, Consumer Use phase was considered the most important, M = 0.47, t(28) = 3.58, p = 0.001, while Production, M = 0.27, t(28) = −2.72, p = 0.011 and Disposal, M = 0.26, t(28) = −2.98 p = 0.006, were similarly important (Figure 5). Within the Production phase, both Subject, M = 0.19, t(28) = −3.05, p = 0.005, and Environment, M = 0.19, t(28) = −3.18, p = 0.004, held less importance (Figure 6), while within the Consumer Use phase, Environment was the only criterion that differed statistically from an equal weights model, M = 0.16, t(28) = −6.43, p < 0.001 (Figure 7). In the Disposal phase, Ubiquity was considered most important, M = 0.39, t(28) = 3.22, p = 0.003, while Subject was considered least important, M = 0.17, t(28) = −463, p = 0.0001 (Figure 8).
Figure 2:
Model developed with weights provided by experts from web survey
Figure 3:
Normalized main criteria weights. Dashed line represents equal-weight model, bars represent mean weights, and points represent individual weights.
Figure 4:
Normalized Chemical Properties weights. Dashed line represents equal-weight model, bars represent mean weights, and points represent individual weights.
Figure 5:
Normalized Life Cycle Properties weights. Dashed line represents equal-weight model, bars represent mean weights, and points represent individual weights.
Figure 6:
Production Phase weights.
Figure 7:
Consumer Use weights.
Figure 8:
Disposal Phase weights.
Survey Comments
Twenty-two experts provided comments on at least one of the questions in order to add a detailed explanation for their weights and ranks, or provide other caveats or questions related to their participation. Although participants generally found the format of the survey to be clear and easy to take, some had concerns with the definitions used. One participant felt that a longer definition for each of the criteria would have been helpful, and others were unclear about the meaning of different individual criteria. A summary of select comments related to criteria definitions is provided in Table III. In general, these comments were focused on clarifications of criterion definitions or how criteria as defined might interact. The most commonly reported issue was a difficulty to understand the distinction between “activity” and “subject,” which four out of the 32 participants expressed some sort of confusion over. Some participants felt that the questions were too general and the importance of different categories would alter drastically based on the chemical, product, or population in question. In regards to the content of the web survey, one participant felt it lacked detail about the physical properties of the chemical whereas another noted that while the survey’s results reflect the importance of criteria in terms of human health, they could not be applied in terms of ecological health. Other comments focused on smaller details (e.g., X could be clearer).
Table 3:
Select Survey Comments Related to Criteria Definitions
| Tier | Comment |
|---|---|
| Chemical or life cycle properties | Chemical properties are one of the main drivers of human exposure across pathways, then additional pathway-specific characteristics become relevant incl. life cycle properties. |
| Lifecycle properties as defined provide direct information about opportunities for contact; whereas chemical properties provide, relative to life cycle properties, more indirect estimates of exposure via prediction of movement through various environmental media. At the same time chemical properties are likely more informative for understanding exposure considerations related to bioavailability and ADME. | |
| Exposure is mainly determined by emission. Emission depends mainly on life cycle properties, not chemical properties. Chemical properties definitely influence exposure, but no emission is no exposure (independently of substance characteristics). | |
| Life cycle properties subcriteria | These rankings reflect a cross between potential for direct exposure and likelihood for exposure control. However this approach is challenged by variability in production and disposal practices across sectors and regions |
| Production phase subcriteria | I think all are important but have placed in this order as think: activity is most important as determines how used which has greatest influence on exposure potential, then environment as these conditions (room volume, air exchange, indoors or outdoors will also influence), then subject and then ubiquity because even if widespread use if it occurs in a controlled manner will be less important for exposure potential than the manner of use and PPE, etc. In practice it will also matter how each of these parameters are defined. For example, the parameters in Fig. 3 of the survey documentation for ubiquity indicate quantity and location count, but note they differ than the metrics used in the Mitchell paper, which included regional geometric mean production quantity. Think the quantity and location count are more straight forward. |
| I don'understand your distinction between activity and subject; if it's related to human factors/behavior it should fall under one heading and I am going with subject (even though that definition has to do with activity). | |
| I don'understand what is meant by subject/Activity matters because it is how the chemical is used. |
Qualitative & Count Metric Results
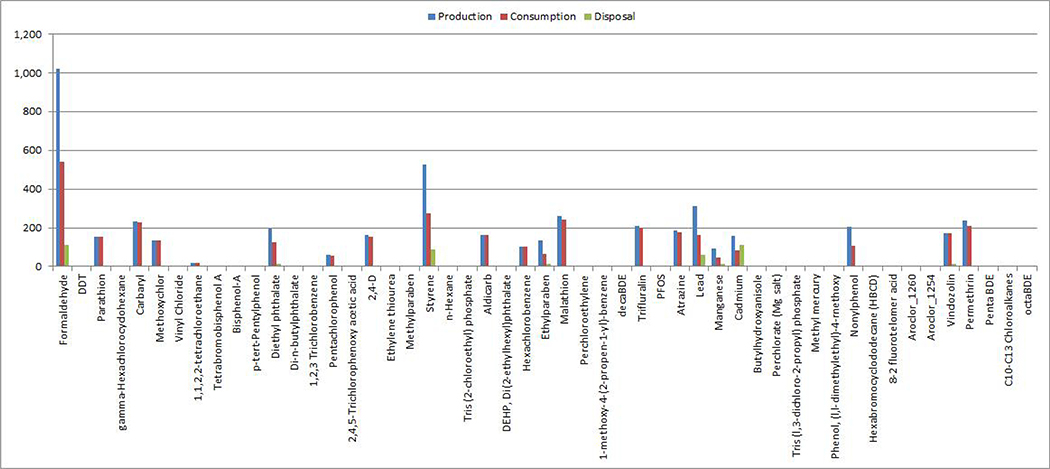
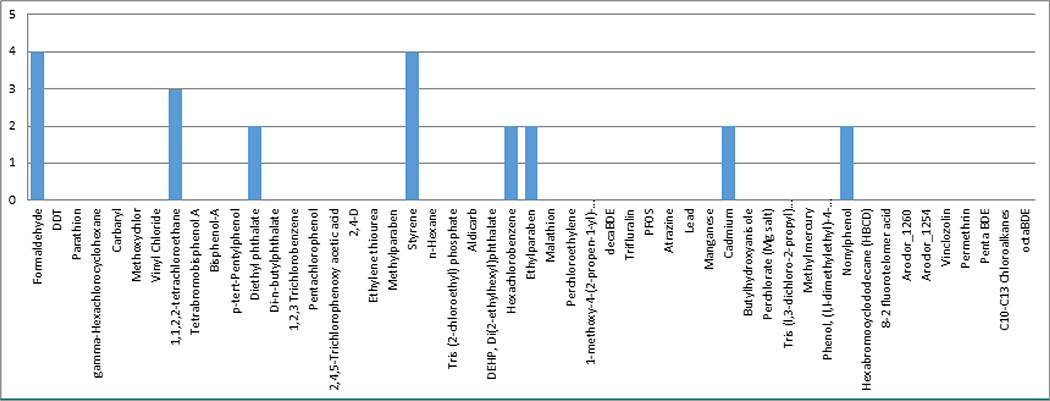
Number of total predicted uses was counted for each life cycle phase (Fig. 9). Values associated with production ranged from zero to 1,020 possible uses (M = 93, median = 0); values associated with consumption ranged from zero to 539 uses (M = 67, median = 0); and values of disposal count ranged from 0 to 114 uses (M = 8.7, median = 0). Number of vulnerable populations potentially interacting with the chemical was calculated for the consumer use life cycle phase (Fig. 10). The values range from 0 to 4 (M = 0.412, median = 0).
Figure 9:
Count of “number of Total Predicted Uses” for all 42 chemicals
Figure 10:
Count of Number of Child or Baby Uses metric for all 42 chemicals.
MCDA Results
Three versions of the model were run and compared: one where both chemical properties criteria and life cycle criteria were weighted equally, one where chemical properties criteria have been weighted according to the expert elicitation values, and one where both chemical properties criteria and life cycle criteria have been weighted according to the expert elicitation values. A version of the model in which only life cycle criteria were weighted according to the expert elicitation values was not run as a result of the limited sample of life cycle experts. In cases where multiple metrics contribute to a single subcriterion, the contribution of each metric was weighted equally. Online Appendix 1 shows how the ranking of 42 chemicals changed for each weighting scheme. Table IV highlights variations in rank for the top 10 chemicals under the equal-weight scheme compared to the others.
Table 4:
Top 10 Chemical Prioritization for Different Weight Profiles
| Equal Weights | Adjusted Chemical Only | Adjusted Chemical and Life Cycle | ||||
|---|---|---|---|---|---|---|
| Chemical | Rank | Exposure Score | Rank | Exposure Score | Rank | Exposure Score |
| Styrene | 1 | 0.63 | 1 | 0.57 | 1 | 0.57 |
| Formaldehyde | 2 | 0.48 | 7 | 0.34 | 9 | 0.30 |
| Nonylphenol | 3 | 0.45 | 2 | 0.52 | 3 | 0.49 |
| Trifluralin | 4 | 0.42 | 3 | 0.51 | 2 | 0.50 |
| Pentachlorophenol | 5 | 0.30 | 4 | 0.38 | 4 | 0.40 |
| Atrazine | 6 | 0.29 | 6 | 0.35 | 6 | 0.34 |
| n-Hexane | 7 | 0.28 | 10 | 0.30 | 12 | 0.28 |
| Tetrabromobisphenol A | 8 | 0.27 | 5 | 0.37 | 5 | 0.35 |
| Diethyl phthalate | 9 | 0.27 | 11 | 0.29 | 8 | 0.31 |
| Di(2-ethylhexyl)phthalate (DEHP) | 10 | 0.26 | 9 | 0.31 | 7 | 0.31 |
Although the weighting schemes were included in the model to account for expert views, variation in chemical ranks across weighting schemes was small. Small change in exposure scores from each weighted scenario can also be explained by the type of space metric in the MCDA. For this metric, all chemicals assumed the default value, therefore reducing the variance of overall exposure scores and effectively ignoring these factors as contributors. This can be remedied by using an expert elicitation process similar to that used for criteria weighting, with one or more experts familiarized with the metrics and the criteria that they should be contributing.
The top 10 chemicals vary little across weighting schemes; the chemicals ranked 1–4 are in the top five across weighting schemes, and only a few substitutions are seen between chemicals in the top 10 for each weighting scheme. Looking at the scores adjusted for chemical property weight only, formaldehyde ranked higher from the inclusion of expert elicitation. Experts rated Physical Hazard low relative to other chemical property metrics, and formaldehyde has a significantly higher than average physical hazard score. Formaldehyde is a commonly cited dangerous chemical, as it was one of the first chemicals to be recognized for its potential for harmful human exposure. However, as experts were not asked to rate the importance of chemical property metrics with formaldehyde specifically in mind, we do not believe formaldehyde’s increased prioritization when chemical property expert weights were considered was the result of its notoriety (Morgan, 1997). In fact, its relative rank decreased even further when life cycle weights were considered; the high counts it received in “subject” metrics are discounted, as subject is weighted less than activity and ubiquity for each life cycle stage. However, trifluralin’s exposure score increases when expert weights are considered, and gets an increase in rank. High ADME chemical property scores and high consumption scores—particularly in activity and ubiquity categories—can account for its increase in exposure score and rank.
Discussion
The decision analysis approach produced a ranked prioritization of manufactured chemicals that can be used to inform research investments in chemical categorization, consistent with goals of the exposure challenge. An expert elicitation generated weights different from a no-preference, equal-weight model and led to some variation in chemical prioritization. Readily available database measures of chemical exposure risk were augmented with derived metrics and qualitative assessments to provide human factors assessments of many chemicals.
Future work can improve on this analysis in several ways. First, representation of human factors experts in the weighting sample should be increased. In the convenience sample here, only three human factors experts provided weight information despite deliberate efforts to increase participation from this group. To increase the model’s robustness, a better balance between the physiochemical human factors experts is needed. Qualitative metric data used here could also be improved. Individually determining values for each chemical and each life cycle stage associated with that chemical other than the default values set in this analysis (e.g., type of space) is a time-consuming process and can lead to poor data reliability based on differences in the quantity and type of expertise held by those assessing those metrics. In the case of this study, most of the qualitative metrics were set at a default value and a case could not be made for changing from the default for any chemicals.
Several comments of clarification were provided by participants. Although this work represents a proof-of-concept of a high-throughput screening approach using well-understood chemicals with well-described chemical properties, future work should incorporate this feedback in both refining definitions of screening criteria for the purpose of the weighting exercise, and identify more appropriate or additional metrics for evaluating chemicals. These metrics and resulting model exposure scores should be validated against more robust but slower laboratory tests or other measurement tools to ensure some level of consistency with established methods.
A quick and dependable process for data acquisition is needed to make these qualitative judgments more useful, either by using a small independent expert sample to provide assessments on these factors, or by developing clearer guidance and example chemicals for each level of each qualitative measure that can be used to make a relative comparison to some unknown new chemical. Lack of variation across chemicals for any metric produces the consequence of ignoring the subcriterion it is associated with when only one metric contributes to a subcriterion, and reducing the impact of a subcriterion proportional to the number of metrics without variation when multiple metrics aggregate to the same subcriterion. Strictly speaking, metrics should be replaced or removed from a decision analysis when they do not vary across the set of items being assessed.
An attempt was made to use the European Chemical Agency’s REACH exposure database to fill in information about the spaces where chemicals are typically used to improve these scores and inject some natural variation. REACH was implemented by the European Union to identify human health and environmental risks associated with particular chemicals and easily provide that information to the E.U. chemicals industry, such that the industry remains competitive. However, while the collection of physical and chemical data provided is vast, information about environmental pathways is redundant with the information used in the Chemical Data section of the model. To avoid violating MCDA’s assumptions about independence of criteria, the default values of “2,” “3,” and “1” for production, consumption, and disposal, respectively, were left as designated when quantifying the type of space metric.
The chemical-by-chemical analysis could also limit the estimation of risk associated with a given product, as most manufactured items are composed of multiple chemicals that have the potential to react with one another. Analytics need to show, for example, whether a particular chemical that may not be harmful on its own may warrant a higher ranking when used in conjunction with another chemical. An additional layer of the MCDA tool could combine the hazards associated with each chemical in the product’s make-up and rank based on the manufactured item, not the individual chemical. To do this, the composition ratio of a series of products would have to be known, as well as a metric assessing the potential synergistic or antagonistic effects of chemical–chemical interactions.
Changes of prioritization objective leads to, in a small way, changes to prioritization of chemicals, but the absence of a common database and a more developed human factors model limits the magnitude of the results. The collection of data for future studies of this nature may become easier as a result of the work presently underway in the National Center for Computational Toxicology. Its recently released Comptox Dashboard integrates experimental and predicted data for over 720,000 individual chemical structures, and meshes together other data, including the ToxCast bioassay screening data, exposure modes, and the CPCat product categories database. Experimental data points have been used to develop a new suite of prediction models (known as NCCT_Models) and have been applied to the prediction of properties across the database (U.S. Environmental Protection Agency, 2016). The integration of experimental and predicted data over multiple sources enhances our ability to predict and identify chemical properties for new and less evaluated chemicals.
Despite the shortcomings described for this application, a tool like the one presented here could be beneficial in a number of other contexts (e.g., Linkov et al., 2017). For example, analytics associated with novel technologies like nanomaterials could benefit from the ranked list the tool provides. Some data for these materials are available, but that information has not yet been organized in such a way as to inform holistic risk management decisions. Comparisons of nanomaterials or other emerging materials would require both knowledge of the materials’ intrinsic chemical properties given their size and method of manufacture, as well as knowledge of how human users would interact with the material. Thus, nanomaterial evaluation provides a direct analogy to further application of the approach. Another possible application for the tool is an evaluation of a hypothetical portfolio of products (e.g., cosmetics). If a company has a portfolio of products, and a set of chemicals that would be included in those products, the tool could rank the exposure risk of products in that portfolio based on toxicity and the manner in which the product is to be used. This research may also show the need for a more robust understanding of exposure characterization factors, such as those that are present in traditional life cycle assessments, as well as improving the basis on which an exposure factor would be created. These characterization factors exist to serve as a comparison to the risk associated with commonly quantified events, such as global warming or coastal flooding risks, and highlighting the need for an aggregation of exposure data advances the eventual development of that metric. A point of comparison for the chemicals evaluated here could aid audiences and users in appropriate level of concern or reasonable actions to take given threats presented by those chemicals.
An ancillary finding of the study was that EPA’s expert elicitation guidelines can readily be adapted to webinars and interactive forums. Future research should address the extent to which this approach is amenable to other programs in addition to chemical ingredients in products.
Supplementary Material
Acknowledgements
Permission was granted by the U.S. Army Corps of Engineers, Chief of Engineers, to publish this material. The views expressed in this article are those of the authors and do not necessarily reflect the views or policies of the U.S. Environmental Protection Agency, the U.S. Army Corps of Engineers, or any other department or agency of the U.S. government. Mention of trade names or commercial products does not constitute endorsement or recommendation for use.
References
- Belton V, & Stewart T (2002). Multiple criteria decision analysis: An integrated approach. Boston: Springer. [Google Scholar]
- Bottomley PA, & Doyle JR (2001). A comparison of three weight elicitation methods: Good, better, and best. Omega, 29( 6), 553–560. [Google Scholar]
- Bridges TS, Kovacs D, Wood MD, Baker K, Butte G, Thorne S et al. (2013). Climate change risk management: A mental modeling application. Environment Systems and Decisions, 33( 3), 376–390. [Google Scholar]
- Cegan JC, Filion AM, Keisler JM, & Linkov I (2017). Trends and applications of multi-criteria decision analysis in environmental sciences: Literature review. Environment Systems and Decisions, 37, 123–133. [Google Scholar]
- Collier ZA, Trump BD, Wood MD, Chobanova R, & Linkov I (2016). Leveraging stakeholder knowledge in the innovation decision making process. International Journal of Business Continuity and Risk Management, 6, 163–181. [Google Scholar]
- Crofton KM (2016). EPA National Center for Computational Toxicology UPDATE. Retrieved from https://ntp.niehs.nih.gov/iccvam/meetings/iccvam-forum-2016/9-epa-ncct-508.pdf.
- Csiszar SA, Meyer DE, Dionisio KL, Egeghy P, Isaacs KK, Price PS, …, Bare JC (2016). A conceptual framework to enhance life cycle assessment using near-field human exposure modeling and high-throughput tools. Environmental Science Technology, 50( 21), 11922–11934. [DOI] [PMC free article] [PubMed] [Google Scholar]
- Denison R (2016. June 28). Understanding basic process flows under the new TSCA. Environmental Defense Fund Health Blog. Retrieved from https://blogs.edf.org/health/. [Google Scholar]
- Dionisio KL, Frame AM, Goldsmith MR, Wambaugh JF, Liddell A, Cathey T, … Judson RS (2015). Exploring consumer exposure pathways and patterns of use for chemicals in the environment. Toxicology Reports, 2, 228–237. [DOI] [PMC free article] [PubMed] [Google Scholar]
- Egeghy P, Judson R, Gangwal S, Mosher S, Smith D, Vail J, & Cohen Hubai EA (2012). The exposure data landscape for manufactured chemicals. Science of the Total Environment, 414, 159–166. [DOI] [PubMed] [Google Scholar]
- Egeghy PP, Vallero DA, & Cohen Hubal EA (2011). Exposure-based prioritization of chemicals for risk assessment. Environmental Science & Policy, 14( 8), 950–964. [Google Scholar]
- Karvetski CW, Lambert JH, & Linkov I (2009). Emergent conditions and multiple criteria analysis in infrastructure prioritization for developing countries. Journal of Multi-Criteria Decision Analysis, 16( 5--6), 125–137. [Google Scholar]
- Keeney RL, & Raiffa H (1976). Decisions with multiple objectives: Preferences and value tradeoffs. New York: Wiley. [Google Scholar]
- Kiker GA, Bridges TS, Varghese A, Seager TP, & Linkov I (2005). Application of multicriteria decision analysis in environmental decision making. Integrated Environmental Assessment and Management, 1( 2), 95–108. [DOI] [PubMed] [Google Scholar]
- Kurth MH, Larkin S, Keisler JM, & Linkov I (2017). Trends and applications of multi-criteria decision analysis: Use in government agencies. Environment Systems and Decisions, 37, 134–143. [Google Scholar]
- Linkov I, & Moberg E (2012). Multi-criteria decision analysis: Environmental applications and case studies. Boca Raton, FL: CRC Press. [Google Scholar]
- Linkov I, Satterstrom FK, Kiker G, Seager TP, Bridges T, Gardner KH, … Meyer A (2006). Multicriteria decision analysis: A comprehensive decision approach for management of contaminated sediments. Risk Analysis, 26( 1), 61–78. [DOI] [PubMed] [Google Scholar]
- Linkov I, Trump BT, Wender BA, Seager TP, Kennedy AJ, & Keisler JM (2017). Integrate life-cycle assessment and risk analysis results, not methods. Nature Nanotechnology, 12, 740. [DOI] [PubMed] [Google Scholar]
- Malloy TF, Trump BD, & Linkov I (2016). Risk-based and prevention-based governance for emerging materials. Environmental Science and Technology, 50, 6822–6824. [DOI] [PubMed] [Google Scholar]
- Malloy TF, Zaunbrecher VM, Batteate CM, Blake A, Carroll WF Jr, Corbett CJ, … Moran KD (2017). Advancing alternative analysis: Integration of decision science. Environmental Health Perspectives, 125( 6), 066001. [DOI] [PMC free article] [PubMed] [Google Scholar]
- Mitchell J, Arnot JA, Jolliet O, Georgopoulos PG, Isukapalli S, Dasgupta S, … Vallero DA (2013). Comparison of modeling approaches to prioritize chemicals based on estimates of exposure and exposure potential. Science of the Total Environment, 458, 555–567. [DOI] [PMC free article] [PubMed] [Google Scholar]
- Mitchell J, Pabon N, Collier Z, Egeghy P, Cohen-Hubal E, Linkov I, & Vallero DA (2013). A decision analytic approach to exposure-based chemical prioritization. PLoS One, 8( 8), e70911. [DOI] [PMC free article] [PubMed] [Google Scholar]
- Morgan KT (1997). Review article: A brief review of formaldehyde cacinogenesis in relation to rat nasal pathology and human health risk assessment. Toxicologic Pathology, 25( 3), 291–305. [DOI] [PubMed] [Google Scholar]
- Rapid Chemical Exposure and Dose Research | Safer Chemicals Research | US EPA. (2016). Epa.gov Retrieved from https://www.epa.gov/chemical-research/rapid-chemical-exposure-and-dose-research.
- Richard AM, Judson RS, Houck KA, Grulke CM, Volarath P, Thillainadarajah I, … Thomas RS (2016). ToxCast chemical landscape: Paving the road to 21st century toxicology. Chemical Research Toxicology, 29( 8), 1225–1251. [DOI] [PubMed] [Google Scholar]
- Shah I, Liu J, Judson RS, Thomas RS, & Patlewicz G (2016). Systematically evaluating read-across prediction and performance using a local validity approach characterized by chemical structure and bioactivity information. Regulatory Toxicology Pharmacology, 79, 12–24. [DOI] [PubMed] [Google Scholar]
- U.S. Environmental Protection Agency. (2016). Chemistry dashboard. Retrieved from https://comptox.epa.gov/dashboard.
- U.S. Environmental Protection Agency Office of the Science Advisor. (2012). Expert elicitation white paper review. Retrieved from https://yosemite.epa.gov/sab/sabproduct.nsf/fedrgstr_activites/Expert%20Elicitation%20White%20Paper?OpenDocument.
- Wilson M, & Schwarzman M (2009). Toward a new U.S. chemicals policy: Rebuilding the foundation to advance new science, green chemistry, and environmental health. Environmental Health Perspectives, 117( 8), 1202–1209. [DOI] [PMC free article] [PubMed] [Google Scholar]
- Wood MD, Kovacs D, Bostrom A, Bridges TS, & Linkov I (2012). Flood risk management: U.S. Army Corps of Engineers and layperson perceptions. Risk Analysis, 32( 8), 1349–1368. [DOI] [PubMed] [Google Scholar]
Associated Data
This section collects any data citations, data availability statements, or supplementary materials included in this article.


