Abstract
Obesity and obesity-related disorders are a global epidemic affecting over 10% of the world’s population. Treatment of these diseases has become increasingly challenging and expensive. The most effective and durable treatment for Class III obesity (body mass index ≥35 kg/m2) is bariatric surgery, namely, Roux-en-Y gastric bypass (RYGB) and vertical sleeve gastrectomy. These procedures are associated with increased circulating bile acids, molecules that not only facilitate intestinal fat absorption but are also potent hormones regulating numerous metabolic pathways. We recently reported on a novel surgical procedure in mice, termed distal gallbladder bile diversion to the ileum (GB-ILdist), that emulates the altered bile flow after RYGB without other manipulations of gastrointestinal anatomy. GB-ILdist improves oral glucose tolerance in mice made obese with high-fat diet. This is accompanied by fat malabsorption and weight loss, which complicates studying the role of elevated circulating bile acids in metabolic control. A less aggressive surgery in which the gallbladder bile is diverted to the proximal ileum, termed GB-ILprox, also improves glucose control but is not accompanied by fat malabsorption. To better understand the differential effects achieved by these bile diversion procedures, an untargeted ultraperformance liquid chromatography-ion mobility-mass spectrometry (UPLC-IM-MS) method was optimized for fecal samples derived from mice that have undergone bile diversion surgery. Utilizing the UPLC-IM-MS method, we were able to identify dysregulation of bile acids, short-chain fatty acids, and cholesterol derivatives that contribute to the differential metabolism resulting from these surgeries.
Graphical Abstract
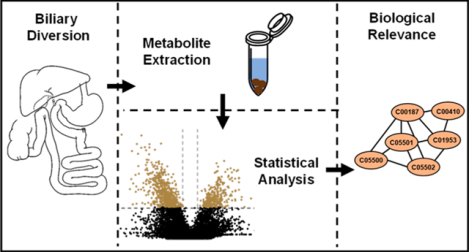
Worldwide obesity has reached epidemic levels, contributing to a decline in the well-being of many people and drastically increasing public health costs.1,2 Obesity is continually increasing in severity and has been associated with health problems such as diabetes, chronic inflammation, fatty liver disease, and cancer. Efforts toward understanding this complex disease have found contributions related to genetic predisposition, lifestyle, environment, ethnicity, gender, and composition of the gut microbiota.2 Strategies to combat obesity include diet and lifestyle changes, medication, and bariatric surgery. Of these interventions, bariatric surgery—namely, Roux-en-Y gastric bypass (RYGB)—is more effective than intensive medical therapy at achieving a sustained excess weight loss of about 47% at 5 and 10 years postoperation.3,4 These surgeries also have a desirable yet unexplained side effect of improving type 2 diabetes (T2D) and reducing glycated hemoglobin by ~31% at 1 year and ~21% at 5 years postoperation.3,5 RYGB results in dramatic and sustained weight loss and improved glycemic control via a multitude of mechanisms, one of which is the more distal delivery of gallbladder bile in the intestinal lumen and altered enterohepatic circulation of bile acids.6 Bile acids are synthesized in the liver from a cholesterol precursor and expelled by the gallbladder into the intestines where they aid in lipid absorption. Bile acids also act as signaling molecules that mediate their own production, are involved in glucose metabolism, and act as hormones.7 We have previously reported, using mouse models, that RYGB results in satiety, weight loss, and changes in the gut microbiome, and in animals fed a high-fat diet, fat malabsorption.8 Each of these changes confounds our understanding of how bile acids modulate enteral glucose and lipid handling. To more directly assess the effects of altered bile flow on intestinal nutrient handling, we developed a murine bile diversion model wherein the common bile duct is sutured closed and gallbladder bile is surgically redirected to the duodenum (GB-D), jejunum (GB-J), or 4 cm from the distal ileum (GB-ILdist) by anastomosis without any other alterations to gastrointestinal anatomy or alimentary flow.8,9 In contrast, bile diversion 10 cm from the ileocecal valve, a procedure we termed proximal GB-IL (GB-ILprox), achieved significant improvements in enteral glucose handling without fat absorption. In these studies, we aimed to identify the bile acids and other fecal metabolites that differ between these two procedures. In particular, a method was developed to determine which lipids and bile acids may be selectively transported by the 6 cm portion of the murine gastrointestinal tract (Figure 1). Targeted metabolomic methods have previously been utilized to study bile acids; however, these methods are limited in scope and do not measure unexpected endogenous metabolites that may also be dysregulated.10,11 Considering the multifaceted role of bile acids, the global effects of their perturbation are also of interest.
Figure 1.
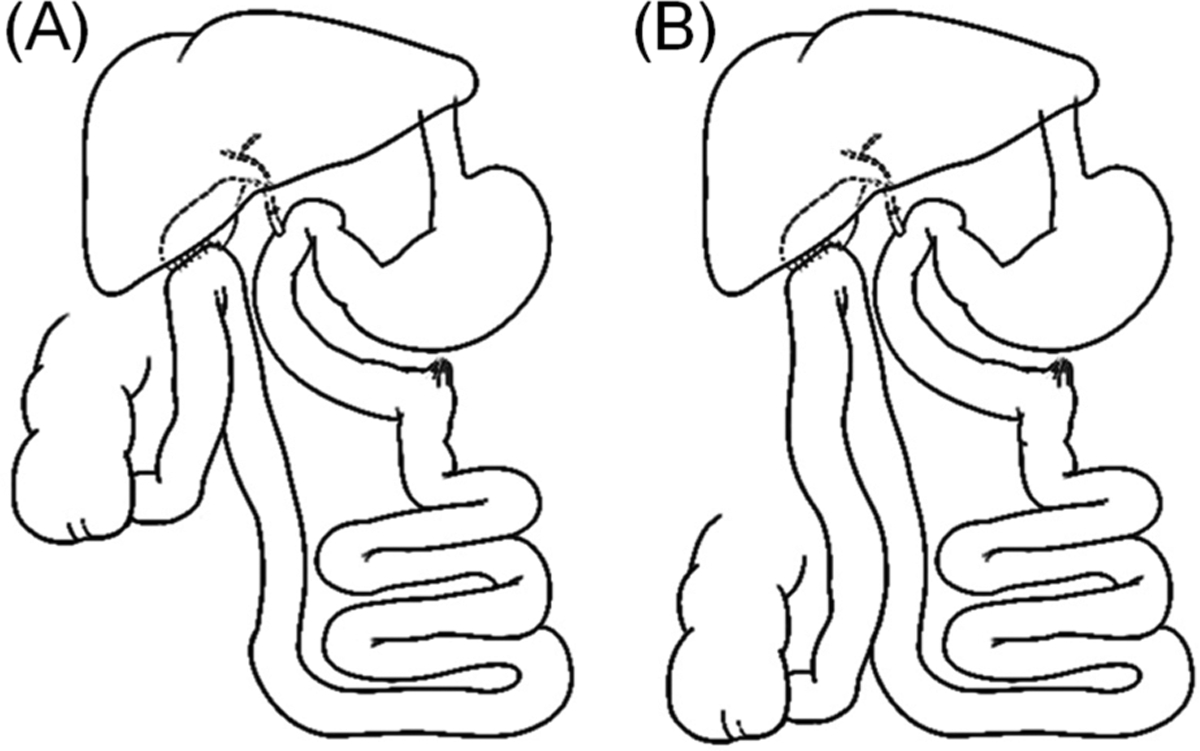
Schematics of the distal GB-ILdist (A) and proximal GB-ILprox (B) bile diversion surgeries.
The detection of bile acids has previously been reported in plasma but this workflow requires cleanup, such as solid phase extraction, and derivatization, which is time-consuming and inherently excludes potentially interesting metabolites from analysis.8 Herein, we report a global, untargeted ultraperformance liquid chromatography-ion mobility-mass spectrometry (UPLC-IM-MS/MS) method to rapidly detect a range of endogenous metabolites, including bile acids, extracted from feces with minimal sample preparation steps. The additional dimension of IM separation allows for the discrimination of coeluting metabolites in complex mixtures, which enables high-confidence characterization and identification.12–17 IM-MS profiling has previously been demonstrated to separate multiple biological classes in complex biological samples.18–23 The approach described herein is an optimized UPLC-IM-MS/MS method that capitalizes on the increased separation capacity (LC dimension combined with IM dimension) to fully characterize extracted fecal metabolites. We demonstrate the utility of this method by investigating the qualitative changes of endogenous metabolites observed in biliary diversion surgery and controls. In addition to describing previously identified metabolite perturbations, we also observe unexpected metabolic pathways that may also be affected by bile diversion. These conclusions both support and expand current knowledge of affected metabolites and suggest a wide breadth of biological consequences affected by biliary diversion.
EXPERIMENTAL METHODS
The untargeted metabolomic scheme utilized in this work is shown in Figure 2 and is further described in the following sections.
Figure 2.
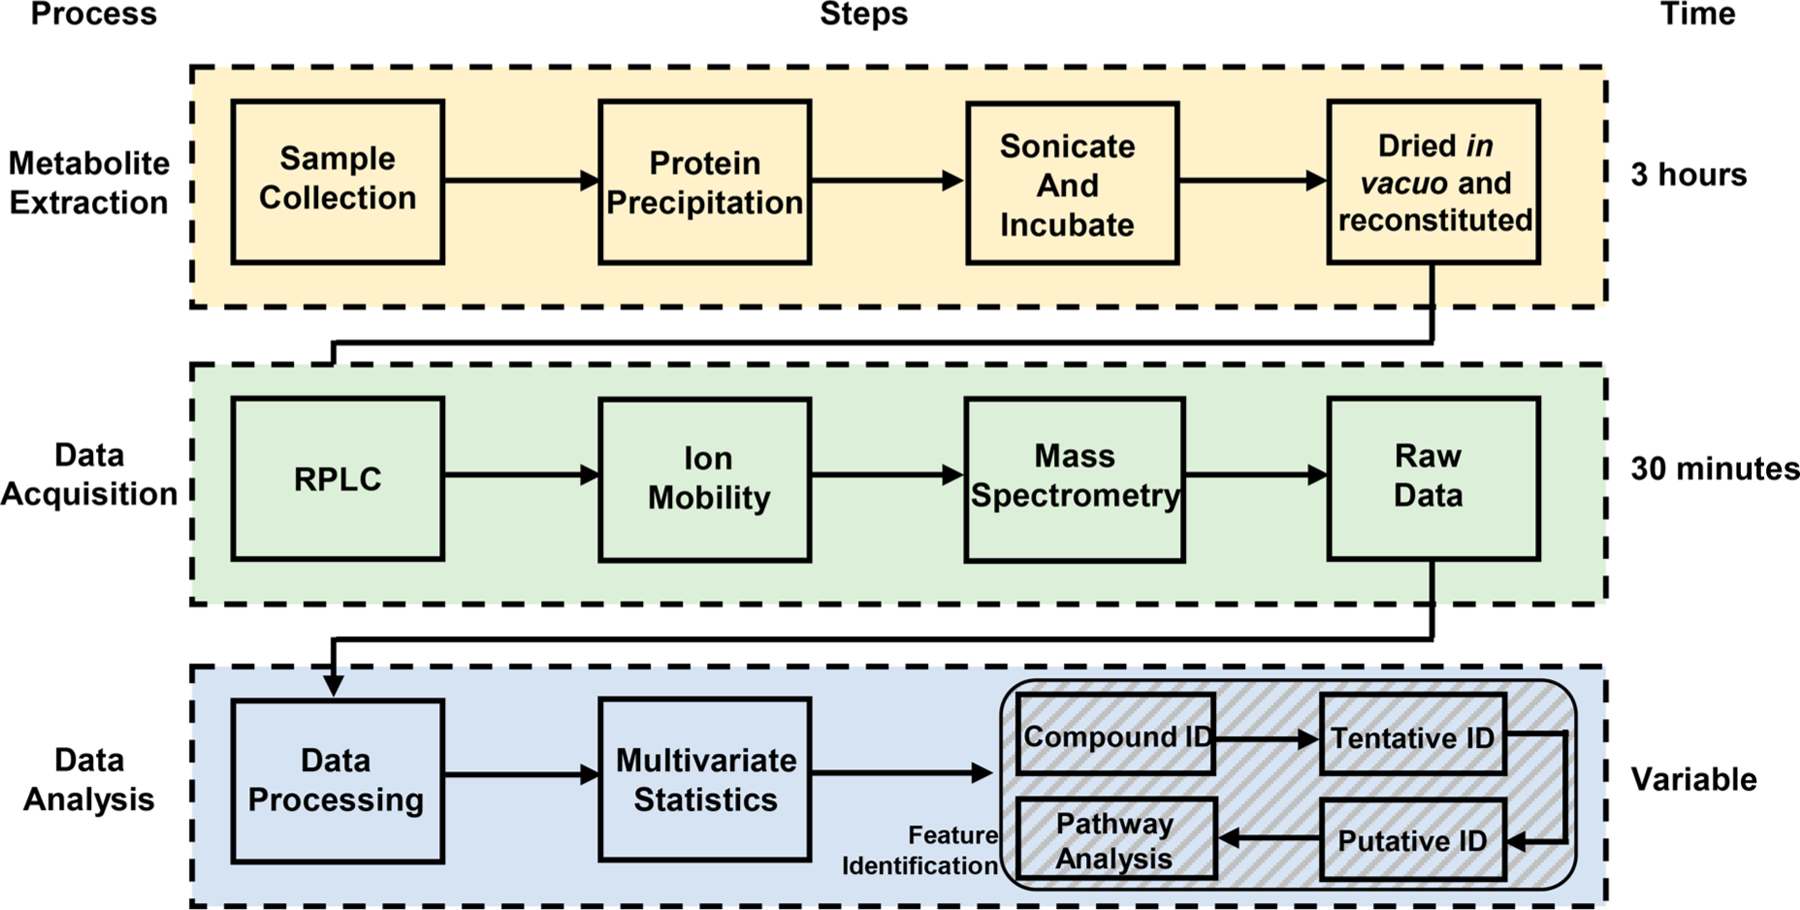
Flowchart depicting the individual steps taken for each of the processes of metabolite extraction, data acquisition, and data analysis utilized in this work. Representative times for each process are shown.
Standards and Chemicals.
Optima grade acetonitrile and water were purchased from Fisher Scientific (Loughborough, UK). Ammonium acetate was purchased from Sigma-Aldrich (Dorset, UK). Formic acid was purchased from Fluka (Buchs, Switzerland). Bile acid standards, including tauro-alpha-muricholic aicd (T-α-MCA), tauro-beta-muricholic acid (T-β-MCA), tauro-omega-muricholic acid (T-ω-MCA), alpha-muricholic acid (α-MCA), beta-muricholic acid (β-MCA), taurohyocholic acid (THCA), glycoursodeoxycholic acid (GUDCA), tauroursodeoxycholic acid (TUDCA), hyocholic acid (HCA), taurohyoxydeoxycholic acid (THDCA), taurocholic acid (TCA), cholic acid (CA), ursodeoxycholic acid (UDCA), hyodeoxycholic acid (HDCA), glycodeoxycholic acid (GDCA), taurodeoxycholic acid (TDCA), chenodeoxycholic acid (CDCA), and deoxycholic acid (DCA) were purchased from Steraloids, Inc. (Newport, RI). Standard solutions of these 20 bile acids were prepared at concentrations of 0.5, 10, 50, 100, 500, 1500, 5000, and 10 000 nM in a solution of 20% (v/v) acetonitrile and water.
Surgery and Fecal Collection.
Male C57BL/6J mice (Jackson Laboratories; Bar Harbor, ME) were housed at 23 °C on a 07:00–19:00 light cycle and were fed a high fat diet (60% kcal from fat; Bio-Serv, Frenchtown, NJ), starting at 6 weeks of age for 12 weeks prior to being randomly allocated to a surgical group. The GB-ILdist procedure, where the gallbladder was anastomosed 4 cm from the cecum, was carried out as previously described. The GB-ILprox surgery was performed in an identical manner with the exception of gallbladder anastomosis 10 cm from the ileocecal valve.8,9 Fecal pellets were collected by hand and stored at −80 °C prior to sample preparation.
Fecal Metabolite Extraction and Preparation.
Fecal pellet samples were thawed on ice prior to extraction. Twenty-five milligrams of fecal material was mixed with 75:25 (v/v) ACN/H2O (1 mL). Samples were sonicated for 30 s on ice to break up solid particulates, vortexed, and incubated at −20 °C for 2 h. Following incubation, the solution was centrifuged (4 °C, 12 000 rpm, 10 min) and the supernatant was removed. Aliquots were subsequently dried in vacuo using a SpeedVac (Thermo Scientific) and stored frozen at −80 °C until analysis. Prior to analysis, dried extracts were reconstituted in 100 μL of 80:20 (v/v) ACN/H2O. To assess instrument reproducibility, a pooled sample was made by combining 20 μL of each individual resuspension to serve as a quality control (QC) sample. Reconstituted metabolite extracts were transferred to auto sampler vials for UPLC-IM-MS analysis.
Ultra-Performance Liquid Chromatography-Ion Mobility-Mass Spectrometry (UPLC-IM-MS).
Chromatographic separation was performed using a Nano Acquity (Waters Corporation, Manchester, UK) fitted with an Acquity UPLC HSS column (T3, 1.8 μM). The IM-MS instrument (Synapt G2, Waters, Milford, MA, USA) was controlled by MassLynx (version 4.1, Waters).24 Source conditions were optimized for individual bile acids via direct infusion prior to LC optimization. Bile acids were measured in negative mode with a capillary voltage of 2.2 kV. A bile acid mixture was prepared and chromatography gradients were assessed to determine optimal chromatographic conditions for LC separation of the 20 bile acid standards (Figure 3). Solvent A consisted of 80:20 (v/v) H2O/ACN with 10 mM ammonium acetate and solvent B was 20:80 (v/v) H2O/ACN with 10 mM ammonium acetate. Drift times (DT) for bile acids were collected individually via direct infusion on three different days. The flow rate was set to 10 μL/min with the electrospray voltage set to 2.3 kV. Desolvation temperature is set to 325 °C. The traveling wave ion mobility cell was operated at a pressure of 3.35 (mbar) N2 with a wave velocity of 650 m/s and a transfer wave height of 4 V. The trap and transfer cells were operated at 2.90 × 10⁻² and 1.00 × 10⁻⁶ mbar, respectively. A calibration solution containing 10 μL/mL polyalanine was acquired prior to the bile acid data acquisition each day, and calibrated collision cross sections (CCS) were calculated using DriftScope v2.5.
Figure 3.
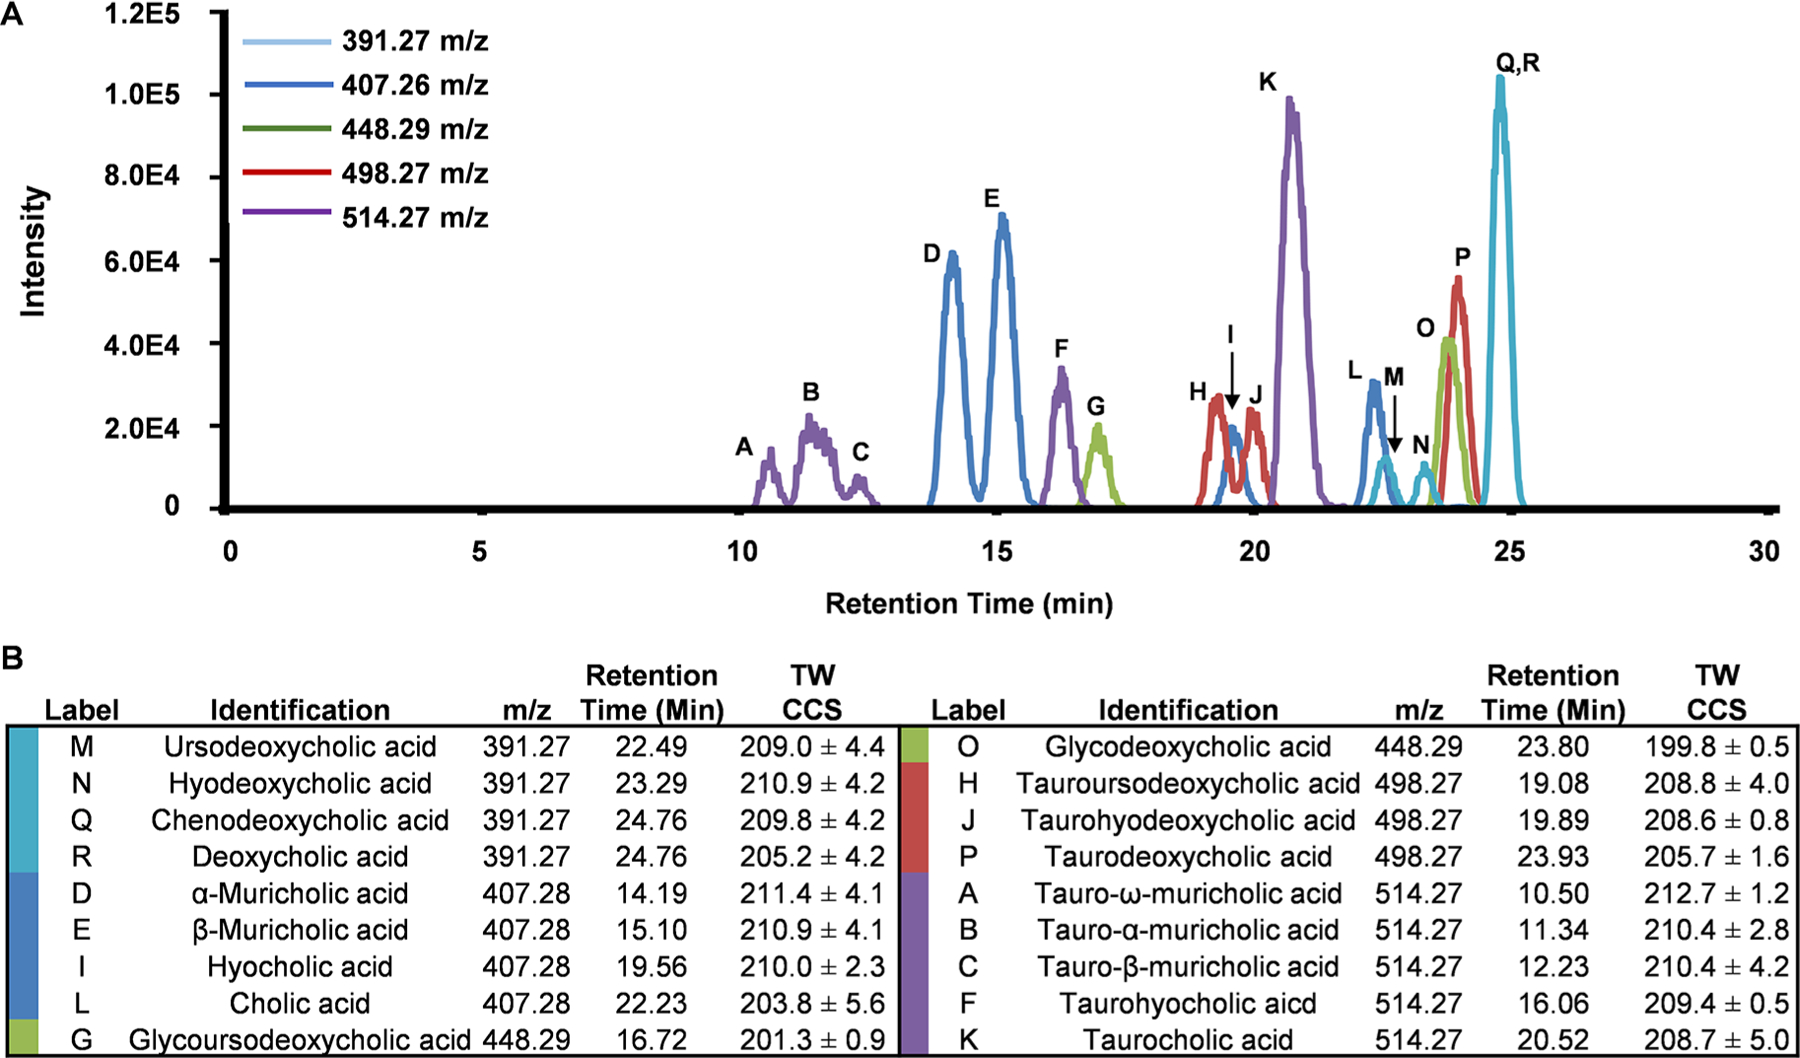
(A) Overlays of the negative-polarity extracted ion chromatograms of the bile acid standards separated using the optimized method. The colors represent the specific m/z extracted ion chromatograms shown. (B) Experimental evidence for reference standards including m/z retention time, and CCS are shown. Labels in (A) correspond to the specific bile acid codes in (B).
In the analysis of the fecal extracts, the total analysis time was 30 min with a flow rate of 75 μL/min. The solvent gradient started at 5% solvent B and increased to 15% B from 0 to 15 min, increased to 25% B from 15 to 20 min, increased to 75% B from 20 to 22 min, and then decreased to 5% B from 22 to 24 min where it was held for the remainder of the run from 24 to 30 min. A heated column jacket sleeve controlled the temperature at 45 °C.
The MS was operated in both negative and positive electrospray ionization MSE modes for both reference standards and fecal samples. The source temperature was maintained at 100 °C and desolvation temperature at 300 °C. Ion mobility separation in the drift cell was performed in nitrogen gas at a flow rate of 90 mL/min. The traveling wave cell was operated at a pressure of 3.29 (mbar) with a wave velocity of 650 m/s and a transfer wave height of 4 V. The trap and transfer cells were operated at 2.18 × 10⁻² and 2.29 × 10⁻² mbar, respectively. Mass calibration was performed using sodium iodide. Lockspray was collected at masses of 554.26 and 556.27 Da, corresponding to leucine enkephalin [M−H]− and [M + H]+, respectively, and applied during data analysis. In fragmentation mode, all ions were activated in the collision-induced dissociation cell (i.e., MSE was utilized).
Data Analysis.
Data analysis was performed using Progenesis QI software (version 2.3, Nonlinear Dynamics, Newcastle, UK). Default parameters were used for retention time alignment, peak picking, and peak deconvolution. Spectra were normalized to all compounds. Data were filtered for CV <30% in QC pool technical replicate injections. A prioritized compound list was generated via a one-factor ANOVA, with a diet-induced obesity (DIO) model set as the control group against GB-ILprox and GB-ILdist groups. Compounds were considered significant if p ≤ 0.01 and fold change ≥|2.0|. Significant compounds were selected for metabolite annotation.
Metabolite identifications were performed using an established classification system as previously described by Schrimpe-Rutledge and co-workers.25 In brief, metabolites were assigned a confidence level based on a scale of 5 → 1 (1 being the most confident) with increased confidence in annotation requiring increased supporting evidence (e.g., accurate mass, fragmentation pattern, and retention time matching with standards). This approach incorporates separation descriptors (RT, DT) as well as structural descriptors (MS, MS/MS). Measurements for each applicable descriptor were used to score annotations and provide a confidence metric. Following this system, identifications were made based on similarity to reference data found in in-house and online databases (Metlin, NIST, Chemspider). Scores were calculated by Progenesis based on mass error (<20 ppm), isotope similarity, and fragmentation spectra when applicable. In cases where multiple metabolites were possible candidates for a single feature, the metabolite(s) with the highest score was selected as the tentative annotation. Drift time was used to distinguish bile acids in cases in which they coeluted.
Data is available at the NIH Common Fund’s National Metabolomics Data Repository (NMDR) Web site, the Metabolomics Workbench, https://www.metabolomicsworkbench.org where it has been assigned Project ID (PR000836). The data can be accessed directly via the Project DOI: 10.21228/M8MQ2G.
RESULTS AND DISCUSSION
Bile Acid Separation Optimization.
One of the primary challenges in the mass spectrometric analysis of bile acids is the large redundancy of isobaric species that are commonly encountered.26 While ion mobility separations can separate many isobaric species,27–29 LC-IM-MS offers increased peak capacity and an additional analytical descriptor and thus was chosen for the untargeted fecal metabolite analyses of these complex mixtures.30–32
In addition to monitoring LC retention times, MS/MS fragmentation spectra and IM CCS values were collected for each of the reference standards (Figure 3B). Fragmentation patterns from CID of many isomeric bile acids are indistinguishable; thus, identification based on fragmentation data alone is difficult. However, CCS measurements are often able to differentiate isomers and were used to aid in identification. Extracted ion chromatograms of the matrix-free bile acids standards are shown in Figure 3A. The majority of the bile acid isomers (18/20) were resolved by the RPLC gradient presented, including the stereoisomers of α-, β-, and ω-muricholic acid and their conjugates. Although chenodeoxycholic acid and deoxycholic acid coeluted, these analytes were separated in the ion mobility dimension (i.e., distinct CCS values) and hence could be distinguished (Figure SF1, Supporting Information). Experimental data acquired from the bile acids was used to generate a bile acid database containing collision cross section (CCS), retention time (RT), and accurate mass. In these studies, this annotated in-house database was used to assign coeluting bile acids with increased confidence. Traveling wave collision cross sections (TWIM) and relative standard deviation can be found in Supporting Information (Table ST1). The calculated TWIM CCS values are observed to be higher than the reported drift tube ion mobility values found in the CCS compendium.22 These results have an average percent difference <6%, which is in agreement with results reported by Ridenour et al.33 in that an average percent difference of 7% can be expected when your mobility cell is calibrated with molecules structurally distinct from your analytes. For consistency across laboratories, we have utilized the calibration procedure recommended by the manufacturer.
Global, Untargeted Analysis of Fecal Metabolite Profiling.
In a preliminary study, the optimized bile acid method was applied to control mouse fecal samples. In addition to being able to identify nine bile acids (and bile acid-like molecules), this global, untargeted method facilitated the detection of a variety of compounds including lipids, amino acids, and peptides (Table ST2). These findings demonstrated that the optimized bile acid separation method is applicable for comparative analyses of more complex biological investigations.
Application of the Untargeted LC-IM-MS Method to Mouse Feces following Bile Diversion Surgery.
Three groups of mice underwent biliary diversion surgery to various degrees. The first group was a control in which an incision was made but no diversions were performed (group labeled as DIO), the second group received bile diversion 10 cm from the ileocecal valve (group labeled as GB-ILprox), and the third group received the bile diversion 4 cm from the ileocecal valve (group labeled as GB-ILdist). The metabolite extraction protocol was performed on collected feces for each group (n = 5 mice per sample group). With use of the described UPLC-IM-MS method, the complex mix of fecal metabolites was chromatographically resolved, detected, and annotated.
Many compounds emerged as statistically significant in pairwise comparisons against the DIO group (GB-ILprox vs DIO and GB-ILdist vs DIO). In positive ion mode, 9255 compounds were detected with 1093 compounds meeting the significance criteria (p ≤ 0.01 and a fold change ≥|2.0|) between the DIO and GB-ILdist groups, and 102 compounds meeting the significance criteria between the DIO and GB-ILprox groups. Of the 1801 compounds detected in negative mode, 181 compounds met significance criteria between DIO and GB-ILdist, while only 12 were found to be significant between DIO and GB-ILprox groups. A PCA score plot is shown in Figure 4A, revealing minimal separation between DIO and GB-ILprox and the marked separation between the former groups and the GB-ILdist cluster revealing a unique GB-ILdist metabolomic profile. Positive ion mode data are shown in Figure SF2, revealing a similar trend in group separation.
Figure 4.
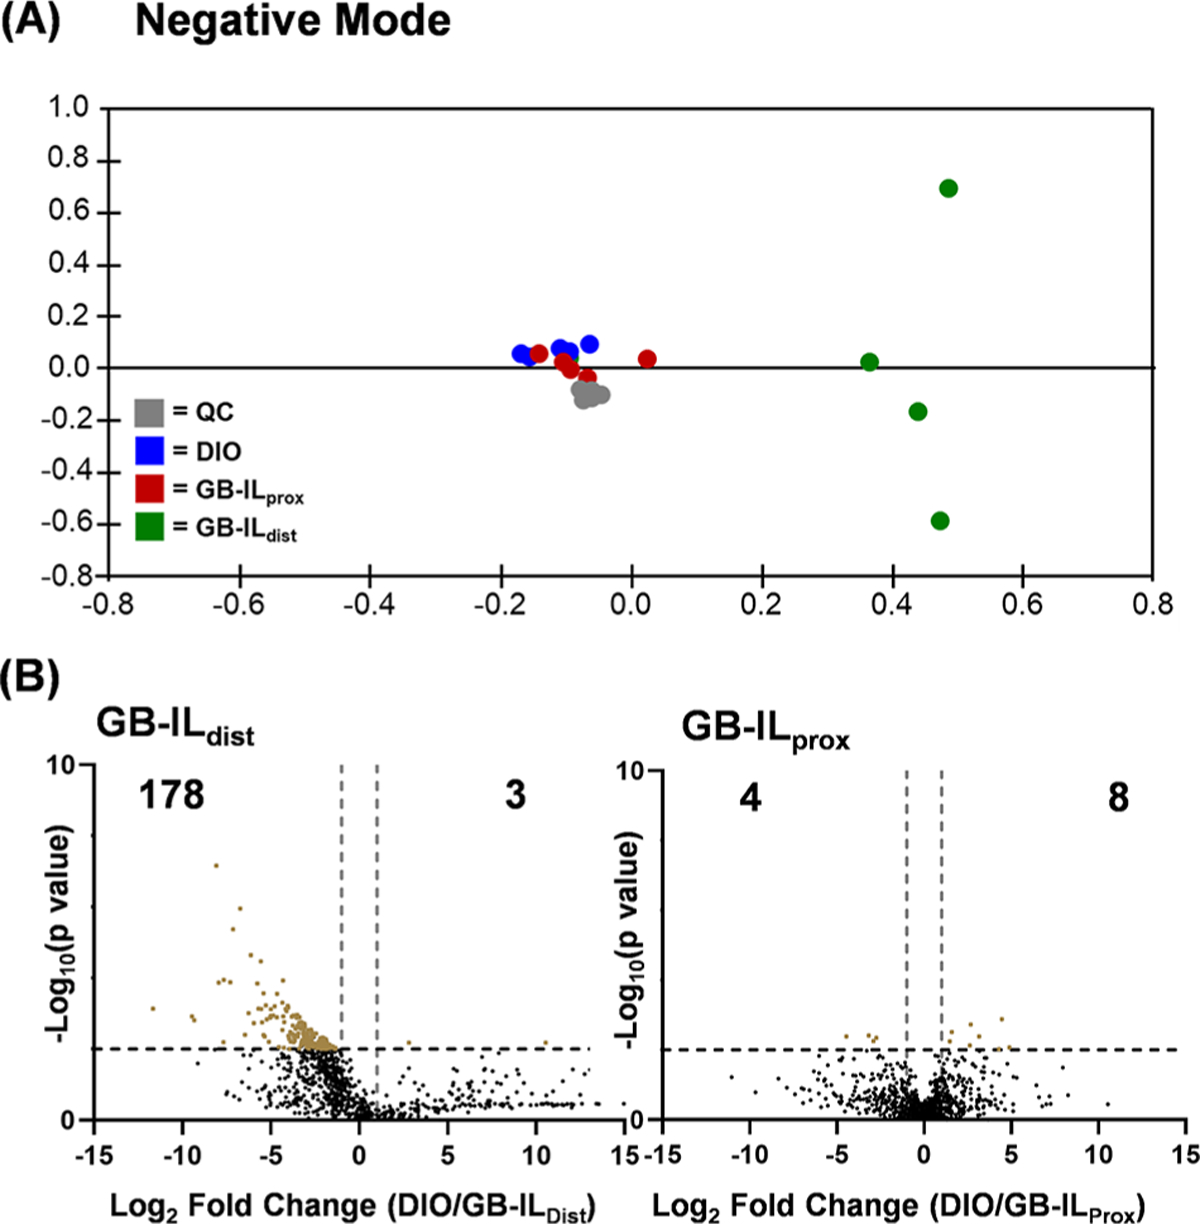
(A) Unsupervised principal component analysis (PCA) displaying biological replicates of the fecal sample of each sample group. Each point represents one biological replicate while color represents a complete sample group. The DIO and GB-ILprox samples show close similarities by clustering near each other, while GB-ILdist samples segregate in distinct clusters. (B) Pair-wise comparison was performed between the diet-induced obese mice (DIO) and surgical GB-ILdist or GB-ILprox mice to create volcano plots from the untargeted metabolomics data. Compounds of interest were prioritized using significance criteria (p ≤ 0.01 and fold change ≥|2|), visualized in the upper, outer corners of the volcano plots. (Negative mode data shown.)
Compounds were prioritized using pairwise comparisons relative to DIO to determine significant dysregulation of the sample groups. Figure 4B (and Figure SF2) displays volcano plots that highlight significant compounds in pairwise comparisons of DIO versus GB-ILdist or GB-ILprox samples. The subsets of significantly dysregulated metabolites were searched against the in-house bile acid database to evaluate potential changes in bile acid abundance; normalized bile acid intensities were compared between groups (Figure 5). Similar to the results outlined in the PCA, the bile acid profile of the DIO group and the GB-ILprox group were similar; however, the GB-ILdist group has several differences. Specifically, α-muricholic acid and chenodeoxycholic acid show a significant decrease, while cholic acid and taurocholic acid are increased. In addition to noticeable changes in the composition of bile acids and their derivatives, the abundances of other metabolites were observed to be statistically significant; these include vitamin derivatives, fatty acids, and cholesterol derivatives. Lists of tentatively identified metabolites are included in Tables ST3–ST6.
Figure 5.
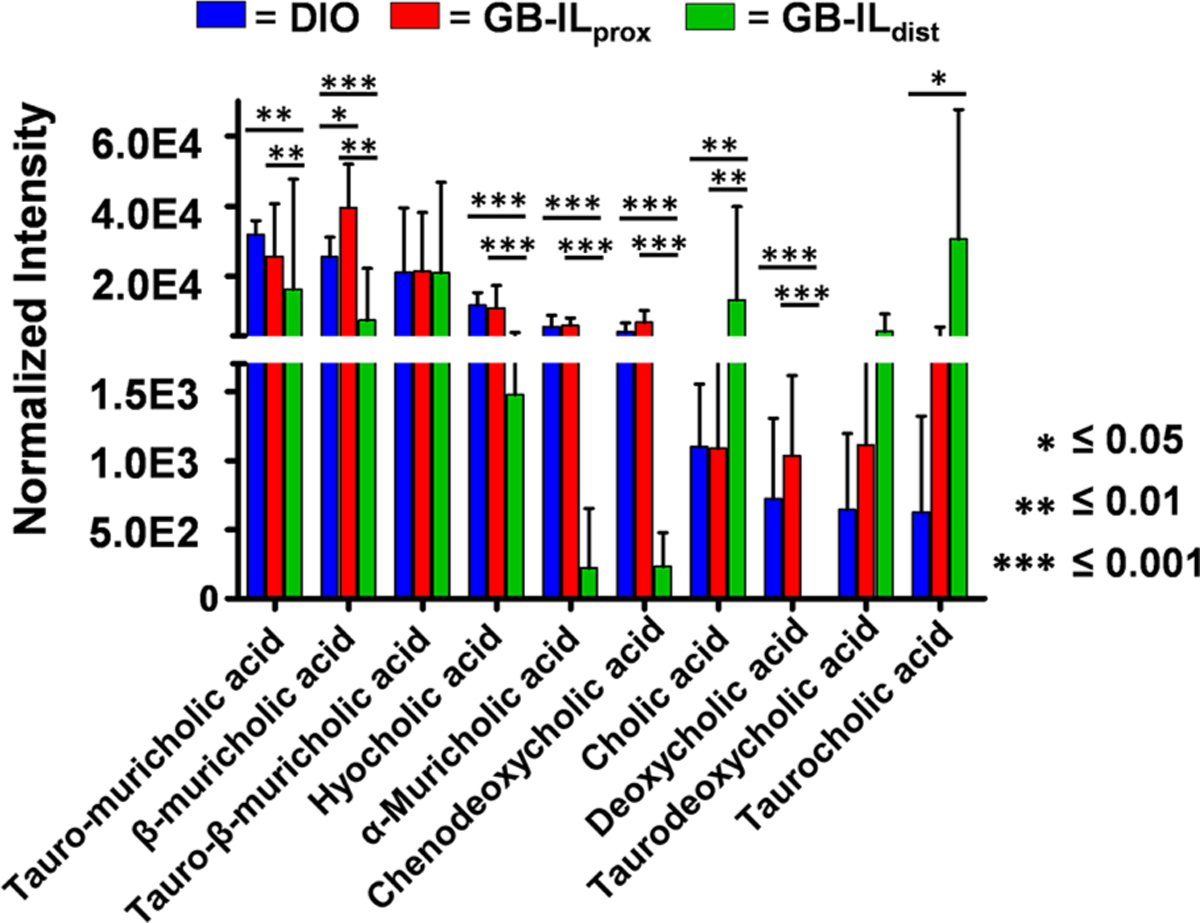
Observed bile acids and their normalized intensities among the biological sample groups (n = 5 per group). The values noted by an asterix represent p-values determined through a one-way Student’s t-test.
To associate altered metabolite abundances with their respective biological pathways, we performed predictive network activity analysis using Mummichog.17,25,34 The Mummichog algorithm uses the accurate mass of m/z features to map candidate metabolites to metabolic networks, calculating local enrichment of metabolites to distinguish those networks from a stochastic distribution of likely false activity. In these analyses, we were able to correlate metabolic function with perturbations in bile acid biosynthesis, vitamin A, D3, and E metabolism, arachidonic acid metabolism, leukotriene metabolism, and steroid hormone biosynthesis with the GB-ILdist surgery (Figure 6). These results are consistent with observed fluctuations of specific individual metabolites as there were significant changes observed in bile acid concentration and lipid soluble molecules. The enterohepatic circulation system is perturbed after biliary diversion surgery, so it is expected to affect numerous small molecules involved in emulsion and mixed micelle formation. The decrease in total fecal bile acids and the increase in lipid content also point to emulsion or mixed micelle formation. Additional significant changes were also observed for pathways not directly involved with bile acid circulation, for example, steroid hormone biosynthesis. These results suggest that the described optimized global, untargeted method can be used to elucidate perturbed pathways without a priori knowledge.
Figure 6.
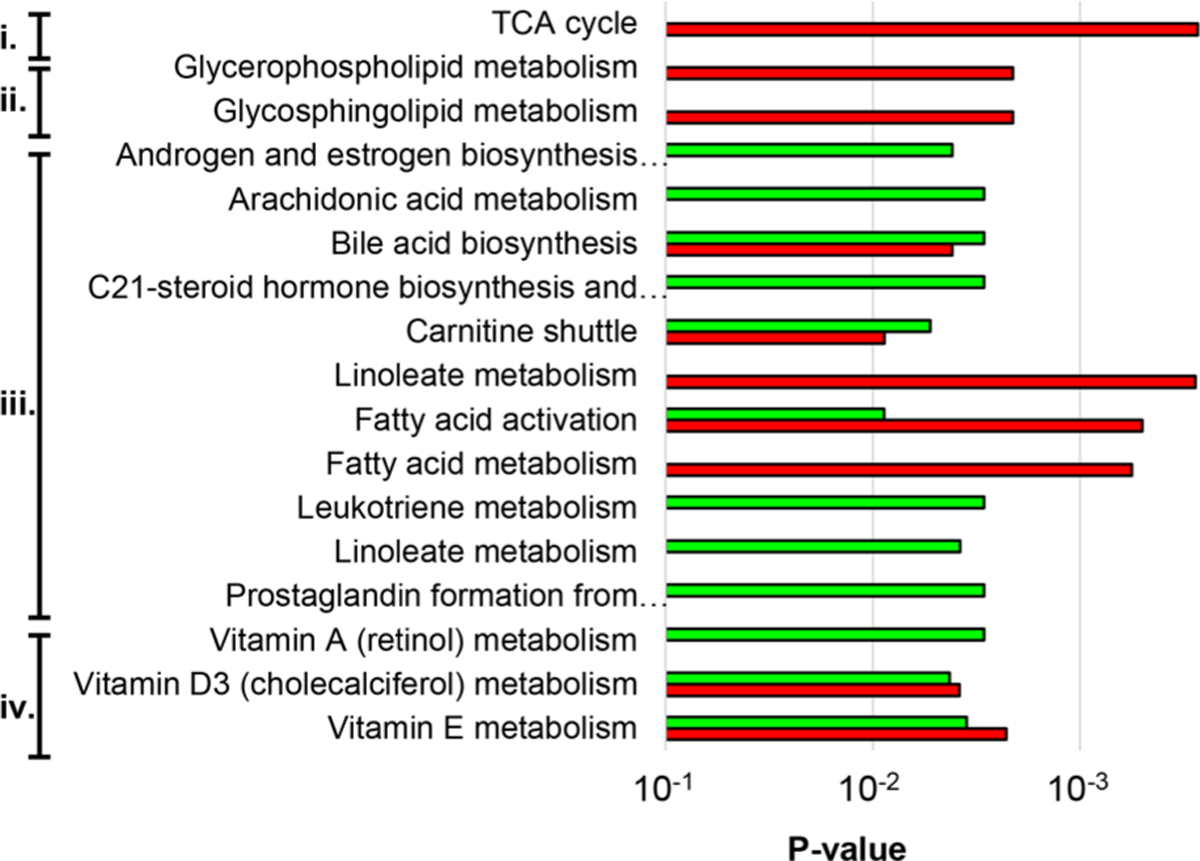
Top predicted pathways altered as a result of GB-ILprox (red) and GB-ILdist (green). Related pathways are labeled as (i) carbohydrate metabolism, (ii) glycan biosynthesis and metabolism, (iii) lipid metabolism, and (iv) vitamin metabolism. (Full pathway names can be found in Table ST7).
Alterations and fluctuations in the bile acid biosynthesis and conjugation pathways in the GB-ILdist sample group are in agreement with the knowledge that enterohepatic circulation is affected. Bile acids form emulsions with phospholipids and triacylglycerols prior to absorption through the small intestines. Disrupting this process greatly reduces lipid and lipophilic molecule absorption. It is important to note that 95% of bile acids are recycled via enterohepatic circulation; fecal samples were received 4 weeks after the procedure, which may account for this observed decrease. Considering that the emulsion and mixed micelle formation is disturbed, many of the bile acids would be excreted, and hence there would be a drastic decrease observed after 4 weeks because fewer bile acids would be recycled over time. Bile acids are synthesized from cholesterol, and disruption of the enterohepatic circulation can result in decreasing endogenous cholesterol and cholesterol-derived metabolites, as the body might attempt to account for the loss by synthesizing larger quantities. These results could explain why steroid hormone biosynthesis emerged as a significantly altered pathway (Figure SF3), as increasing bile acid production would draw more from the overall cholesterol pool. With more cholesterol being utilized for the synthesis of bile acids, other hormones derived from cholesterol will be affected.
CONCLUSION
In conclusion, we report a UPLC-IM-MS method that can be used to identify relative changes in bile acid abundance, as well as detect dysregulation of other small molecules that may contribute to observed phenotypical changes in the gut. The described method was able to observe expected perturbed pathways in the gastrointestinal system, and also revealed pathways that have not been previously explored. Taken together, these data demonstrate the utility in using UPLC-IM-MS analyses for studying gastrointestinal disease/treatment.
Supplementary Material
ACKNOWLEDGMENTS
J.C.P. thanks Dr. Katrina Leaptrot and Dr. Dina Stroud for their intellectual contributions. Financial support for aspects of this research was provided by The National Institutes of Health (Grants NCI R01DK105847 and R03CA222452). This work was supported in part using the resources of the Center for Innovative Technology at Vanderbilt University. The Metabolomics Workbench is supported by NIH grant U2C-DK119886. J.C.P. also thanks Vanderbilt University, the Institute of Chemical Biology, and the Fisk-Vanderbilt Master’s to PhD Bridge program for financial support.
Footnotes
Supporting Information
The Supporting Information is available free of charge on the ACS Publications website at DOI:10.1021/acs.anal-chem.9b02924.
Arrival time distribution for chenodeoxycholic acid and deoxycholic acid in negative ion mode; unsupervised PCA displaying biological replicates of the fecal sample of each sample group; overview of the steroid hormone biosynthesis pathway; table showing name, m/z, retention time, adduct type, traveling wave collision cross section, and relative standard deviation of bile acid standards; truncated tentative annotations of the top 30 most abundant compounds isolated from fecal metabolite extractions; tentative annotations of significant compounds in a pairwise comparison of DIO and GB-ILprox in positive mode; tentative annotation table of significant compounds in a pairwise comparison of DIO and GB-ILprox in negative mode; truncated tentative annotations of the 30 most significant compounds in a pairwise comparison of DIO and GB-ILdist in positive ion mode, tentative annotations of the 30 most significant compounds in a pairwise comparison of DIO and GBILdist in negative mode; affected pathways as predicted with Mummichog (PDF)
The authors declare no competing financial interest.
REFERENCES
- (1).Wang Y; Beydoun MA Epidemiol Rev. 2007, 29 (1), 6–28. [DOI] [PubMed] [Google Scholar]
- (2).Goodwin PJ; Stambolic V Annu. Rev. Med 2015, 66 (12), 281–296. [DOI] [PubMed] [Google Scholar]
- (3).Schauer PR; Bhatt DL; Kirwan JP; Wolski K; Aminian A; Brethauer SA; Navaneethan SD; Singh RP; Pothier CE; Nissen SE; Kashyap SR N. Engl. J. Med 2017, 376, 641–651. [DOI] [PMC free article] [PubMed] [Google Scholar]
- (4).Golzarand M; Toolabi K; Farid R Surg Endosc 2017, 31 (11), 4331–4345. [DOI] [PubMed] [Google Scholar]
- (5).Schauer PR; Kashyap SR; Wolski K; Brethauer SA; Kirwan JP; Pothier CE; Thomas S; Abood B; Nissen SE; Bhatt DL N. Engl. J. Med 2012, 366, 1567–1576. [DOI] [PMC free article] [PubMed] [Google Scholar]
- (6).Albaugh VL; Flynn CR; Tamboli RA; Abumrad NN F1000Research 2016, 5, 978. [DOI] [PMC free article] [PubMed] [Google Scholar]
- (7).Staels B; Fonseca VA Diabetes Care 2009, 32, S237–S245. [DOI] [PMC free article] [PubMed] [Google Scholar]
- (8).Flynn CR; Albaugh VL; Cai S; Cheung-Flynn J; Williams PE; Brucker RM; Bordenstein SR; Guo Y; Wasserman DH; Abumrad NN Nat. Commun 2015, 6, No. 7715. [DOI] [PMC free article] [PubMed] [Google Scholar]
- (9).Albaugh VL; Banan B; Antoun J; Xiong Y; Guo Y; Ping J; Alikhan M; Clements BA; Abumrad NN; Flynn CR Gastroenterology 2019, 156 (4), 1041–1051.e4. [DOI] [PMC free article] [PubMed] [Google Scholar]
- (10).Bobeldijk I; Hekman M; de Vries-van der Weij J; Coulier L; Ramaker R; Kleemann R; Kooistra T; Rubingh C; Freidig A; Verheij E J. Chromatogr. B: Anal. Technol. Biomed. Life Sci 2008, 871, 306–313. [DOI] [PubMed] [Google Scholar]
- (11).Garcia-Canaveras JC; Donato MT; Castell JV; Lahoz AJ Lipid Res. 2012, 53, 2231–2241. [DOI] [PMC free article] [PubMed] [Google Scholar]
- (12).Hines KM; Ashfaq S; Davidson JM; Opalenik SR; Wikswo JP; McLean JA Anal. Chem 2013, 85 (7), 3651–3659. [DOI] [PMC free article] [PubMed] [Google Scholar]
- (13).Goodwin CR; Sherrod SD; Marasco CC; Bachmann BO; Schramm-Sapyta N; Wikswo JP; McLean JA Anal. Chem 2014, 86 (13), 6563–6571. [DOI] [PMC free article] [PubMed] [Google Scholar]
- (14).Hines KM; Ballard BR; Marshall DR; McLean JA Mol. BioSyst 2014, 10 (11), 2827–2837. [DOI] [PMC free article] [PubMed] [Google Scholar]
- (15).May JC; Goodwin CR; McLean JA Curr. Opin. Biotechnol 2015, 31, 117–121. [DOI] [PMC free article] [PubMed] [Google Scholar]
- (16).Sherrod SD; McLean JA Clin. Chem 2016, 62 (1), 77–83. [DOI] [PMC free article] [PubMed] [Google Scholar]
- (17).May JC; Gant-Branum RL; McLean JA Curr. Opin. Biotechnol 2016, 39, 192–197. [DOI] [PMC free article] [PubMed] [Google Scholar]
- (18).Fenn LS; McLean JA Anal. Bioanal. Chem 2008, 391 (3), 905–909. [DOI] [PubMed] [Google Scholar]
- (19).McLean JA J. Am. Soc. Mass Spectrom 2009, 20 (10), 1775–1781. [DOI] [PubMed] [Google Scholar]
- (20).Fenn LS; Kliman M; Mahsut A; Zhao SR; McLean JA Anal. Bioanal. Chem 2009, 394 (1), 235–244. [DOI] [PMC free article] [PubMed] [Google Scholar]
- (21).May JC; Goodwin CR; Lareau NM; Leaptrot KL; Morris CB; Kurulugama RT; Mordehai A; Klein C; Barry W; Darland E; Overney G; Imatani K; Stafford GC; Fjeldsted JC; McLean JA Anal. Chem 2014, 86 (4), 2107–2116. [DOI] [PMC free article] [PubMed] [Google Scholar]
- (22).Picache JA; Rose BS; Balinski A; Leaptrot KL; Sherrod SD; May JC; McLean JA Chem. Sci 2019, 10, 983–993. [DOI] [PMC free article] [PubMed] [Google Scholar]
- (23).Leaptrot KL; May JC; Dodds JN; McLean JA Nat. Commun 2019, 10 (1), 985. [DOI] [PMC free article] [PubMed] [Google Scholar]
- (24).May JC; McLean JA Anal. Chem 2015, 87 (3), 14221436. [DOI] [PMC free article] [PubMed] [Google Scholar]
- (25).Schrimpe-Rutledge AC; Codreanu SG; Sherrod SD; McLean JA J. Am. Soc. Mass Spectrom 2016, 27, 1897–1905. [DOI] [PMC free article] [PubMed] [Google Scholar]
- (26).May JC; McLean JA Annu. Rev. Anal. Chem 2016, 9, 387–409. [DOI] [PMC free article] [PubMed] [Google Scholar]
- (27).Fenn LS; McLean JA Phys. Chem. Chem. Phys 2011, 13 (6), 2196–2205. [DOI] [PubMed] [Google Scholar]
- (28).Kliman M; May JC; McLean JA Biochim. Biophys. Acta, Mol. Cell Biol. Lipids 2011, 1811 (11), 935–945. [DOI] [PMC free article] [PubMed] [Google Scholar]
- (29).Dodds JN; May JC; McLean JA Anal. Chem 2017, 89 (1), 952–959. [DOI] [PMC free article] [PubMed] [Google Scholar]
- (30).Valentine SJ; Kulchania M; Barnes CAS; Clemmer DE Int. J. Mass Spectrom 2001, 212 (1–3), 97–109. [Google Scholar]
- (31).McLean JA; Ruotolo BT; Gillig KJ; Russell DH Int. J. Mass Spectrom 2005, 240, 301–315. [Google Scholar]
- (32).Dodds JN; May JC; McLean JA Anal. Chem 2017, 89 (22), 12176–12184. [DOI] [PMC free article] [PubMed] [Google Scholar]
- (33).Ridenour WB; Kliman M; McLean JA; Caprioli RM Anal. Chem 2010, 82 (5), 1881–1889. [DOI] [PMC free article] [PubMed] [Google Scholar]
- (34).Li S; Park Y; Duraisingham S; Strobel FH; Khan N; Soltow QA; Jones DP; Pulendran B PLoS Comput. Biol 2013, 9 (7), e1003123. [DOI] [PMC free article] [PubMed] [Google Scholar]
Associated Data
This section collects any data citations, data availability statements, or supplementary materials included in this article.


