Abstract
The delivery of stimulus by a deep brain stimulation (DBS) contact electrode at a particular location may lead to a quantifiable physiologic effect, both intraoperatively and postoperatively. Consequently, measured data values can be attributed to discrete scattered points in neuroanatomic space, allowing for interpolative techniques to generate a topographic map of spatial patterns. Ultimately, by relating the topographies of various intraoperative measurements to the postoperative counterparts and neuroanatomic atlases, outcome-guided adjustments to electrode position can be pursued intraoperatively. In this study, 52 Parkinson's disease patients were tested with a postoperative trial of stimulation and thresholds were recorded for motor adverse effects. A ‘roving window' interpolation algorithm was adapted to generate a topographic map of voltage threshold along selected axial, coronal and sagittal planes. By developing these relational topographies for a variety of intraoperative and postoperative effects, a multivariable approach towards DBS optimization emerges.
Key Words: Deep brain stimulation, Parkinson's disease, Interpolation, Mapping, Subthalamic nucleus, Topographies
Introduction
Deep brain stimulation (DBS) is finding increased application in the therapy of numerous neurological and psychiatric diseases [1, 2]. As new deep brain targets are being proposed and investigated, methods are required to evaluate and optimize these targets based on outcome [3, 4]. Regardless of the selected target and the condition being treated, each unique electrode location can be evaluated with a variety of intraoperative and postoperative quantitative measurements. For example, intraoperatively, the indices of microelectrode recordings [5, 6] or the effects of macrostimulation [7] can be recorded. Postoperatively, one can measure the threshold voltage required to observe a specific physiologic effect (e.g. adverse effects) or the magnitude of response (e.g. symptom reduction) to a uniform stimulus delivery. When such measured effects are collected over numerous patients, along with the precise location of the stimulus electrode, a database of ‘scattered' AC-PC locations and the attributable effect magnitude can be constructed. Methods of mathematical interpolation can then be used to create topographical maps enabling the surgeon to relate various intraoperative measurements to selected postoperative parameters, rendering the intraoperative measurements as proxies for optimizing future outcomes.
Multiple techniques of 3-dimensional interpolation exist, varying in complexity and applicability. Primarily developed in the geologic and meteorologic areas, most of these techniques estimate a value at a interpolant point by summarizing the values of ‘neighboring' data points [8, 9]. Spatial interpolation of neurophysiologic data is unique in that the measured physiologic effect may be a function of stimulus contact location [10, 11, 12], the proximity to discretely defined neuroanatomic structures and the nondiscrete near spherical morphology of the generated stimulus field [13]. Therefore, a spherical ‘roving window' method of interpolation is particularly well suited for spatially scattered neurophysiologic data. The ‘roving window' operation [14] identifies points within a geometric (e.g. spherical) window and assigns the average value of these points to the center of the window. The applicability of this technique lies in the use of the spherical window to mimic the approximate spherical field of activation.
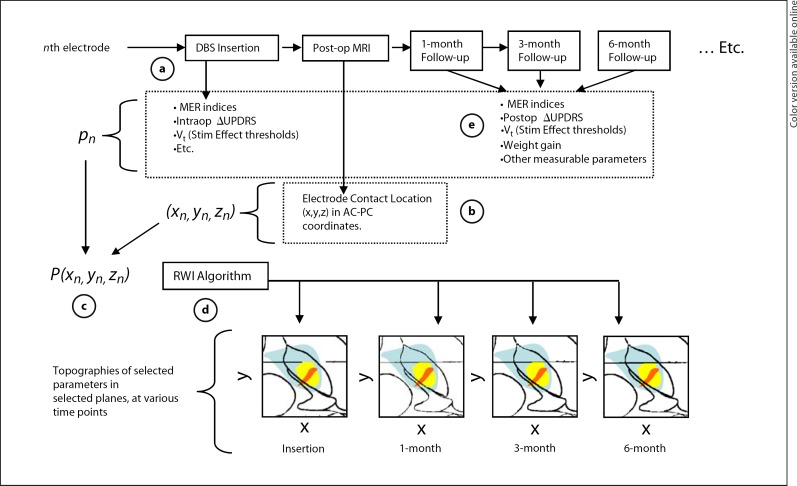
In the case of Parkinson's disease, the subthalamic nucleus (STN) and adjacent structures have been targeted for modulating symptoms of bradykinesia, tremors and rigidity [15, 16]. In 52 of our patients, with 208 implanted contact electrodes, we documented the voltage thresholds for each location-specific, stimulation-induced adverse effect observed. Using a ‘roving window' interpolation algorithm, we have constructed ‘relational topographies' for stimulation-induced motor effects and compared them to the comparable Schaltenbrand-Wahren Atlas plates [17]. This paper represents the first step in developing a framework to map multiple intraoperative and postoperative measurements along the same axes, providing a roadmap for target optimization (fig. 1).
Fig. 1.
A conceptual flowchart of topographic mapping of multiple variables for DBS optimization. a During insertion of the each nth electrode, selected parameters (p) can be quantitatively evaluated, denoted as pn. b Postoperatively, the position of each electrode contact can be calculated from postoperative MRI. c Over all N study patients, a collection of each measurement and the corresponding electrode contact position can be represented by a 4 × N array, Pn. d Array Pn is submitted to the roving window interpolation (RWI) algorithm to construct relational topographies of these parameters in selected planes. e Similarly, Pn arrays can be formed from measurements taken at sequential postoperative follow-up intervals, creating a visual time line of the measured effects.
Material and Methods
Patient Selection and Surgical Implantation
Patients were screened by a movement disorder specialist within the Movement Disorder Program at the University of Alabama at Birmingham. Candidates were healthy enough to tolerate the surgery, had been initially responsive to dopamine but developed a declining effect, had no MRI-detectable morphologic contraindication and were willing to commit to comprehensive follow-up. A neuropsychological profile was obtained preoperatively to exclude patients with dementia or severe psychiatric comorbidities. The patients reported in this series represent 52 consecutive patients for whom there is 1 month of follow-up data available. This study was performed in accordance with the Institutional Review Board at the University of Alabama at Birmingham. Patient demographics and clinical data are given in table 1.
Table 1.
Patient demographics and clinical characteristics
| Characteristics | Values |
|---|---|
| Patients, n | 52 |
| Male, % | 56.6% |
| Female, % | 43.4% |
| Age, years | |
| Onset | 46.6 ± 10.6 |
| Diagnosis | 47.4 ± 10.2 |
| Surgery | 59.2 ± 10.1 |
| Sinemet dose, mg | 932.5 ± 482 |
| UPDRS Part III scores, contralateral (global) | |
| Baseline | 26.9 ± 7.8 (34.5 ± 10.6) |
| 3-months post-DBS | 13.4 ± 6.0 (19.8 ± 9.3) |
| Percentage improvement | 48.42 ± 20.5 (42.6 ± 22.3) |
All surgery was performed by the same surgeon (B.L.G.). Each patient was fitted with a Cosman-Wells-Brown stereotactic frame, then sent for high-resolution volumetric MRI. All initial DBS targets were selected using stereotactic coordinates referenced to the AC-PC midpoint. Targets were modified as needed in reference to specific MRI anatomy and using a software algorithm that enabled mapping of prior DBS locations onto the current preoperative MRI. Under local anesthesia, through a burr hole situated for optimal trajectory, microelectrode recordings (Alpha Omega, Nazareth, Israel) were begun at a depth of 25 mm from the selected target. Recordings were pursued until a maximal span of characteristic STN neuronal profiles was obtained, typically 4–6 mm. The tip of the microelectrode was positioned at the electrophysiological floor of the STN. Using intraoperative fluoroscopy for confirmation, the quadripolar DBS (Medtronic 3387, Minneapolis, Minn., USA) was situated coincident with microelectrode position. DBS stimulation was carried out in a bipolar configuration to assess clinical efficacy as well as adverse stimulation effects. The final DBS position was the location that produced optimal clinical benefit with little or no adverse stimulation effects.
Calculation of Postoperative DBS Electrode Contact Location and Trajectory
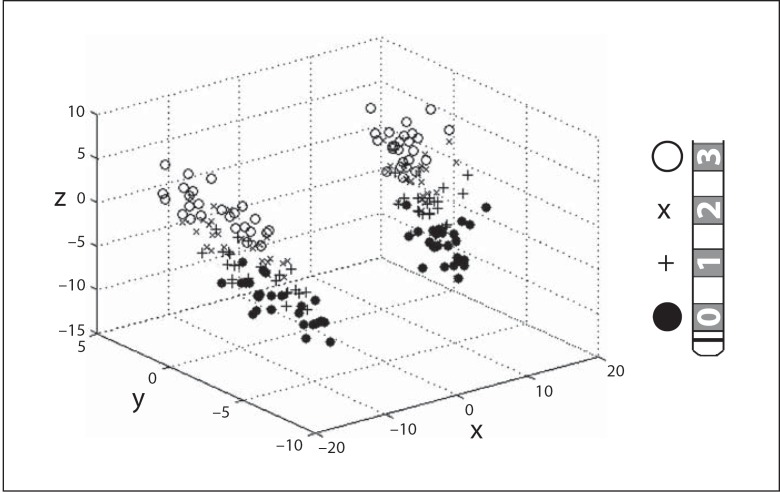
Each patient received a volumetric cranial MRI scan within 24 h of DBS placement. Using customized software, the MRI data were transformed to a standard AC-PC coordinate system. Each electrode contained 4 contacts, designated ‘0' (most distal), ‘1', ‘2' and ‘3' (most proximal). To minimize MRI artifact-induced inaccuracies, the coordinates of the center of each contact were calculated based on the user-defined location of 2 points: the electrode tip (which is less distorted than the contacts themselves) and a point on the electrode shaft just proximal to the electrode array, away from the area of maximal artifact, but close enough to the electrode array to not incur physical distortion of the electrode shaft. These 2 points were used to mathematically define a ‘trajectory', anchored at the electrode tip. With the known geometric specifications of the quadripolar electrode, the location of each electrode center was then calculated along the defined trajectory. Each contact point and the respective locations are depicted in figure 2.
Fig. 2.
A 3-dimensional plot (left) of the AC-PC locations of each electrode in the study group. Each electrode (right) contains 4 contacts, labeled ‘0' (•), ‘1' (+), ‘2' (×) and ‘3' ($$).
Collection of Voltage Thresholds for Stimulation-Induced Motor Effect
At the 1-month postoperative visit, a monopolar interrogation protocol was followed that delivered monopolar stimulus (contact negative, case positive) to each electrode contact. Pulse width and frequency were held constant (60 µs and 145 Hz, respectively) while voltage was increased in 0.2- to 0.3-V increments until a stimulus side effect was either reported by the patient and/or seen by the examiner or until a voltage of 6–7 V was achieved. Each contact was tested in isolation; if a patient had a contralateral DBS, it was turned off during the interrogation protocol. For the spatial analysis in this study, we analyzed contacts that produced a motor effect. A side effect was judged to be ‘motor' if stimulation produced involuntary contralateral muscle contractions. The specific motor response, its body location and the voltage at which it first appeared (Vt) was recorded.
‘Roving Window' Interpolation Algorithm for Constructing Relational Topographies in AC-PC Space.
For each electrode contact that is stimulated, a quantitative response parameter is measured and assigned to its location. For this report, we used the voltage associated with involuntary muscle contraction. Thus, for N electrode contact points, a 4 × N array, P, can be generated with the nth row of P described as Pn = (xn, yn, zn, pn), where (xn, yn, zn) describe the AC-PC coordinates for the electrode contact. In this case, pn represents the quantitative measurement, Vt, but the algorithm can be used for any quantitative measure, obtained intraoperatively or postoperatively.
For reconstructions in the axial plane, the algorithm is described by the following steps, executed in MATLAB (Natick, Mass., USA) and depicted in figure 3.
Fig. 3.
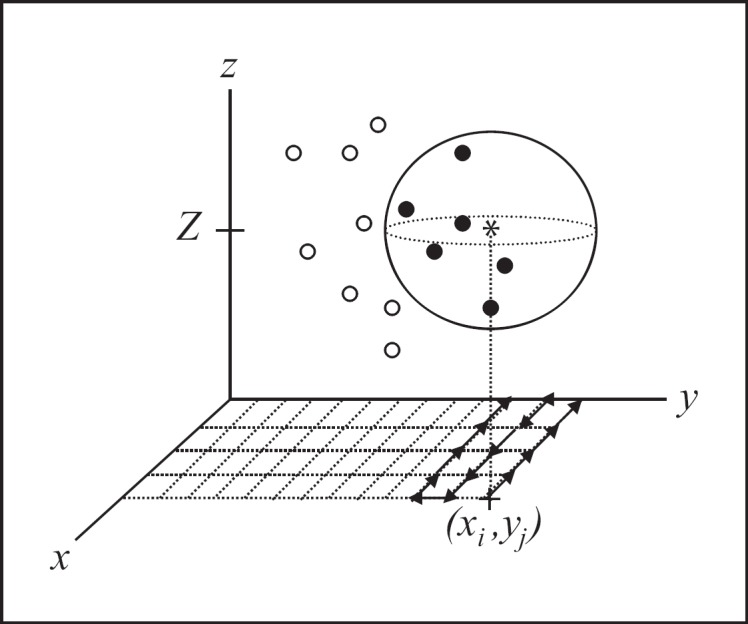
A schematic description of the roving window interpolation (RWI) algorithm. At a gridded interpolant point (xi, yj, Z) denoted by *, a mathematical sphere with radius r is generated. All data points are searched for location, and points within the sphere (•) are included within sub-array S(xi, yj). Points outside of the sphere ($$) are excluded from sub-array S(xi, yj). S(xi, yj) is then submitted to a function (f) of choice. The sphere is then moved along the grid to complete the interpolation for the selected plane.
(1) A 150 × 150 point grid, with points (xi, yj) is constructed in the AC-PC plane of interest at z = Z (the numerical instance along the vertical coordinate, z). In this example, planes were selected to encompass the STN.
(2) A 2-dimensional iterative process is executed, with each point (xi, yj) serving as the center of a mathematical sphere with radius (r) = 2 mm.
(3) At each point (xi, yj), the 4 × N array is searched for coordinates (xn, yn, zn) that are contained within the mathematical sphere and placed in a separate sub-array, S(xi, yj), assigned to point (xi, yj). Formally put, sub-array S(xi, yj) is represented as
for n = 1 to N
(4) S(xi, yj) now contains all points of P within a euclidean distance less than r. Points within the sub-array, S(xi, yj), are now used for a function (f) of choice. In this paper, we demonstrate the following functions:
(a) f1(xi, yj) = mean(pn) for all pn ϵ S(xi, yj);
(b) f2(xi, yj) = size[S(xi, yj)], where ‘size' calculates the dimension of the array (i.e. the number of points in the sub-array);
(c) f3(xi, yj) = std(p) for all p ϵ S(xi, yj), where ‘std' is the standard deviation operation;
(d) f4(xi, yj) = f1, if f2 < STDt and f3 < Nt, else f4 = null;
where STDt and Nt are threshold constants for standard deviation and number of points, respectively. The function f1 represents the mean of all points in the selected sub-array, while f2 calculates the size of the sub-array, indicating sampling density at that point. Function f3 represents the standard deviation of the points within each sub-array. The function f4 is a complex and constrained function that queries the statistical relevance of S(xi, yj), and includes the sub-array in visualization only if the statistical criteria of standard deviation and sampling density is met.
(5) Two-dimensional relational topographies are constructed from points xi, yj and f(xi, yj, Z), using the ‘contourf' function within MATLAB. Subsequent executions of the algorithm define relational topographies at a series of points along the z-axis. Alternately, the algorithm can be easily adapted to display topographies in the coronal and sagittal planes by replacing (xi, yj) for (xi, zj) or (yi, zj), respectively. The function, f(xi, yj) can be cascaded with other functions.
(6) Appropriate neuroanatomic templates from the Schaltenbrand-Wahren atlas were digitally scanned into electronic format, and then scaled to match the axes of each relational topography constructed.
Interpolation Error and ‘Neighbor' Analysis
Algorithms for interpolation can be characterized by the error, e(x, y) and the area of coverage produced. The error of interpolation is simply the difference in magnitude of the actual data value pn at point (xn, yn, zn), from the interpolant function at the point (xi, yi, zi) = (xn, yn, zn). The resulting error is a function of the size of the roving sphere, r, and the variance of values within the neighborhood of the interpolant point. The error matrix, as a function of radius can be denoted as:

The global assessment of normalized error, E, at a given radius, can be written as the mean of all entries in the error matrix,

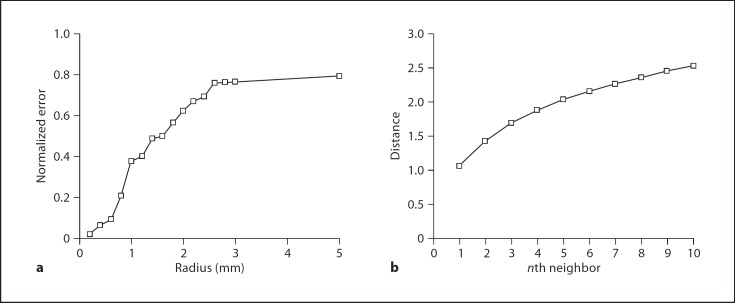
Figure 4a depicts the relationship between the error, as a function of radius, computed in MATLAB. As expected, E(r) increases with the radius in a sigmoidal nature and approaches a limit of 0.8 V. The selection of radius for data analysis is arbitrary and should depend on a number of factors. Larger spherical windows incorporate more data points which minimizes random error, but does not reflect the occurrence of true differences attributable to spatial location. Conversely, smaller spherical windows optimizes the depiction of location-dependent measurement differences, but then introduces random error attributable to the technique of measurement associated with each individual point.
Fig. 4.
A plot of the mean Vt error per data point, as a function of the radius. With larger radii, the error saturates at 0.8, while smaller radii approach zero error. b A plot of mean distance of the nth neighbor, calculated over all data points. On average, the 5th neighboring point exists approximately 2 mm away from the point of interest.
The number of points included in each spherical window depends on the clustering of points around the interpolant point. The ‘nearest neighbor' is defined as the data point that is the nearest to the selected data point. The ‘nth neighbor' is defined as the nth closest point to the selected data point. For each data point, a list of ‘neighbors' was constructed, then the mean distance for each ‘nth neighbor' was calculated, and is depicted in figure 4b. For example, the 5th neighbor is located 1.86 mm away; therefore, the selection of a 2-mm radius window incorporates 5 data points on average, which is an arbitrary, but reasonable, sampling size.
Therefore, for the construction of relational topographies in this paper, we have selected a radius size of 2 mm, as a compromise value that minimizes random error, but includes a sufficient number of points to maintain significance. Furthermore, intraoperatively, we reposition the catheter in 2-mm increments, giving this value for spherical radius a practical basis, as well.
Results
Relational Topographies of Mean Vt in AC-PC Space
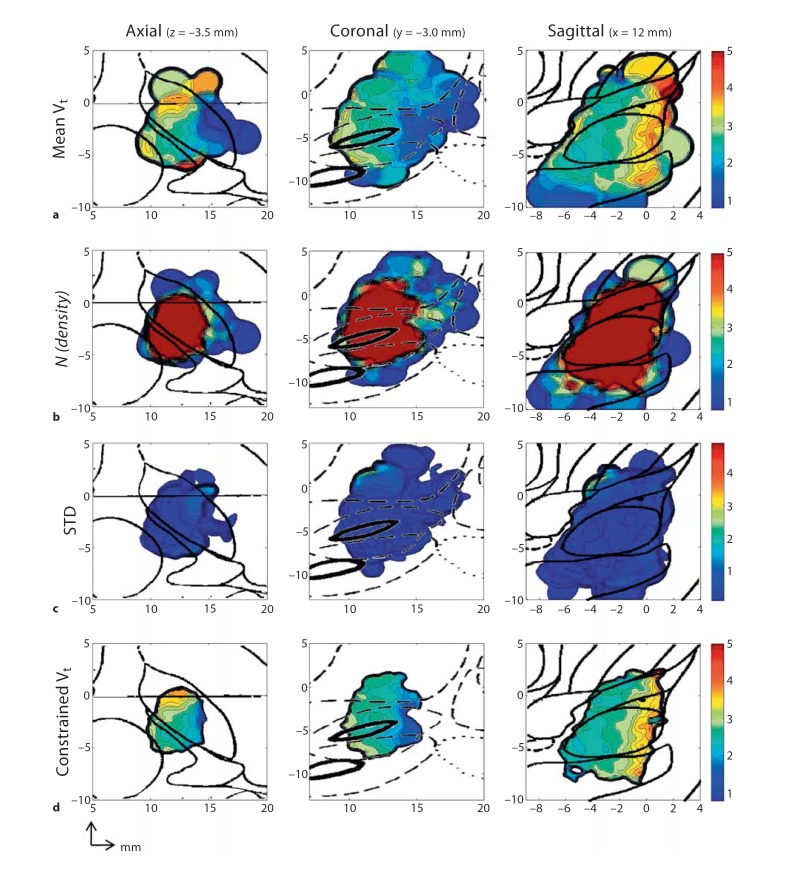
Figure 5a depicts the relational topographies constructed for mean Vt (function f1) in the axial, sagittal and coronal planes, with respective atlas overlays. Areas of high Vt (Vt >3V) are represented by bright colors and indicate areas of voltage insensitivity. Areas of low Vt (Vt <3V) are represented by dark colors and indicate areas of voltage sensitivity. The axial plot demonstrates areas of relative voltage insensitivity at approximately x = 12, y = 0. In the sagittal plane, this corresponds with a rostrocaudal corridor of voltage insensitivity that is positioned in the anterior portion of the STN. The posterior and lateral regions of low Vt are adjacent to the middle internal capsule, where corticospinal tracts of the arm, trunk and legs reside.
Fig. 5.
Relational topographies of f1, f2, f3, f4. a Relational topographies of raw f1 = Vt for the axial (z = −3.5 mm), coronal (y = −3.0 mm) and sagittal planes (x = 12.0 mm). b Topographies of f2 representing spatial density of sampled points within the roving sphere in the same axial, coronal and sagittal planes. c Topographies of standard deviation (f3) of points within the roving sphere in the same axial, coronal and sagittal planes. d Relational topographies of f4, a complex function with the statistical constraints of STD <1.5 and N =5, in the same axial, coronal and sagittal planes.
Relational Topographies of Sampling Density
Figure 5b depicts the relational topographies for sampling density (function f2), with the respective atlas overlays for each orthogonal plane. There exists a region of high sampling density (n >5) centered around x = 12 mm, y = −3 mm and z = −4 mm. In the axial topography, the medial-lateral and anterior-posterior width of this region is approximately 5 mm, which is expected, as the majority of the intraoperative adjustments were made in 2-mm increments from the initial preoperative target. In the sagittal plane and coronal planes, the rostrocaudal extent of this region measures at nearly 10 mm, correlating with the rostrocaudal arrangement of the contacts along the shaft of the electrode. However, outside of this volume of high sampling density, the overall paucity of points prevent the construction of meaningful topographies. For example, the posterolateral region of low Vt (described above) results from several points that strayed laterally. While this area of voltage sensitivity likely exists due to internal capsule proximity, a lateral sagittal construction through this area is restricted by the paucity of lateral points along the rostrocaudal axis. As a result, for this study, topographies are constructed through the areas of maximal sampling density to provide the best visualization of electrophysiological gradients.
Relational Topographies of Standard Deviation
Figure 5c depicts the relational topographies for the standard deviation of Vt (function f3) in the orthogonal planes and scaled to the range of Vt. In general, the standard deviation rarely exceeds 2.0 V for the entire sampling space. This result correlates with a global standard deviation, for all electrode contacts, of 1.13 V. Of note, figures 4a, b and c are morphologically distinct, with the distributions of sampling density and standard deviation devoid of the unique gradients and neuroanatomic relationships observed in the distribution of Vt. Thus, the validity of the roving window interpolation (RWI) is relatively independent of sampling density and data variability.
Relational Topographies of Vt with Statistical Constraints
Figure 5d illustrates the relational topographies for mean Vt when constrained for sampling density Nt >5, and STDt 1.5 (function f4). Significantly, neuroanatomic and functional gradients are preserved, despite the strict statistical criteria. In the axial plane, there is a clear anterior-posterior and medial-lateral gradient of mean Vt, with the most voltage insensitive areas in the anterior-medial regions. This corresponds with an anterior-medial corridor of voltage insensitivity, positioned in the anterior STN, in a similar fashion to figure 4az (function f1). Because of the applied constraints, the areas represented in figure 4d are smaller, with the areas of statistical weakness excluded along the edges.
Discussion
Optimal placement of a DBS electrode, despite careful preoperative planning, is a challenging endeavor confounded by technical inaccuracies, patient variability and a lack of consensus on a true optimal location. Intraoperatively, attempted proxies for optimal outcome have been proposed, including MERs and macrostimulation, yet the relationship between these proxies, the contact location, postoperative efficacy and stimulation tolerability remain unclear. To elucidate the spatial relationship of intraoperative proxies to postoperative measures, a multivariate spatial analysis which can relate these parameters in a common coordinate system is required. In this paper, such a technique is proposed and applied to the stimulus threshold measures for postoperative adverse effects. Ultimately, this technique can be used to construct ‘relational topographies' of various intraoperative proxies and postoperative outcomes, the former serving as roadmaps to regions of demonstrated postoperative success.
The RWI method is well-suited for multivariate spatial analysis of neurophysiologic phenomena. Because of the density and discreteness of neuroanatomic structures (the area of the STN in this case), any 2 nearby locations may demonstrate vastly different functional roles (i.e. white matter vs. gray matter). Today's neuromodulation technology is such that a point source of electrical stimulation cannot activate a discrete ‘functional zone' of interest without the possibility of current spread producing other effects. These effects are due to activation of fibers in passage or of proximal neuronal populations that are functionally different. Therefore, any tool used to analyze the spatial relationships of neuromodulatory outcomes must account for this phenomena, with an arbitrary level of confidence so as to be useful in guiding therapeutic intervention in a selected population of patients. The RWI method excels by analyzing the ‘neighborhood' of activity, which can model the stimulus field applied. The method achieves some statistical confidence by analyzing the collection of neighboring data points, but preserves spatial relationships by giving each interpolant point a different collection of neighbors.
Consequently, the RWI method achieves a balance, albeit arbitrary, between statistical significance and spatial sensitivity. With the selection of larger radii, the algorithm favors statistical integrity by virtue of the larger number of data points, but the spatial dependence will be negated, as reflected in the cumulative error (fig. 3). Conversely, the selection of smaller radii includes fewer points in the defined function and more accurately reflects activity in the particular locale, but is more subject to the whims of outliers and random error. As this paper also demonstrates, the application of constraints (as in function f4) can be used to eliminate the effects of outliers and low data density areas, while still preserving basic spatial gradients.
Applying the RWI technique to the data we have collected, this method allows deduction of basic spatial relationships and gradients that result from the electrical stimulation fields that elicit motor effects. In general, patients exhibit higher sensitivity to stimulation from contacts placed in more posterior and lateral positions. Neuroanatomically, this relationship is consistent with the position of the corticospinal tracts of the arm, trunk and legs, positioned in the middle to lateral regions of the cerebral peduncle. Likewise, the absence of rostrocaudal gradients correlates with the rostrocaudal course of corticospinal tracts and the relative preservation of neuroanatomic relationships along this long axis.
The generalized RWI technique presented here can be easily upgraded to produce more complex analysis. For example, data points can be inversely weighted according to distance, a feature that would mimic the inverse relationship of field strength to distance. Additionally, one could substitute the spherical window for a complex, location-dependent geometric window constructed from computer models of field morphology [18, 19]. This technique can be extended to indices of symptom reduction and tolerability, which can be measured at various postoperative time-points (e.g. 3-month and 6-month followups). Such analysis would allow for a longitudinal depiction of how quantitative indices at the time of insertion predicts long-term efficacy and adverse effects at various postoperative time-points, which would be immensely useful in clinical practice. Furthermore, substituting complex, but perhaps more realistic, sampling windows would yield a more accurate topography of stimulation-induced effects, both in terms of outcome and intraoperative proxies for outcome.
As the applications for DBS grows, so will the need for multivariable spatiotemporal analysis. The technique presented in this paper describes a robust method for illustrating the spatial morphologies of thresholds for stimulus-induced adverse effects. By extrapolating this technique to multiple intraoperative and serial postoperative indices, comparing the resulting morphologies within the same coordinate system establishes a comparative paradigm for optimization and localization.
References
- 1.Greenberg BD, Askland KD, Carpenter LL. The evolution of deep brain stimulation for neuropsychiatric disorders. Front Biosci. 2008;13:4638–4648. doi: 10.2741/3029. [DOI] [PubMed] [Google Scholar]
- 2.Kern DS, Kumar R. Deep brain stimulation. Neurologist. 2007;13:237–252. doi: 10.1097/NRL.0b013e3181492c48. [DOI] [PubMed] [Google Scholar]
- 3.Guehl D, Edwards R, Cuny E, Burbaud P, Rougier A, Modolo J, Beuter A. Statistical determination of the optimal subthalamic nucleus stimulation site in patients with Parkinson disease. J Neurosurg. 2007;106:101–110. doi: 10.3171/jns.2007.106.1.101. [DOI] [PubMed] [Google Scholar]
- 4.Nowinski WL, Belov D, Benabid AL. An algorithm for rapid calculation of a probabilistic functional atlas of subcortical structures from electrophysiological data collected during functional neurosurgery procedures. Neuroimage. 2003;18:143–155. doi: 10.1006/nimg.2002.1299. [DOI] [PubMed] [Google Scholar]
- 5.Chen CC, Pogosyan A, Zrinzo LU, Tisch S, Limousin P, Ashkan K, Yousry T, Hariz MI, Brown P. Intra-operative recordings of local field potentials can help localize the subthalamic nucleus in Parkinson's disease surgery. Exp Neurol. 2006;198:214–221. doi: 10.1016/j.expneurol.2005.11.019. [DOI] [PubMed] [Google Scholar]
- 6.Benazzouz A, Breit S, Koudsie A, Pollak P, Krack P, Benabid AL. Intraoperative microrecordings of the subthalamic nucleus in Parkinson's disease. Mov Disord. 2002;17((Suppl 3)):S145–S149. doi: 10.1002/mds.10156. [DOI] [PubMed] [Google Scholar]
- 7.Gross RE, Krack P, Rodriguez-Oroz MC, Rezai AR, Benabid AL. Electrophysiological mapping for the implantation of deep brain stimulators for Parkinson's disease and tremor. Mov Disord. 2006;21((Suppl 14)):S259–S283. doi: 10.1002/mds.20960. [DOI] [PubMed] [Google Scholar]
- 8.Longley P, Goodchild M, Maguire D, Rhind D. Geographical Information Systems: Principles, Techniques, Management and Applications. New York, John Wiley. 2005 [Google Scholar]
- 9.Lam NS-N. Spatial interpolation methods: a review. Cartogr Geogr Inf Sci. 1983;10:129–150. [Google Scholar]
- 10.McClelland S, 3rd, Ford B, Senatus PB, Winfield LM, Du YE, Pullman SL, Yu Q, Frucht SJ, McKhann GM, 2nd, Goodman RR. Subthalamic stimulation for Parkinson disease: determination of electrode location necessary for clinical efficacy. Neurosurg Focus. 2005;19:E12. [PubMed] [Google Scholar]
- 11.Anheim M, Batir A, Fraix V, Silem M, Chabardes S, Seigneuret E, Krack P, Benabid AL, Pollak P. Improvement in Parkinson disease by subthalamic nucleus stimulation based on electrode placement: effects of reimplantation. Arch Neurol. 2008;65:612–616. doi: 10.1001/archneur.65.5.612. [DOI] [PubMed] [Google Scholar]
- 12.Senatus PB, Teeple D, McClelland S, 3rd, Pullman SL, Yu Q, Ford B, McKhann GM, 2nd, Goodman RR. A technique for minimally altering anatomically based subthalamic electrode targeting by microelectrode recording. Neurosurg Focus. 2006;20:E8. doi: 10.3171/foc.2006.20.5.9. [DOI] [PubMed] [Google Scholar]
- 13.McIntyre CC, Mori S, Sherman DL, Thakor NV, Vitek JL. Electric field and stimulating influence generated by deep brain stimulation of the subthalamic nucleus. Clin Neurophysiol. 2004;115:589–595. doi: 10.1016/j.clinph.2003.10.033. [DOI] [PubMed] [Google Scholar]
- 14.Berry J. Fundamental operations in computer-assisted map analysis. Int J Geogr Inf Sci. 1987;1:119–136. [Google Scholar]
- 15.Benabid AL, Krack PP, Benazzouz A, Limousin P, Koudsie A, Pollak P. Deep brain stimulation of the subthalamic nucleus for Parkinson's disease: methodologic aspects and clinical criteria. Neurology. 2000;55:S40–S44. [PubMed] [Google Scholar]
- 16.Plaha P, Ben-Shlomo Y, Patel NK, Gill SS. Stimulation of the caudal zona incerta is superior to stimulation of the subthalamic nucleus in improving contralateral parkinsonism. Brain. 2006;129:1732–1747. doi: 10.1093/brain/awl127. [DOI] [PubMed] [Google Scholar]
- 17.Schaltenbrand G, Wahren W. Stuttgart, Thieme Medical Publishers. ed 2 1977. Atlas for Sterotaxy of the Human Brain. [Google Scholar]
- 18.McIntyre CC, Butson CR, Maks CB, Noecker AM. Optimizing deep brain stimulation parameter selection with detailed models of the electrode-tissue interface. Conf Proc IEEE Eng Med Biol Soc. 2006;1:893–895. doi: 10.1109/IEMBS.2006.260844. [DOI] [PubMed] [Google Scholar]
- 19.Butson CR, McIntyre CC. Role of electrode design on the volume of tissue activated during deep brain stimulation. J Neural Eng. 2006;3:1–8. doi: 10.1088/1741-2560/3/1/001. [DOI] [PMC free article] [PubMed] [Google Scholar]


