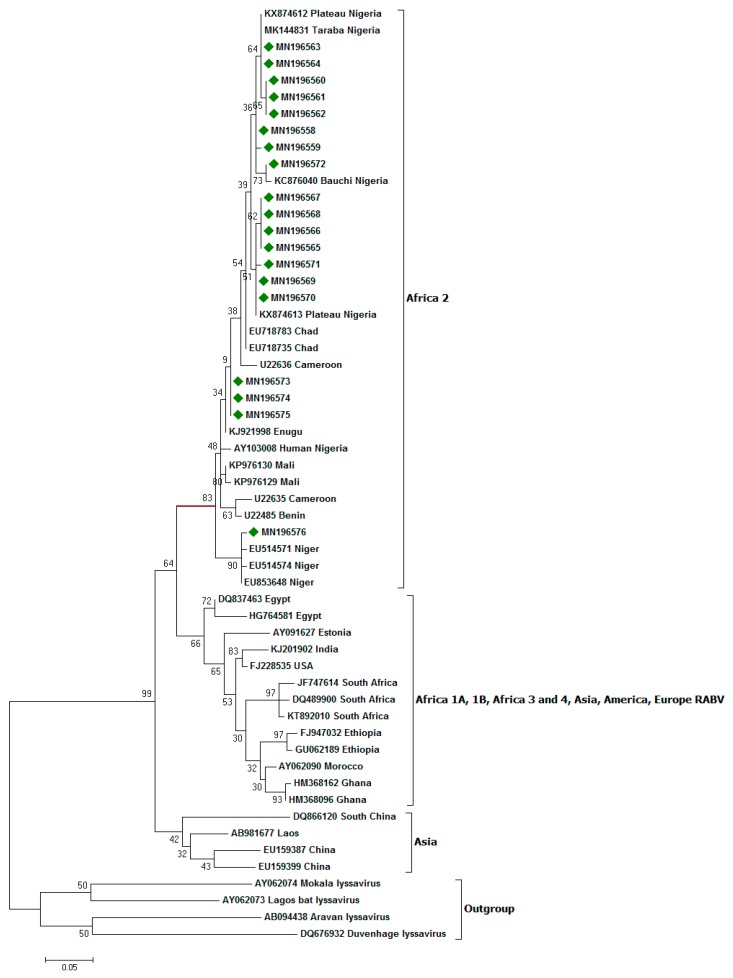
Figure 2.
Maximum likelihood (ML) phylogenetic tree of the 19 Southeastern Nigerian RABV N-genes generated using ML algorithm (1000 bootstrap replications). The analyses involved 56 nucleotide sequences. All positions with <95% site coverage were eliminated. Evolutionary analyses were conducted in MEGA7 [34]. The bootstrap values (%) are shown on the nodes supporting these branches. The tree is drawn to scale, with branch lengths in the same units as those of the evolutionary distances used to infer the phylogenetic tree. The evolutionary distances were computed using the Kimura two-parameter method [37] and are in the units of the number of base substitutions per site. Isolates for which the partial N gene sequence was obtained in this study are indicated by a diamond green color.

