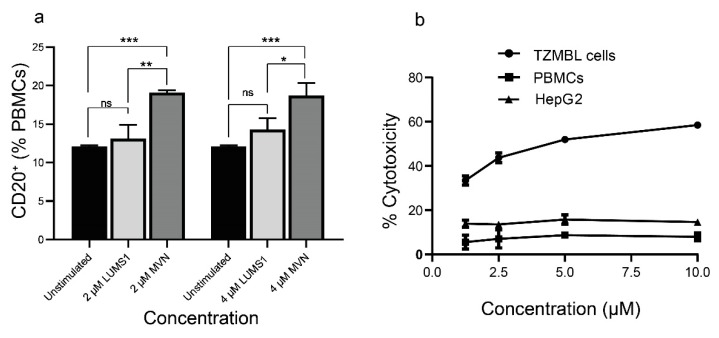
Figure 6.
Evaluation of B cells activation by LUMS1 and its cytotoxicity: (a) graph presenting the flow cytometry analysis to determine the population of CD20+ cells in freshly isolated PBMCs. PBMCs were isolated from freshly collected blood using density gradient centrifugation and washed with PBS. After treating PBMCs (106 cells/mL) with varying concentrations of LUMS1 and MVN for 72 h at 37 °C and 5% CO2, cells were washed with PBS and incubated with percp cy5.5-conjugated anti-CD20 antibodies for 30 min at 4 °C. Finally, cells were washed with PBS (2% FBS), fixed with 1% formaldehyde and analyzed by FACS, using CellQuest software for data acquisition. Data were statistically analyzed using GraphPad Prism software. Analyses were performed in triplicate and one-way ANOVA with multiple comparisons was used to compare different groups. * p ≤ 0.05, ** p ≤ 0.01; *** p ≤ 0.001. (b) The plot showing concentration dependent cytotoxic effect of LUMS1 on PBMCs, HepG2, and TZM-bl cells.

