

Summary
Positive-stranded RNA viruses extensively remodel host cell architecture to enable viral replication. Here we examined the poorly understood formation of specialized membrane compartments which are critical sites for the synthesis of the viral genome. We show that the replication compartments (RCs) of enteroviruses are created through novel membrane contact sites that recruit host lipid droplets (LDs) to the RCs. Viral proteins tether the RCs to the LDs and interact with the host lipolysis machinery to enable transfer of fatty acids from LDs, thereby providing lipids essential for RC biogenesis. Inhibiting the formation of the membrane contact sites between LDs and RCs or inhibition of the lipolysis pathway disrupts RC biogenesis and enterovirus replication. Our data illuminate mechanistic and functional aspects of organelle remodeling in viral infection and establish that pharmacological targeting of contact sites linking viral and host compartments is a potential strategy for antiviral development.
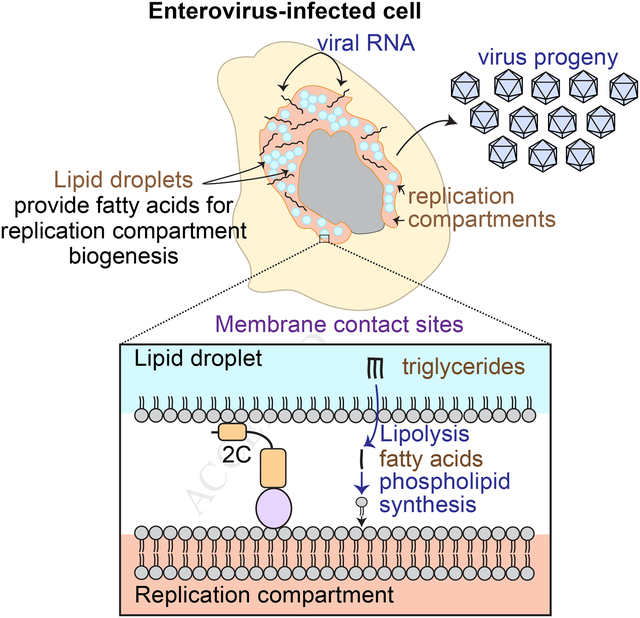
Graphical Abstract
In Brief:
The specialized compartments where enteroviruses replicate are created through membrane contact sites where viral proteins tether host lipid droplets to replication compartments enabling the transfer of fatty acids
Introduction
Enteroviruses are common human pathogens linked to diverse medical complications, including diabetes, asthma, hepatitis, myocarditis, poliomyelitis and meningitis. Despite their small genome and limited proteome, they are adept at modulating the host cellular machinery to achieve rapid replication. While vaccines are available for a single type of enterovirus, poliovirus, the vast majority of enteroviral infections have no prophylactic or therapeutic treatments available. Since all enteroviruses share common mechanisms of replication, identification of host pathways essential for enterovirus infection could provide targets for pan-enteroviral treatments.
A critical step in the life cycle of enteroviruses is the replication of their positive-sense single-stranded RNA genome. Genome replication occurs on special host-derived membrane compartments, called replication compartments (RCs), which form only in infected cells. Within hours of infection, numerous vesicles accumulate in the cytoplasm of host cells (Dales et al., 1965). Viral proteins, viral RNA and host factors are recruited to these vesicles to participate in the synthesis of the viral genome (Richards and Ehrenfeld, 1990).
Given that RCs are a universal feature of all enteroviral infections, blocking their formation may serve as a general anti-enteroviral therapeutic strategy. However, the mechanisms underlying the formation of RCs and their lipid sources are poorly understood. A number of observations suggest that the biogenesis of enterovirus RCs is a complex process that involves multiple membrane trafficking and lipid metabolism pathways. Previous studies suggest that enteroviruses hijack transport intermediates of the secretory pathway and modulate their lipid and protein composition to create the RCs (Hsu et al., 2010). The RCs are enriched in cholesterol provided by the endoplasmic reticulum (ER) and clathrin-mediated endocytosis (Ilnytska et al., 2013; Strating et al., 2015). In addition, enterovirus infection increases import of fatty acids from the extracellular media for the synthesis of phospholipids for the RCs (Nchoutmboube et al., 2013).
To understand the biogenesis of RCs in the context of infection we focused on three enteroviruses that infect the gastrointestinal tract: poliovirus (PV), an important enterovirus model and the causing agent of poliomyelitis, coxsackievirus B3, which causes myocarditis and diabetes, and enterovirus 71, which causes severe neurological diseases.
Our findings uncover a key function of the host organelle lipid droplet (LD) in the formation of the RCs and enteroviral replication. LDs are important hubs of lipid metabolism in eukaryotic cells. They store lipids, which are used for energy production, membrane biogenesis and signaling purposes, depending on the cells’ needs (Walther and Farese, 2012; Zechner et al., 2012). Despite their key role in lipid metabolism, possible involvement of LDs in the replication of enteroviruses had not been defined.
In this study, we show that LDs are an important source of lipids for enterovirus RCs. We discover that three enteroviral proteins are targeted to LDs and we provide evidence that one of these proteins, 2C, is involved in the formation of membrane contact sites that recruit LDs to the RCs. These virus-generated contact sites enable channeling of essential fatty acids from LDs to the growing RCs. We further show that viral proteins physically interact with the host lipolysis machinery whose function is essential to mobilize fatty acids from LDs for phospholipid synthesis for the RCs. As a result, LDs serve as lipid distribution centers that redirect fatty acid flux for RC formation. Importantly, blocking the formation of membrane contact sites between LDs and RCs or inhibition of lipolysis disrupts the biogenesis of RCs and blocks replication of several enteroviruses. Thus, our findings uncover a potential pan-enteroviral therapeutic strategy that relies on blocking the lipolysis pathway. In summary, our results reveal an important principle of spatial and functional remodeling of host cellular architecture by viral proteins and illuminate the mechanisms by which enteroviruses manipulate host cell lipid metabolism to allow viral replication.
Results
Remodeling of the LD distribution and morphology during PV replication
To examine a possible role of LDs in the life cycle of PV, the distribution and morphology of LDs in PV-infected HeLa cells were followed by time-course immunofluorescence (IF) analysis. In this analysis, LDs were labeled with the dye Bodipy493/503, which stains the core of LDs, and with antibodies against the TIP47 protein, which is localized to the surface of LDs. We found that in mock-infected cells, LDs were distributed throughout the cell (Fig. 1A). In contrast, at 6 hours post-infection (hpi), LDs were incorporated into the network of viral RCs and concentrated at the juxtanuclear area. Concurrent with this translocation, the number of LDs and the area occupied by LDs decreased by 40% and 30%, respectively (Fig. 1B). In addition, the intensity of TIP47 staining on the surface of LDs decreased by 37%. LD number and TIP47 intensity decreased further at 8hpi, the peak time of virus particle formation. TIP47 protein levels remained constant during the infection (Fig. S1A), suggesting that displacement of TIP47 from the surface of LDs led to the decrease in its intensity on LDs. Because TIP47 restricts access of lipases to the LD core, removal of TIP47 from the LD surface may increase the accessibility of lipids stored within LDs during PV infection.
Figure 1.
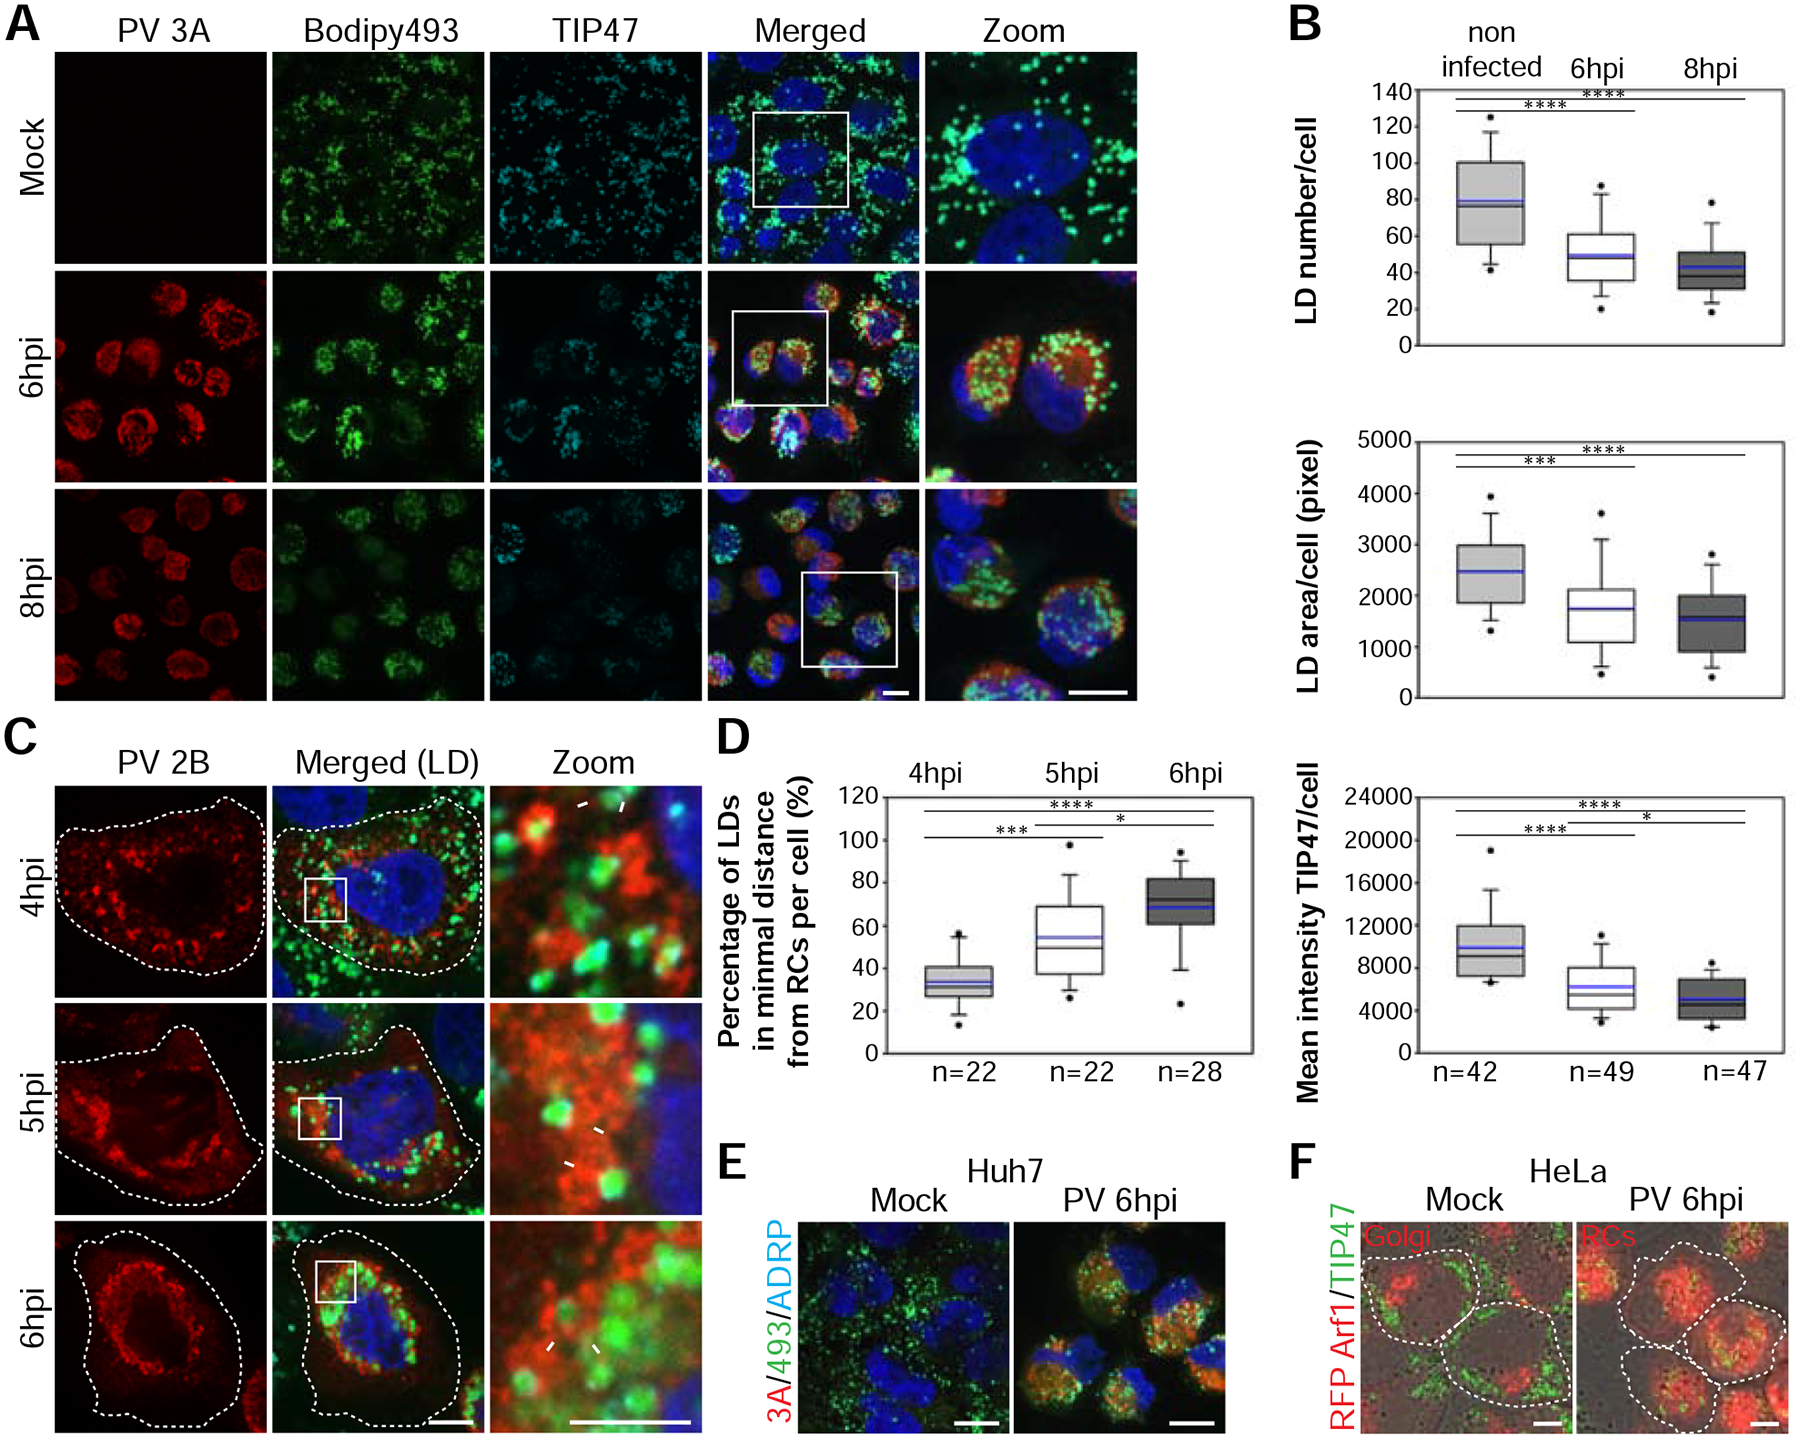
PV infection remodels the distribution and morphology of LDs. See also Figure S1 and Movie S1. (A,B) Decrease in the number and area of LDs and the intensity of TIP47 on the surface of LDs during PV infection. (A) IF analysis of mock and PV-infected HeLa cells at 6 and 8hpi. PV RCs were labeled with anti-3A antibodies (red) and LDs co-labeled with anti-TIP47 antibodies (cyan) and Bodipy493/503 (green). Maximum intensity projections are shown. Scale bars 10 μm. (B) Quantification of (A). Shown are box plots with horizontal lines indicating median (black) and mean (blue) values for mock, 6hpi and 8hpi (n=42, 49 and 47 cells, respectively). Outliers outside 5th and 95th percentile are represented by dots. (C) Close apposition between the RCs and LDs during the biogenesis of RCs. PV-infected HeLa cells were fixed at the indicated times. RCs were labeled with anti-2B antibodies (red). Arrows mark close apposition between RCs and LDs. Hatched lines mark cell outline. Scale bar 10 μm, zoom 5 μm. (D) Quantification of the proximity between LDs and RCs in 3D reconstructions of confocal stacks. The percentage of LDs in minimal distance from the RCs (less than 1 pixel = 154nm) per cell increases during infection (n=22, 22 and 28 cells at 4, 5 and 6hpi, respectively). (E,F) PV infection induces the intercalation of LDs into the network of RCs. (E) IF analysis of mock or PV-infected Huh7 cells at 6hpi. RCs were labeled with anti-3A antibodies (red) and LDs were co-labeled with anti-ADRP antibodies (cyan) and Bodipy493/503 (green). Scale bars 10 μm. (F) IF analysis of mock and PV-infected HeLa cells stably expressing RFP-Arf1 at 6hpi. LDs were labeled with anti-TIP47 antibodies (green). In mock-infected cells RFP-Arf1 is localized to the Golgi, whereas in PV-infected cells RFP-Arf1 is recruited to PV RCs. Hatched lines mark cell outline. Scale bar 10μm. (B,D) *p<0.05, ***p<0.001, ****p<0.0001 (Mann-Whitney test).
We then examined the spatial relationships between LDs and RCs at earlier times post infection (Fig. 1C). Our IF analysis showed that at 4hpi, the earliest time point at which RCs are visible, some of the LDs were in close apposition to the RCs (arrows, zoom panel). At 5hpi, more LDs were seen in close proximity to the RCs. Finally, at 6hpi the vast majority of LDs were intercalated in the network of RCs. To quantify the proximity between LDs and RCs during infection, we measured the percentage of LDs that were at a minimal distance from the RCs (less than 1 pixel which equals 154nm) in 3D reconstructions of confocal stacks. We found that the percentage of LDs closely apposed to the RCs increased from 33% at 4hpi to 54% at 5hpi and 68% at 6hpi, suggesting that LDs are recruited to close proximity to the RCs as infection progresses (Fig. 1D). Consistent with these changes in LD distribution, at 6hpi the mean distance between LDs and the nucleus decreased by 65% (Fig. S1B). Similar changes in LD distribution were observed in PV-infected Huh7 cells (Fig. 1E) indicating that this viral effect is not limited to a specific cell type.
To further illustrate the translocation of LDs during PV infection we followed LDs and the host protein ARF1 which was previously shown to be recruited to the viral RCs during infection (Belov et al., 2007) by IF analysis (Fig. 1F and Movie S1). In mock-infected cells, RFP-Arf1 was localized to the Golgi and LDs were in the cell periphery with limited interface between the two compartments. However, at 6hpi RFP-Arf1 was recruited to PV RCs, which surrounded LDs in the juxtanuclear region. We conclude that PV infection induced the recruitment of LDs to close apposition with the RCs. This recruitment was specific since during infection most of the mitochondria remained in the cell periphery and were not intercalated into the network of RCs (Fig. S1C).
PV infection induces the formation of membrane contacts between LDs and RCs
To examine the spatial relationships between LDs and RCs at higher resolution we used transmission electron microscopy analysis. In mock-infected HeLa cells, LDs were adjacent to ER tubules and mitochondria (Fig. 2A and 2B). This localization was consistent with previous studies showing that LDs form in the ER, and that fatty acids are delivered from LDs to the mitochondria for ATP production. However, the membrane architecture of PV-infected cells at 6hpi was strikingly different from that of mock cells, with numerous vesicles, known as RCs, occupying the cytoplasm (Fig. 2C, 2D and S2A). In line with previous studies, these PV-induced vesicles were heterogeneous in their morphology: electron-lucent vesicles (black arrowheads) and vesicles with electron-dense core (cyan arrowheads). Consistent with our IF analysis, we detected multiple regions of close apposition between LDs and RCs (Fig. 2E–2G and S2B). In TEM thin sections of randomly chosen cells, 62% of the LDs were within a distance of 30nm from at least one RC (n=189 LDs in 14 cells) (Table S1). Among these LDs, 59% were within a distance of 30nm from more than one RC (Fig. S2D) and in average 10% of the LD perimeter was engaged in close membrane contacts with the RCs (Fig. S2E). These properties are consistent with the characteristics of membrane contact sites, which are defined as regions in which the membranes of two organelles are within a distance of 30nm, and serve to facilitate transfer of signals and molecules between organelles (Prinz, 2014). The close apposition between LDs and RCs suggested that during PV infection membrane contact sites formed between LDs and the RCs.
Figure 2.
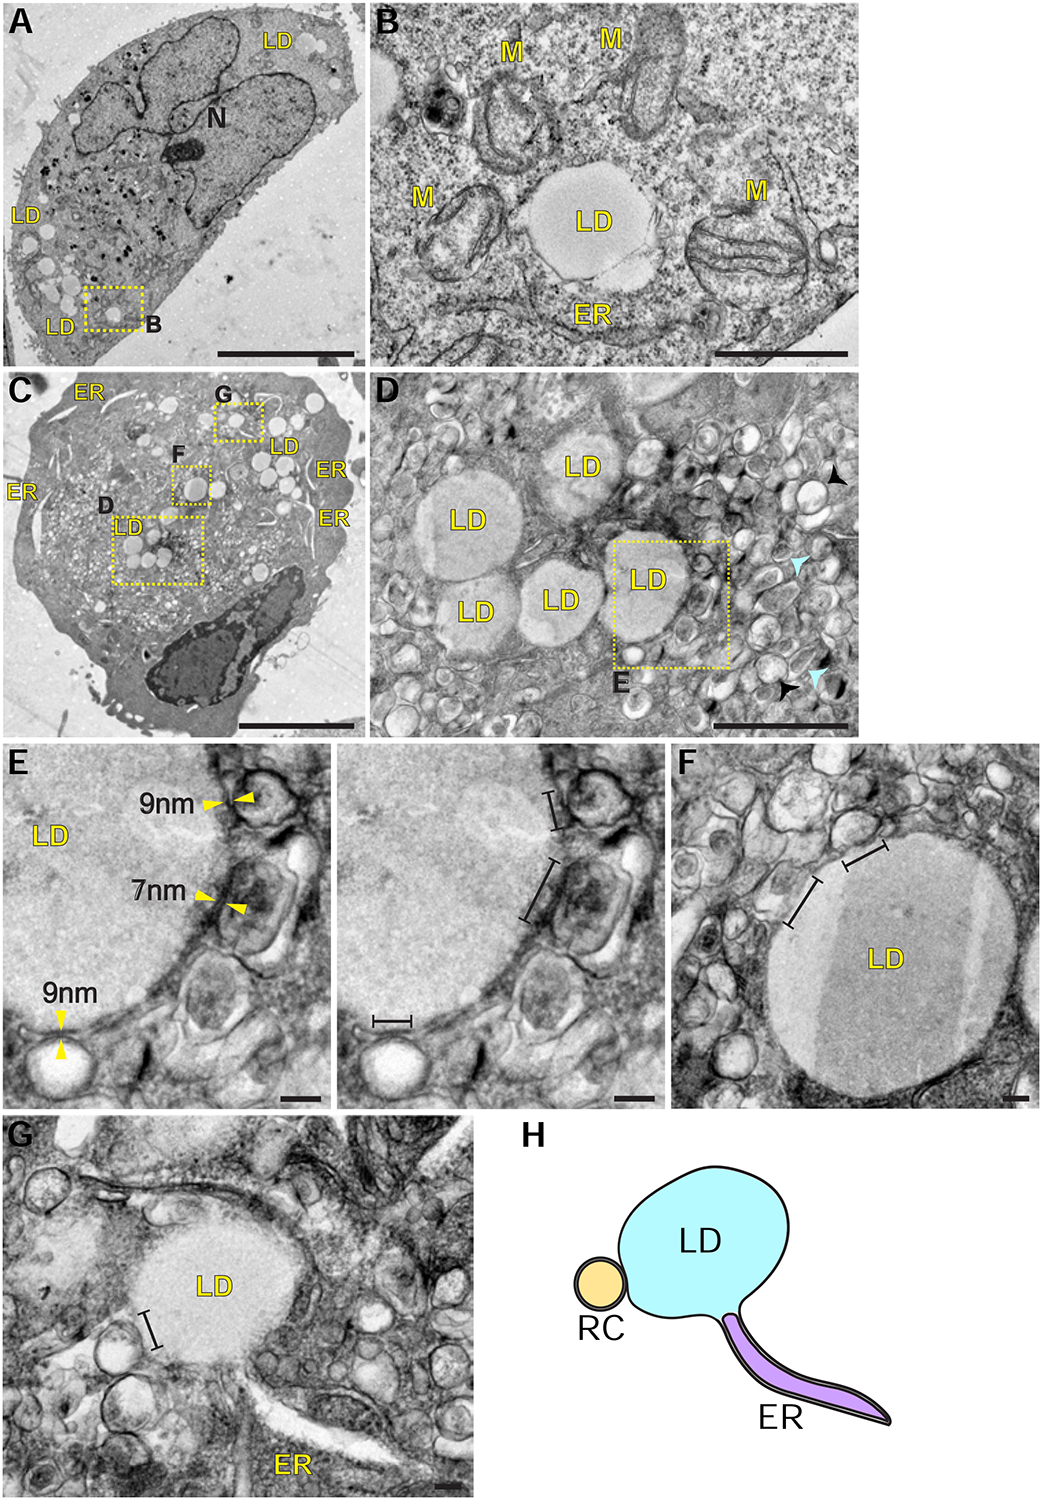
PV infection induces the formation of membrane contacts between LDs and RCs. See also Figure S2 and Table S1. (A) Low magnification transmission electron micrograph of mock-infected HeLa cell. LDs are in the cell periphery. Scale bar 10μm. (B) Higher magnification of (A) shows a LD adjacent to an ER tubule and several mitochondria (M). Scale bar 1 μm. (C) Low magnification micrograph of PV-infected HeLa cell at 6hpi. The cell is filled with hundreds of PV-induced vesicles collectively termed RCs. LDs are incorporated between the vesicles. The ER appears as dilated tubules. Scale bar 5μm. (D) Higher magnification of (C) shows heterogeneous morphology of the RCs: electron-lucent vesicles (black arrowheads) and vesicles with electron-dense core (cyan arrowheads). Scale bar 1μm. (E,F) Viral-induced vesicles (the RCs) form close membrane contacts with the LDs. Yellow arrowheads mark LD-RC contacts within a distance of 10nm. Line segments mark LD surface that is within a distance of 30nm from the RCs. Scale bars 100nm. (G,H) A LD is connected to an ER tubule and is simultaneously in close membrane contact with the RC. Scale bar 100nm. (H) Schematic of the physical contacts between ER, LDs and RCs. The LD membrane is a monolayer whereas the ER and the RC membranes are bilayers. ER, endoplasmic reticulum, LD, lipid droplet, M, mitochondria, N, nucleus.
The ER morphology in PV-infected cells was also substantially changed. ER tubules were dilated (Fig. 2C) and some of them were connected to LDs that were simultaneously within a distance of 30nm from RCs (Fig. 2G, 2H and S2C), suggesting that the three organelles are interconnected during PV infection.
Ectopically expressed enteroviral 2BC, 2B and 2C proteins are targeted to LDs
To gain insights into the mechanisms that underlie the changes in LD morphology and distribution during PV infection, we examined the possibility that viral proteins (Fig. 3A) orchestrate these changes. For this purpose, single Strep-tagged PV proteins were ectopically expressed in HeLa cells and their localization to LDs was examined by IF analysis. This analysis showed that the intermediate protein 2BC is targeted to LDs (Fig. 3B). Furthermore, overexpression of 2BC caused clustering of LDs and displacement of TIP47 from the surface of LD clusters (Fig. 3C and 3D). To confirm that the localization of 2BC to LDs was not caused by the Strep-tag or limited to specific cell type, we also expressed non-tagged 2BC in HeLa cells (Fig. S3A), and 2BC-Strep in Huh7 hepatoma cell-line (Fig. S3B). In both cases, 2BC was targeted to LDs. In contrast, other PV proteins including the intermediate protein 3CD, 3C protease and 3D RNA polymerase did not localize to LDs (Fig. S3C), nor did PV capsid proteins (Fig. S3D).
Figure 3.
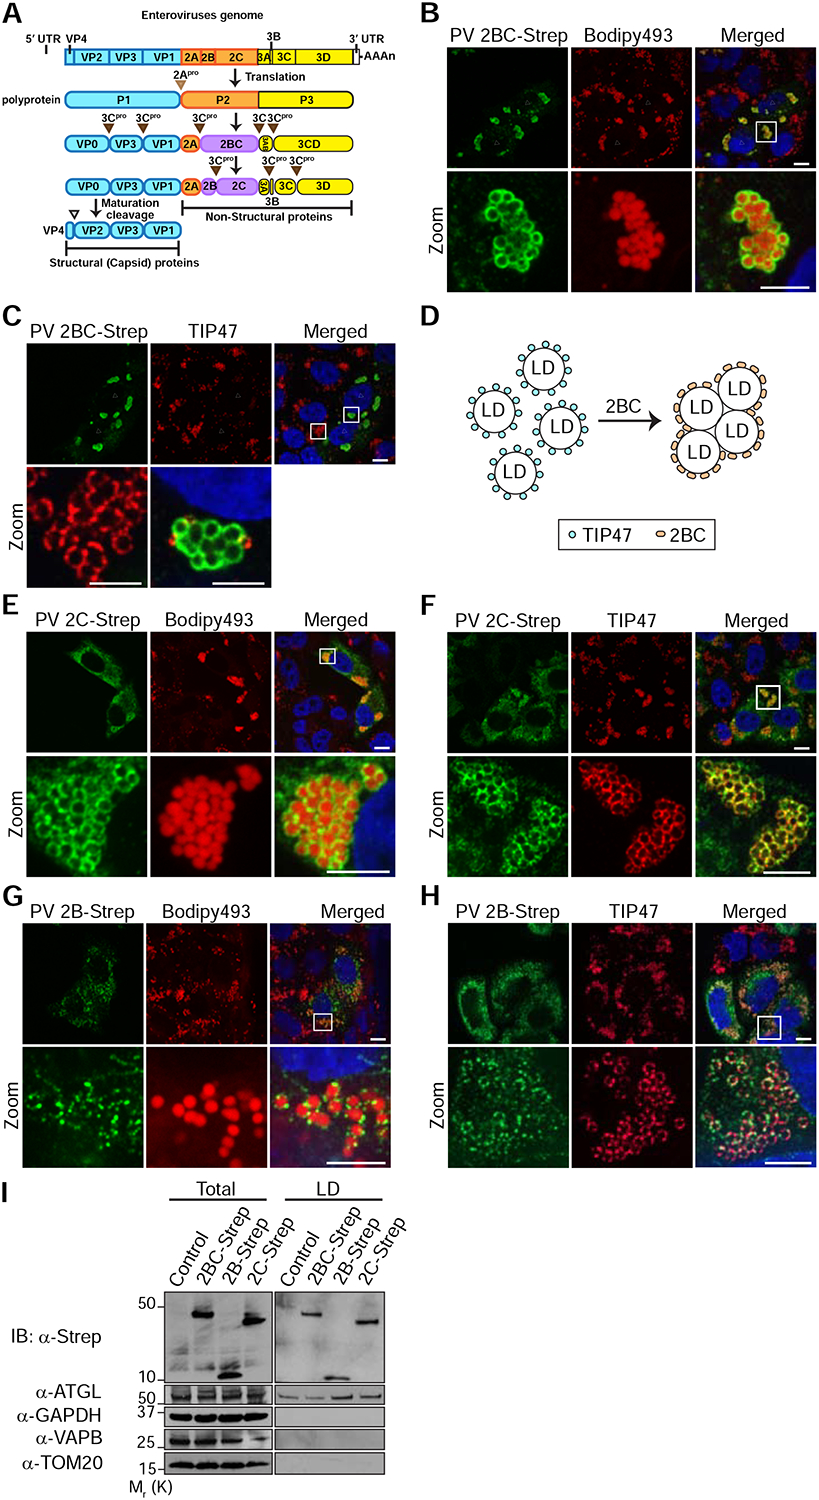
Ectopically expressed PV 2BC, 2B and 2C proteins are targeted to LDs. See also Figure S3. (A) Schematic of enterovirus genome and proteome. The enterovirus genome is translated into a single polyprotein which is processed to intermediate and mature proteins by the viral proteases 2A and 3C. Cleavage sites are indicated by triangles. Cleavage of P1 precursor (cyan) yields 4 capsid proteins (structural proteins). Cleavage of P2 and P3 precursors yields 7 mature proteins and 3 intermediate proteins (2BC, 3AB, 3CD). All non-structural proteins are recruited to the RCs and are involved in the replication of the viral genome. LD-targeting proteins identified in this study are colored in magenta. (B) Ectopically expressed PV intermediate protein 2BC is targeted to LDs and causes their clustering. PV 2BC-Strep was labeled with anti-Strep antibodies (green). LDs were labeled with Bodipy493/503 (red). Triangles mark cells that express 2BC and asterisks mark non-expressing cells. (C) Ectopically expressed PV 2BC displaces TIP47 from the surface of LDs. Cells were co-immunostained with anti-Strep (green) and anti-TIP47 (red) antibodies. (D) Schematic of the effects of 2BC on LDs. Targeting of 2BC to LDs causes the displacement of TIP47 from the surface of LDs and LD clustering. (E, F) Ectopically expressed PV 2C co-localizes with TIP47 on LDs and causes their clustering. (G, H) Ectopically expressed PV 2B is targeted to LDs. (I) Purification of LDs from cells that ectopically express Strep-tagged 2B, 2C or 2BC. LD-enriched fractions were isolated from post-nuclear supernatants (Total) as described in STAR methods. Immunoblotting analysis was performed with the indicated antibodies. ATGL, GAPDH, VAPB and TOM20 served as LD, cytosolic, ER and mitochondrial markers, respectively. Scale bars for (B, C, E, F, G, H) 10 μm, zoom 5 μm.
During PV infection, 2BC is cleaved by the viral protease 3C to yield the mature proteins 2B and 2C (Fig. 3A). We found that both mature proteins were also localized to LDs. 2C-Strep appeared as rings on the surface of LDs, where it co-localized with TIP47 and caused clustering of LDs (Fig. 3E and 3F). 2B, which was previously shown to localize to the Golgi (de Jong et al., 2003), was dually targeted to both the Golgi and the LDs (Fig. 3G, 3H and S3E) without causing clustering of LDs.
To further confirm the targeting of 2BC, 2B and 2C to LDs, we purified LDs from cells that ectopically express these viral proteins and examined the LD-associated proteins by immunoblotting (Fig. 3I). The purified LD fractions contained the LD-associated adipose triglyceride lipase (ATGL) and were depleted for ER, mitochondria and cytosol markers (VAPB, TOM20 and GAPDH proteins, respectively) confirming the purity of these fractions. Consistent with our IF results, all three viral proteins were detected in the purified LD fractions.
We further showed that Strep-tagged 2BC, 2B and 2C proteins of coxsackievirus B3 were also localized to LDs (Fig. S3F–S3H). This conserved targeting, together with the fact that 3 out of 10 non-structural viral proteins were targeted to LDs, suggested that LDs play a key role in the life cycle of enteroviruses.
Amphipathic helices mediate the targeting of PV 2BC, 2B and 2C to LDs
To better understand the mechanism which is responsible for the LD-targeting of 2B and 2C, we next identified the LD-targeting determinants of both proteins. PV 2B contains two highly conserved membrane binding regions: N-terminal amphipathic helix (aa 35–52) and C-terminal hydrophobic domain (aa 61–80) (Fig. 4A) (de Jong et al., 2003). We found that 2B truncation mutant containing aa 1–57 retained LD-targeting (Fig. 4B). In contrast, a mutant containing aa 56–97 was distributed in the cytosol. These results indicated that the N-terminal region of 2B containing the amphipathic helix mediated its LD-targeting.
Figure 4.
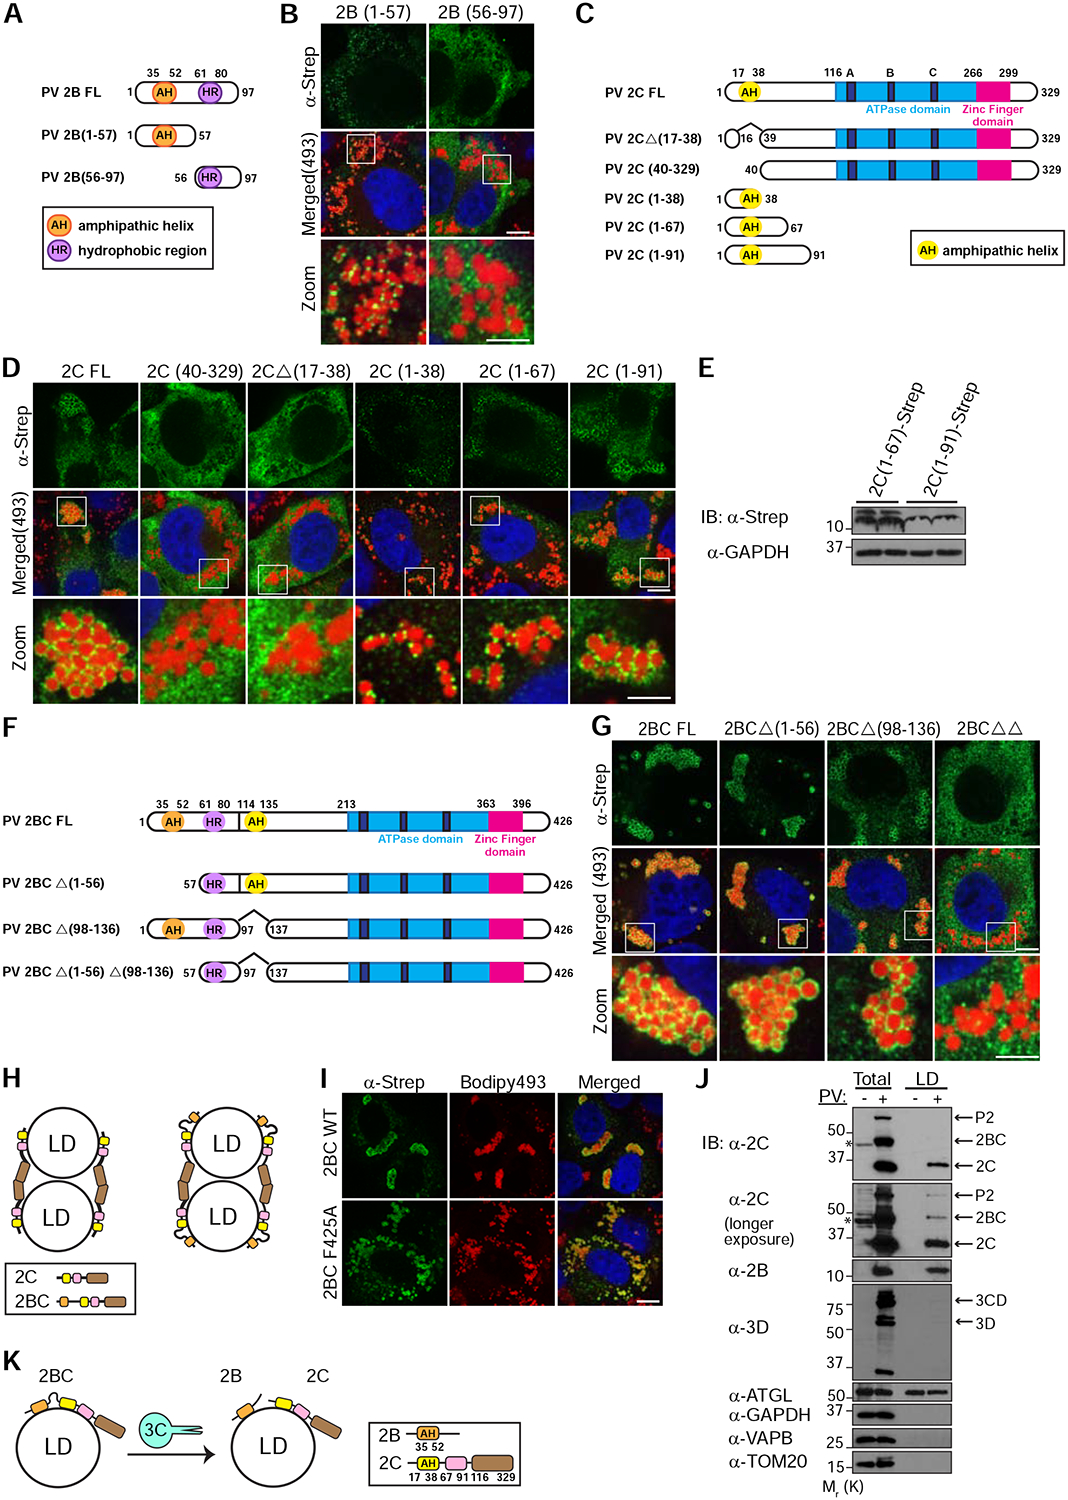
Amphipathic helices mediate the targeting of PV proteins to LDs. (A) Schematic of the domain structure of PV 2B and truncation mutants used in this study. The N-terminal amphipathic helix (AH) and the C-terminal hydrophobic region (HR) are indicated. (B) The N-terminal region of PV 2B containing an amphipathic helix mediates LD-targeting. HeLa cells expressing the indicated Strep-tagged 2B mutants were fixed and immunostained with anti-Strep antibodies (green). LDs were labeled with Bodipy493/503 (red). (C) Schematic of the domain structure of PV 2C and truncation mutants used in this study. The N-terminal amphipathic helix (AH), the ATPase domain (containing walker motifs A, B and C) and the Zinc finger domain are indicated. (D) The N-terminal amphipathic helix of PV 2C is essential for LD-targeting. (E) Immunoblotting analysis of the expression levels of 2C(1–67) and 2C(1–91) fragments. (F) Schematic of the domain structure of PV 2BC and truncation mutants used in this study. (G) PV 2BC contains two LD-targeting determinants and each one of them is sufficient for its localization to LDs. 2BCΔΔ is a double truncation mutant deficient for both LD-targeting determinants. (H) Schematic of the mechanism underlying the clustering of LDs in cells that overexpress 2C or 2BC. Interactions of the C-terminal regions of 2C are suggested to mediate LD clustering. (I) Overexpression of 2BC containing the mutation F425A, which abolishes the interactions between the C-terminal regions of 2C, does not cause clustering of LDs. (J) 2B and 2C proteins are localized to LDs during PV infection. LD-enriched fractions were isolated from post-nuclear supernatants (Total) of mock or PV-infected cells at 6hpi. Two different exposures of the blot with anti-PV 2C antibodies are shown. Asterisks indicate non-specific reaction of anti-2C antibodies. (K) Schematic of the possible recruitment mechanism of enteroviral proteins to LDs. Mature 2B and 2C may target LDs independently of 2BC. Alternatively, 2BC is recruited to LDs and following cleavage by the 3C protease, mature 2B and 2C remain targeted to LDs.
Scale bars for (B, D, G and I) 10 μm, zoom 5 μm.
PV 2C also contains a highly conserved N-terminal amphipathic helix (aa 17–38) which mediates its association with cellular membranes (Fig. 4C) (Teterina et al., 1997). We found that truncation mutants deleted for this helix (2CΔ(17–38)) or the first 39 aa (2C(40–329)) lose their LD localization (Fig. 4D) suggesting that the N-terminal helix is essential for the LD-targeting of 2C. In addition, small fragments containing the first 38 or 67 aa of 2C were targeted to LDs, appearing as puncta on the surface of LDs. Further extension of the N-terminal fragment of 2C to the first 91 aa, restored the ring shape pattern surrounding LDs observed for full-length 2C. This effect was not caused by a higher expression level of the fragment containing aa 1–91 as compared to a fragment containing aa 1–67 (Fig. 4E). Altogether, these results suggested that the N-terminal amphipathic helix of 2C provided core binding to LD surface which was further enhanced by residues contained within aa 67–91.
We then examined the role of 2B and 2C amphipathic helices in the LD-targeting of 2BC (Fig. 4F). We found that 2BC mutants deleted for either helix (2BCΔ(1–56) and 2BCΔ(98–136)) retained their LD localization (Fig. 4G). However, truncation mutant deficient for both helices lost its LD association.
The existence of two independent LD-targeting determinants, one in 2B and the other in 2C, could be a mechanism to ensure that both mature proteins target the surface of LDs after the proteolytic processing of 2BC. Consistent with this possibility, mutations in the amphipathic helices of 2B and 2C were previously shown to be deleterious for enterovirus growth (Teterina et al., 2006; van Kuppeveld et al., 1996).
2C-2C interactions mediate LD clustering
We noticed that ectopic expression of 2C and 2BC, but not 2B, caused LD clustering. Because the N-terminal regions of 2C and 2BC are bound to LDs, we hypothesized that interactions between their C-terminal regions could mediate LD clustering (Fig. 4H). Consistent with this hypothesis, previous structural analysis of enterovirus 71 2C protein revealed interaction between the C-terminal helix of one 2C molecule and a hydrophobic pocket located between the ATPase domain and the zinc finger of another 2C molecule. In addition, mutation F328A in the C-terminal helix was shown to disrupt this interaction (Guan et al., 2017). We therefore introduced the equivalent mutation F425A into 2BC. We found that 2BC F425A was unable to induce clustering of LDs, confirming that interactions mediated by 2C C-terminal helix enable LD clustering (Fig. 4I).
2B and 2C are localized to LDs during PV infection
We next examined whether 2BC, 2B and 2C were also targeted to LDs during PV infection. For this purpose, LDs were purified from mock and PV-infected cells at 6hpi and their associated proteins were detected by immunoblotting (Fig. 4J). Consistent with our IF results, both 2B and 2C were detected in the LD fraction of PV-infected cells, whereas 3D polymerase was not detected in this fraction. Surprisingly however, only a small amount of 2BC protein was found in the LD fraction of PV-infected cells. It is possible that during PV infection, 2BC is recruited to LDs, but then processed by 3C protease to yield the mature 2B and 2C, and therefore the levels of 2BC in the LD fraction were low (Fig. 4K). An alternative possibility is that mature 2B and 2C are targeted to LDs independently of 2BC.
Inhibition of lipolysis disrupts the biogenesis of PV RCs
The targeting of viral proteins to LDs suggested that LDs are involved in the life-cycle of enteroviruses but the role of LDs during infection was unknown. Since LDs are lipid storage organelles, we hypothesized that they may provide lipids necessary for the biogenesis of the RCs.
Two cellular pathways mediate mobilization of lipids from LDs; lipophagy, delivery of LDs to lysosomes by autophagy, and lipolysis, the sequential cleavage of triglycerides (TGs) stored within the LD core by lipases recruited to the surface of LDs (Fig. 5A) (Singh et al., 2009; Zechner et al., 2017). To test the hypothesis that LDs provide building blocks for the RCs, we first explored possible involvement of lipophagy in the biogenesis of RCs. For this purpose, PV-infected cells were treated with Bafilomycin A1 which blocks autophagosome-lysosome fusion. As expected, this treatment induced accumulation of autophagosomes (Fig. S4A). However, it had no effect on the dynamics and morphology of LDs and RCs during PV infection (Fig. 5B).
Figure 5.
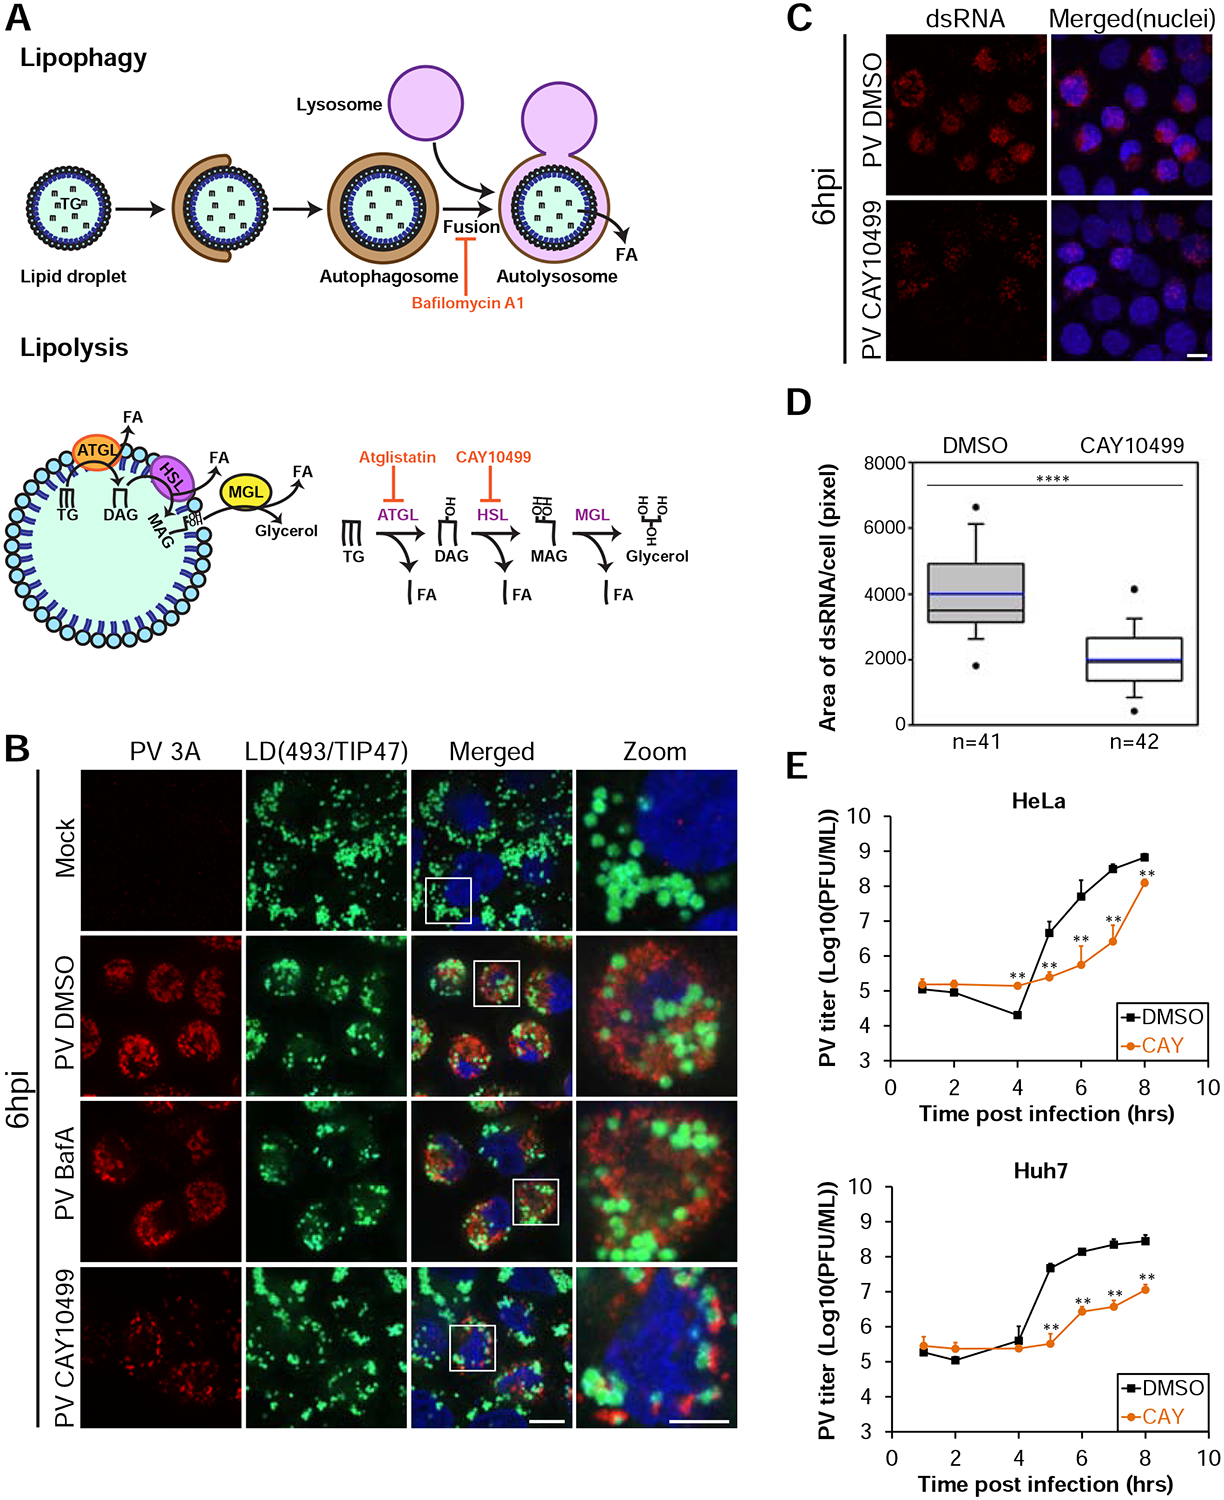
Lipolysis is essential for the biogenesis of the RCs and PV replication. See also Figure S4. (A) Schematic of lipophagy and lipolysis, the two pathways involved in the mobilization of lipids from LDs. Inhibitors of the pathways are shown in red. ATGL, adipose triglyceride lipase, HSL, hormone sensitive lipase, MGL, monoglyceride lipase, TG, triglyceride, DAG, diacylglycerol, MAG, monoacylglycerol, FA, fatty acid. (B) Inhibition of lipolysis, but not lipophagy, disrupts the formation of PV RCs. Mock or PV-infected HeLa cells were incubated at 1hpi with DMSO or 0.2 μM Bafilomycin A1 or 100 μM CAY10499 to block lipophagy or lipolysis, respectively. At 6hpi cells were fixed and labeled for RCs (anti-3A antibodies, red) and LDs (anti-TIP47 antibodies (cyan) and Bodipy493/503 (green)). Scale bar 10 μm, zoom 5 μm. (C,D) Inhibition of HSL impairs the replication of the PV genome. (C) IF analysis of dsRNA structures in PV-infected cells treated with DMSO or CAY10499 at 1hpi and fixed at 6hpi. Maximum intensity projections are shown. Scale bar 10μm. (D) Quantification of (C). Horizontal lines indicate median (black) and mean (blue) values for DMSO and CAY10499 treatments (n=41 and 42 cells, respectively). Outliers outside the 5th and 95th percentiles are represented by dots. (E) Inhibition of HSL disrupts PV replication. PV-infected HeLa and Huh7 cells were incubated with DMSO or 100 μM CAY10499 at 1hpi. Cells and supernatants were collected at the indicated times and the total number of infectious particles was determined by plaque assays. Virus titer values represent mean ± standard deviation for 2 independent experiments with 3 biological replicates each. (D,E) **p<0.005, ****p<0.0001 (Mann-Whitney test).
We then examined whether the lipolysis pathway is involved in the formation of PV RCs. For this purpose, we pharmacologically inhibited ATGL, the first acting enzyme in the lipolysis pathway, which cleaves TGs (Fig. 5A). We found that between 4–6hpi the biogenesis of RCs was substantially delayed in PV-infected HeLa cells treated with the specific ATGL inhibitor atglistatin (Fig. S4B and S4C) without substantially affecting cell viability (Table S2). However, at 8hpi the morphology of RCs was similar to that of control cells. This transient inhibitory effect could possibly result from the activity of additional TG lipase/s that function redundantly to ATGL and compensate for its inhibition over time. Indeed, the lipolysis pathway was best characterized in adipose tissue where ATGL is responsible for TG cleavage. However, other tissues were previously shown to express much lower levels of ATGL (Zechner et al., 2012), raising the possibility that other TG lipases play important roles in lipolysis in non-adipocyte cell-lines, including HeLa cells.
Therefore, to further confirm the involvement of lipolysis in the biogenesis of PV RCs, we pharmacologically inhibited the second acting enzyme in the lipolysis pathway, hormone sensitive lipase (HSL), which cleaves diacylglycerol to monoacylglycerol and free fatty acid (FA) (Fig. 5A). HSL is the only diacylglycerol lipase associated with the lipolysis pathway thus far. We found that CAY10499, a specific inhibitor of HSL, had a dramatic effect on the morphology of PV RCs at 6hpi (Fig. 5B) without substantially affecting cell viability (Table S2). Cells treated with CAY10499 contained considerably fewer RCs as compared to DMSO-treated cells. In addition, LDs were not incorporated into a typical juxtanuclear network of RCs. Instead, they appeared scattered in the cell with small pieces of RCs attached to them. The abnormal morphology of RCs under HSL inhibition persisted through 8hpi indicating a block rather than a kinetic delay in RC biogenesis (Fig. S4D). These observations suggested that release of FAs from LDs by the lipolysis pathway is essential for the biogenesis of the RCs.
Inhibition of lipolysis disrupts enterovirus replication
RCs are critical sites for the replication of the enteroviral genome and thereby also for the formation of new virus particles. We therefore examined whether the abnormal morphology of PV RCs under inhibition of lipolysis affects the production of infectious virus particles. Consistent with our IF analysis, ATGL inhibition caused a kinetic delay in the production of PV infectious particles in HeLa cells (Fig. S4E). In addition, atglistatin treatment in the hepatoma cell-line Huh7 and the intestinal-like cell-line Caco2, two widely accepted models for studies of cellular lipid metabolism, caused a decrease in PV titer that persisted through 8hpi.
HSL inhibition had even stronger effect on PV replication. At 6hpi, accumulation of viral dsRNA structures decreased by 50% in cells treated with CAY10499 as compared to control cells, indicating a decrease in the replication of PV genome (Fig. 5C and 5D). Consistent with these results, PV titer considerably decreased in both HeLa and Huh7 cells treated with CAY10499 (Fig. 5E). Of note, inhibition of HSL also decreased the replication of two additional enteroviruses, coxsackievirus B3 and enterovirus 71 suggesting that the lipolysis pathway is required for the replication of several enteroviruses (Fig. S4F and S4G).
Inhibition of HSL abrogates conversion of imported FAs into phosphatidylcholine required for RC biogenesis
Our results indicated that release of FAs from LDs by the lipolysis pathway is essential for the biogenesis of the RCs. To directly demonstrate a flux of FAs from LDs to the RCs, we used a pulse-labeling experiment with the green-fluorescent fatty acid analog Bodipy500/510 C4, C9 (Green FA) (Fig. 6A). HeLa cells were mock or PV-infected and at 1hpi treated with DMSO or CAY10499 to block lipolysis. At 5½ hpi Green FA was added to the medium and incubated with the cells for 30min. At 6hpi cells were extensively washed to get rid of extracellular Green FA, and processed for lipid and IF analyses (Fig. 6B and 6C). Lipids were extracted from the cells and resolved by thin layer chromatography (TLC). TLC analysis was performed on two separate plates; one plate was resolved under conditions optimal for the detection of neutral lipids (e.g. TGs), and a second plate under conditions optimal for the detection of polar lipids (e.g. phospholipids).
Figure 6.
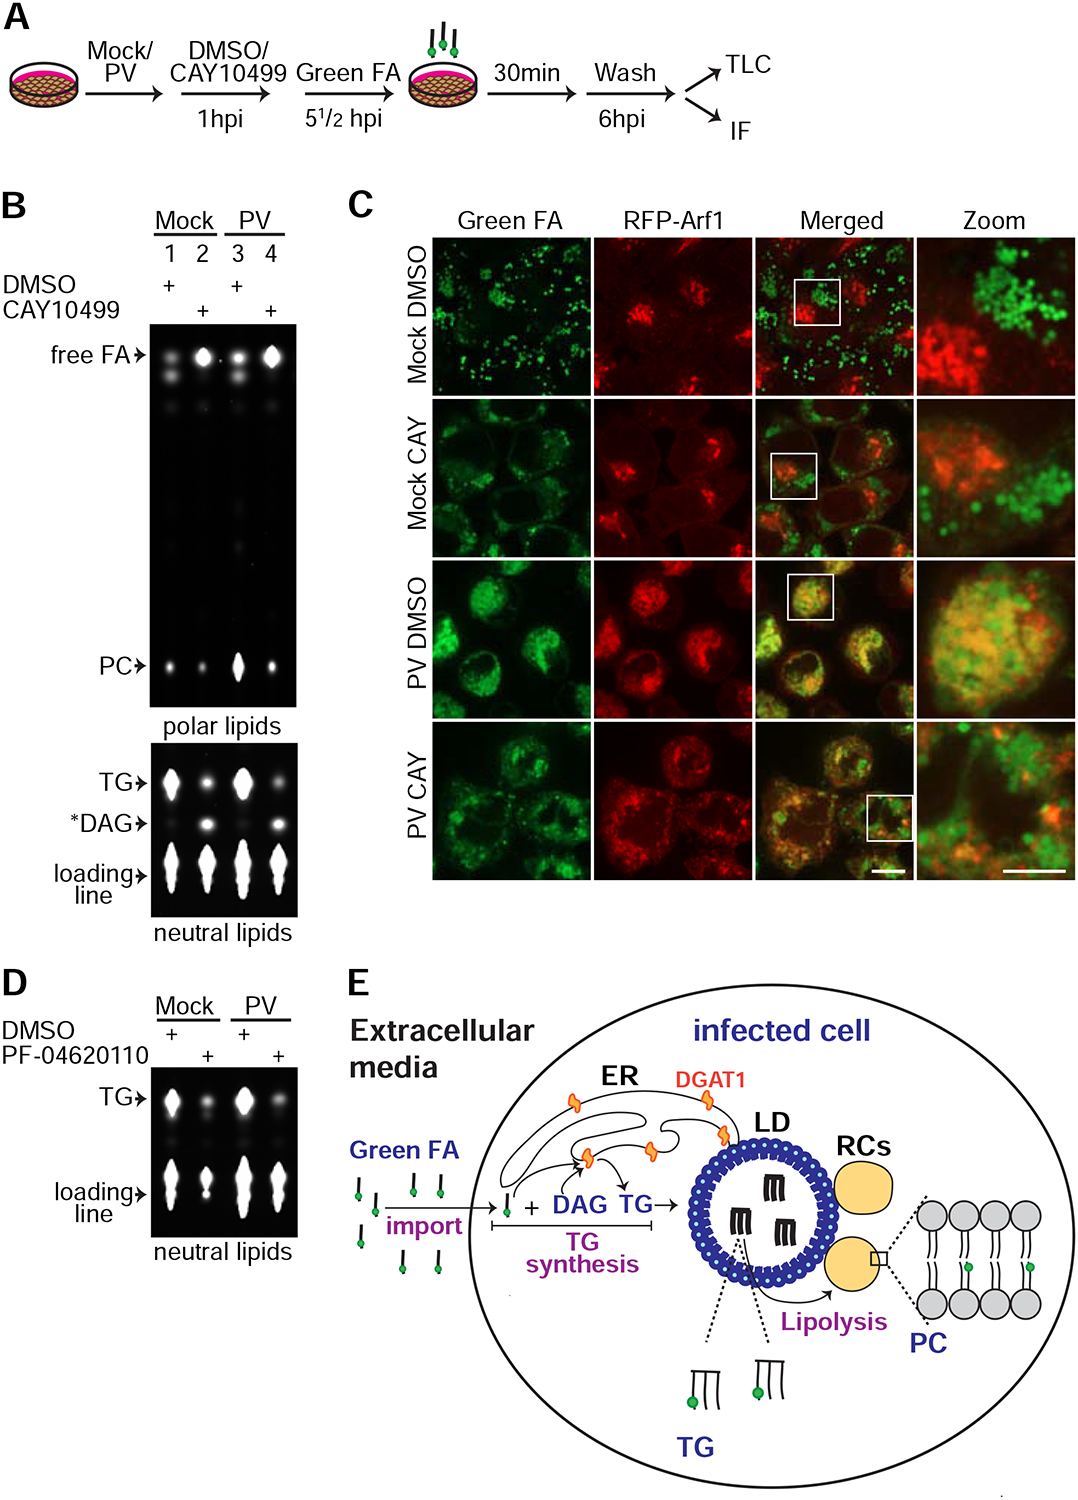
Inhibition of HSL abolishes synthesis of phosphatidylcholine (PC) from imported fatty acids (FAs) during PV infection. See also Figure S5. (A) Schematic of the fluorescent FA pulse assay. Mock or PV-infected HeLa cells stably expressing RFP-Arf1 were incubated with DMSO or 100 μM CAY10499 at 1hpi. At 5½hpi cells were pulse labeled with 1 μM Green FA for 30min. At 6hpi, cells were extensively washed and either processed for total lipid extraction and thin layer chromatography (TLC) (B) or fixed and imaged (C). (B) Lipids extracts were resolved on two separate TLC plates under optimal conditions for polar lipids (upper panel) or neutral lipids (lower panel) as described in STAR Methods. Shown are fluorescent lipids containing Green FA. (C) IF analysis of the experiment described in (A). Scale bar 10 μm, zoom 5 μm. (D) Inhibition of DGAT1 abolishes synthesis of triglycerides (TGs) from imported FAs in mock and PV-infected cells. Mock and PV-infected HeLa cells were incubated with DMSO or 20 μM of the DGAT1 inhibitor PF-04620110 at 1hpi. At 5½ hpi the cells were pulse labeled with 1 μM Green FA for 30min. At 6hpi, the cells were extensively washed and total lipids were extracted and resolved by TLC under optimal conditions for neutral lipids. Fluorescent lipids containing Green FA are shown. (E) The metabolic cascade of fluorescent FAs imported from the media into PV-infected cell. Infected cells uptake Green FA from the media and convert it to TGs which are stored in LDs. The last step of TG synthesis is catalyzed by the ER-localized enzyme DGAT1. TGs in LDs are cleaved by the lipolysis pathway to release FAs. Free FAs serve for synthesis of PC for the RCs. *DAG putative diacylglycerol (see STAR Methods), FA fatty acid, PC phosphatidylcholine, TG triglyceride.
We found that mock-infected cells treated with DMSO converted Green FA to the neutral lipid TG with negligible incorporation into phospholipids (Fig. 6B, lane 1). IF analysis confirmed that the fluorescent TGs were stored in LDs (Fig. 6C, top row). However, in mock-infected cells treated with CAY10499, fluorescent TG levels decreased and the levels of two other lipid species increased: free FA and a lower mobility neutral lipid, likely diacylglycerol (Fig. 6B, lane 2). Both lipids were expected to accumulate upon HSL inhibition (Fig. 5A).
Similarly to mock-infected cells, PV-infected cells converted Green FA to TGs (Fig. 6B, lane 3) indicating that synthesis of TGs continued during PV infection. Consistent with these results, pharmacological inhibition of the ER-localized enzyme DGAT1, which synthesizes TGs from imported FAs (Yen et al., 2008), blocked TGs synthesis in both mock and PV-infected HeLa and Huh7 cells (Fig. 6D and S5A). However, in contrast to mock cells, in PV-infected cells the incorporation of Green FA into phosphatidylcholine (PC), the main phospholipid within RC membranes, was substantially increased (compare lane 3 to lane 1). Consistent with these TLC results, IF analysis of PV-infected cells revealed two fluorescent patterns of Green FA: green signals in LDs (TG molecules) and yellow signals resulting from co-localization of Green FA with the RC marker, RFP-Arf1 (PC molecules) (Fig. 6C, third row).
These observations suggested two possible scenarios for the metabolism of Green FA in PV-infected cells. In the first scenario, Green FA imported from the media is converted to TGs and stored in LDs. Then, TGs are cleaved by lipolysis to release FAs for the synthesis of PC. In the second scenario, some of the imported green FA is converted to TG and stored in LDs, and some of it is directly channeled for PC synthesis. To discriminate between these two options, we followed the metabolism of Green FA in PV-infected cells treated with CAY10499. We found that HSL inhibition caused dramatic reduction in the level of fluorescent PC in PV-infected HeLa (Fig. 6B, lane 4) and Huh7 cells (Fig. S5B). We conclude that during PV-infection FAs imported from the media are not directly channeled for phospholipid synthesis, because in this scenario HSL inhibition would not affect PC synthesis. Instead, our results indicate that during PV infection, imported FAs are converted to TGs (Fig. 6E). The final step of TG synthesis is catalyzed by the ER-localized enzyme DGAT1 and the TGs are deposited in LDs. Then, TGs are cleaved by lipolysis to release FAs from LDs for PC synthesis for the RCs.
Inhibition of 2C function abolishes the recruitment of LDs for RC formation
Efficient FA flux from LDs to the RCs may be mediated by the close membrane contacts that formed between LDs and RCs during PV infection. We hypothesized that viral proteins which target LDs could play a role in establishing the close membrane contacts between LDs and RCs. Unfortunately, mutagenesis of the amphipathic helices of 2B and 2C targeting LDs or the C-terminal region of 2C responsible for LD clustering proved to be lethal for the virus. We therefore used a pharmacological approach to inhibit the function of 2C during infection and examine the role of this protein in the recruitment of LDs for PV replication.
A large number of studies previously established that guanidine hydrochloride (GnHCl) at a low concentration specifically inhibited the function of PV 2C protein (Pincus and Wimmer, 1986) and the growth of PV at the stage of viral RNA synthesis (Barton and Flanegan, 1997). At such low concentration (2mM), GnHCl has no denaturing effect on proteins and no toxic effects on cells. Thus, GnHCl is a well-established specific inhibitor of PV 2C protein. Previous evidence suggest that GnHCl changed the conformation of 2C (Tolskaya et al., 1994) and it was also shown that GnHCl inhibited the ATPase activity of recombinant 2C (Pfister and Wimmer, 1999).
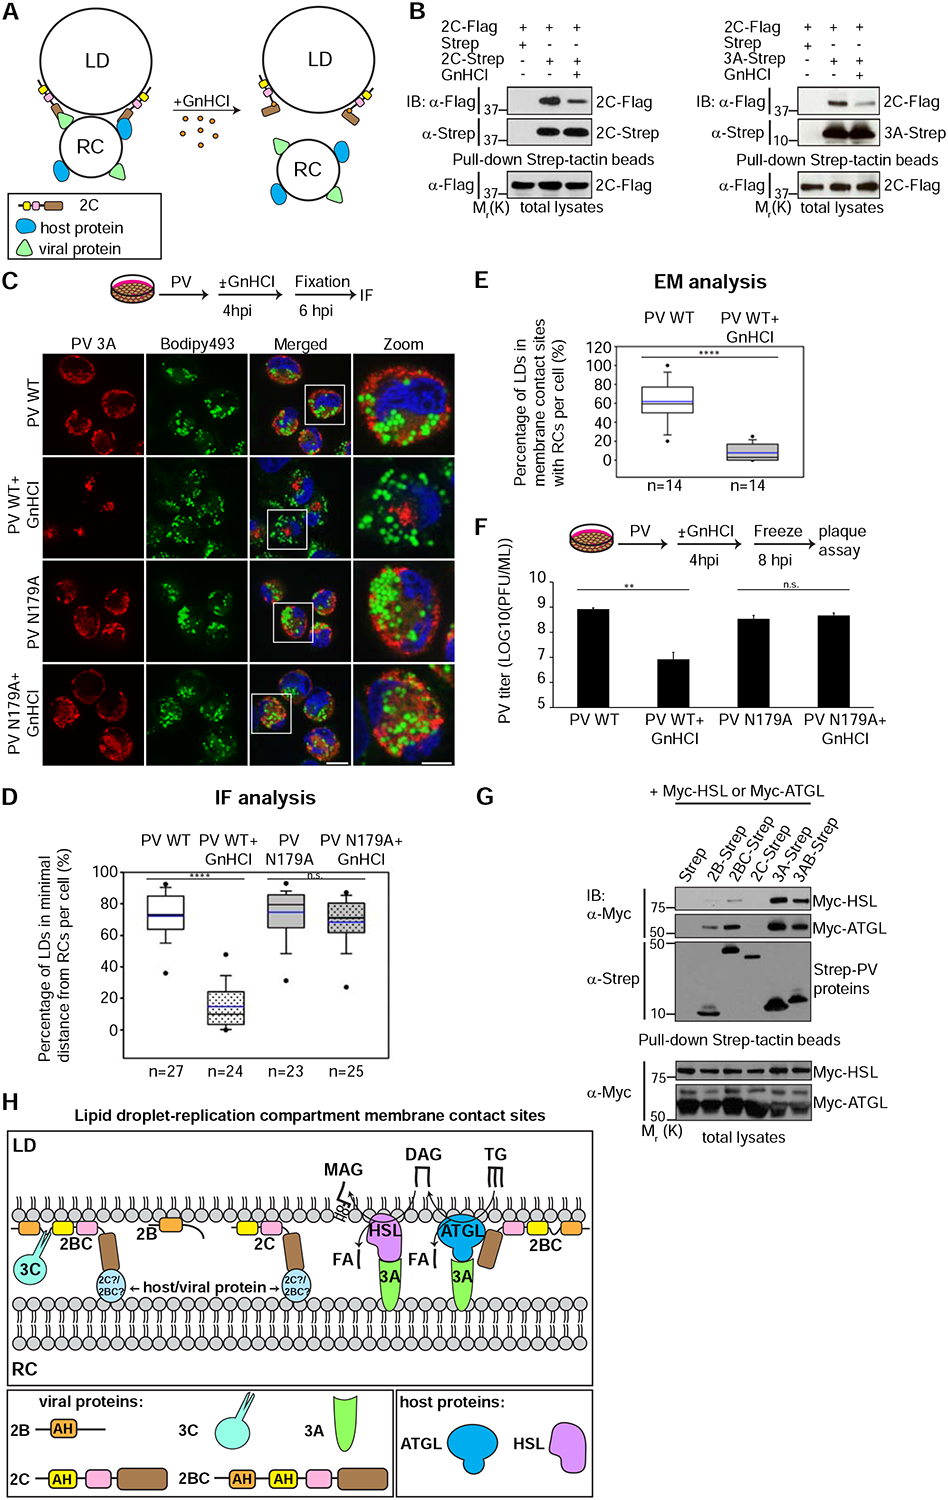
We hypothesized that 2C is involved in the formation of membrane contact sites between LDs and RCs by interacting with host or viral protein/s which are localized to the RCs thereby tethering LDs to the RCs (Fig. 7A). We predicted that GnHCl could affect this process by changing the conformation of 2C and disrupting its protein interactions. We thus first examined the effect of GnHCl on previously established protein interactions of 2C, focusing on 2C-2C and 2C-3A interactions (Guan et al., 2017; Yin et al., 2007). To this end, we co-expressed FLAG-tagged PV 2C with Strep-tagged 2C or with Strep-tagged 3A in the absence or presence of 2mM GnHCl and examined their interactions by pull-down experiments. We found that GnHCl substantially reduced both interactions of 2C (Fig. 7B).
Figure 7.
Inhibition of 2C function abolishes the recruitment of LDs for RC formation. See also Figures S6, S7 and Table S1.
(A) Hypothetical model for the effect of GnHCl on the formation of membrane contact sites between LDs and RCs. 2C is suggested to tether LDs and RCs by interacting with host or viral protein localized to the RCs. GnHCl changes the conformation of 2C, disrupts its protein interactions and thereby LD-RC tethering. (B) Treatment with GnHCl disrupts 2C-2C and 2C-3A protein interactions. Flag-tagged PV 2C protein was co-expressed with Strep-tagged 2C (left panel) or Strep-tagged 3A (right panel) in HEK293T cells in the absence or presence of 2mM GnHCl. The interactions of 2C-Flag with the Strep-tagged PV proteins were detected by pull-down and immunoblotting analysis. The total expression levels of 2C-Flag are shown in the lower panels. (C) Specific inhibition of PV 2C with GnHCl reduces the proximity between LDs and RCs and RC formation. HeLa cells infected with wild-type PV or a PV mutant resistant for GnHCl (2C N179A) were incubated with or without 2mM GnHCl at 4hpi and fixed at 6hpi. Cells were co-labeled for the RCs (anti-3A antibodies, red) and LDs (Bodipy493/503 (green)). Scale bar 10 μm, zoom 5 μm. (D) Quantification of (C). The percentage of LDs in minimal distance from the RCs (less than one pixel=154nm) per cell was measured in 3D reconstructions of confocal stacks. The number of cells analyzed per each treatment is indicated. (E) GnHCl inhibits the formation of LD-RC membrane contact sites. The percentage of LDs which are within a distance of 30nm from the RCs per cell was measured in TEM thin sections of randomly chosen cells infected with PV in the absence and presence of GnHCl (n=14 cells for each condition). (F) Specific inhibition of 2C by GnHCl at 4hpi disrupts infectious particle production of PV. HeLa cells infected with wild-type PV or a PV mutant resistant to GnHCl (2C N179A) were incubated with or without 2mM GnHCl at 4hpi. Cells and supernatants were collected at 8hpi and the total number of infectious particles was determined by plaque assay. Virus titer values represent mean ± standard deviation for 2 independent experiments with 3 biological replicates each. (G) Enteroviral proteins physically interact with ATGL and HSL. The indicated Strep-tagged PV proteins were co-expressed in HEK293T cells with Myc-tagged HSL or ATGL. Protein interactions were detected by pull-down experiments with Strep-tactin beads and immunoblotting analysis. The total expression levels of Myc-HSL and ATGL are shown in the lower panels. (H) A model for the membrane contact sites between LDs and PV RCs (see Discussion). 2C and 2BC mediate the tethering of LDs and RCs. 2BC is targeted to LDs via its amphipathic helices while its C-terminal region interacts with viral or host proteins localized to the RCs, possibly 2C or 2BC. Cleavage of 2BC by 3C protease produces mature 2B and 2C. Mature 2C binds its partner on the RCs via its C-terminal region. PV 3A and 2BC proteins interact with the host lipases ATGL and HSL. These interactions may promote the recruitment of the lipolysis machinery to the LD-RC interface. (D-F) n.s. not significant **p<0.005, ****p<0.0001 (Mann-Whitney test).
These results prompted us to examine the effect of GnHCl on LD recruitment to the RCs during infection. When PV-infected HeLa cells were treated with 2mM GnHCl at early time points of infection (1 or 3hpi) and analyzed at 6hpi, viral protein expression was blocked (Fig. S6A) and no dsRNA structures or RCs were detected by IF analysis (data not shown). These results indicated an early inhibition of viral RNA synthesis consistent with the direct role of the multifunctional protein 2C in RNA synthesis (Barton and Flanegan, 1997).
However, when the treatment with GnHCl was delayed to 4hpi, a time in which RCs start to form, enough viral RNA has already accumulated, and the production of viral proteins was unaffected by GnHCl (Fig. S6A). Nonetheless, under these conditions the recruitment of LDs to the RCs was significantly reduced (Fig. 7C and 7D). In PV-infected cells, 72% of the LDs were in a minimal distance from the RCs (less than 1 pixel which equals 154nm), whereas in infected cells treated with GnHCl only 15% of the LDs were in a minimal distance from the RCs. Consistent with these results, EM analysis showed that GnHCl treatment significantly reduced the percentage of LDs that were within a distance of 30nm from the RCs (8% in GnHCl-treated cells vs. 62% in non-treated cells) indicating a decrease in the formation of membrane contact sites between LDs and RCs (Fig. 7E, S6B–S6F and Table S1). Because GnHCl treatment did not affect the LD-targeting of ectopically expressed 2C (Fig. S7), we suggest that GnHCl inhibited the formation of LD-RC membrane contact sites by disrupting protein-protein interactions of 2C which were essential to tether LDs to the RCs (Fig. 7A).
GnHCl treatment at 4hpi also disrupted the biogenesis of the RCs (Fig. 7C). At 6hpi, the mean total volume of RCs per cell was 199 μm3 in PV-infected cells as compared to 57 μm3 in infected cells treated with GnHCl (n=26 and 28 cells, respectively, p<0.0001 (Mann-Whitney test)) suggesting that membrane contact sites between LDs and RCs are required for the biogenesis of the RCs. Consistent with the decrease in RC biogenesis, PV titer at 8hpi decreased by 98% in GnHCl-treated cells (Fig. 7F).
To further determine whether these effects were a direct consequence of the inhibition of 2C by GnHCl, we generated a PV mutant carrying the mutation N179A in 2C, which was previously shown to confer guanidine resistance to PV and to enable normal PV replication in the presence of GnHCl (Pincus and Wimmer, 1986). When cells infected with the mutant virus were treated with GnHCl at 4hpi, the recruitment of LDs to the RCs, the morphology of the RCs and virus titer were undistinguishable from non-treated cells (Fig. 7C–D and 7F).
These observations demonstrate that the effects of GnHCl on the RCs were caused by specific inhibition of 2C. Furthermore, they suggest that 2C function is essential for the formation of membrane contact sites between LDs and RCs.
Enteroviral proteins physically interact with the lipolysis machinery
Our results suggested that the function of 2C viral protein is required for the formation of membrane contact sites between LDs and RCs and for RC biogenesis. Given that lipolysis is also required for RC biogenesis, we examined the possibility that viral proteins interact with the lipolysis machinery. To this end, Strep-tagged PV proteins and Myc-tagged HSL or ATGL were co-expressed in HEK293T cells and protein interactions were examined by pull-down experiments. We found that PV 3A and its precursor 3AB, specifically interacted with both HSL and ATGL. We also detected weaker interaction of 2BC with ATGL (Fig. 7G). 3A and 3AB were previously shown to localize to the RCs during infection, while ATGL and HSL perform their lipolytic activity on LDs. We thus suggest that these interactions may promote the recruitment of the lipolysis machinery to the membrane contact sites between LDs and RCs, where its function is required to release FAs for RC formation (Fig. 7H).
Discussion
Enteroviruses, like most positive-stranded RNA viruses, replicate on specialized membrane compartments that form during infection. How the virus remodels the endomembrane system of the host cell to create RCs is not well understood. Here we provided two independent lines of evidence that enteroviruses re-propose LDs to serve as a source of lipids for the biogenesis of their RCs. First, using fluorescent FA we demonstrated a flux of FAs from LDs to the RCs. We further showed that inhibition of the host lipolysis pathway disrupted this FA flux, the biogenesis of the RCs and enterovirus replication. Second, we showed that specific inhibition of PV 2C protein by guanidinium reduced the formation of membrane contact sites between LDs and RCs and the biogenesis of RCs.
2C and 2BC proteins were previously implicated in the biogenesis of RCs, however their exact roles in this process were unknown (Cho et al., 1994). We find that 2C and 2BC bind specifically to the surface of LDs via amphipathic helices and that 2C function is required for the formation of membrane contact sites between LDs and the RCs. Our data are consistent with two possible scenarios which are not mutually exclusive (Fig. 7H). In the first scenario, unprocessed 2BC is bound to LDs via its amphipathic helices and is then cleaved by 3C viral protease to yield LD-targeted 2B and 2C. In the second scenario, 2B and 2C localize to LDs by virtue of their respective helices and independently of 2BC. For both scenarios, we propose a model in which LD-associated 2C interacts with counterparts in the RCs to promote tethering of LDs and RCs.
To identify the 2C-interacting partner on the RCs we carried out pull-down experiments of Strep-tagged 2C and 2BC followed by Mass-Spectrometry analysis. Although we detected several host interacting proteins, none of them seemed relevant for the biogenesis of RCs (data not shown). We therefore explored the possibility that RC-localized viral protein is involved in the tethering of LDs and RCs. All of the non-structural viral proteins including 2BC, 3AB and 3CD were previously shown to localize to the RCs. Among these proteins the most likely candidate is 2C given that the C-terminal regions of 2C have been demonstrated to form a homo-dimer (Guan et al., 2017). It is thus possible that 2C mediates RC-LD association in any of the following combinations: 2C(LD)-2C(RC), 2C(LD)-2BC(RC), 2BC(LD)-2C(RC) and 2BC(LD)-2BC(RC). In support of this idea, we found that 2C-2C interactions mediate clustering of LDs in cells expressing 2C or 2BC (Fig. 4H and 4I). To further examine this hypothesis, we generated a PV mutant carrying the mutation F328A in 2C that abolishes the interactions between the C-terminal regions of 2C (Guan et al., 2017). Interestingly, this mutation was lethal to the virus, suggesting that 2C-2C interaction is essential for virus replication. Unfortunately, we could not examine its effect on the tethering of LDs to RCs in the context of infection. We conclude that the most parsimonious model is that 2C/2BC molecules located on the surface of LDs interact with 2C/2BC molecules located in the RCs through their C-terminal regions to mediate the tethering of LDs to the RCs.
Enteroviral 2B, 2C and 2BC are new members in a group of proteins that target LDs via amphipathic helices including CCT alpha (Kory et al., 2016). An important question in the field of LD biology is how these amphipathic helices specifically target LDs whose surface membrane is a monolayer and not the bilayer membranes of other organelles. Previous study suggested that the surface membrane of LDs contains larger and more frequent packing defects (exposure of neutral lipids or fatty-acyl chains of phospholipids to the cytosol) than bilayer membranes and these packing defects bind to large hydrophobic residues of the amphipathic helices thereby mediating their targeting to LDs (Prevost et al., 2018). Further studies will be required to fully uncover the mechanisms responsible for the LD targeting of these proteins.
Enterovirus infection was previously shown to upregulate import of FAs from the extracellular media for phospholipid synthesis (Nchoutmboube et al., 2013). Our results suggest that FAs imported from the media are not directly channeled to phospholipid synthesis for the RCs, but are converted to TGs and deposited in LDs. Eukaryotic cells use the TG synthesis pathway to prevent unregulated incorporation of FAs into cellular organelles which may compromise organelle structure and function and lead to cell toxicity. We show here, that during PV infection, this protective mechanism remains active but is exploited by the virus to redirect lipids to the RCs. After the synthesis of TGs, the lipolysis pathway is required to release FAs from LDs for use as building blocks for the RCs. Released FAs need to be converted to acyl-CoA and then into phospholipids, a process that involves several steps of lipid modifications. Future studies will be required to identify the enzymes involved in this process and whether they are recruited to LDs or the RCs during enterovirus infection.
The spatial efficiency of FA channeling from LDs toward the RCs is mediated by viral induction of new membrane contact sites between the cellular lipid containers (LDs) and the viral “construction sites” (RCs). Our IF and electron microscopy analyses demonstrate that during PV infection the majority of LDs establish membrane contact sites with the RCs. However, many of the RCs are not found in close apposition to the LDs. To explain this observation, we propose that the formation of membrane contact sites between RCs and LDs is a highly dynamic process. After RCs complete their biogenesis, they disconnect from LDs, allowing newly growing RCs to create membrane contact sites with LDs and feed on them. According to this scenario, mature RCs will be pushed away from LDs.
While LDs provide essential building blocks for the biogenesis of the RCs, additional processes are involved in generating a unique lipid composition of the RCs. Previous studies show that the RCs become enriched with phosphatidylinositol-4-phosphate (PI4P) and cholesterol and that both lipids are essential for the replication of the viral genome (Hsu et al., 2010; Ilnytska et al., 2013).
LDs are involved in the life cycle of other positive-stranded RNA viruses, most notably the flaviviruses hepatitis C and dengue. The capsid proteins of hepatitis C and dengue localize to LDs, which are suggested to be the production sites of new virus particles (Miyanari et al., 2007; Samsa et al., 2009). In addition, during dengue infection LDs are delivered to lysosomes and the released FAs are sent to the mitochondria to produce ATP essential for viral replication (Heaton and Randall, 2010). Here we show that enteroviruses use LDs for a different purpose - providing building blocks for the biogenesis of their RCs. Thus, our findings illuminate the diverse ways by which viruses exploit host LDs. In the future, it would be interesting to find out whether other virus families depend on the lipolysis pathway to provide building blocks to their RCs like enteroviruses. Importantly, the finding that the host lipolysis pathway is required for enterovirus replication suggests a potential strategy to interfere with enterovirus replication by blocking the lipolysis enzymes.
STAR Methods
CONTACT FOR REAGENT AND RESOURCE SHARING
Further information and requests for resources and reagents should be directed to and will be fulfilled by the Lead Contact, Raul Andino (Raul.Andino@ucsf.edu).
EXPERIMENTAL MODEL AND SUBJECT DETAILS
Cell Culture
HeLa S3 cells originated from a human female cervix and Huh7 cells originated from a human male liver were grown in DMEM/Ham’s F-12 1:1 medium supplemented with 10% fetal bovine serum (FBS), 100 units/ml penicillin and 100 μg/ml streptomycin. HEK293T cells originated from a human female embryonic kidney and RD cells originated from a human female rhabdomyosarcoma were grown in DMEM medium supplemented as above. Caco2 cells originated from a human male colon were grown in Eagle’s MEM medium supplemented with 20% FBS and antibiotics as above. For virus infections, Caco2 cells were grown under conditions that promote differentiation into a cell monolayer with intestinal-like properties; cells were grown in 24-well plates until 100% confluence was acquired, and then medium was daily exchanged for 14 days to allow cell differentiation. All cells were grown at 37°C in a 5% CO2 incubator.
Virus production and infections
Viral RNA was generated by linearization of the plasmids encoding for the cDNAs of poliovirus type 1 Mahoney (Herold and Andino, 2000), coxsackievirus B3 (Carson et al., 2007) and enterovirus 71 strain 4643 (Yeh et al., 2011) with the relevant restriction enzyme (EcoRI, ClaI and EagI, respectively) and in-vitro transcription. Transcribed RNAs were electroporated to HeLa cells (poliovirus and coxsackievirus B3) or RD cells (enterovirus 71) and cells were grown until lysis. Cells and supernatants were freeze-thawed three times and cellular debris was pelleted at 2500g for 5 minutes. The recovered supernatants containing the virus (P0 stocks) were used to re-infect cells and generate P1 stocks. Titers of P1 virus stocks were determined by plaque assays (PV) or 50% tissue culture infective dose (TCID50) assays (coxsackievirus B3 & enterovirus 71) and used in infection experiments.
For infections cell monolayer was washed once with PBS, and virus was added at the desired multiplicity of infection (moi) in media containing 2% serum and incubated for 30 minutes at 37°C. Mock infection was performed similarly with media containing 2% serum but no virus. Subsequently, virus was removed and cells were washed three times with PBS and incubated with fresh media containing 10% serum. In experiments involving inhibitors, DMSO or drugs were added at 1 hour post infection (hpi) to prevent any effect on virus entry. At the desired times post infection, cells were either fixed for immunofluorescence analysis or frozen at −80°C for virus titer assays. Following three freeze-thaw cycles virus titers were determined by plaque assays (PV) or 50% tissue culture infective dose (TCID50) assays (coxsackievirus B3 & enterovirus 71).
METHOD DETAILS
Generation of DNA constructs
Mammalian expression plasmids encoding for the different PV proteins with C-terminal double Strep-tag subcloned in pCDNA4/TO vector (ThermoFisher Scientific) were generously provided by Dr. Nevan Krogan (University of California San Francisco, San Francisco, USA). The plasmids encoding for PV-2B, 2C and 2BC were used as templates in PCR reactions to generate the different truncation mutants described in this study. All truncation mutants were subcloned into pCDNA4/TO vector. Myc-tagged ATGL was a generous gift from Dr. Jun Liu (Mayo Clinic, Arizona, USA). A mammalian expression plasmid encoding for rat HSL was generously provided by Dr. Frederic Kraemer (Stanford University, Stanford, USA) and used as a template for PCR amplification incorporating C-terminal Myc-tag. The amplified product was subcloned into pCDNA3.1(+) vector (Invitrogen). A complete list of primers used for PCR reactions and generation of constructs described in this study is provided in Table S3.
Immunofluorescence microscopy and analysis
HeLa S3 and Huh7 cells were grown on 12mm coverslips in 24-well plates and transfected with different DNA constructs using lipofectamine 2000 transfection reagent (ThermoFisher Scientific). Before transfection, media in each well was replaced to 0.5mL fresh media. 1μg of DNA was diluted into 25μL of serum-free Opti-MEM media and mixed by pipettation. Then, 2μL of lipofectamine 2000 were diluted into 25μL of serum-free Opti-MEM media and mixed by pipettation. The diluted DNA was added to the diluted lipofectamine 2000 reagent, mixed by pipettation and incubated for 5 minutes at room temperature. The transfection mixtures were added drop-wise to the cells and cells were incubated for 8 hours at 37°C. Then the media containing transfection mixtures was replaced with fresh 1mL media. Cells were processed for immunofluorescence analysis 24 hours post transfection. In infection experiments, cells were infected with PV at moi 10 for the time duration specified in the figures (4–8 hours post infection). Cells were washed with PBS and fixed in 4% paraformaldehyde in PBS for 15 minutes at room temperature. Fixation was quenched by incubating the cells with 0.1M glycine in PBS for 15 minutes. Cells were extensively washed with PBS and permeabilized with 0.01% digitonin in PBS for 30 minutes. Permeabilized cells were incubated with blocking solution (10 mM Tris-HCl pH 7.5, 150 mM NaCl, 2% BSA and 10% goat serum) for 30 minutes and then incubated for 1 hour with primary antibodies diluted in the same blocking solution at room temperature. Coverslips were extensively washed with PBS, incubated for 1 hour with secondary antibodies diluted in blocking solution and washed with PBS. For staining of lipid droplets, coverslips were incubated with 1μg/ml Bodipy 493/503 diluted in PBS for 15 minutes and extensively washed with PBS. Finally, coverslips were incubated for 5 minutes with 10μg/ml of Hoechst 33342 diluted in PBS, washed with PBS and mounted on slides with Prolong Gold antifade mounting solution (ThermoFisher Scientific). At least 8–10 fields of cells were imaged for each experimental condition with a spinning disk confocal microscope (Nikon Ti-E microscope equipped with Yokagawa CSU-22) (Nikon imaging center of UCSF) using Micro-Manager software. 488, 561, 640 and 405 nm laser lines were used for excitation of Alexa Fluor 488, Alexa fluor 555, Cy5 and Hoechst 33342, respectively. Representative cells are shown in the figures. For quantifications of cell properties, a subset of the imaged fields containing 20–50 cells was selected randomly and analyzed in detail. Similar numbers of cells were analyzed for comparison between different experimental conditions. For quantifications presented in Figures 1B and 5D, z-stacks were collected and maximum intensity projections were generated and analyzed using the NIS-elements software (Nikon). For quantifications presented in Figures 1D and 7D, z-stacks were collected and analyzed using Imaris software (Bitplane). At least two independent experiments were performed for each condition. Statistical significance was determined using two-tailed Mann-Whitney-Wilcoxon test for n=42, 49 and 47 cells (Figure 1B), n=22, 22 and 28 cells (Figure 1D), n=41 and 42 cells (Figure 5D), n=27, 24, 23 and 25 cells (Figure 7D), n=437 and 316 LDs (Figure S1B left panel) and n=32 and 36 cells (Figure S1B right panel). No blinding was used.
Establishment of stable cell-line
HeLa S3 cells were transfected with RFP-Arf1 construct and 36 hours later were splitted into a selection medium containing 0.75μg/ml G418. Following two weeks of growth in the selection medium, emerging cell colonies were screened for the expression of RFP-Arf1 by immunoblotting and immunofluorescence analyses. Positive colonies in which the vast majority of the cells express RFP-Arf1 were expanded and used in experiments.
Live-cell imaging
HeLa S3 cells stably expressing RFP-Arf1 were grown in 35mm glass-bottom dish (MatTek). Cells were washed with PBS and infected with PV at moi 10 in DMEM/Ham’s F-12 media containing 2% FBS for 30 minutes at 37°C. Cells were then washed three times with PBS and incubated with fresh DMEM/Ham’s F-12 media containing 10% FBS. At 3hpi cells were incubated with 1μg/ml of Bodipy 493/503 in PBS for 5 minutes, extensively washed with PBS and incubated with phenol red-free DMEM/Ham’s F-12 media containing 20mM Hepes pH 7.5 and 10% FBS. Cells were immediately imaged using a spinning disk confocal microscope and a 37°C heated stage. Time lapse images were acquired every 7 and half minutes for a total of 7 hrs. Three independent live-cell imaging experiments were performed.
Transmission electron microscopy analysis
HeLa cells were mock or PV-infected with moi 10 and at 4hpi incubated with or without 2mM GnHCl. At 6hpi cells were fixed with 2% glutaraldehyde and 4% paraformaldehyde in 0.1M sodium cacodylate pH 7.4 for 25 minutes on ice. Subsequently, cells were washed with sodium cacodylate and post-fixed in cold 1% osmium tetroxide in water and allowed to warm for 2 hr in a hood. Cells were washed 3 times with ultra-filtered water and stained for 2 hours in 1% uranyl acetate at room temperature. Samples were then dehydrated in a series of ethanol washes of 50%, 70%, 95%, 100% and 1% tannic acid in 100% ethanol for 10 minutes each at room temperature. Samples were incubated with propylene oxide (PO) for 10 min and infiltrated with EMbed-812 resin mixed 1:1, and 2:1 with PO for 2 hours each. The samples were infiltrated with EMbed-812 for 2 hours and then placed into molds with fresh resin and polymerized in 65°C oven overnight. The block faces were trimmed down allowing for serial sectioning of the cells of interest. Sections were taken around 90nm, picked up on formvar/Carbon coated slot Cu grids, stained for 40 seconds in 3.5% uranyl acetate in 50% acetone followed by staining in 0.2% lead citrate for 6 minutes. Sections were observed in the JEOL JEM-1400 120kV and photos were taken using a Gatan Orius 2k X 2k digital camera. Two independent TEM experiments were performed and 14 randomly chosen cells (manual selection) were imaged and analyzed for each experimental condition. Representative micrographs are shown in Figures 2, S2 and S6. All LDs within PV-infected cells in the presence or absence of GnHCl were analyzed for membrane contact sites with RCs. Statistical significance shown in Figure 7E was determined using two-tailed Mann-Whitney-Wilcoxon test for n=14 and 14 cells. No blinding was used.
Plaque assays
For determination of PV titers, HeLa S3 cells were seeded in 6-well plates at 1×10⁶ cells per well and incubated for 24 hours at 37°C to reach full confluency. Each virus sample was diluted using 10-fold serial dilutions in serum-free DMEM/F-12 media. Media was removed from the cells and 500μL of the different virus dilutions were added to the cells (single dilution per well) and incubated at 37°C for 40 minutes with occasional swirling of the plates to distribute the virus. 4 mL overlay of 1% agar in DMEM/F-12 media were then added to each well and allowed to solidify at room temperature. Plates were then incubated for 48 hours at 37°C and fixed with 2% formaldehyde for 10 minutes at room temperature. Agar overlay was removed and cells stained with 0.1% crystal violet for 10 minutes. Plaques were counted from wells with 10–100 plaques and virus titer was calculated as follows: Titer (plaque-forming units (PFU)/mL) = well plaque count/0.5mL x dilution factor. Two independent experiments with 3 biological replicates were performed for each experimental condition. All samples were included in the statistical analysis using two-tailed Mann-Whitney-Wilcoxon test. No blinding or randomization was used.
TCID50 assays
For determination of coxsackievirus B3 and enterovirus 71 titers, 1×10⁴ HeLa S3 cells (coxsackievirus B3) or RD cells (enterovirus 71) in 100μL media were seeded in 96-well plates and incubated for 24 hours at 37°C. Virus samples were diluted using 10-fold serial dilutions in serum-free media. Each one of the wells in a single row was infected with 100μL of the same virus dilution and each row was infected with a different virus dilution. Plates were incubated for 5–7 days at 37°C until cytopathic effect was visible. Wells were scored as positive or negative for cytopathic effect using a phase contrast microscope and the number of wells that show cytopathic effect was counted for each dilution (each row). The dilution that will infect 50% of the wells was calculated using Excel-based calculator created by and available from Brett Lindenbach (Lindenbach, 2009). Two independent experiments with 3 biological replicates were performed for each experimental condition. All samples were included in the statistical analysis using two-tailed Mann-Whitney-Wilcoxon test. No blinding or randomization was used.
Fluorescent fatty acid labeling experiment
HeLa S3 cells in 60mm plates or Huh7 cells in 10cm plates were washed with PBS and infected with PV at moi 10 in DMEM/Ham’s F-12 media containing 2% FBS for 40 minutes at 37°C or mock-infected with media containing 2% FBS but no virus under similar conditions. Cells were then washed three times with PBS and incubated in fresh DMEM/Ham’s F-12 media containing 10% FBS. At 1 hpi media was supplemented with DMSO or 100μM CAY10499 or 20μM PF-04620110 as indicated in Fig. 6 and Fig. S5. At 5 and half hpi, cells were washed with PBS and incubated for half an hour with DMEM/Ham’s F-12 media containing 1μM fluorescent fatty acid analogue, Bodipy 500/510 C4, C9 without any serum and in the presence of DMSO or the relevant inhibitor. At 6 hpi cells were washed three times with cold PBS and harvested in PBS. For each sample, 20% of the cells were used for determination of protein concentration with Bio-Rad protein assay, whereas the rest 80% were used for total lipid extraction. Cell pellets were extracted for half an hour in a mixture of hexane:isopropanol (3:2). Lipid extracts were dried at 50°C and resuspended in chloroform. Volumes corresponding to equal amount of total protein were loaded on TLC plates (Silica gel 60, EMD-Millipore). Two independent experiments were performed for each experimental condition.
Thin layer chromatography
Lipid samples were analysed on two separate TLC plates. Polar lipids were separated in chloroform:ethanol:water:triethylamine (30:35:7:35) and neutral lipids were separated in hexane:ethyl acetate:acetic acid (90:10:0.5). Alongside the samples extracted from the cells, fluorescent and non-fluorescent lipid standards were run. Fluorescent lipid standards were Bodipy 500/510 C4, C9 (Free fatty acid) and Cholesteryl Bodipy FL C12 (cholsteryl ester) (ThermoFisher Scientific). Non-fluorescent lipid standards were 1-Palmitoyl-2-oleoyl-sn-glycero-3-Phosphocholine (Cayman chemical), Glyceryl trioleate and cholesteryl oleate (Sigma). Developed TLC plates were first imaged for fluorescent signals using the ChemiDoc imaging system (Bio-Rad). Subsequently, non-fluorescent phospholipids were stained with Phospray (Sigma-Aldrich) and neutral lipids were detected with phosphomolybdic acid spray reagent (Sigma-Aldrich) and heating at 120°C. Comparing the migration profile of fluorescent and non-fluorescent lipid species reveals that incorporation of Bodipy fluorophore did not affect the migration of the fluorescent phospholipid phosphatidylcholine, but did cause a slower migration of the fluorescent neutral lipids cholesteryl ester and triglyceride. As shown in Fig. 6D, using an inhibitor of DGAT-1, the enzyme that synthesizes triglycerids, we were able to validate the identity of fluorescent triglycerides. Under HSL inhibition fluorescent TG levels decreased and concomitantly the levels of neutral lipid with lower mobility increased. We suggest that this lipid is probably diacylglycerol which we mark as *DAG in Fig. 6B and S5B based on its lower mobility as compared to fluorescent TG as well as our IF analysis showing this lipid species is stored in LDs (Fig. 6C, second row from top). In addition DAG is predicted to accumulate upon HSL inhibition. Two independent experiments were performed for each experimental condition.
Purification of lipid droplets
For isolation of LDs from cells that ectopically express viral proteins, HeLa S3 cells were transfected for 24 hrs with Strep-tagged 2B, 2C or 2BC using lipofectamine 2000. For isolation of LDs from infected cells, HeLa S3 cells were infected with PV at moi 10 in DMEM/Ham’s F-12 media containing 2% FBS for 40 minutes at 37°C or mock-infected with media containing 2% FBS but no virus under similar conditions. Cells were then washed three times with PBS and incubated in DMEM/Ham’s F-12 media containing 10% FBS. At 6 hpi cells were washed twice with cold PBS and harvested in cold PBS. All subsequent steps were performed at 4°C. Cell pellets were resuspended in hypotonic buffer (50mM Hepes pH 7.4, 2mM MgCl2, 1mM EDTA, 250mM sucrose supplemented with 1mM PMSF, 10 μg/mL leupeptin and 10μg/mL aprotinin) and incubated for 30 minutes. Cells were then homogenized by 30 strokes of dounce homogenizer and post-nuclear supernatants (PNS) isolated by centrifugation at 1000g for 10 minutes. The protein concentration of PNS isolated from Mock and PV-infected cells were determined using Bio-Rad protein assay and 3mL samples of PNS containing equal protein amounts were prepared for mock and PV-infected cells. The sucrose concentration of the samples was adjusted to 29% by adding equal volume of isotonic buffer (50mM Hepes pH 7.4, 100mM KCl, 2mM MgCl2) containing 1.5M sucrose. In a 12-mL ultracentrifuge tube (Beckman Coulter) 6mL of PNS containing 29% sucrose were placed in the bottom and layered by 2mL of 18% sucrose in isotonic buffer, 2mL of 10% sucrose in isotonic buffer and 1.6mL of isotonic buffer. The gradients were centrifuged at 34,000 rpm for 2 hours at 4°C using SW40Ti rotor (Beckman Coulter). Following centrifugation, the top 0.8ml fractions containing floating lipid droplets were collected and transferred to microcentrifuge tubes. Samples were centrifuged at 20,000g for 20 minutes at 4°C and the underlying buffer was removed with gel loading tip until the sample volume was minimized to 150μL. Samples were mixed with Lammeli buffer, boiled and analysed by Western blot. Two independent fractionation assays were performed for each experimental condition.
Pull-down experiments
HEK293T cells in 60mm plates were transfected with different DNA constructs using the PolyJet transfection reagent (SignaGen). Before transfection, the media in each plate was replaced with 2mL fresh media. 5 μg DNA were diluted into 100μL of serum-free DMEM media and mixed by pipettation. Then, 15μL of PolyJet transfection reagent were diluted into 100μL of serum-free DMEM media, mixed by pipettation and immediately added to the diluted DNA solution and mixed again by pipettation. The DNA:PolyJet mixtures were incubated for 10 minutes at room temperature and then added drop-wise to the cells. Transfected cells were incubated at 37°C for 6–8 hours and then the media containing the transfection mixtures was replaced with fresh 4mL media. 24 hours post transfection cells were harvested in cold PBS and lysed for 30 minutes in cold buffer W (50mM Tris-HCl pH 8.0, 150mM NaCl, 1mM EDTA and 0.5% NP-40) supplemented with 1mM PMSF, 10 μg/mL leupeptin and 10μg/mL aprotinin. Lysates were centrifuged at 15,000g for 15min at 4°C and the supernatants were incubated with 15μL of Strep-tactin sepharose beads (IBA) for 2 hours at 4°C. The beads were then washed 3 times in buffer W containing 0.5% NP-40 and twice with Buffer W without detergent. Bound proteins were eluted in buffer W containing 10mM desthiobiotin (Sigma-Aldrich), separated from the beads, mixed with Laemmli sample buffer, boiled and analysed by Western blot. Two independent pull-down assays were performed for each experiment.
Western blot analysis
Protein samples were electrophoresed on 10%, 15% or 4–20% gradient SDS-PAGE gels depending on the molecular weight of the relevant proteins and transferred to nitrocellulose membranes (Bio-Rad). Membranes were blocked with 5% skim milk in TBST (10mM Tris pH 7.5, 150mM NaCl, 0.1% Tween-20) for 30 minutes at room temperature and then incubated with the relevant primary antibodies in the same blocking solution overnight at 4°C. Membranes were washed 3 times with TBST for 5 minutes each and incubated with horseradish peroxidase-conjugated secondary antibodies (GE Healthcare Life Sciences) in blocking solution for 1 hour at room temperature. Membranes were washed and signals were developed using Pierce ECL Plus Western blotting substrate (Thermo Scientific).
Cell viability assays
The effect of the different chemical inhibitors on cell viability was determined by the CellTiter-Glo luminiscent cell viability assay (Promega). Cells were grown in opaque 96-well plate, in a total volume of 100uL media per well. Different chemical inhibitors or DMSO (control) were added to the cells and cells were incubated at 37°C for 7 hours. The plates were then equilibrated at room temperature for 30 minutes and equal volume of the CellTiter-Glo reagent (100uL) was added to each well. Plates were placed on orbital shaker for 2 minutes to mix contents followed by incubation at room temperature for 10 minutes to stabilize signal. Luminescence was then recorded using Veritas Microplate Luminometer (Promega). Two independent experiments were performed.
QUANTIFICATION AND STATISTICAL ANALYSIS
Quantification of IF analysis
Image analysis of cell properties was done with NIS-elements software (Nikon) (Figures 1B and 5D) and imageJ software (Figure S1B) and data was plotted using SigmaPlot (Systat Software). The median and mean values for each experimental group are indicated in the Figures. For Figures 1B, 5D and S1B right panel, “n” represents the number of cells analyzed for each condition and is indicated in the figures and figure legends. For Figure S1B left panel, “n” represents the number of LDs analyzed for each condition. Two independent experiments were performed for each experimental condition.
For quantification of the proximity between LDs and RCs (Figures 1D and 7D) 3D confocal stacks were segmented using Imaris software (Bitplane). LDs and RCs were segmented with the surfaces tool, using smoothing and background substraction and manual thresholding. Split touching objects was used for LDs. Objects smaller than 10 voxels were excluded. Distance transformation was used to measure the distance between every LD and the RCs. The percentage of LDs with a minimum distance of less than one pixel (154nm) from the RCs was calculated for each cell. “n” represents the number of cells analyzed for each condition and is indicated in the figures and figure legends. Two independent experiments were performed for each experimental condition.
Quantification of EM analysis
For quantification of membrane contact sites in thin TEM sections, 14 randomly chosen PV-infected cells and 14 randomly chosen PV-infected cells treated with GnHCl from 2 independent experiments were first imaged at low magnification to capture the whole cell area. Subsequently, all LDs in each cell were imaged at high magnification and the distance between each LD and the closest RCs was measured in ImageJ. Events where LD was within a distance of 30nm from at least one RC were scored as membrane contact sites. The number of RCs which form membrane contact sites with LD was determined for each LD and the percentage of perimeter of LD engaged in membrane contact sites with the RCs was measured using imageJ.
Statistics
Statistical tests were performed using R statistics (R Development Core Team). Statistical significance for all experiments (virus titer assays, IF and EM analyses) was determined using two-tailed Mann-Whitney-Wilcoxon test. The Mann-Whitney-Wilcoxon test is a non-parametric test and therefore does not assume normal distribution of the samples.
For virus titer assays data are expressed and plotted as mean ± standard deviation values.
Supplementary Material
Figure S1Effects of PV infection on the distribution and morphology of LDs, related to Figure 1. (A) The protein levels of TIP47 remain constant during PV infection. Western blot analysis at the indicated times post infection. 2C serves as a marker for PV infection and GAPDH serves as a loading control. (B) Quantification of the distance between LDs and the nucleus (left panel) and the cell area (right panel) in mock and PV-infected cells at 6hpi. The mean distance between LDs and the nucleus decreased by 65% whereas the mean cell area decreased only by 25%, indicating that cell shrinking per se did not cause the juxtanuclear translocation of LDs during infection. Shown are box plots with horizontal lines indicating median (black) and mean (blue) values. Outliers outside 5th and 95th percentile are represented by dots. For measurements of the distance between LDs and the nucleus n=437 and 316 LDs for mock and PV-infected cells, respectively. For cell area measurements n=32 and 36 cells for mock and PV-infected cells, respectively. ****p<0.0001 (Mann-Whitney test). (C) Recruitment of LDs to the RCs during PV infection is specific. PV-infected HeLa cells were fixed at 6hpi. RCs were labeled with anti-3A antibodies (red), mitochondria were labeled with anti-TOM20 antibodies (cyan) and LDs were labeled with Bodipy493/503 (green). Most of the LDs are intercalated into the RCs, whereas most of the mitochondria remain in the cell periphery and are not incorporated into the RCs. Scale bar 10 μm.
Figure S2TEM analysis of the membrane contacts between the ER, the LDs and the RCs during PV infection, related to Figure 2. (A) Low magnification micrograph of PV-infected HeLa cell at 6hpi. (B) High magnification shows two LDs that form close membrane contacts with multiple RCs. (C) Long ER tubules are connected to LDs that are simultaneously in close membrane contact with the RCs. Line segments mark LD surface that is within a distance of 30nm from the RCs and is engaged in LD-RC membrane contact sites. Scale bars: (A) 5 μm, (B) 100nm (C) 250nm. (D,E) Properties of membrane contact sites between LDs and RCs at 6hpi. The number of RCs engaged in LD-RC membrane contact sites per LD (D) and the percentage of LD perimeter involved in LD-RC membrane contact sites (E) was quantified. Box plots with horizontal lines indicating median (black) and mean (blue) values are shown (n=117 LDs in 14 randomly chosen cells). Outliers outside 5th and 95th percentile are represented by dots.
Figure S3Targeting of 2BC, 2B and 2C to LDs is conserved among enteroviruses, related to Figure 3. (A) Ectopically expressed non-tagged PV 2BC is targeted to LDs. HeLa cells expressing non-tagged PV 2BC were fixed and immunostained with anti-2C antibodies (green). LDs were labeled with Bodipy493/503 (red). (B) Ectopically expressed PV 2BC targets LDs and causes their clustering in Huh7 cells. Huh7 cells expressing PV 2BC-Strep were fixed and immunostained with anti-Strep antibodies (green). LDs were labeled with Bodipy493/503 (red). (C) Ectopically expressed PV 3CD, 3C and 3D proteins do not localize to LDs. (D) Ectopically expressed PV precursor (P1, VP0) and mature (VP1-VP4) capsid proteins do not localize to LDs. (E) Ectopically expressed PV 2B is a dual targeting protein localized to both the Golgi and the LDs. Cells were co-immunostained with anti-Strep (green) and anti-grasp65 antibodies (Golgi marker, red). LDs were labeled with Bodipy493/503 (magenta). Arrows mark the localization of 2B-Strep to the Golgi and arrowheads mark its localization to the LDs. (F) Ectopically expressed coxsackievirus B3 (CVB3) 2BC is targeted to LDs and causes their clustering. HeLa cells expressing CVB3 2BC-Strep were fixed and immunostained with anti-Strep antibodies (green). LDs were labeled with Bodipy493/503 (red). (G) Ectopically expressed CVB3 2C is localized to LDs. (H) Ectopically expressed CVB3 2B is a dual targeting protein localized to both the Golgi and the LDs. HeLa cells expressing CVB3 2B-Strep were fixed and co-immunostained with anti-Strep (green) and anti-grasp65 antibodies (Golgi marker, red). LDs were labeled with Bodipy493/503 (magenta). Arrows mark localization of 2B-Strep to the Golgi and arrowheads mark its localization to LDs. Scale bars 10 μm, zoom 5 μm.
Figure S4Lipolysis but not lipophagy is essential for the biogenesis of the RCs and enterovirus replication, related to Figure 5. (A) Treatment with Bafilomycin A1 induces the accumulation of p62-positive autophagosomes in both mock and PV-infected cells. Mock or PV-infected HeLa cells were incubated with DMSO or 0.2μM Bafilomycin A1 at 1hpi. At 6hpi cells were fixed and co-immunostained with anti-p62 (autophagosomal marker, red) and anti-PV capsid antibodies (marker for PV infection, green). Accumulation of p62-positive structures indicates the blocking of autophagosome-lysosome fusion due to Bafilomycin A1 treatment. Scale bar 10 μm. (B) Inhibition of ATGL causes a kinetic delay in the biogenesis of PV RCs in HeLa cells. PV-infected HeLa cells were treated with DMSO or 100 ?M atglistatin (ATGL inhibitor) at 1hpi. Cells were fixed at the indicated times and co-labeled with anti-3A antibodies (RCs, red) and Hoechst 33342 (nuclei, blue). Maximum intensity projections are shown. Scale bar 10 μm. (C) The expression levels of 3A protein are similar between DMSO and atglistatin-treated cells infected with PV. (D) Inhibition of HSL disrupts the formation of PV RCs at 8hpi. Mock or PV-infected HeLa cells were incubated at 1hpi with DMSO or 100 μM CAY10499. At 8hpi cells were fixed and labeled for the RCs (anti-3A antibodies, red) and LDs (anti-TIP47 antibodies (cyan) and Bodipy493/503 (green)). Scale bar 10 μm. (E) Inhibition of ATGL disrupts PV replication in different cell-lines. PV-infected HeLa, Huh7 and Caco2 cells (moi 10) were incubated with DMSO or 100 μM atglistatin at 1hpi. Cells and supernatants were collected at the indicated times and the total number of infectious particles was determined by plaque assays. Virus titer values represent mean ± standard deviation for 2 independent experiments with 3 biological replicates each. (F,G) Inhibition of HSL disrupts coxsackievirus B3 (CVB3) and enterovirus 71 (EV71) replication. CVB3-infected HeLa cells (moi 10) (F) and EV71-infected RD cells (moi 1) (G) were treated with DMSO or 100 μM CAY10499 (CVB3) or 20 μM CAY10499 (EV71) at 1hpi. Cells and supernatants were collected at 8hpi and the total number of infectious particles was determined by TCID50 assay. Virus titer values are normalized to infected cells treated with DMSO and represent mean ± standard deviation for 2 independent experiments with 3 biological replicates each. (E-G) *p<0.05,**p<0.005 (Mann-Whitney test).
Figure S5Metabolism of fluorescent FA imported from the media in PV-infected Huh7 cells, related to Figure 6. (A) Inhibition of DGAT1 abolishes synthesis of TGs from imported FAs in mock and PV-infected Huh7 cells. Mock or PV-infected Huh7 cells (moi 10) were treated with DMSO or 20 μM of DGAT1 inhibitor, PF-04620110 at 1hpi. At 5½ hpi cells were pulse labeled with 1 μM Green FA for 30min. At 6hpi, cells were extensively washed and total lipids extracted and resolved by TLC under optimal conditions for neutral lipids. Fluorescent lipids containing Green FA are shown. (B) Inhibition of HSL abolishes synthesis of PC from imported FA in PV-infected Huh7 cells. Mock or PV-infected Huh7 cells (moi 10) were incubated with DMSO or 100 μM CAY10499 at 1hpi. At 5½ hpi cells were pulse labeled with 1 μM Green FA for 30min. At 6hpi, cells were extensively washed and total lipids were extracted. Lipid extracts were resolved on two separate TLC plates under optimal conditions for polar lipids (upper panel) or neutral lipids (lower panel) as described in STAR Methods. Fluorescent lipids containing Green FA are shown. *DAG putative diacylglycerol (see STAR Methods), FA fatty acid, PC phosphatidylcholine, TG triglyceride.
Figure S6Treatment with GnHCl at 4hpi inhibits the formation of membrane contact sites between LDs and RCs, related to Figure 7 and Table S1. (A) GnHCl treatment at 4hpi does not affect viral proteins expression. PV-infected cells were incubated with or without 2mM GnHCl at 1 hpi or 4hpi. Cells were collected at 6hpi and total cell lysates were prepared and analyzed by immunoblotting analysis using the indicated antibodies. Treatment with GnHCl at 1hpi completely blocked viral proteins expression, whereas treatment with GnHCl at 4hpi did not substantially affect viral proteins expression. (B-F) Representative EM images of PV-infected HeLa cells treated with GnHCl at 4hpi and fixed at 6hpi. (B) Low magnification transmission electron micrograph. RCs are marked by magenta hatched line and occupy only a small portion of the cytosol. LDs are spread throughout the cell. (C-F) Higher magnifications of (B) show that LDs are distant from the RCs and no membrane contact sites (i.e. a distance within 30nm) were detected between the two organelles. (E) LDs are in close contact with an ER tubule and mitochondria. No RCs are detected in this region of the cell. (F) Higher magnification of the RCs shown in (D). No LDs are detected in this region of the cell. Scale bars: (B) 1 μm (C-F) 500nm.
Figure S7Treatment with GnHCl does not affect the LD-targeting of PV 2C-Strep, related to Figure 7. HeLa cells were transfected with PV 2C-Strep and incubated with or without 2mM GnHCl. Cells were immunostained with anti-Strep antibodies (green). LDs were labeled with Bodipy493/503 (red). Scale bar 10 μm, zoom 5 μm.
Movie S1 PV infection induces the translocation of LDs from the cell periphery to the juxtanuclear region and their intercalation into the RCs, related to Figure 1. HeLa cells stably expressing RFP-Arf1 were infected with PV at moi 10. At 3hpi cells were stained with Bodipy493/503 (green) for 5 minutes, washed and immediately imaged. Time-lapse confocal images were taken every 7 and half minutes for a total of 7 hrs.
Highlights:
Poliovirus replication organelles form membrane contact sites with lipid droplets
Contact sites enable transfer of essential lipids to the forming viral organelles
Viral proteins mediate contact sites and interact with the host lipolysis machinery
Inhibition of lipolysis or contact site formation disrupts enterovirus replication
Acknowledgments
We thank Drs. Judith Frydman, Michel Tassetto, Tzachi Hagai, and Mariana Tioni for critical discussions of the manuscript. We also thank Dr. Nevan Krogan for generously sharing DNA constructs, Dr. George Lemieux for excellent guidance on lipid analysis and Dr. Kurt Thorn, Delaine Larsen and Kari Herrington from the Nikon imaging center at UCSF for excellent technical assistance. We thank Ruth Yamawaki from the Cell Science Imaging Facility at Stanford University and Danielle Jorgens and Reena Zalpuri from the Electron Microscope Lab in Berkeley University for excellent technical assistance. This work was supported by NIH (R01 AI40085, P01 AI091575) and DoD-DARPA INTERCEPT to R.A. and by ARRA Award Number 1S10RR026780-01 from the National Center for Research Resources to CSIF.
Footnotes
Publisher's Disclaimer: This is a PDF file of an unedited manuscript that has been accepted for publication. As a service to our customers we are providing this early version of the manuscript. The manuscript will undergo copyediting, typesetting, and review of the resulting proof before it is published in its final form. Please note that during the production process errors may be discovered which could affect the content, and all legal disclaimers that apply to the journal pertain.
Declaration of Interests
The authors declare no competing interests.
Reference List
- Amarilio R, Ramachandran S, Sabanay H, and Lev S (2005). Differential regulation of endoplasmic reticulum structure through VAP-Nir protein interaction. J. Biol. Chem 280, 5934–5944. [DOI] [PubMed] [Google Scholar]
- Barton DJ, and Flanegan JB (1997). Synchronous replication of poliovirus RNA: initiation of negative-strand RNA synthesis requires the guanidine-inhibited activity of protein 2C. J. Virol 71, 8482–8489. [DOI] [PMC free article] [PubMed] [Google Scholar]
- Belov GA, Altan-Bonnet N, Kovtunovych G, Jackson CL, Lippincott-Schwartz J, and Ehrenfeld E (2007). Hijacking components of the cellular secretory pathway for replication of poliovirus RNA. J. Virol 81, 558–567. [DOI] [PMC free article] [PubMed] [Google Scholar]
- Carson SD, Kim KS, Pirruccello SJ, Tracy S, and Chapman NM (2007). Endogenous low-level expression of the coxsackievirus and adenovirus receptor enables coxsackievirus B3 infection of RD cells. J. Gen. Virol 88, 3031–3038. [DOI] [PubMed] [Google Scholar]
- Cho MW, Teterina N, Egger D, Bienz K, and Ehrenfeld E (1994). Membrane rearrangement and vesicle induction by recombinant poliovirus 2C and 2BC in human cells. Virology 202, 129–145. [DOI] [PubMed] [Google Scholar]
- Crotty S, Saleh MC, Gitlin L, Beske O, and Andino R (2004). The poliovirus replication machinery can escape inhibition by an antiviral drug that targets a host cell protein. J. Virol 78, 3378–3386. [DOI] [PMC free article] [PubMed] [Google Scholar]
- Dales S, Eggers HJ, Tamm I, and Palade GE (1965). Electron Microscopic Study of the Formation of Poliovirus. Virology 26, 379–389. [DOI] [PubMed] [Google Scholar]
- de Jong AS, Wessels E, Dijkman HB, Galama JM, Melchers WJ, Willems PH, and van Kuppeveld FJ (2003). Determinants for membrane association and permeabilization of the coxsackievirus 2B protein and the identification of the Golgi complex as the target organelle. J. Biol. Chem 278, 1012–1021. [DOI] [PubMed] [Google Scholar]
- Doedens JR, Giddings TH, and Kirkegaard K (1997). Inhibition of endoplasmic reticulumto-Golgi traffic by poliovirus protein 3A: genetic and ultrastructural analysis. J. Virol 71, 9054–9064. [DOI] [PMC free article] [PubMed] [Google Scholar]
- Egger D, Pasamontes L, Bolten R, Boyko V, and Bienz K (1996). Reversible dissociation of the poliovirus replication complex: functions and interactions of its components in viral RNA synthesis. J. Virol 70, 8675–8683. [DOI] [PMC free article] [PubMed] [Google Scholar]
- Guan H, Tian J, Qin B, Wojdyla JA, Wang B, Zhao Z, Wang M, and Cui S (2017). Crystal structure of 2C helicase from enterovirus 71. Sci. Adv 3, e1602573. [DOI] [PMC free article] [PubMed] [Google Scholar]
- Heaton NS, and Randall G (2010). Dengue virus-induced autophagy regulates lipid metabolism. Cell. Host Microbe 8, 422–432. [DOI] [PMC free article] [PubMed] [Google Scholar]
- Herold J, and Andino R (2000). Poliovirus requires a precise 5’ end for efficient positive-strand RNA synthesis. J. Virol 74, 6394–6400. [DOI] [PMC free article] [PubMed] [Google Scholar]
- Hsu NY, Ilnytska O, Belov G, Santiana M, Chen YH, Takvorian PM, Pau C, van der Schaar H, Kaushik-Basu N, Balla T, et al. (2010). Viral reorganization of the secretory pathway generates distinct organelles for RNA replication. Cell 141, 799–811. [DOI] [PMC free article] [PubMed] [Google Scholar]
- Ilnytska O, Santiana M, Hsu NY, Du WL, Chen YH, Viktorova EG, Belov G, Brinker A, Storch J, Moore C, Dixon JL, and Altan-Bonnet N (2013). Enteroviruses harness the cellular endocytic machinery to remodel the host cell cholesterol landscape for effective viral replication. Cell. Host Microbe 14, 281–293. [DOI] [PMC free article] [PubMed] [Google Scholar]
- Kory N, Farese RV, and Walther TC (2016). Targeting Fat: Mechanisms of Protein Localization to Lipid Droplets. Trends Cell Biol. 26, 535–546. [DOI] [PMC free article] [PubMed] [Google Scholar]
- Lindenbach BD (2009). Measuring HCV infectivity produced in cell culture and in vivo. Methods Mol. Biol 510, 329–336. [DOI] [PubMed] [Google Scholar]
- Lu X, Yang X, and Liu J (2010). Differential control of ATGL-mediated lipid droplet degradation by CGI-58 and G0S2. Cell. Cycle 9, 2719–2725. [DOI] [PMC free article] [PubMed] [Google Scholar]
- Miyanari Y, Atsuzawa K, Usuda N, Watashi K, Hishiki T, Zayas M, Bartenschlager R, Wakita T, Hijikata M, and Shimotohno K (2007). The lipid droplet is an important organelle for hepatitis C virus production. Nat. Cell Biol 9, 1089–1097. [DOI] [PubMed] [Google Scholar]
- Nchoutmboube JA, Viktorova EG, Scott AJ, Ford LA, Pei Z, Watkins PA, Ernst RK, and Belov GA (2013). Increased long chain acyl-Coa synthetase activity and fatty acid import is linked to membrane synthesis for development of picornavirus replication organelles. PLoS Pathog. 9, e1003401. [DOI] [PMC free article] [PubMed] [Google Scholar]
- Peretti D, Dahan N, Shimoni E, Hirschberg K, and Lev S (2008). Coordinated lipid transfer between the endoplasmic reticulum and the Golgi complex requires the VAP proteins and is essential for Golgi-mediated transport. Mol. Biol. Cell 19, 3871–3884. [DOI] [PMC free article] [PubMed] [Google Scholar]
- Pfister T, and Wimmer E (1999). Characterization of the nucleoside triphosphatase activity of poliovirus protein 2C reveals a mechanism by which guanidine inhibits poliovirus replication. J. Biol. Chem 274, 6992–7001. [DOI] [PubMed] [Google Scholar]
- Pincus SE, and Wimmer E (1986). Production of guanidine-resistant and -dependent poliovirus mutants from cloned cDNA: mutations in polypeptide 2C are directly responsible for altered guanidine sensitivity. J. Virol 60, 793–796. [DOI] [PMC free article] [PubMed] [Google Scholar]
- Prevost C, Sharp ME, Kory N, Lin Q, Voth GA, Farese RV, and Walther TC (2018). Mechanism and Determinants of Amphipathic Helix-Containing Protein Targeting to Lipid Droplets. Dev. Cell 44, 86.e4. [DOI] [PMC free article] [PubMed] [Google Scholar]
- Prinz WA (2014). Bridging the gap: membrane contact sites in signaling, metabolism, and organelle dynamics. J. Cell Biol 205, 759–769. [DOI] [PMC free article] [PubMed] [Google Scholar]
- Richards OC, and Ehrenfeld E (1990). Poliovirus RNA replication. Curr. Top. Microbiol. Immunol 161, 89–119. [DOI] [PubMed] [Google Scholar]
- Samsa MM, Mondotte JA, Iglesias NG, Assuncao-Miranda I, Barbosa-Lima G, Da Poian AT, Bozza PT, and Gamarnik AV (2009). Dengue virus capsid protein usurps lipid droplets for viral particle formation. PLoS Pathog. 5, e1000632. [DOI] [PMC free article] [PubMed] [Google Scholar]
- Singh R, Kaushik S, Wang Y, Xiang Y, Novak I, Komatsu M, Tanaka K, Cuervo AM, and Czaja MJ (2009). Autophagy regulates lipid metabolism. Nature 458, 1131–1135. [DOI] [PMC free article] [PubMed] [Google Scholar]
- Strating JR, van der Linden L, Albulescu L, Bigay J, Arita M, Delang L, Leyssen P, van der Schaar HM, Lanke KH, Thibaut HJ, et al. (2015). Itraconazole inhibits enterovirus replication by targeting the oxysterol-binding protein. Cell. Rep 10, 600–615. [DOI] [PMC free article] [PubMed] [Google Scholar]
- Teterina NL, Gorbalenya AE, Egger D, Bienz K, and Ehrenfeld E (1997). Poliovirus 2C protein determinants of membrane binding and rearrangements in mammalian cells. J. Virol 71, 8962–8972. [DOI] [PMC free article] [PubMed] [Google Scholar]
- Teterina NL, Gorbalenya AE, Egger D, Bienz K, Rinaudo MS, and Ehrenfeld E (2006). Testing the modularity of the N-terminal amphipathic helix conserved in picornavirus 2C proteins and hepatitis C NS5A protein. Virology 344, 453–467. [DOI] [PMC free article] [PubMed] [Google Scholar]
- Tolskaya EA, Romanova LI, Kolesnikova MS, Gmyl AP, Gorbalenya AE, and Agol VI (1994). Genetic studies on the poliovirus 2C protein, an NTPase. A plausible mechanism of guanidine effect on the 2C function and evidence for the importance of 2C oligomerization. J. Mol. Biol 236, 1310–1323. [DOI] [PubMed] [Google Scholar]
- van Kuppeveld FJ, Galama JM, Zoll J, van den Hurk PJ, and Melchers WJ (1996). Coxsackie B3 virus protein 2B contains cationic amphipathic helix that is required for viral RNA replication. J. Virol 70, 3876–3886. [DOI] [PMC free article] [PubMed] [Google Scholar]
- Walther TC, and Farese RV (2012). Lipid droplets and cellular lipid metabolism. Annu. Rev. Biochem 81, 687–714. [DOI] [PMC free article] [PubMed] [Google Scholar]
- Yeh MT, Wang SW, Yu CK, Lin KH, Lei HY, Su IJ, and Wang JR (2011). A single nucleotide in stem loop II of 5’-untranslated region contributes to virulence of enterovirus 71 in mice. PLoS One 6, e27082. [DOI] [PMC free article] [PubMed] [Google Scholar]
- Yen CL, Stone SJ, Koliwad S, Harris C, and Farese RV (2008). Thematic review series: glycerolipids. DGAT enzymes and triacylglycerol biosynthesis. J. Lipid Res 49, 2283–2301. [DOI] [PMC free article] [PubMed] [Google Scholar]
- Yin J, Liu Y, Wimmer E, and Paul AV (2007). Complete protein linkage map between the P2 and P3 non-structural proteins of poliovirus. J. Gen. Virol 88, 2259–2267. [DOI] [PubMed] [Google Scholar]
- Zechner R, Madeo F, and Kratky D (2017). Cytosolic lipolysis and lipophagy: two sides of the same coin. Nat. Rev. Mol. Cell Biol 18, 671–684. [DOI] [PubMed] [Google Scholar]
- Zechner R, Zimmermann R, Eichmann TO, Kohlwein SD, Haemmerle G, Lass A, and Madeo F (2012). FAT SIGNALS--lipases and lipolysis in lipid metabolism and signaling. Cell. Metab 15, 279–291. [DOI] [PMC free article] [PubMed] [Google Scholar]
Associated Data
This section collects any data citations, data availability statements, or supplementary materials included in this article.
Supplementary Materials
Figure S1Effects of PV infection on the distribution and morphology of LDs, related to Figure 1. (A) The protein levels of TIP47 remain constant during PV infection. Western blot analysis at the indicated times post infection. 2C serves as a marker for PV infection and GAPDH serves as a loading control. (B) Quantification of the distance between LDs and the nucleus (left panel) and the cell area (right panel) in mock and PV-infected cells at 6hpi. The mean distance between LDs and the nucleus decreased by 65% whereas the mean cell area decreased only by 25%, indicating that cell shrinking per se did not cause the juxtanuclear translocation of LDs during infection. Shown are box plots with horizontal lines indicating median (black) and mean (blue) values. Outliers outside 5th and 95th percentile are represented by dots. For measurements of the distance between LDs and the nucleus n=437 and 316 LDs for mock and PV-infected cells, respectively. For cell area measurements n=32 and 36 cells for mock and PV-infected cells, respectively. ****p<0.0001 (Mann-Whitney test). (C) Recruitment of LDs to the RCs during PV infection is specific. PV-infected HeLa cells were fixed at 6hpi. RCs were labeled with anti-3A antibodies (red), mitochondria were labeled with anti-TOM20 antibodies (cyan) and LDs were labeled with Bodipy493/503 (green). Most of the LDs are intercalated into the RCs, whereas most of the mitochondria remain in the cell periphery and are not incorporated into the RCs. Scale bar 10 μm.
Figure S2TEM analysis of the membrane contacts between the ER, the LDs and the RCs during PV infection, related to Figure 2. (A) Low magnification micrograph of PV-infected HeLa cell at 6hpi. (B) High magnification shows two LDs that form close membrane contacts with multiple RCs. (C) Long ER tubules are connected to LDs that are simultaneously in close membrane contact with the RCs. Line segments mark LD surface that is within a distance of 30nm from the RCs and is engaged in LD-RC membrane contact sites. Scale bars: (A) 5 μm, (B) 100nm (C) 250nm. (D,E) Properties of membrane contact sites between LDs and RCs at 6hpi. The number of RCs engaged in LD-RC membrane contact sites per LD (D) and the percentage of LD perimeter involved in LD-RC membrane contact sites (E) was quantified. Box plots with horizontal lines indicating median (black) and mean (blue) values are shown (n=117 LDs in 14 randomly chosen cells). Outliers outside 5th and 95th percentile are represented by dots.
Figure S3Targeting of 2BC, 2B and 2C to LDs is conserved among enteroviruses, related to Figure 3. (A) Ectopically expressed non-tagged PV 2BC is targeted to LDs. HeLa cells expressing non-tagged PV 2BC were fixed and immunostained with anti-2C antibodies (green). LDs were labeled with Bodipy493/503 (red). (B) Ectopically expressed PV 2BC targets LDs and causes their clustering in Huh7 cells. Huh7 cells expressing PV 2BC-Strep were fixed and immunostained with anti-Strep antibodies (green). LDs were labeled with Bodipy493/503 (red). (C) Ectopically expressed PV 3CD, 3C and 3D proteins do not localize to LDs. (D) Ectopically expressed PV precursor (P1, VP0) and mature (VP1-VP4) capsid proteins do not localize to LDs. (E) Ectopically expressed PV 2B is a dual targeting protein localized to both the Golgi and the LDs. Cells were co-immunostained with anti-Strep (green) and anti-grasp65 antibodies (Golgi marker, red). LDs were labeled with Bodipy493/503 (magenta). Arrows mark the localization of 2B-Strep to the Golgi and arrowheads mark its localization to the LDs. (F) Ectopically expressed coxsackievirus B3 (CVB3) 2BC is targeted to LDs and causes their clustering. HeLa cells expressing CVB3 2BC-Strep were fixed and immunostained with anti-Strep antibodies (green). LDs were labeled with Bodipy493/503 (red). (G) Ectopically expressed CVB3 2C is localized to LDs. (H) Ectopically expressed CVB3 2B is a dual targeting protein localized to both the Golgi and the LDs. HeLa cells expressing CVB3 2B-Strep were fixed and co-immunostained with anti-Strep (green) and anti-grasp65 antibodies (Golgi marker, red). LDs were labeled with Bodipy493/503 (magenta). Arrows mark localization of 2B-Strep to the Golgi and arrowheads mark its localization to LDs. Scale bars 10 μm, zoom 5 μm.
Figure S4Lipolysis but not lipophagy is essential for the biogenesis of the RCs and enterovirus replication, related to Figure 5. (A) Treatment with Bafilomycin A1 induces the accumulation of p62-positive autophagosomes in both mock and PV-infected cells. Mock or PV-infected HeLa cells were incubated with DMSO or 0.2μM Bafilomycin A1 at 1hpi. At 6hpi cells were fixed and co-immunostained with anti-p62 (autophagosomal marker, red) and anti-PV capsid antibodies (marker for PV infection, green). Accumulation of p62-positive structures indicates the blocking of autophagosome-lysosome fusion due to Bafilomycin A1 treatment. Scale bar 10 μm. (B) Inhibition of ATGL causes a kinetic delay in the biogenesis of PV RCs in HeLa cells. PV-infected HeLa cells were treated with DMSO or 100 ?M atglistatin (ATGL inhibitor) at 1hpi. Cells were fixed at the indicated times and co-labeled with anti-3A antibodies (RCs, red) and Hoechst 33342 (nuclei, blue). Maximum intensity projections are shown. Scale bar 10 μm. (C) The expression levels of 3A protein are similar between DMSO and atglistatin-treated cells infected with PV. (D) Inhibition of HSL disrupts the formation of PV RCs at 8hpi. Mock or PV-infected HeLa cells were incubated at 1hpi with DMSO or 100 μM CAY10499. At 8hpi cells were fixed and labeled for the RCs (anti-3A antibodies, red) and LDs (anti-TIP47 antibodies (cyan) and Bodipy493/503 (green)). Scale bar 10 μm. (E) Inhibition of ATGL disrupts PV replication in different cell-lines. PV-infected HeLa, Huh7 and Caco2 cells (moi 10) were incubated with DMSO or 100 μM atglistatin at 1hpi. Cells and supernatants were collected at the indicated times and the total number of infectious particles was determined by plaque assays. Virus titer values represent mean ± standard deviation for 2 independent experiments with 3 biological replicates each. (F,G) Inhibition of HSL disrupts coxsackievirus B3 (CVB3) and enterovirus 71 (EV71) replication. CVB3-infected HeLa cells (moi 10) (F) and EV71-infected RD cells (moi 1) (G) were treated with DMSO or 100 μM CAY10499 (CVB3) or 20 μM CAY10499 (EV71) at 1hpi. Cells and supernatants were collected at 8hpi and the total number of infectious particles was determined by TCID50 assay. Virus titer values are normalized to infected cells treated with DMSO and represent mean ± standard deviation for 2 independent experiments with 3 biological replicates each. (E-G) *p<0.05,**p<0.005 (Mann-Whitney test).
Figure S5Metabolism of fluorescent FA imported from the media in PV-infected Huh7 cells, related to Figure 6. (A) Inhibition of DGAT1 abolishes synthesis of TGs from imported FAs in mock and PV-infected Huh7 cells. Mock or PV-infected Huh7 cells (moi 10) were treated with DMSO or 20 μM of DGAT1 inhibitor, PF-04620110 at 1hpi. At 5½ hpi cells were pulse labeled with 1 μM Green FA for 30min. At 6hpi, cells were extensively washed and total lipids extracted and resolved by TLC under optimal conditions for neutral lipids. Fluorescent lipids containing Green FA are shown. (B) Inhibition of HSL abolishes synthesis of PC from imported FA in PV-infected Huh7 cells. Mock or PV-infected Huh7 cells (moi 10) were incubated with DMSO or 100 μM CAY10499 at 1hpi. At 5½ hpi cells were pulse labeled with 1 μM Green FA for 30min. At 6hpi, cells were extensively washed and total lipids were extracted. Lipid extracts were resolved on two separate TLC plates under optimal conditions for polar lipids (upper panel) or neutral lipids (lower panel) as described in STAR Methods. Fluorescent lipids containing Green FA are shown. *DAG putative diacylglycerol (see STAR Methods), FA fatty acid, PC phosphatidylcholine, TG triglyceride.
Figure S6Treatment with GnHCl at 4hpi inhibits the formation of membrane contact sites between LDs and RCs, related to Figure 7 and Table S1. (A) GnHCl treatment at 4hpi does not affect viral proteins expression. PV-infected cells were incubated with or without 2mM GnHCl at 1 hpi or 4hpi. Cells were collected at 6hpi and total cell lysates were prepared and analyzed by immunoblotting analysis using the indicated antibodies. Treatment with GnHCl at 1hpi completely blocked viral proteins expression, whereas treatment with GnHCl at 4hpi did not substantially affect viral proteins expression. (B-F) Representative EM images of PV-infected HeLa cells treated with GnHCl at 4hpi and fixed at 6hpi. (B) Low magnification transmission electron micrograph. RCs are marked by magenta hatched line and occupy only a small portion of the cytosol. LDs are spread throughout the cell. (C-F) Higher magnifications of (B) show that LDs are distant from the RCs and no membrane contact sites (i.e. a distance within 30nm) were detected between the two organelles. (E) LDs are in close contact with an ER tubule and mitochondria. No RCs are detected in this region of the cell. (F) Higher magnification of the RCs shown in (D). No LDs are detected in this region of the cell. Scale bars: (B) 1 μm (C-F) 500nm.
Figure S7Treatment with GnHCl does not affect the LD-targeting of PV 2C-Strep, related to Figure 7. HeLa cells were transfected with PV 2C-Strep and incubated with or without 2mM GnHCl. Cells were immunostained with anti-Strep antibodies (green). LDs were labeled with Bodipy493/503 (red). Scale bar 10 μm, zoom 5 μm.
Movie S1 PV infection induces the translocation of LDs from the cell periphery to the juxtanuclear region and their intercalation into the RCs, related to Figure 1. HeLa cells stably expressing RFP-Arf1 were infected with PV at moi 10. At 3hpi cells were stained with Bodipy493/503 (green) for 5 minutes, washed and immediately imaged. Time-lapse confocal images were taken every 7 and half minutes for a total of 7 hrs.