Abstract
The structure and function of the right side of the heart is influenced by a wide range of physiological and pathological conditions. Quantification of right heart parameters is important in a variety of clinical scenarios including diagnosis, prognostication, and monitoring response to therapy. Although echocardiography remains the first-line imaging investigation for right heart assessment, published guidance is relatively sparse in comparison to that for the left ventricle. This guideline document from the British Society of Echocardiography describes the principles and practical aspects of right heart assessment by echocardiography, including quantification of chamber dimensions and function, as well as assessment of valvular function. While cut-off values for normality are included, a disease-oriented approach is advocated due to the considerable heterogeneity of structural and functional changes seen across the spectrum of diseases affecting the right heart. The complex anatomy of the right ventricle requires special considerations and echocardiographic techniques, which are set out in this document. The clinical relevance of right ventricular diastolic function is introduced, with practical guidance for its assessment. Finally, the relatively novel techniques of three-dimensional right ventricular echocardiography and right ventricular speckle tracking imaging are described. Despite these techniques holding considerable promise, issues relating to reproducibility and inter-vendor variation have limited their clinical utility to date.
Keywords: right heart, echocardiography, guideline
Introduction
A comprehensive evaluation of the right ventricle (RV) by echocardiography is essential for the diagnosis and management of conditions affecting the right heart. Indices of right ventricular size and function are prognostic in a range of congenital and acquired diseases of both left and right heart aetiologies (1, 2, 3, 4). The British Society of Echocardiography (BSE) Education Committee has previously published a minimum dataset for a standard adult transthoracic echocardiogram (5). The present document specifically aims to review, supplement and expand on the echocardiographic assessment of right heart size and function. The variable behaviours and limitations of these parameters across the spectrum of right heart diseases give rise to a range of sensitivities and specificities for discriminating between health and disease. Consequently, there is the potential to generate contradictory and discrepant echocardiography data, and it is therefore important to undertake a detailed assessment of the right heart while taking into account the underlying pathology. This document provides a practical guide to assist with the appropriate application of echocardiography to RV pathology, with the ultimate aim of a more robust assessment of the right heart by cardiac ultrasound.
This protocol has adopted normal reference intervals for cardiac dimensions based on the results of the Normal Reference Ranges for Echocardiography (NORRE) dataset (6). These prospectively obtained data provide a more contemporary basis for reference intervals than previously available. We have also included, for the first time in a BSE protocol, measurements suggested for RV diastolic function assessment. Although this is not current routine clinical practice, the sensitivity of the RV to even minor alterations in loading conditions makes the concept of RV diastolic function at least as physiologically relevant as that of the left ventricle (LV). Indeed, there is no single parameter of RV function by any imaging modality that is truly load independent. The purpose of this part of the document is to introduce the reader to this concept and to consider the influence of the loading conditions facing the right heart on its function, rather than to necessarily mandate a routine assessment across all echocardiography studies. Finally, in order to provide a comprehensive guide to right heart assessment, quantitative assessment of right-sided native valvular heart disease will also be summarised in this document.
Background
The position of the RV within the thorax, along with its complex structure and contraction pattern, all pose additional challenges to echocardiography. The RV is the most anteriorly positioned cardiac chamber, located immediately behind the sternum. It is thin-walled with prominent trabeculations and a complex geometry. Under normal loading conditions, the RV has a triangular shape when viewed from the side, and a crescentic shape in the sagittal plane, wrapping around the conical left ventricle. The orientation of RV myofibres and their arrangement into layers is responsible for the distinct contraction pattern of this chamber, with an outer layer of circumferential subepicardial fibres, and an inner layer of longitudinal subendocardial fibres (7). These layers of differently aligned cardiomyocytes are responsible for the peristaltic, or wave-like, RV contraction pattern, starting at the inflow portion and progressing towards the infundibulum and outflow tract (8). The longitudinal motion drawing the base towards the apex is accompanied by a bellows effect of inward motion of the free wall towards the interventricular septum, which bulges into the RV cavity (9).
Despite the challenges of assessing the RV by echocardiography, it remains the most widely utilised clinical imaging modality for its assessment. A uniform approach to both data acquisition and post-processing steps is essential for ensuring the reproducibility of any imaging technique, with susceptibility to variation arising at both stages. In echocardiography, different sonographers need to acquire and post-process serial echocardiography studies in a reproducible manner in order for meaningful comparisons to be made. The standardisation of RV image acquisition is especially pertinent to echocardiography compared with cross-sectional imaging modalities, as a range of potential two-dimensional echocardiography views of this complex three-dimensional shape can be obtained. For example, foreshortening the apical window is a particular pitfall that can lead to overestimation of RV chamber size. The RV-focused view should be used to generate all apically acquired RV size and function metrics, since it has superior reproducibility for these parameters compared with the standard apical 4-chamber window (10, 11, 12). The RV-focused view can be obtained by a three-step process:
Find the most apical 4-chamber echocardiography window, as per standard practice.
Move the transducer laterally to place the RV in the centre of the echocardiography image (instead of the conventional left heart-centred image) while ensuring that the LV outflow tract does not come into view, and that the LV apex remains central to the top of the image sector. In doing so, the entirety of the RV free wall should now be clearly visualised along with the maximal RV long axis dimension.
Rotate the transducer to obtain the maximum RV basal diameter (Figure 1).
Figure 1.
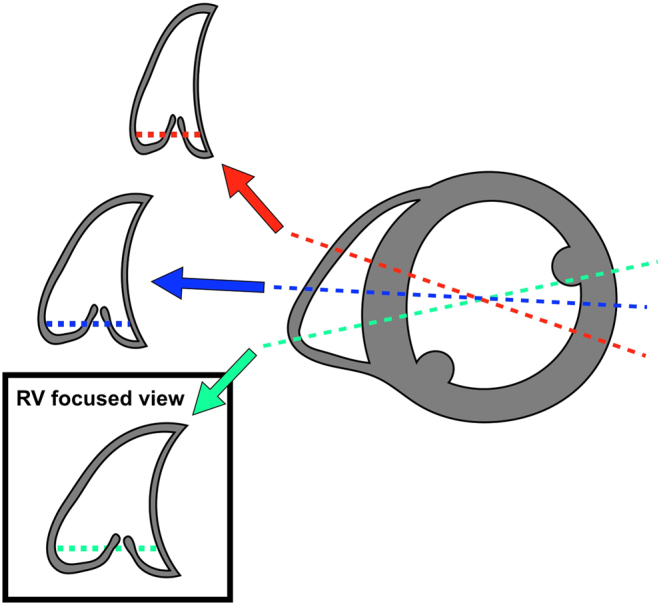
RV-focused apical window. Once in the apical 4-chamber view, rotating the transducer will allow the operator to obtain the maximal RV diameter (green line) while the internal LV diameter will remain relatively constant. The red line and the blue line show two variations of the standard apical 4-chamber view, optimised for the left ventricle, but failing to demonstrate maximal RV dimensions. Data from Rudski et al. (12).
Finally, although the emphasis of this document is on echocardiography of the right heart, this should not neglect a comprehensive assessment of the left heart. For example, the most common cause of pulmonary hypertension (PH), a condition which primarily affects the right heart, is disease originating from the left heart. Many conditions of the RV either share common pathology with the LV or originate from left heart disease and are readily and routinely assessed by echocardiography.
Right ventricular systolic function
The echocardiographic evaluation of RV systolic function can be performed qualitatively and quantitatively, by two- and three-dimensional methods, and by regional and global assessment. There are benefits and limitations that are inherent in all of these approaches, the significances of which should be considered relative to the pathology being investigated. Accordingly, these guidelines recommend a disease-oriented approach to RV functional assessment and recognise the specific limitations of different RV systolic functional metrics, factors which are integral to the interpretation and application of reference intervals.
The evidence-base underpinning these reference intervals for RV functional indices should also be considered. Tricuspid annular plane systolic excursion (TAPSE), pulsed Doppler S wave (S′) and fractional area change (FAC) have, by far, the most abundantly available reference data to support their use (11). Therefore, at least one of these three metrics should be routinely reported when assessing RV systolic function. Furthermore, either a measurement that incorporates radial RV function, such as FAC, or at least a qualitative statement regarding radial RV function should be routinely made, since TAPSE and S′ only reflect longitudinal RV function.
More contemporary techniques such as 3-dimensional (3D) and speckle tracking (STE) echocardiography offer novel insights into RV function assessment, but with the caveats of less validation data and standardization across vendor platforms. These limitations should not hinder their development and dissemination in both clinical and academic echocardiography, but should nevertheless be taken into account to ensure the standardization of data acquisition, post-processing and interpretation. Consequently, this document places emphasis on recommending how to perform these techniques systematically and homogeneously in order to allow their reproducible application for assessing RV systolic function.
Right ventricular diastolic function
In comparison with LV diastolic function, there is a lack of guidance for the assessment and quantification of RV diastolic function, and these measures do not typically form part of a standard clinical echocardiographic study. However, a large number of conditions have been shown to be associated with RV diastolic dysfunction, including congenital heart diseases, cardiomyopathies, left-sided valvular heart diseases, and systemic conditions such as diabetes, rheumatoid arthritis and various vasculitides. Table 1 gives examples from the published literature of the utility of RV diastolic function assessment in diagnosis, prognostication, and in monitoring therapeutic response, in a broad range of clinical conditions.
Table 1.
Clinical utility of RV diastolic function assessment.
| Author | Condition | Main findings |
|---|---|---|
| Fenster et al. (13) | Chronic obstructive pulmonary disease | TV E/A ratio, RV E′, post-bronchodilator FEV1/FVC, and use of oxygen during 6-minute walk test were independent predictors of exercise capacity. |
| Pagourelias et al. (14) | Hypertrophic cardiomyopathy | RV E/E′ >6.9 was an independent predictor of heart failure mortality and total cardiovascular mortality. |
| Gan et al. (15) | Pulmonary hypertension (PH) | RV IVRT was reduced by Sildenafil therapy. |
| Agha et al. (16) | Beta thalassaemia | Reduced RV E′/A′ ratio was a more sensitive indictor of iron overload than LV diastolic parameters. |
| Kosmala et al. (17) | Type-2 diabetes | Pre-clinical RV dysfunction was seen in asymptomatic diabetic patients (increased RV IVRT and decreased RV E′/A′) compared with controls. |
Right ventricular diastole commences with closure of the pulmonary valve. There then ensues a brief period of RV isovolumic relaxation, followed by opening of the tricuspid valve which allows RV filling. Analogous to LV filling, RV filling consists of an early passive phase, and a late active phase driven by right atrial contraction. When RV pressure increases above that of right atrial (RA) pressure, the tricuspid valve closes marking the end of RV diastole. Echocardiographic assessment of RV diastolic function involves four main components:
Two-dimensional morphological assessment of the right heart and inferior vena cava (IVC): Significant elevation of right-sided filling pressure is unlikely in the presence of normal RV and RA dimensions, normal IVC size and inspiratory collapse, and normal RV free wall thickness.
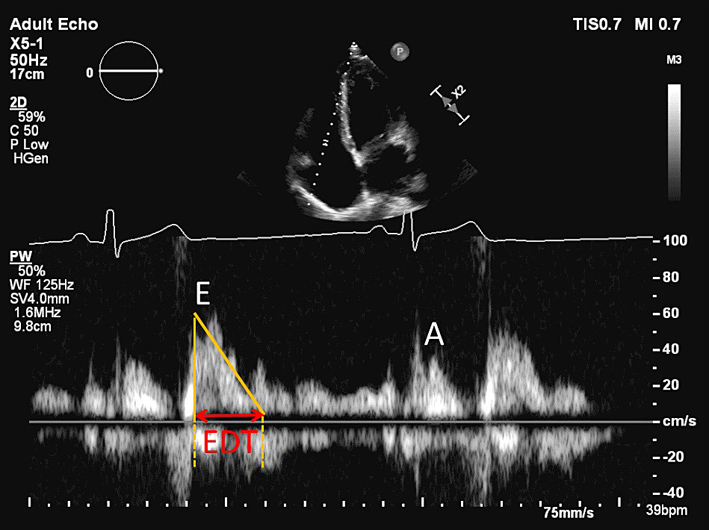
Doppler interrogation of tricuspid inflow: Early (E) and late (A) trans-tricuspid inflow velocities, E/A ratio, and E deceleration time are recorded using pulsed wave Doppler at the tricuspid leaflet tips. The imaging plane should be optimised to align the beam with tricuspid inflow. Trans-tricuspid flow is highly sensitive to preload and afterload, and also to respiratory phase. Therefore, averaging over 5 consecutive beats, or measurement in held expiration, is recommended. The utility of these measurements will be reduced by the presence of moderate or severe tricuspid regurgitation (TR), and in atrial fibrillation (absent A wave).
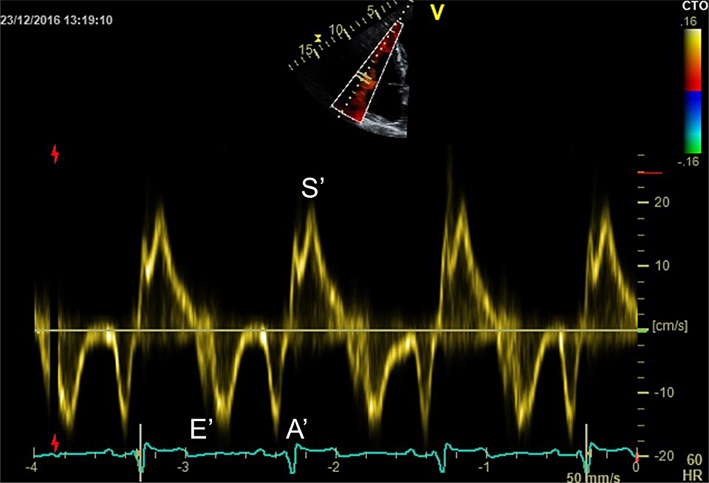
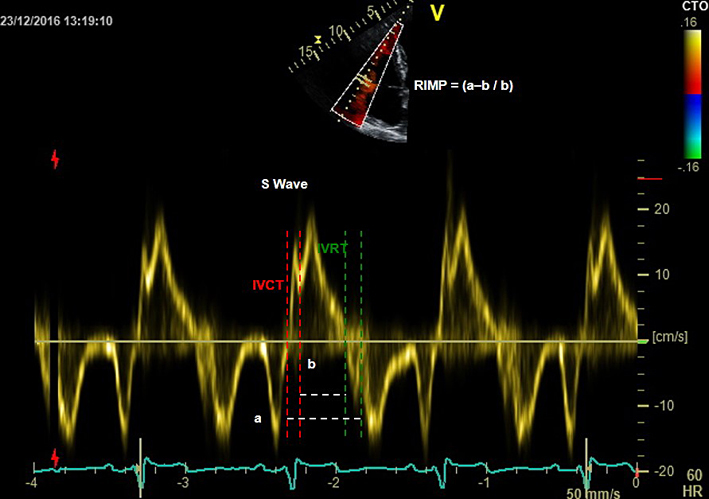
Tissue Doppler at the lateral tricuspid annulus: RV isovolumic relaxation time (IVRT), E′, A′, and E′/A′ should be measured. This also permits calculation of the RV E/E′ ratio, and the myocardial performance index (RIMP or Tei index) which is described in detail in Table 2. RV tissue Doppler indices are less load dependent than pulsed wave inflow measurements.
Pulsed wave (PW) Doppler sampling of hepatic vein flow: Hepatic vein flow assessment is analogous to the measurement of pulmonary vein flow during left heart diastolic function assessment. The PW Doppler beam is aligned with a hepatic vein from the subcostal window. There is significant respiratory variation in flow, with greater velocities seen during inspiration. Averaging should therefore be performed across 5 consecutive beats. The main components of the hepatic vein waveform are the systolic wave (S), systolic reversal wave (SR), diastolic wave (D), and atrial reversal wave (AR). Systolic flow (S) predominance is normally seen, as the IVC rapidly fills the empty RA during ventricular systole. A small SR wave may be seen in late systole but is usually indiscernible in the presence of normal right-sided filling pressures. A low velocity D wave follows, as the RA empties passively into the RV during ventricular diastole. A small AR wave is seen in late diastole as atrial contraction completes RV filling and a small amount of flow is reflected back towards the liver. Impaired right heart filling manifests as diastolic flow predominance (S/D reversal) and increased reversal wave velocities, particularly during inspiration, as detailed in Table 2.
Table 2.
Echocardiographic assessment of the right heart.
| View (modality) | Measurement | Explanatory notes | Image |
|---|---|---|---|
| PLAX (2D) | Qualitative regional wall motion analysis of the anterior wall of the RVOT. Visual assessment for RWMA; akinesia, dyskinesia or aneurysm. | 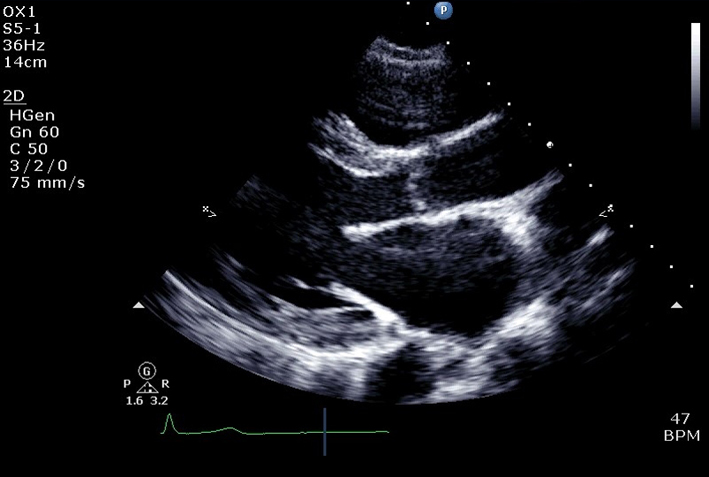 |
|
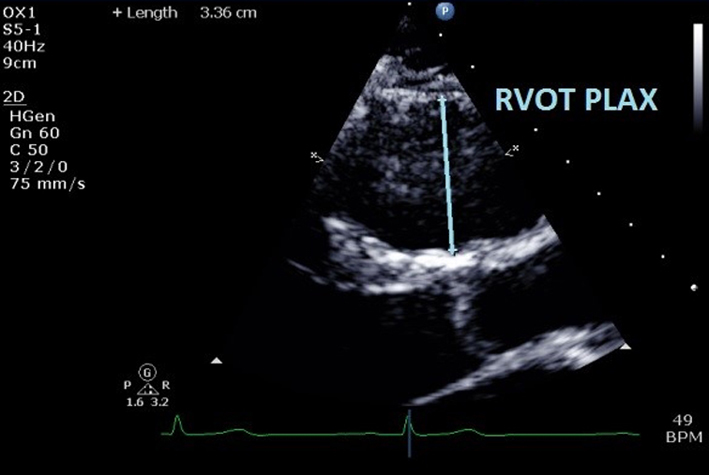
| RVOTPLAX | At end-diastole, at a similar level to PSAX RVOT1 measurement. Adjust depth and focal zone to visualise the RVOT. Ideally should form a perpendicular line from the RVOT wall to the junction between the interventricular septum and aortic valve. RVOTPLAX ≤43 mm (males) or ≤40 mm (females) is considered normal. RV RWMA + RVOTPLAX ≥32 mm, or ≥19 mm/m2 = major criterion for ARVC. RV RWMA + RVOTPLAX ≥29 mm to <32 mm, or ≥16 mm/m2 to <19 mm/m2 = minor criterion for ARVC. See BSE ARVC protocol (24). |
 |
|
| PLAX RV inflow (2D) | Qualitative regional wall motion analysis of the anterior and inferior walls of the RV. Ensure the ventricular septum has been excluded and the true inferior wall is seen (diaphragm and liver in view). | 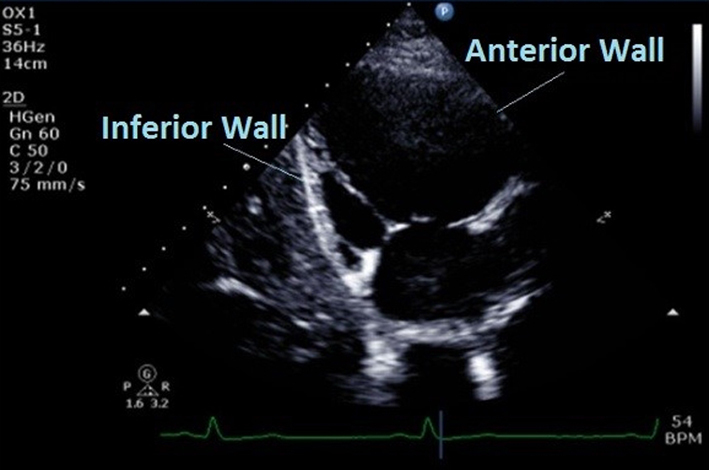 |
|
| PLAX RV inflow (CFM) | Assessment of TR severity (see A4C CFM for details). | 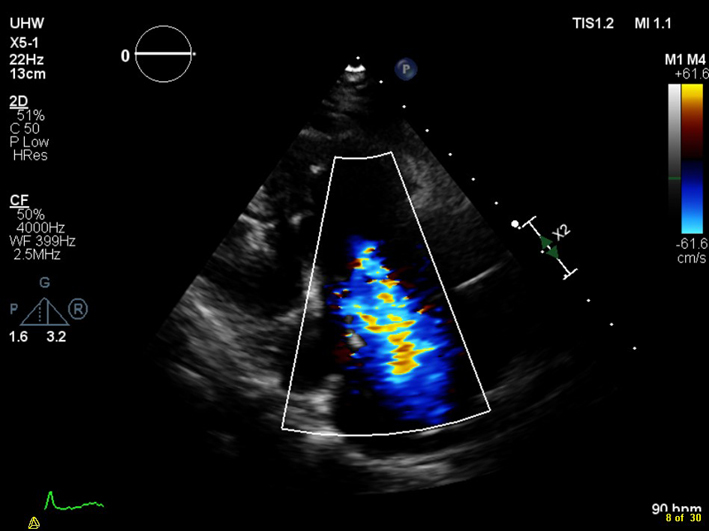 |
|
| PLAX RV inflow (CW) | TR Vmax | See A4C CW for details. | 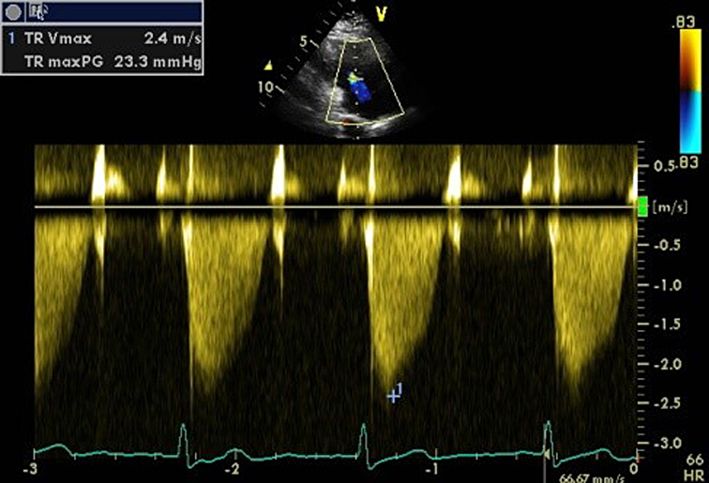 |
| PSAX Base (2D) | Qualitative assessment of RV structure and function at basal level. Regional wall motion analysis of inferior, lateral, and anterior walls of RV in PSAX at base (mitral valve) level. |
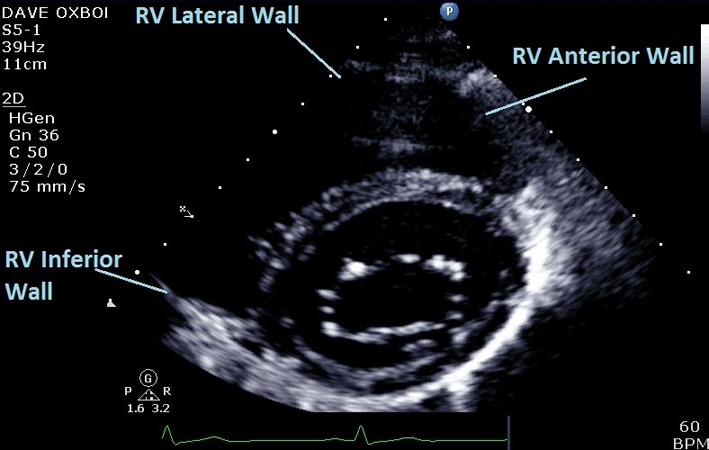 |
|
| PSAX Mid (2D) | Qualitative assessment of RV structure and function at LV papillary muscle level. Regional wall motion analysis of inferior, lateral, and anterior walls of RV in PSAX at mid (LV papillary muscle) level. |
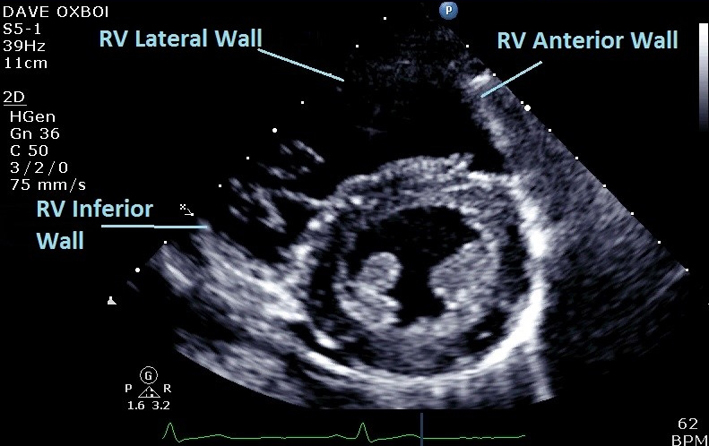 |
|
| Eccentricity index | Measure from PSAX view at mid LV level between papillary muscle and tips of mitral valve leaflets, at end-systole and end-diastole. RV volume overload causes eccentricity in diastole only. RV pressure overload causes eccentricity in systole also. Left ventricular eccentricity index (D2/D1) >1.1 is considered abnormal. See BSE Pulmonary Hypertension protocol for details (25). | 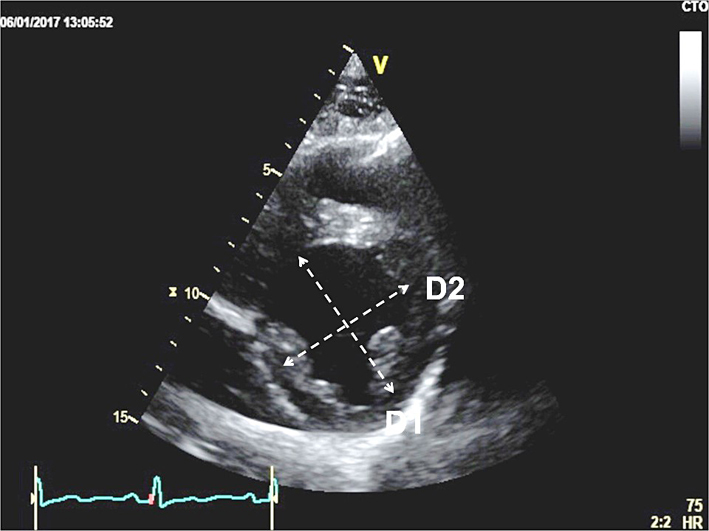 |
|
| PSAX Apex (2D) | Qualitative assessment of RV structure and function at the apex. Regional wall motion analysis of inferior and superior walls of RV in PSAX at apical level. |
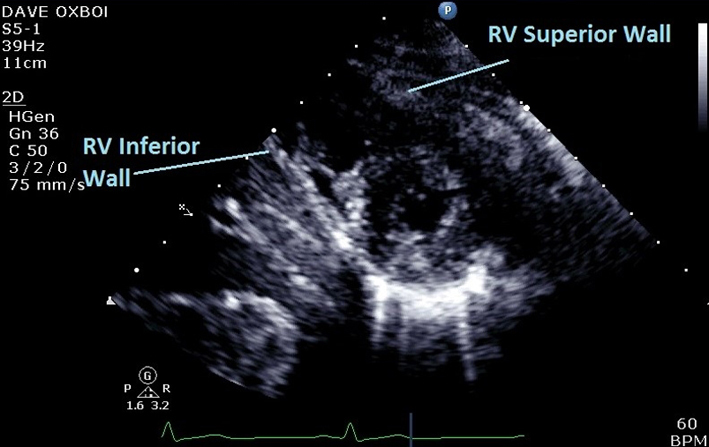 |
|
| PSAX RVOT (2D) | Qualitative assessment of RVOT structure and function. Regional wall motion analysis of the anterior wall of the RVOT. | 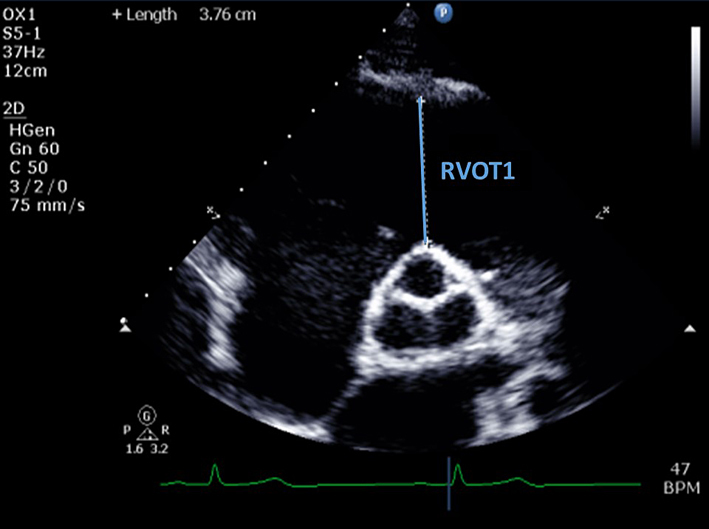 |
|
| RVOT1 (proximal RVOT) | End-diastolic. Anterior aortic wall directly up to the RVOT free wall (at the level of the aortic valve). The PSAX view is more reproducible than RVOT PLAX. RVOT1 ≤44 mm (males) or ≤42 mm (females) is considered normal (6). RV RWMA + RVOT1 ≥36 mm, or ≥21 mm/m2 = major criterion for ARVC. RV RWMA + RVOT1 ≥32 mm to <36 mm, or ≥18 mm/m2 to <21 mm/m2 = minor criterion for ARVC (24). |
||
| PSAX RVOT (2D) | Qualitative assessment of RVOT structure and function. Regional wall motion analysis of the infundibulum of the RV. | 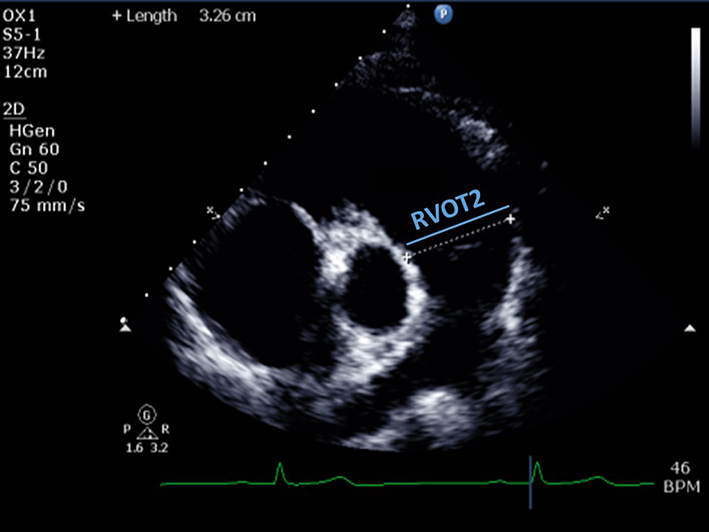 |
|
| RVOT2 (distal RVOT) | End-diastolic. Measured just proximal to the PV. RVOT2 ≤29 mm (males) or ≤28 mm (females) is considered normal (6). | ||
| PSAX PA (2D) | Qualitative assessment of pulmonary valve (PV) leaflet morphology, leaflet thickening, coaptation, prolapse, or presence of supravalvular stenosis. | 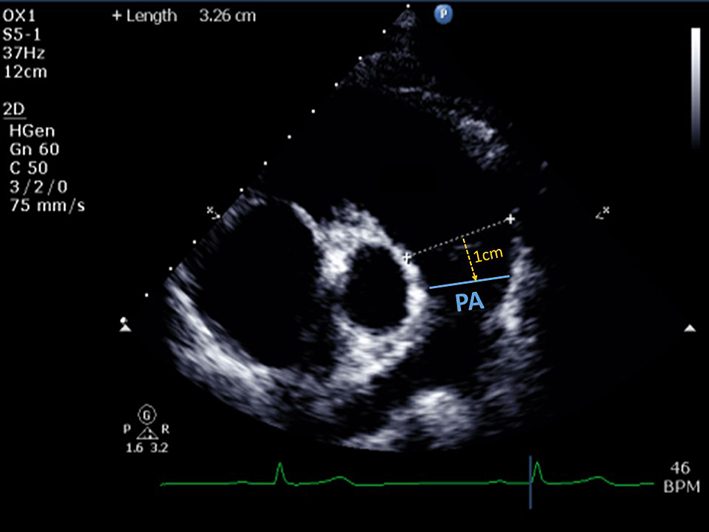 |
|
| Pulmonary artery (PA) diameter | PA dimension is measured in end-diastole, halfway between the PV and bifurcation of main PA (12), or 1 cm distal to the PV. A diameter >25 mm is considered abnormal (26). | ||
| PSAX RVOT (CFM) | Qualitative assessment of pulmonary regurgitation (PR). Mild PR is likely if the jet has a narrow origin and is <10 mm in length (27). Severe PR is likely if the jet originates from the bifurcation of the branch PA. Caution: severe (‘free’) PR may be laminar hence not easily seen on colour flow mode. | 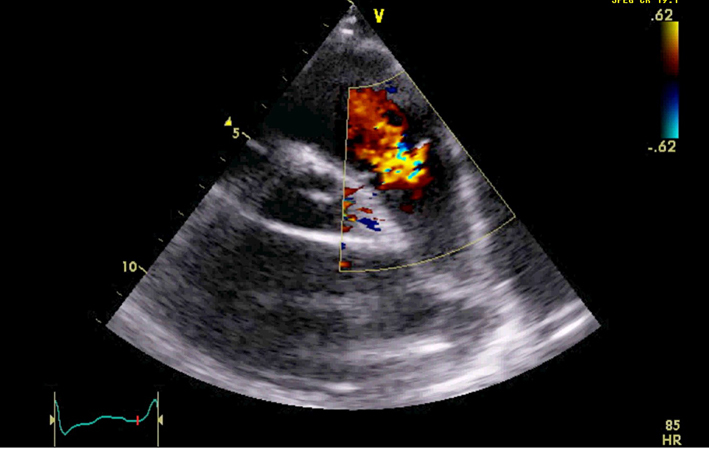 |
|
| PR jet width/RVOT width | Jet width >65% of the RVOT width (RVOT2) is an indicator of severe PR (27). | ||
| PR vena contracta (VC)/PV annular ratio | VC/PV annulus ratio >50% is an indicator of severe PR (28). | ||
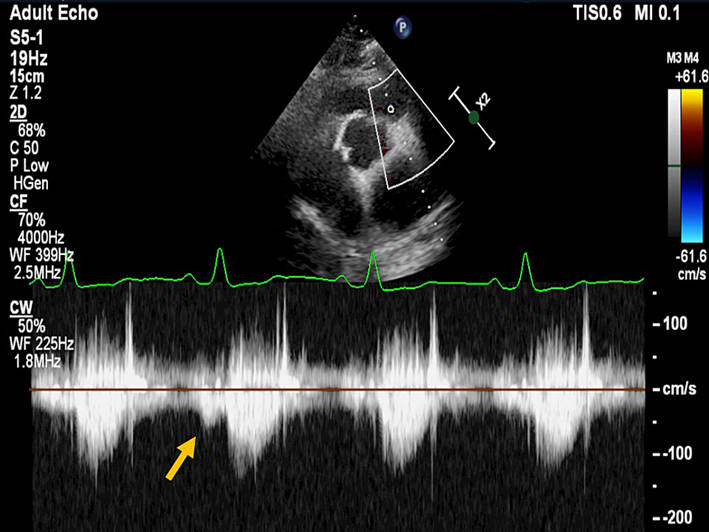
| PSAX RVOT (CW) | Qualitative inspection of the CW signal morphology. Right atrial contraction may be seen as late diastolic forward flow in the CW Doppler profile through the RVOT/PA (yellow arrow). This signal may be more prominent during inspiration and is a marker of restrictive RV physiology. Visual assessment of PR severity. Mild PR has a soft Doppler envelope with slow deceleration. Severe PR has a dense CW envelope with a triangular envelope. |
 |
|
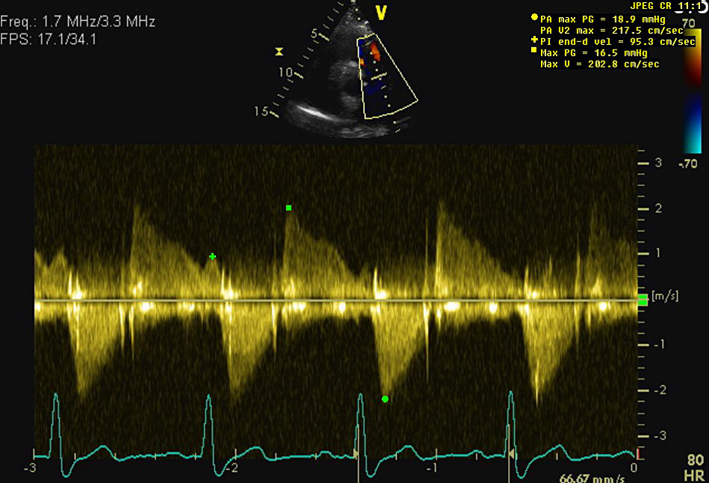
| PA Vmax | <3 m/s is consistent with mild, 3-4 m/s moderate, and >4 m/s severe pulmonary stenosis (29). Visual assessment (2D) and PW Doppler are used to differentiate subvalvular, valvular and supravalvular PS. |
 |
|
| PR early velocity | CW Doppler measurement through the pulmonary valve in line with the PR jet. An early PR velocity >2.2 m/s is considered a marker of raised mean PA pressure (26). See BSE Pulmonary Hypertension protocol for details (25). | ||
| PR end-diastolic velocity | Can be used to estimate PA diastolic pressure, as 4 × (velocity)2 + RA pressure. RA pressure is estimated from IVC size and collapse (see below). | ||
| PR pressure half time | PR pressure half time <100 ms is suggestive of severe PR (28). | ||
| PR index | The duration of the CW PR jet as a proportion of the whole of diastole. PR index <0.77 is suggestive of severe PR (28). | ||
| PSAX RVOT (PW) |
RV outflow tract (RVOT) acceleration time |
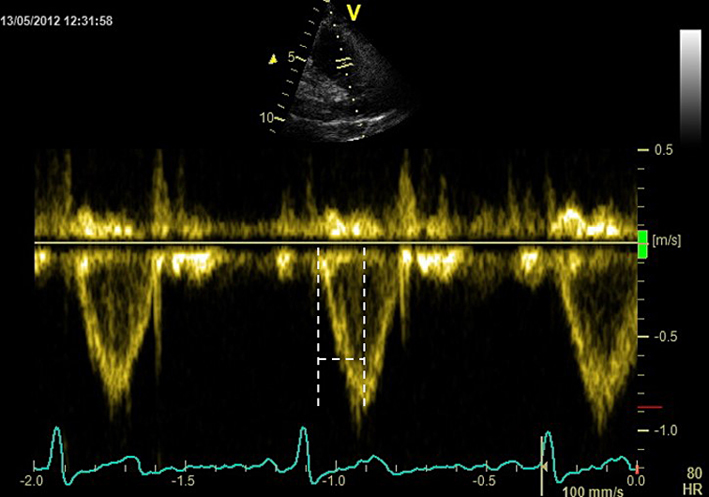
Can be used to determine the level of obstruction (subvalvular, valvular or supravalvular) if PA Vmax is elevated. A pulsed wave (PW) Doppler measurement taken after positioning the sample volume just below the pulmonic cusp on the RV side in the RV outflow tract. Measure at end-expiration from the onset of flow to peak flow velocity. Acceleration time <105 ms is considered a marker of raised PAP. See BSE Pulmonary Hypertension protocol for details (25). |
 |
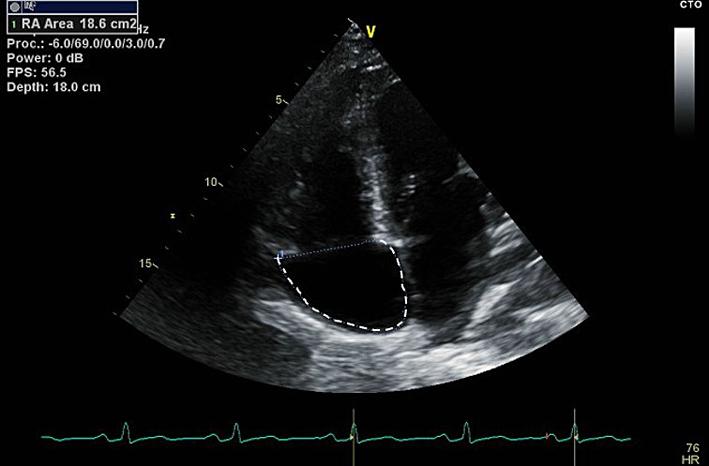
| A4C (2D) | Right atrial area (RAA) | Measure at the end of ventricular systole on the frame just prior to tricuspid valve (TV) opening. Trace the RA from the plane of the TV annulus along the interatrial septum, superior and lateral walls of RA. RAA ≤22 cm2 (≤11 cm2/m2) in males, or ≤19 cm2 (≤11 cm2/m2) in females is considered normal (6). |
 |
| A4C (2D) | Qualitative assessment of RV structure, radial and longitudinal function. Detection of regional RV akinesia, dyskinesia or aneurysms. See BSE ARVC protocol (24). | 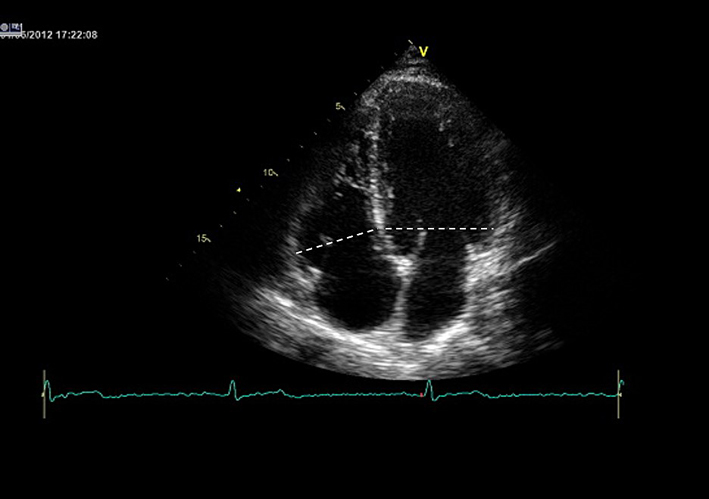 |
|
| RV/LV basal diameter ratio | This is measured from the standard A4C view without foreshortening. Measurement is taken at end-diastole. A ratio of >1 measured at end-diastole suggests RV dilatation (26). |
||
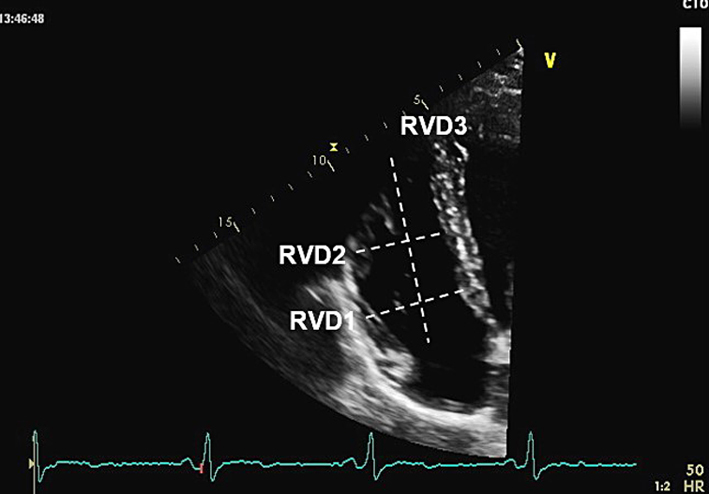
| A4C (2D) | RVD1, RVD2, RVD3 | All measurements taken at end-diastole in the RV-focused view. RV size may be underestimated due to the crescentic RV shape. RVD1: Basal RV diameter. Measured at the maximal transverse diameter in the basal one third of the RV. RVD1 ≤47 mm in males, or ≤43 mm in females, is considered normal (6). RVD2: Mid RV diameter measured at the level of the LV papillary muscles. RVD2 ≤42 mm in males, or ≤35 mm in females, is considered normal (6). RVD3: RV length, from the plane of the tricuspid annulus to the RV apex. RVD3 ≤87 mm in males, or ≤80 mm in females, is considered normal (6). |
 |
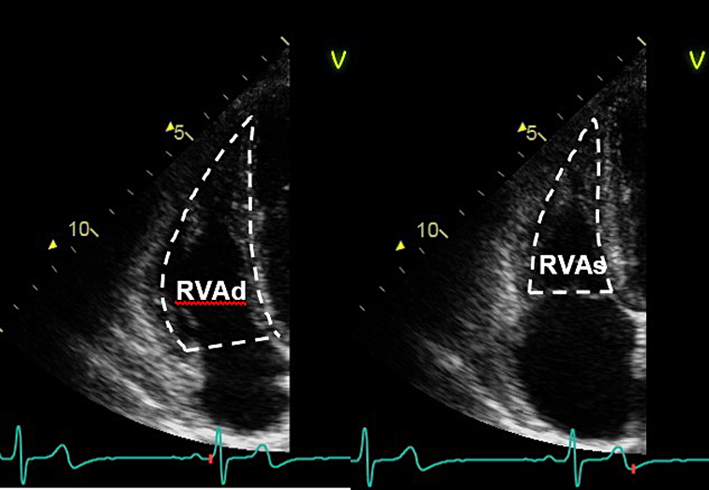
| A4C (2D) | Fractional area change (FAC) | Manual tracing of the RV endocardial border, from the lateral tricuspid annulus along the free wall to the apex, and back along the interventricular septum to the medial tricuspid valve annulus. Repeated at end-diastole and end-systole. A disadvantage of this measure is that it neglects the contribution of the RV outflow tract to overall systolic function. FAC = (RVAdiastole − RVAsystole)/RVAdiastole × 100. RV FAC ≥30% in males, or ≥35% in females, is considered normal (6). |
 |
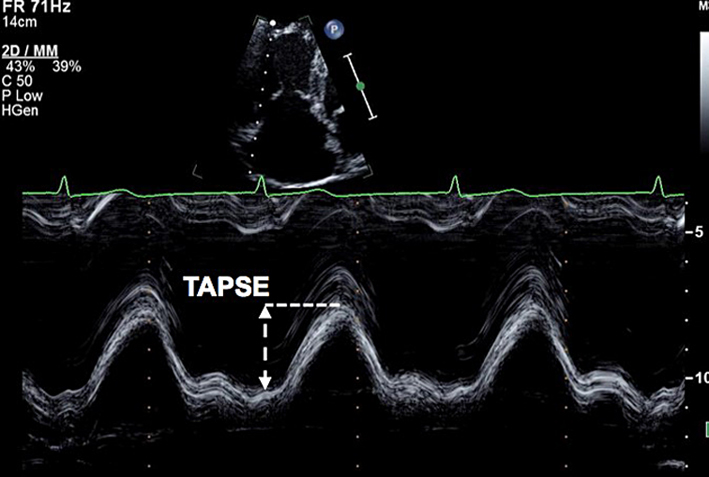
| A4C (M-mode) | Tricuspid annular plane systolic excursion (TAPSE) | This is an angle dependent measurement and therefore it is important to align the M-Mode cursor along the direction of the lateral tricuspid annulus. Select a fast sweep speed. Measure total excursion of the tricuspid annulus. The measurement should be a vertical line as shown in the figure, using the leading-edge to leading-edge technique. A measure of longitudinal RV systolic function. TAPSE <1.7 cm is highly suggestive of RV systolic dysfunction (12). |
 |
| A4C (CFM) | Assessment of TR severity. | 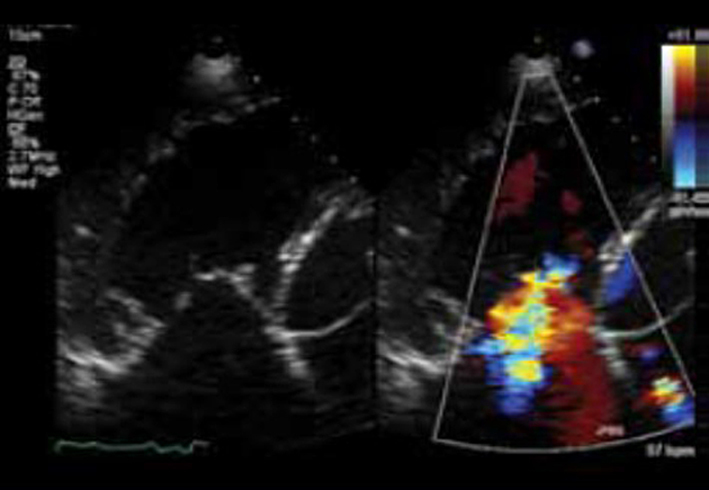 |
|
| TR VC width | The width of the TR jet at its narrowest point immediately after the regurgitant orifice (white line). VC >0.7 cm is consistent with severe TR (28). | 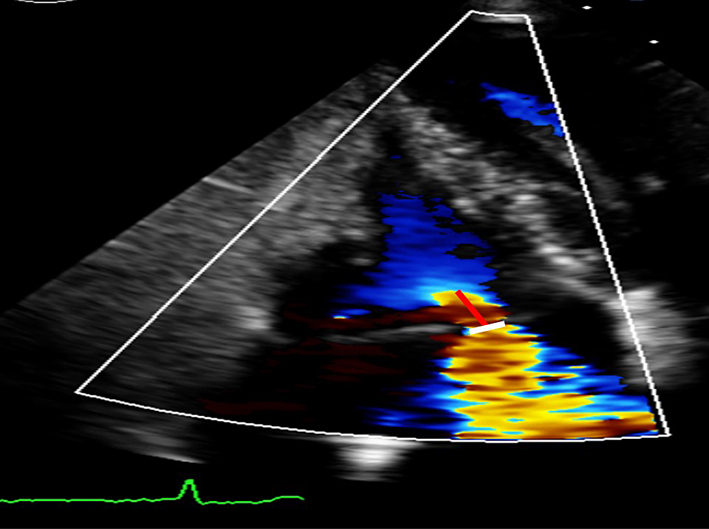 |
|
| Proximal isovelocity surface area (PISA) radius | The Nyquist limit is adjusted in the direction of the TR jet. The PISA radius is measured from the centre of the TV to the furthest point of the proximal flow convergence zone (red line). PISA radius <0.5 cm is indicates mild, 0.5-0.9 moderate, and >0.9 cm severe TR (28). | ||
| A4C (CW) | Qualitative assessment of TR severity. Mild TR has a soft jet density and parabolic contour. Severe TR has a dense CW jet and early peaking or triangular CW envelope. | 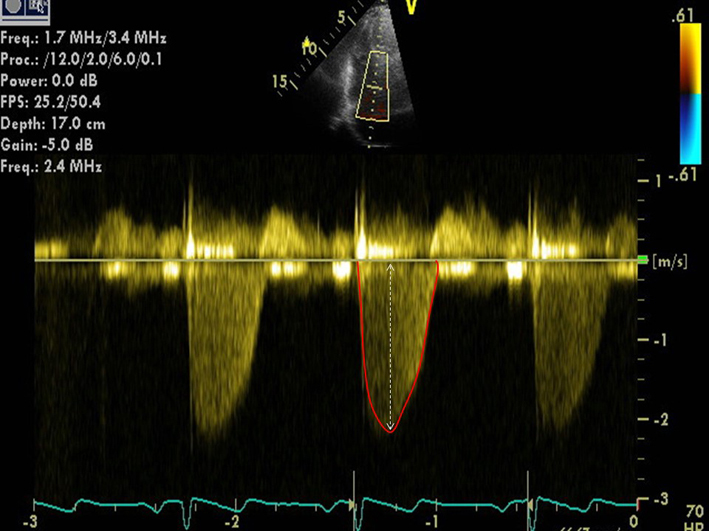 |
|
| Peak TR velocity | TR Vmax is measured by CW Doppler across the tricuspid valve. Multiple views may need to be taken to obtain the optimal window. These include the RV inflow, parasternal short axis (PSAX), apical 4-chamber (A4C) view, subcostal view, or a modified view between the PSAX and A4C. Ensure the CW Doppler flow angle is correctly aligned. Eccentric jets can lead to incomplete Doppler envelopes and underestimation of TR velocity. A high sweep speed (100 mm/s) can help to differentiate between true velocities and artefact (12). TR velocity can be underestimated in severe/free TR and should be stated in the report if present. Measure from a complete TR envelope. Choose the highest velocity (average of 5 beats in atrial fibrillation). TR Vmax <2.8 m/s indicates a low probability of PH if other markers of PH (such as enlargement of the RV, RA or IVC) are absent (26). See BSE Pulmonary Hypertension protocol for details (25). |
||
| TR effective regurgitant orifice area (EROA) | Calculated from the PISA radius, aliaising velocity, and peak TR velocity. EROA ≥0.4 cm2 is considered to indicate severe TR (28). | ||
| TR regurgitant volume | Calculated from the EROA multiplied by the TR VTI (red outline in figure). Regurgitant volume ≥45 mL is considered to indicate severe TR (28). | ||
| A4C (PW) | The view should be optimised in order to align the ultrasound beam with tricuspid inflow. This may require an unconventional/oblique angulation. Tricuspid inflow velocities vary with respiration, hence averaging should be performed over 5 beats. Note also that the values below are highly sensitive to preload and afterload, and should be interpreted with caution in the presence of moderate or severe TR. |
 |
|
| TV E wave velocity | E <0.35 cm/s may indicate impaired RV diastolic filling (12). | ||
| TV A wave velocity | Normal range 21-58 cm/s (12). | ||
| TV E/A ratio | Normal range = 0.8-2.1. TV E/A <0.8 may indicate impaired RV relaxation. TV E/A >2.1 may indicate restrictive RV filling (12). | ||
| TV E wave deceleration time | Normal range = 120-229 ms. TV EDT >229 ms may indicate impaired RV relaxation. EDT <120 ms may indicate restrictive RV filling (12). | ||
| A4C (tissue Doppler) | PW tissue Doppler S′ wave measurement taken at the lateral tricuspid annulus in systole. It is important to ensure the basal RV free wall segment and the lateral tricuspid annulus are aligned with the Doppler cursor to avoid velocity underestimation. RV S′ is closely correlated with TAPSE, and these two measures should be concordant if measured correctly. A disadvantage of this measure is that it assumes that the function of a single segment represents the function of the entire ventricle, which is not likely in conditions that include regionality such as RV infarction (30). |
 |
|
| RV S′ | Sʹ wave velocity ≥9 cm/s indicates normal RV long axis systolic function (11). | ||
| RV E′ and A′ | E′ <8 cm/s and A′ <7 cm/s are abnormal. An E/e′ >6 suggests elevated RA pressure (12). | ||
| RV IVRT | RV IVRT is often not visible in normal hearts. IVRT >73 ms may indicate impaired RV filling (12). | ||
| A4C (tissue Doppler) | Right ventricular index of myocardial performance (RIMP) | RIMP (also known as the Tei index) is an index of global RV performance. The isovolumic contraction time (IVCT), isovolumic relaxation time (IVRT) and ejection time intervals can be measured using tissue Doppler or pulsed wave Doppler. Pulsed wave Doppler or tissue Doppler methods require a sample positioned at the lateral tricuspid valve annulus. However, RIMP derived from pulsed wave Doppler also requires an additional sample from the RVOT and both pulse wave samples need to have near-identical R-R intervals (i.e. heart rate). Tissue Doppler is preferred as it is derived from a single sample. RIMP >0.43 by pulsed wave Doppler, or >0.54 by tissue Doppler, indicates RV dysfunction (11). RIMP >0.64 is associated with a worse prognosis in pulmonary hypertension (25). |
 |
| Subcostal (2D) | IVC diameter | Diameter is measured perpendicular to the IVC long axis, 1–2 cm from the RA junction at end-expiration. Assess size and percentage reduction in diameter with sniffing or quiet inspiration. (12, 26) IVC diameter ≤21 mm, with >50% collapse with sniff suggests normal RA pressure (0-5 mmHg) IVC diameter ≤21 mm with <50% collapse with sniff, or >21 mm with >50% collapse with sniff suggests intermediate RA pressure (5-10 mmHg) IVC diameter >21 mm, with <50% collapse with sniff (or <20% with quiet respiration) suggests high RA pressure (15 mmHg) NB Intermediate can be upgraded to high RA pressure if minimal IVC collapse with sniff (<35%), and secondary indices of elevated RA pressure are present (restrictive filling, RV E/e′ >6, or diastolic flow reversal in the hepatic veins). Intermediate can be downgraded to normal RA pressure if no secondary indices are present. |
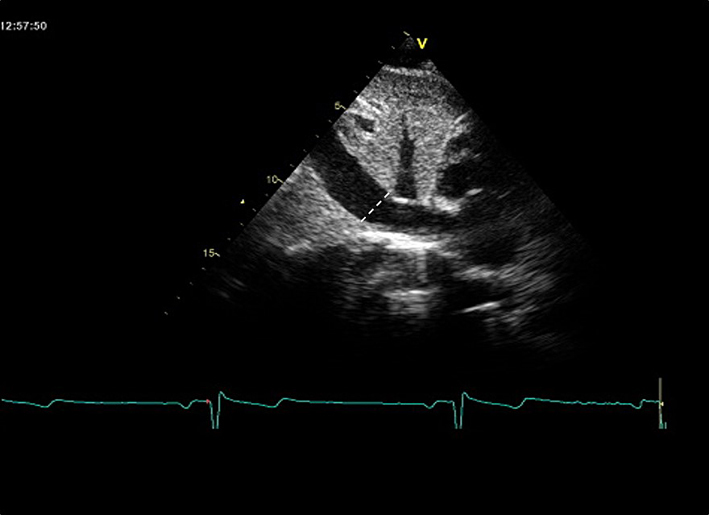 |
| Subcostal (2D) | Qualitative regional wall motion analysis of the inferior wall of the RV. Visual assessment for akinesia, dyskinesia or aneurysm. | 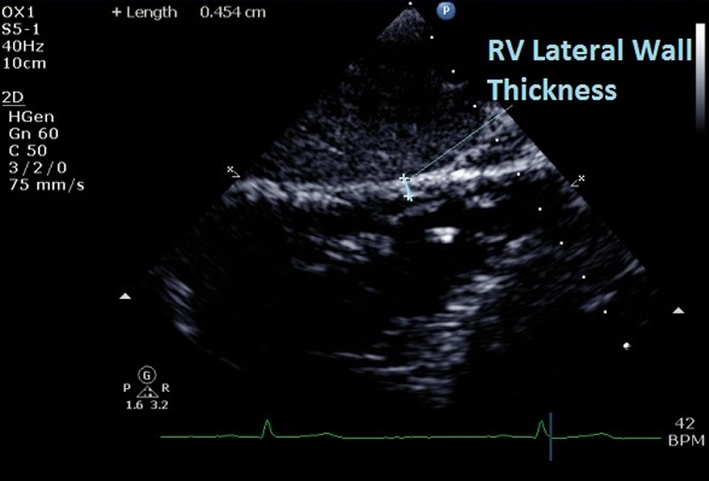 |
|
| RV wall thickness | At end-diastole. Do not include trabeculations and papillary muscles. Use reduced depth to improve resolution and measurement accuracy. RV wall thickness >5 mm is consistent with RV hypertrophy (12). | ||
| Subcostal (CFM) | Qualitative inspection of TR. | 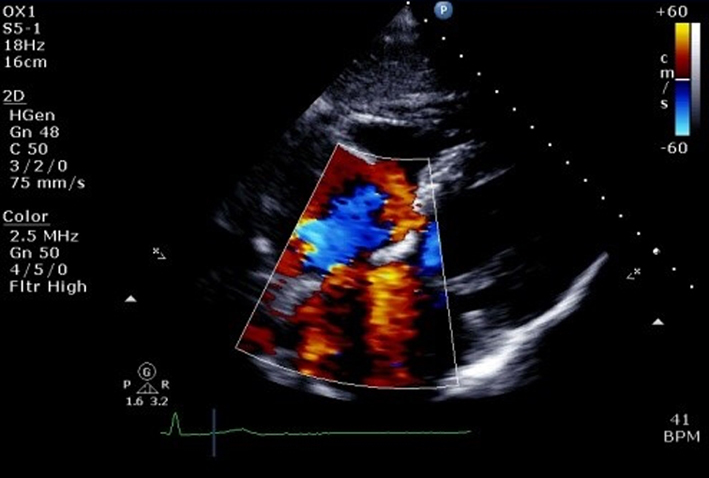 |
|
| Subcostal (CW) | Assessment of TR severity and TR Vmax | See A4C (CW). May be performed if good Doppler alignment with TR jet. | 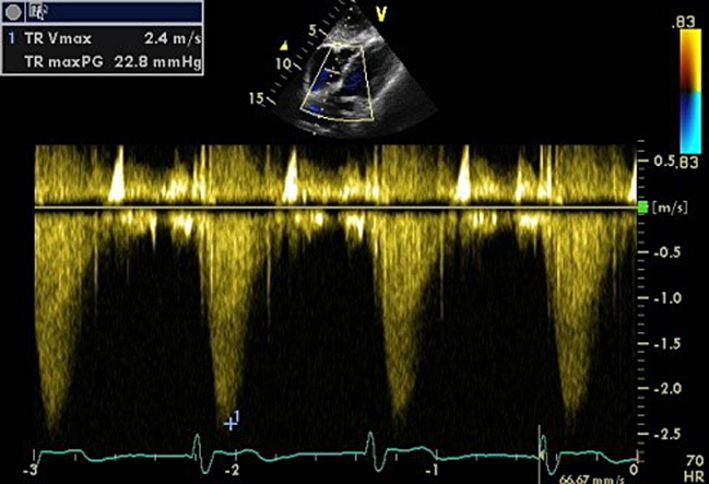 |
| Subcostal (PW) of hepatic veins | Note that there is significant respiratory variation in these parameters, hence averaging over 5 beats should be performed. See the ‘Right ventricular diastolic function’ section for explanation of different HV waveforms. | 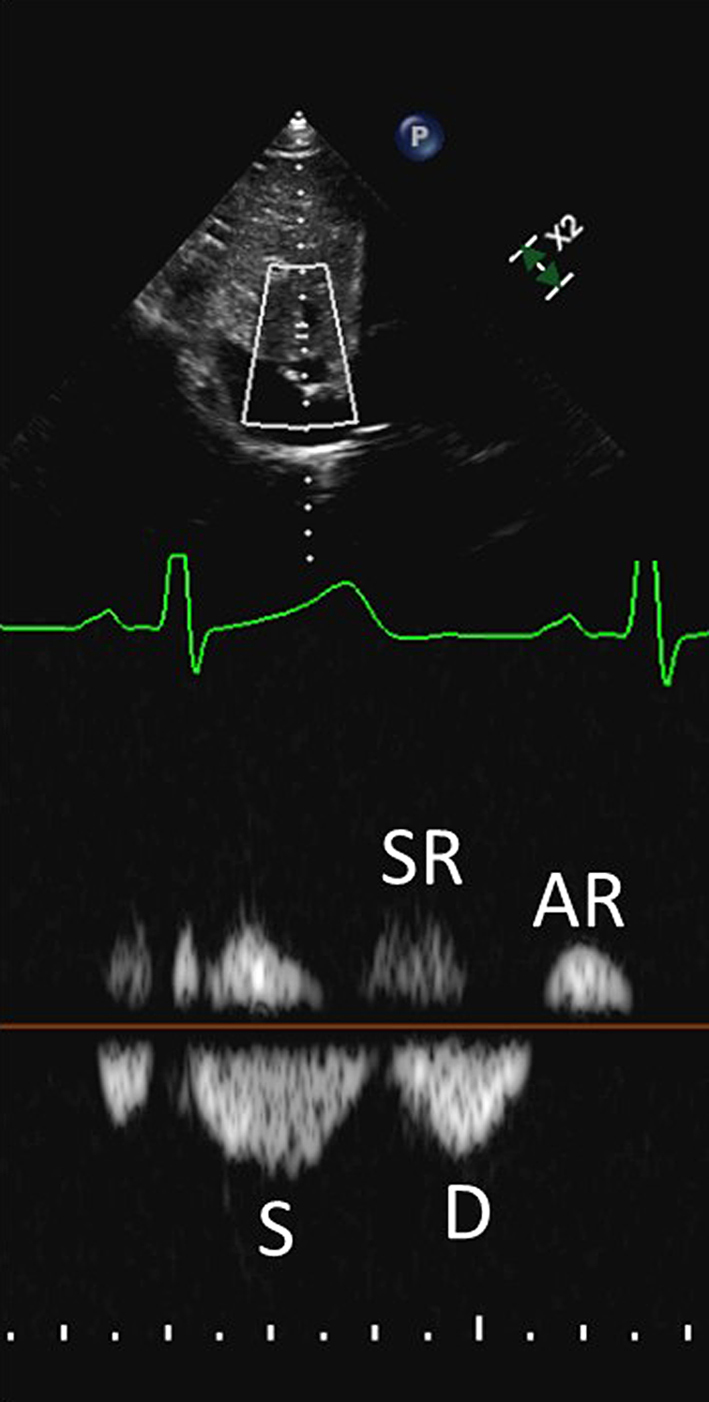 |
|
| HV S/D ratio | S/D <1 may indicate increased RA pressure (12). | ||
| HV systolic filling fraction (HVSFF) | HVSFF is calculated as the S velocity/(S velocity + D velocity) × 100. HVSFF <55% is consistent with increased RA pressure (31). | ||
| HV systolic and atrial reversal waves | Prominent systolic and/or atrial reversal waves which are amplified during inspiration, are in keeping with raised RA pressure (32). Caution, as these may also be seen in the presence of severe TR. |
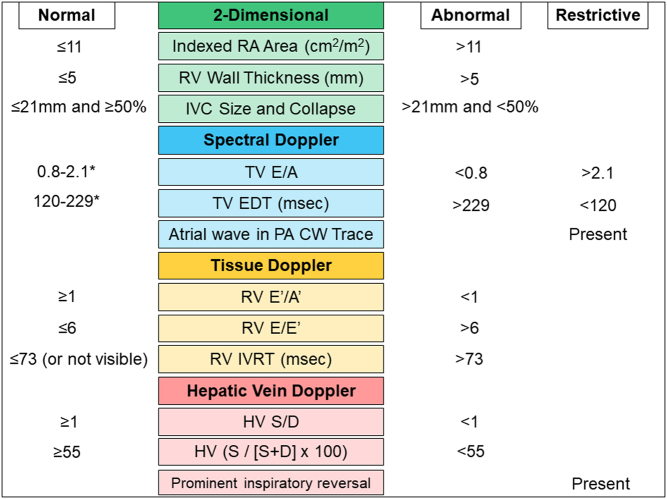
As with the assessment of LV diastolic function, no single measure should be interpreted in isolation. Assessment of RV diastolic function requires the integration of data from different echocardiographic views and modalities (primarily 2-dimensional, PW, and tissue Doppler). We have not attempted to be too rigid in defining grades of RV diastolic dysfunction in this document. Rather, we would encourage the echo practitioner as a minimum to consider whether RV diastolic function is likely to be normal or abnormal. Figure 2 summarises key indices in the echocardiographic assessment of RV diastolic function.
Figure 2.
Echocardiographic assessment of right ventricular diastolic function. * Indicates values which may be ‘pseudonormal’ (Grade 2 RV diastolic dysfunction) if other indicators are in keeping with impaired RV filling.
Disease-oriented approach
There is considerable heterogeneity of RV structural and functional changes across the spectrum of congenital and acquired diseases affecting the right heart. Consequently, routinely measured echocardiographic metrics will have varying sensitivities and specificities for the detection of different conditions involving the RV. A disease-oriented approach should, therefore, be considered for the investigation of right heart disease by echocardiography, rather than the uniform application of generic parameters and cut-offs across all diseases. This is illustrated by considering the relative performance of different RV indices in distinct groups of common pathologies affecting the RV such as pressure-overload, infiltrative conditions and heart muscle disease:
Longitudinal dysfunction measured by tricuspid annular plane systolic excursion (TAPSE) is prognostic in pulmonary hypertension (PH) (18) and is attractive to measure given its relative simplicity to obtain. However, radial contraction is more predictive of global RV function in states of raised RV afterload (19, 20). As such, either a qualitative statement regarding radial function or formal quantification through measures which incorporate it, such as fractional area change (FAC), should be utilised when evaluating the RV in PH.
The functional consequences of cardiac amyloidosis, a disorder of myocardial infiltration and an exemplar restrictive cardiac condition, are especially well described by RV longitudinal function. In this condition, TAPSE is more prognostic than RV ejection fraction by cardiovascular magnetic resonance and is also more sensitive to changes in disease severity across the spectrum of disease burden (21). The probability of TAPSE becoming abnormal at low burdens of myocardial infiltration likely relates to the infiltration of subendocardial longitudinal fibres, whereas the increasing probability of abnormal TAPSE values at higher disease burdens probably reflects the additional effects of progressive LV disease and consequent post-capillary PH. In cardiac amyloidosis, TAPSE is an excellent functional marker of disease and is highly reflective of the underlying pathophysiology.
Arrhythmogenic right ventricular cardiomyopathy (ARVC) has a spectrum of structural and functional manifestations that range from subtle changes localised to any region of the RV to overt global RV chamber dilatation and/or dysfunction. The echocardiographic criteria that contribute to the diagnosis of ARVC require the assessment of regional wall motion abnormalities (RWMA; specifically akinesia and dyskinesia, not hypokinesia) and aneurysms, the measurement of specific right ventricular outflow tract (RVOT) dimensions in parasternal long axis (PLAX) and parasternal short axis (PSAX) views and the quantification of fractional area change (22). Therefore, it is unsurprising that metrics focusing solely on basal longitudinal function have a poor sensitivity for identifying this disease (23).
Contemporary echocardiography techniques to evaluate the right ventricle
Deformation imaging
Speckle-tracking echocardiography (STE) has been widely utilised to provide information about RV myocardial deformation. For example, STE-derived RV longitudinal strain has been shown to be feasible, reproducible (33) and prognostic in a variety of conditions (34, 35, 36, 37). However, the clinical utility of RV speckle-tracking analysis is predominantly limited by variability between vendor hardware and the STE software algorithms that they employ. Accordingly, efforts have recently been made by the EACVI/ASE/Industry Task Force to standardise RV deformation imaging using 2D STE (38). This is the most contemporaneous attempt to harmonise STE practice and technology, the principle recommendations of which include:
The RV-focused apical window should be used for cine acquisition for RV 2D STE (Fig. 1). Accordingly, the RV apex (defined as the point of insertion of the RV free wall into the LV myocardium) must be visualised throughout the cardiac cycle.
The inner contour of the RV myocardium (the endocardial border) should be traced as the region of interest for STE.
The entirety of the RV free wall should be tracked adequately in order to ensure reliable measurements.
Both the pericardium and the atrial side of the tricuspid annulus should be excluded from the region of interest, as these structures will erroneously lower the deformation values obtained.
An adjustable region of interest width with a default of 5 mm should be used (this accounts for the relatively thin RV free wall).
Endocardial or full wall thickness methodology for STE measurements should be specified by the operator in the study report, as these two techniques measure deformation relative to the thickness of myocardium analyzed.
If available, a dedicated RV analysis mode should be used.
Preferential assessment of longitudinal rather than radial (transverse) deformation by 2D STE is recommended, since the latter parameter is less accurate when assessed by STE due to the thin RV wall. However, both longitudinal and radial RV displacement can be measured by STE. This is important in conditions in which radial rather than longitudinal dysfunction may be more reflective of global RV dysfunction, such as in the presence of raised RV afterload (20).
RV free wall deformation (i.e. not including the interventricular septum) should be used by default given the abundance of prognostic data for this method of RV STE assessment. This is called RV free-wall longitudinal strain or strain rate (RVFWSL or RVFWSRL). Measurement of RV longitudinal deformation that includes analysis of the interventricular septum in the region of interest can also be considered, but this is not interchangeable with RV free wall longitudinal deformation indices (and, as such, must be noted in the study report). This is termed RV four-chamber strain or strain rate (RV4CSL or RV4CSRL).
Regional RV longitudinal deformation can be described by dividing the RV free wall into three equidistant segments, namely basal, mid and apical.
Although several timing and functional parameters can be evaluated by RV STE, the majority of the available literature for this technique describes the measurement of peak systolic values for RV deformation and displacement. There is no definitive unifying cut-off value for normality of RV global longitudinal strain that is reliably and consistently applicable across vendor platforms. However, a tentative cut-off of −23% for RV free wall global longitudinal strain could be considered to define normality (39, 40).
It should be noted that RV deformation may also be quantified using tissue Doppler echocardiography; normal values exist for regional RV velocities, strain and strain rate. These appear consistent across different gender and age groups, with the exception of slightly decreasing strain with increasing age. Changes in preload and afterload alter regional RV myocardial velocities, but do not appear to affect strain or strain rate. Tissue Doppler-derived regional RV deformation has been shown to provide prognostic information, and predict adverse events, in patients with acute pulmonary embolism (41).
Three-dimensional echocardiography
The complex anatomical shape and contraction pattern of the RV can only be fully appreciated using three-dimensional cardiac imaging. Furthermore, global volumetric assessment is preferential in scenarios in which impairment in longitudinal function (comprising the majority of conventional two-dimensional RV metrics) either confer a false-positive result (such as post-cardiothoracic surgery) or may not best reflect global RV systolic function (such as in PH). For these reasons, three-dimensional echocardiography (3DE) is an attractive technique for RV assessment. As the technique has matured, data regarding its prognostic value have also emerged across a range of conditions of both left- and right-heart aetiologies (42, 43).
Right ventricular quantification by 3DE requires experience of both the dataset acquisition and post-processing steps:
Acquisition
A full-volume 3DE RV dataset is acquired from the RV-focused apical window while ensuring that the entire RV is included within the pyramidal scan volume. Different 3DE acquisition methods have been developed including (i) the acquisition of multiple sub-volumes over serial ECG-gated heartbeats and (ii) full-volume acquisition in a single heartbeat. A problem of the former technique is the requirement of long breath-holds and regular R-R intervals in order to avoid stitching artefact when the sub-volumes are combined. Although the acquisition and post-processing steps both contribute to the accuracy of RV 3DE, a 2010 meta-analysis of studies in which 3DE RV datasets were acquired over several consecutive cardiac cycles and long breath-holds showed a bias to underestimate RV size versus cardiovascular MRI (CMR) (44). More contemporary transducer technology allows the acquisition of a full-volume 3DE dataset in a single heartbeat (45). This overcomes the issues of long breath-holding and arrhythmia, while also eliminating the issue of stitching artefact. Furthermore, the real-time nature of single heartbeat full-volume acquisition allows the operator to view orthogonal 2DE images typically in 4-chamber, coronal and sagittal planes prior to dataset acquisition. This helps the operator to identify if the relevant structures in the RV are within the acoustic window.
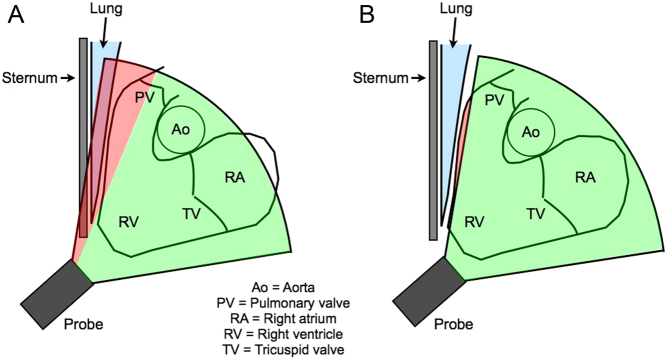
A particular challenge when acquiring a 3DE RV dataset is the ability to completely visualise the RVOT in the coronal view. This is because the anterior retrosternal position of the RVOT in the thorax means that sternum or lung tissue can commonly shadow the RVOT, even if an alternative rib space is attempted (Fig. 3). One technique is to tilt the tail of the probe backwards, potentially introducing the aortic root into the RV-focused image, which might help to also capture the RVOT as part of the full-volume dataset.
Figure 3.
RVOT dropout by 3DE: (A) sternum or lung tissue commonly shadows the anterior RVOT; (B) due to the anterior retrosternal position and morphology of the RVOT, the anterior RVOT still might not be included in the 3DE pyramidal volume despite moving rib spaces in an attempt to avoid this shadowing. Data from Ostenfeld et al. (46).
Post-processing
Different commercially available post-processing methods are used for RV 3DE analysis:
The earliest iterations of 3DE RV post-processing software utilised the disk summation method. This requires the operator to trace the endocardium at end-diastole and end-systole of equally spaced 2D slices of the RV in the axial plane. The volume of each disk is obtained by multiplying the disk area by its thickness; the total cavity volume is, therefore, obtained by the addition of all disk volumes.
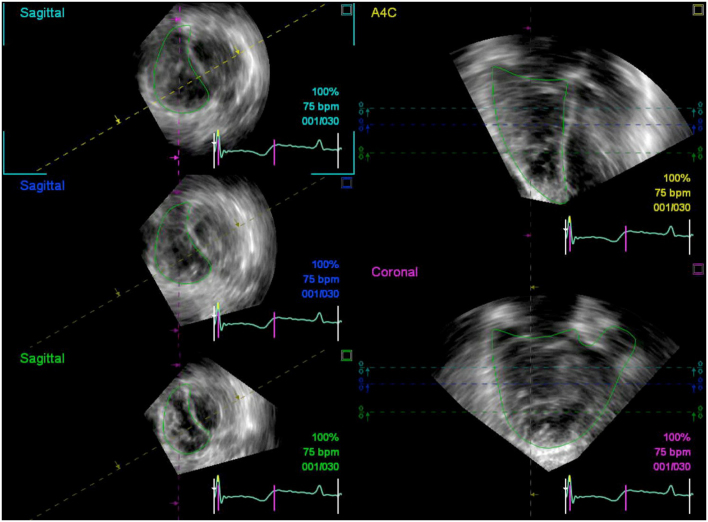
The more contemporary approach to 3DE RV post-processing requires the operator to trace the RV endocardium in end-diastolic and end-systolic frames in three reconstructed views, namely the four-chamber, sagittal and coronal planes (Fig. 4). These cross-sectional planes allow visualization of the tricuspid annulus, the ventriculo-infundibular fold, RV outflow tract, and RV apex. The borders that are traced in one view must intersect with the respective region of endocardium subsequently visualised in other views, and so manual correction may be required to ensure that the border tracings conform between views. A semi-automated border detection algorithm based on in vivo normal subjects and pathologic RV modelling is subsequently run, with the option of manual correction of the traced contours in the event of suboptimal border tracking. This technique is recommended as the preferred post-processing algorithm as it is more accurate than disk summation, in part due to less geometric assumptions and the superior ability to visually delineate the boundaries of the RV inlet and outlet portions (47).
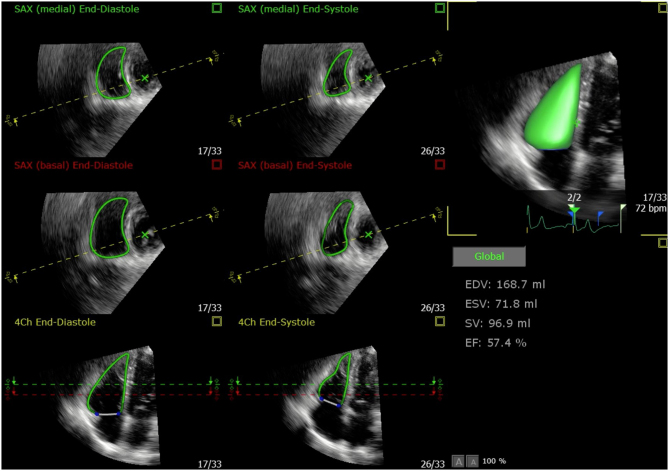
Typically, the most challenging aspect of post-processing 3DE RV datasets has been the requirement for a good quality coronal view in which the endocardium along the RVOT is clearly visualised and hence can be accurately traced. However, the most recent iterations of one commercially available 3DE RV analysis software require interpretation of just the 4-chamber and short-axis views extracted from the 3DE RV dataset (42, 43, 48, 49). These echocardiography views are more recognisable and familiar to echocardiography operators, potentially making the endocardial border easier to identify and affording a reproducible and accurate method for 3DE RV assessment (Fig. 5).
Figure 4.
Endocardial borders visualised in reconstructed apical 4-chamber (A4C, yellow dashed line), coronal (purple dashed line) and sagittal (turquoise dashed line = basal, blue dashed line = mid, green dashed line = distal) views in a patient with pulmonary hypertension. Note how the coronal view (bottom right) corresponds with the imaging plane delineated by the purple dashed line intersecting the tricuspid valve and RVOT in the sagittal views.
Figure 5.
The most recent version of this 3DE RV post-processing software automatically identifies and tracks the RV endocardium using speckle-tracking software. The user can adjust the endocardial borders using end-diastolic and end-systolic frames in the 4-chamber view and two short-axis views (negating the need for interpreting a coronal RV view as required in previous post-processing algorithms). Any manual corrections are automatically propagated to all other frames of the cardiac cycle.
Although previous reference intervals for RV cavity volumes and RVEF quote generic intervals for all individuals, these parameters do vary with patient age and sex and, as such, should be referenced accordingly (11, 50). In general, RVEF ≥45% by 3DE can be considered a cut-off to define normal RV systolic function. Numerous studies have compared RV volumetric quantification by 3DE with the reference-standard technique of CMR (44, 47). These generally demonstrate a tendency for underestimation of RV cavity sizes by 3DE, albeit the majority were performed using multiple-beat ECG-gated acquisition techniques rather than the more contemporary full-volume single-heartbeat technology. Blurring of the endocardium due to the lower spatial resolution of 3DE datasets versus 2D imaging is a potential reason for operators to trace too far into the cavity, thereby underestimating RV chamber volumes (51). Tracing the RV endocardium on the ‘white side’ of the blood pool/myocardial boundary may help to reduce this limitation of RV 3DE post-processing (52). Currently, the wide limits of agreement for accuracy (when measured against CMR) and reproducibility of RV 3DE may also render this technique as insensitive to small changes in RV function that are known to be clinically significant in RV disease and identifiable by cross-sectional cardiac imaging modalities (53).
Overall, the requirement for good acoustic windows and high image quality, the inherent learning curve and the requirement for satisfactory test-retest reproducibility should all be considered in order to reliably implement 3DE RV analysis as a clinical routine in echocardiography laboratories (45). As such, previously published guidelines have consistently emphasised that RV volumetric quantification by 3DE should be performed in laboratories with appropriate experience (11, 39, 54). More recently, the use of intravenous contrast has been shown to better delineate the RV endocardium and reduce the bias for RV cavity volume underestimation (48). However, the previously quoted normal intervals are based upon non-contrast enhanced 3DE RV studies, and so further validation of contrast enhanced 3DE RV assessment, along with the revision of normal reference intervals, would be required before it is integrated as part of a standard 3DE RV dataset.
Common limitations of specific right heart parameters
The appropriate application and interpretation of RV parameters by echocardiography is dependent upon understanding their relative limitations. Although by no means exhaustive, the following caveats should be considered when assessing RV size and function by echocardiography:
Comparing the ratio of LV and RV basal dimensions in the 4-chamber view is a simple means of visually judging RV dilatation, but may not be valid if the LV itself is dilated. The most reproducible two-dimensional parameter for RV size is the RV basal diameter (RVD1), an important consideration when different sonographers perform serial studies (55). However, as with all two-dimensional RV measurements, the normal consensus values provided in most guideline statements are unindexed, not categorised by sex, and can be altered in athletic individuals (56, 57). See also BSE guideline for echocardiography in the cardiac screening of sports participants (58).
The importance of acquiring a standardised RV-focused view is reflected by the test-retest reproducibility of FAC, which can vary significantly amongst sonographers if different echocardiography windows are used (59).
The Tei index (RIMP), as with all RV functional indices, is load-dependent and may pseudo-normalise in conditions with elevated right atrial pressure. In such cases, raised RA pressure causes the tricuspid valve to open earlier, thus reducing isovolumic relaxation time and thereby underestimating the Tei index.
Both S′ and TAPSE are angle dependent and only reflect the longitudinal function of the basal portion of the RV, neglecting the contributions of the apical and outflow tract components to RV ejection. Furthermore, these variables both reflect myocardial motion rather than contraction. This gives rise to susceptibility of measuring translational RV motion, such as that which occurs in PH, rather than true contraction. In such cases where the RV demonstrates a rocking motion, consideration should be given to providing a value for TAPSE corrected to the amount of RV apical motion (60). Finally, both S′ and TAPSE are commonly reduced following cardiothoracic surgery (30), due often to true impairment of longitudinal function, as well as the effects of post-operative geometric alterations. Alternative measurements should therefore be considered to assess RV function.
Right ventricular systolic pressure can be underestimated in cases of an inadequate CW Doppler profile of the TR jet, and in such circumstances should be avoided. Conversely, RA pressure tends to be overestimated when assessing IVC size and reactivity, and agrees poorly with invasively measured pressures in some studies (61, 62). Estimated RA pressure should therefore be specified separately from the TR Vmax value, and echocardiographic assessment for pulmonary hypertension should not rely solely on TR velocity and IVC dimensions (25).
The level at which the eccentricity index is measured should be the same between studies as the arrangement and configuration of interventricular septal myofibres varies at different levels.
Indices of RV diastolic function are sensitive to changes in preload and afterload and must be interpreted with caution in the presence of significant pulmonary hypertension.
Key messages
Accurate and reproducible right heart quantification by echocardiography often necessitates specific imaging planes and techniques, such as the RV-focused apical 4-chamber view.
Comprehensive right heart assessment should include quantification of RV and RA dimensions, RV systolic and diastolic function, pulmonary and tricuspid valve morphology and function, and estimation of pulmonary artery pressures.
Novel dimensional reference intervals are presented in this document, based on data from the NORRE study (6). These cut-offs should however be used in a disease-oriented manner, given the considerable heterogeneity of right heart remodelling across a range of pathological and physiological states.
Conclusion
Assessment of right heart dimensions and functional parameters can play an important role in diagnosis, prognostication, and monitoring of therapeutic response, across a variety of pathologies. Echocardiography remains the first-line imaging modality for right heart assessment. There is a growing evidence base to guide right heart quantification, and more robust normal values are being developed, including those for emerging techniques such as RV diastolic function assessment, strain and three-dimensional echocardiography. Attention to specific technical considerations is required for the accurate and reproducible quantification of right heart parameters by echocardiography.
Declaration of interest
Daniel S Knight is supported by the National Institute for Health Research University College London Biomedical Research Centre. David Oxborough and Vishal Sharma are members of the editorial board of Echo Research and Practice. They were not involved in the review or editorial process for this paper, on which they are listed as authors. The other authors have nothing to disclose.
Funding
This work did not receive any specific grant from any funding agency in the public, commercial or not-for-profit sector.
References
- 1.de Groote P, Millaire A, Foucher-Hossein C, Nugue O, Marchandise X, Ducloux G, Lablanche JM. Right ventricular ejection fraction is an independent predictor of survival in patients with moderate heart failure. Journal of the American College of Cardiology 1998. 32 948–954. ( 10.1016/s0735-1097(98)00337-4) [DOI] [PubMed] [Google Scholar]
- 2.Ghio S, Gavazzi A, Campana C, Inserra C, Klersy C, Sebastiani R, Arbustini E, Recusani F, Tavazzi L. Independent and additive prognostic value of right ventricular systolic function and pulmonary artery pressure in patients with chronic heart failure. Journal of the American College of Cardiology 2001. 37 183–188. ( 10.1016/s0735-1097(00)01102-5) [DOI] [PubMed] [Google Scholar]
- 3.Knauth AL, Gauvreau K, Powell AJ, Landzberg MJ, Walsh EP, Lock JE, del Nido PJ, Geva T. Ventricular size and function assessed by cardiac MRI predict major adverse clinical outcomes late after tetralogy of Fallot repair. Heart 2008. 94 211–216. ( 10.1136/hrt.2006.104745) [DOI] [PubMed] [Google Scholar]
- 4.Sun JP, James KB, Yang XS, Solankhi N, Shah MS, Arheart KL, Thomas JD, Stewart WJ. Comparison of mortality rates and progression of left ventricular dysfunction in patients with idiopathic dilated cardiomyopathy and dilated versus nondilated right ventricular cavities. American Journal of Cardiology 1997. 80 1583–1587. ( 10.1016/s0002-9149(97)00780-7) [DOI] [PubMed] [Google Scholar]
- 5.Wharton G, Steeds R, Allen J, Phillips H, Jones R, Kanagala P, Lloyd G, Masani N, Mathew T, Oxborough D, et al A minimum dataset for a standard adult transthoracic echocardiogram: a guideline protocol from the British Society of Echocardiography. Echo Research and Practice 2015. 2 G9–G24. ( 10.1530/ERP-14-0079) [DOI] [PMC free article] [PubMed] [Google Scholar]
- 6.Kou S, Caballero L, Dulgheru R, Voilliot D, De Sousa C, Kacharava G, Athanassopoulos GD, Barone D, Baroni M, Cardim N, et al Echocardiographic reference ranges for normal cardiac chamber size: results from the NORRE study. European Heart Journal Cardiovascular Imaging 2014. 15 680–690. ( 10.1093/ehjci/jet284) [DOI] [PMC free article] [PubMed] [Google Scholar]
- 7.Ho SY, Nihoyannopoulos P. Anatomy, echocardiography, and normal right ventricular dimensions. Heart 2006. 92 (Supplement 1) i2–i13. ( 10.1136/hrt.2005.077875) [DOI] [PMC free article] [PubMed] [Google Scholar]
- 8.Geva T, Powell AJ, Crawford EC, Chung T, Colan SD. Evaluation of regional differences in right ventricular systolic function by acoustic quantification echocardiography and cine magnetic resonance imaging. Circulation 1998. 98 339–345. ( 10.1161/01.cir.98.4.339) [DOI] [PubMed] [Google Scholar]
- 9.Haber I, Metaxas DN, Geva T, Axel L. Three-dimensional systolic kinematics of the right ventricle. American Journal of Physiology: Heart and Circulatory Physiology 2005. 289 H1826–H1833. ( 10.1152/ajpheart.00442.2005) [DOI] [PubMed] [Google Scholar]
- 10.Genovese D, Mor-Avi V, Palermo C, Muraru D, Volpato V, Kruse E, Yamat M, Aruta P, Addetia K, Badano LP, et al Comparison between four-chamber and right ventricular-focused views for the quantitative evaluation of right ventricular size and function. Journal of the American Society of Echocardiography 2019. 32 484–494. ( 10.1016/j.echo.2018.11.014) [DOI] [PubMed] [Google Scholar]
- 11.Lang RM, Badano LP, Mor-Avi V, Afilalo J, Armstrong A, Ernande L, Flachskampf FA, Foster E, Goldstein SA, Kuznetsova T, et al Recommendations for cardiac chamber quantification by echocardiography in adults: an update from the American Society of Echocardiography and the European Association of Cardiovascular Imaging. Journal of the American Society of Echocardiography 2015. 28 1–39.e14. ( 10.1016/j.echo.2014.10.003) [DOI] [PubMed] [Google Scholar]
- 12.Rudski LG, Lai WW, Afilalo J, Hua L, Handschumacher MD, Chandrasekaran K, Solomon SD, Louie EK, Schiller NB. Guidelines for the echocardiographic assessment of the right heart in adults: a report from the American Society of Echocardiography endorsed by the European Association of Echocardiography, a registered branch of the European Society of Cardiology, and the Canadian Society of Echocardiography. Journal of the American Society of Echocardiography 2010. 23 685–713; quiz 86–88. ( 10.1016/j.echo.2010.05.010) [DOI] [PubMed] [Google Scholar]
- 13.Fenster BE, Holm KE, Weinberger HD, Moreau KL, Meschede K, Crapo JD, Make BJ, Bowler R, Wamboldt FS, Hoth KF. Right ventricular diastolic function and exercise capacity in COPD. Respiratory Medicine 2015. 109 1287–1292. ( 10.1016/j.rmed.2015.09.003) [DOI] [PMC free article] [PubMed] [Google Scholar]
- 14.Pagourelias ED, Efthimiadis GK, Parcharidou DG, Gossios TD, Kamperidis V, Karoulas T, Karvounis H, Styliadis IH. Prognostic value of right ventricular diastolic function indices in hypertrophic cardiomyopathy. European Journal of Echocardiography 2011. 12 809–817. ( 10.1093/ejechocard/jer126) [DOI] [PubMed] [Google Scholar]
- 15.Gan CT, Holverda S, Marcus JT, Paulus WJ, Marques KM, Bronzwaer JG, Twisk JW, Boonstra A, Postmus PE, Vonk-Noordegraaf A. Right ventricular diastolic dysfunction and the acute effects of sildenafil in pulmonary hypertension patients. Chest 2007. 132 11–17. ( 10.1378/chest.06-1263) [DOI] [PubMed] [Google Scholar]
- 16.Agha HM, Beshlawy A, Hamdy M, Sobeih A, El Zahrae F, Abd El Satar IA, AbdelMassih A, Said F, Abd El Aziz O, El Tagui M, et al Early detection of right ventricular diastolic dysfunction by pulsed tissue Doppler echocardiography in iron loaded beta thalassemia patients. Pediatric Cardiology 2015. 36 468–474. ( 10.1007/s00246-014-1035-y) [DOI] [PubMed] [Google Scholar]
- 17.Kosmala W, Colonna P, Przewlocka-Kosmala M, Mazurek W. Right ventricular dysfunction in asymptomatic diabetic patients. Diabetes Care 2004. 27 2736–2738. ( 10.2337/diacare.27.11.2736) [DOI] [PubMed] [Google Scholar]
- 18.Forfia PR, Fisher MR, Mathai SC, Housten-Harris T, Hemnes AR, Borlaug BA, Chamera E, Corretti MC, Champion HC, Abraham TP, et al Tricuspid annular displacement predicts survival in pulmonary hypertension. American Journal of Respiratory and Critical Care Medicine 2006. 174 1034–1041. ( 10.1164/rccm.200604-547OC) [DOI] [PubMed] [Google Scholar]
- 19.Kind T, Marcus JT, Westerhof N, Vonk-Noordegraaf A. Longitudinal and transverse movements of the right ventricle: both are important in pulmonary arterial hypertension. Chest 2011. 140 556–557; author reply 556–557. ( 10.1378/chest.10-3195) [DOI] [PubMed] [Google Scholar]
- 20.Kind T, Mauritz GJ, Marcus JT, van de Veerdonk M, Westerhof N, Vonk-Noordegraaf A. Right ventricular ejection fraction is better reflected by transverse rather than longitudinal wall motion in pulmonary hypertension. Journal of Cardiovascular Magnetic Resonance 2010. 12 35 ( 10.1186/1532-429X-12-35) [DOI] [PMC free article] [PubMed] [Google Scholar]
- 21.Knight DS, Zumbo G, Barcella W, Steeden JA, Muthurangu V, Martinez-Naharro A, Treibel TA, Abdel-Gadir A, Bulluck H, Kotecha T, et al Cardiac structural and functional consequences of amyloid deposition by cardiac magnetic resonance and echocardiography and their prognostic roles. JACC: Cardiovascular Imaging 2019. 12 823–833. ( 10.1016/j.jcmg.2018.02.016) [DOI] [PubMed] [Google Scholar]
- 22.Marcus FI, McKenna WJ, Sherrill D, Basso C, Bauce B, Bluemke DA, Calkins H, Corrado D, Cox MG, Daubert JP, et al Diagnosis of arrhythmogenic right ventricular cardiomyopathy/dysplasia: proposed modification of the task force criteria. Circulation 2010. 121 1533–1541. ( 10.1161/CIRCULATIONAHA.108.840827) [DOI] [PMC free article] [PubMed] [Google Scholar]
- 23.Teske AJ, Cox MG, De Boeck BW, Doevendans PA, Hauer RN, Cramer MJ. Echocardiographic tissue deformation imaging quantifies abnormal regional right ventricular function in arrhythmogenic right ventricular dysplasia/cardiomyopathy. Journal of the American Society of Echocardiography 2009. 22 920–927. ( 10.1016/j.echo.2009.05.014) [DOI] [PubMed] [Google Scholar]
- 24.Oxborough D Zaidi A Sharma S & Somauroo J. The echocardiographic assessment of the right ventricle with particular reference to arrhythmogenic right ventricular cardiomyopathy: a protocol of the British Society of Echocardiography. In ECHO – Journal of the British Society of Echocardiography, pp 12–18. London, UK: British Society of Echocardiography, 2013. (available at: https://www.bsecho.org/common/Uploaded%20files/Education/Protocols%20and%20guidelines/ARVC.pdf) [Google Scholar]
- 25.Augustine DX, Coates-Bradshaw LD, Willis J, Harkness A, Ring L, Grapsa J, Coghlan G, Kaye N, Oxborough D, Robinson S, et al Echocardiographic assessment of pulmonary hypertension: a guideline protocol from the British Society of Echocardiography. Echo Research and Practice 2018. 5 G11–G24. ( 10.1530/ERP-17-0071) [DOI] [PMC free article] [PubMed] [Google Scholar]
- 26.Galie N, Humbert M, Vachiery JL, Gibbs S, Lang I, Torbicki A, Simonneau G, Peacock A, Vonk Noordegraaf A, Beghetti M, et al 2015 ESC/ERS Guidelines for the diagnosis and treatment of pulmonary hypertension: the Joint Task Force for the Diagnosis and Treatment of Pulmonary Hypertension of the European Society of Cardiology (ESC) and the European Respiratory Society (ERS): endorsed by: Association for European Paediatric and Congenital Cardiology (AEPC), International Society for Heart and Lung Transplantation (ISHLT). European Heart Journal 2016. 37 67–119. ( 10.1093/eurheartj/ehv317) [DOI] [PubMed] [Google Scholar]
- 27.Lancellotti P, Tribouilloy C, Hagendorff A, Popescu BA, Edvardsen T, Pierard LA, Badano L, Zamorano JL. & Scientific Document Committee of the European Association of Cardiovascular Imaging. Recommendations for the echocardiographic assessment of native valvular regurgitation: an executive summary from the European Association of Cardiovascular Imaging. European Heart Journal Cardiovascular Imaging 2013. 14 611–644. ( 10.1093/ehjci/jet105) [DOI] [PubMed] [Google Scholar]
- 28.Zoghbi WA, Adams D, Bonow RO, Enriquez-Sarano M, Foster E, Grayburn PA, Hahn RT, Han Y, Hung J, Lang RM, et al Recommendations for noninvasive evaluation of native valvular regurgitation: a report from the American Society of Echocardiography developed in collaboration with the Society for Cardiovascular Magnetic Resonance. Journal of the American Society of Echocardiography 2017. 30 303–371. ( 10.1016/j.echo.2017.01.007) [DOI] [PubMed] [Google Scholar]
- 29.Baumgartner H, Hung J, Bermejo J, Chambers JB, Evangelista A, Griffin BP, Iung B, Otto CM, Pellikka PA, Quiñones M, et al Echocardiographic assessment of valve stenosis: EAE/ASE recommendations for clinical practice. Journal of the American Society of Echocardiography 2009. 22 1–23; quiz 101–102. ( 10.1016/j.echo.2008.11.029) [DOI] [PubMed] [Google Scholar]
- 30.Tamborini G, Muratori M, Brusoni D, Celeste F, Maffessanti F, Caiani EG, Alamanni F, Pepi M. Is right ventricular systolic function reduced after cardiac surgery? A two- and three-dimensional echocardiographic study. European Journal of Echocardiography 2009. 10 630–634. ( 10.1093/ejechocard/jep015) [DOI] [PubMed] [Google Scholar]
- 31.Nagueh SF, Kopelen HA, Zoghbi WA. Relation of mean right atrial pressure to echocardiographic and Doppler parameters of right atrial and right ventricular function. Circulation 1996. 93 1160–1169. ( 10.1161/01.cir.93.6.1160) [DOI] [PubMed] [Google Scholar]
- 32.Klein AL, Hatle LK, Burstow DJ, Taliercio CP, Seward JB, Kyle RA, Bailey KR, Gertz MA, Tajik AJ. Comprehensive Doppler assessment of right ventricular diastolic function in cardiac amyloidosis. Journal of the American College of Cardiology 1990. 15 99–108. ( 10.1016/0735-1097(90)90183-p) [DOI] [PubMed] [Google Scholar]
- 33.Chow PC, Liang XC, Cheung EW, Lam WW, Cheung YF. New two-dimensional global longitudinal strain and strain rate imaging for assessment of systemic right ventricular function. Heart 2008. 94 855–859. ( 10.1136/hrt.2007.131862) [DOI] [PubMed] [Google Scholar]
- 34.Antoni ML, Scherptong RW, Atary JZ, Boersma E, Holman ER, van der Wall EE, Schalij MJ, Bax JJ. Prognostic value of right ventricular function in patients after acute myocardial infarction treated with primary percutaneous coronary intervention. Circulation: Cardiovascular Imaging 2010. 3 264–271. ( 10.1161/CIRCIMAGING.109.914366) [DOI] [PubMed] [Google Scholar]
- 35.Guendouz S, Rappeneau S, Nahum J, Dubois-Rande JL, Gueret P, Monin JL, Lim P, Adnot S, Hittinger L, Damy T. Prognostic significance and normal values of 2D strain to assess right ventricular systolic function in chronic heart failure. Circulation Journal 2012. 76 127–136. ( 10.1253/circj.cj-11-0778) [DOI] [PubMed] [Google Scholar]
- 36.Hardegree EL, Sachdev A, Villarraga HR, Frantz RP, McGoon MD, Kushwaha SS, Hsiao JF, McCully RB, Oh JK, Pellikka PA, et al Role of serial quantitative assessment of right ventricular function by strain in pulmonary arterial hypertension. American Journal of Cardiology 2013. 111 143–148. ( 10.1016/j.amjcard.2012.08.061) [DOI] [PubMed] [Google Scholar]
- 37.Sachdev A, Villarraga HR, Frantz RP, McGoon MD, Hsiao JF, Maalouf JF, Ammash NM, McCully RB, Miller FA, Pellikka PA, et al Right ventricular strain for prediction of survival in patients with pulmonary arterial hypertension. Chest 2011. 139 1299–1309. ( 10.1378/chest.10-2015) [DOI] [PubMed] [Google Scholar]
- 38.Badano LP, Kolias TJ, Muraru D, Abraham TP, Aurigemma G, Edvardsen T, D’Hooge J, Donal E, Fraser AG, Marwick T, et al Standardization of left atrial, right ventricular, and right atrial deformation imaging using two-dimensional speckle tracking echocardiography: a consensus document of the EACVI/ASE/Industry Task Force to standardize deformation imaging. European Heart Journal: Cardiovascular Imaging 2018. 19 591–600. ( 10.1093/ehjci/jey042) [DOI] [PubMed] [Google Scholar]
- 39.Galderisi M, Cosyns B, Edvardsen T, Cardim N, Delgado V, Di Salvo G, Donal E, Sade LE, Ernande L, Garbi M, et al Standardization of adult transthoracic echocardiography reporting in agreement with recent chamber quantification, diastolic function, and heart valve disease recommendations: an expert consensus document of the European Association of Cardiovascular Imaging. European Heart Journal: Cardiovascular Imaging 2017. 18 1301–1310. ( 10.1093/ehjci/jex244) [DOI] [PubMed] [Google Scholar]
- 40.Muraru D, Onciul S, Peluso D, Soriani N, Cucchini U, Aruta P, Romeo G, Cavalli G, Iliceto S, Badano LP. Sex- and method-specific reference values for right ventricular strain by 2-dimensional speckle-tracking echocardiography. Circulation: Cardiovascular Imaging 2016. 9 e003866 ( 10.1161/CIRCIMAGING.115.003866) [DOI] [PubMed] [Google Scholar]
- 41.Kjaergaard J. Assessment of right ventricular systolic function by tissue Doppler echocardiography. Danish Medical Journal 2012. 59 B4409 (available at: https://ugeskriftet.dk/dmj/assessment-right-ventricular-systolic-function-tissue-doppler-echocardiography) [PubMed] [Google Scholar]
- 42.Moceri P, Duchateau N, Baudouy D, Schouver ED, Leroy S, Squara F, Ferrari E, Sermesant M. Three-dimensional right-ventricular regional deformation and survival in pulmonary hypertension. European Heart Journal: Cardiovascular Imaging 2018. 19 450–458. ( 10.1093/ehjci/jex163) [DOI] [PubMed] [Google Scholar]
- 43.Nagata Y, Wu VC, Kado Y, Otani K, Lin FC, Otsuji Y, Negishi K, Takeuchi M. Prognostic value of right ventricular ejection fraction assessed by transthoracic 3D echocardiography. Circulation: Cardiovascular Imaging 2017. 10 ( 10.1161/CIRCIMAGING.116.005384) [DOI] [PubMed] [Google Scholar]
- 44.Shimada YJ, Shiota M, Siegel RJ, Shiota T. Accuracy of right ventricular volumes and function determined by three-dimensional echocardiography in comparison with magnetic resonance imaging: a meta-analysis study. Journal of the American Society of Echocardiography 2010. 23 943–953. ( 10.1016/j.echo.2010.06.029) [DOI] [PubMed] [Google Scholar]
- 45.Knight DS, Grasso AE, Quail MA, Muthurangu V, Taylor AM, Toumpanakis C, Caplin ME, Coghlan JG, Davar J. Accuracy and reproducibility of right ventricular quantification in patients with pressure and volume overload using single-beat three-dimensional echocardiography. Journal of the American Society of Echocardiography 2015. 28 363–374. ( 10.1016/j.echo.2014.10.012) [DOI] [PMC free article] [PubMed] [Google Scholar]
- 46.Ostenfeld E, Carlsson M, Shahgaldi K, Roijer A, Holm J. Manual correction of semi-automatic three-dimensional echocardiography is needed for right ventricular assessment in adults; validation with cardiac magnetic resonance. Cardiovascular Ultrasound 2012. 10 1 ( 10.1186/1476-7120-10-1) [DOI] [PMC free article] [PubMed] [Google Scholar]
- 47.Sugeng L, Mor-Avi V, Weinert L, Niel J, Ebner C, Steringer-Mascherbauer R, Bartolles R, Baumann R, Schummers G, Lang RM, et al Multimodality comparison of quantitative volumetric analysis of the right ventricle. JACC: Cardiovascular Imaging 2010. 3 10–18. ( 10.1016/j.jcmg.2009.09.017) [DOI] [PubMed] [Google Scholar]
- 48.Medvedofsky D, Mor-Avi V, Kruse E, Guile B, Ciszek B, Weinert L, Yamat M, Volpato V, Addetia K, Patel AR, et al Quantification of right ventricular size and function from contrast-enhanced three-dimensional echocardiographic images. Journal of the American Society of Echocardiography 2017. 30 1193–1202. ( 10.1016/j.echo.2017.08.003) [DOI] [PubMed] [Google Scholar]
- 49.Muraru D, Spadotto V, Cecchetto A, Romeo G, Aruta P, Ermacora D, Jenei C, Cucchini U, Iliceto S, Badano LP. New speckle-tracking algorithm for right ventricular volume analysis from three-dimensional echocardiographic data sets: validation with cardiac magnetic resonance and comparison with the previous analysis tool. European Heart Journal: Cardiovascular Imaging 2016. 17 1279–1289. ( 10.1093/ehjci/jev309) [DOI] [PubMed] [Google Scholar]
- 50.Maffessanti F, Muraru D, Esposito R, Gripari P, Ermacora D, Santoro C, Tamborini G, Galderisi M, Pepi M, Badano LP. Age-, body size-, and sex-specific reference values for right ventricular volumes and ejection fraction by three-dimensional echocardiography: a multicenter echocardiographic study in 507 healthy volunteers. Circulation: Cardiovascular Imaging 2013. 6 700–710. ( 10.1161/CIRCIMAGING.113.000706) [DOI] [PubMed] [Google Scholar]
- 51.Mor-Avi V, Sugeng L, Lindner JR. Imaging the forgotten chamber: is the devil in the boundary? Journal of the American Society of Echocardiography 2010. 23 141–143. ( 10.1016/j.echo.2009.12.021) [DOI] [PubMed] [Google Scholar]
- 52.Gopal AS, Chukwu EO, Iwuchukwu CJ, Katz AS, Toole RS, Schapiro W, Reichek N. Normal values of right ventricular size and function by real-time 3-dimensional echocardiography: comparison with cardiac magnetic resonance imaging. Journal of the American Society of Echocardiography 2007. 20 445–455. ( 10.1016/j.echo.2006.10.027) [DOI] [PubMed] [Google Scholar]
- 53.van Wolferen SA, van de Veerdonk MC, Mauritz GJ, Jacobs W, Marcus JT, Marques KMJ, Bronzwaer JGF, Heymans MW, Boonstra A, Postmus PE, et al Clinically significant change in stroke volume in pulmonary hypertension. Chest 2011. 139 1003–1009. ( 10.1378/chest.10-1066) [DOI] [PubMed] [Google Scholar]
- 54.Lang RM, Badano LP, Tsang W, Adams DH, Agricola E, Buck T, Faletra FF, Franke A, Hung J, de Isla LP, et al EAE/ASE recommendations for image acquisition and display using three-dimensional echocardiography. Journal of the American Society of Echocardiography 2012. 25 3–46. ( 10.1016/j.echo.2011.11.010) [DOI] [PubMed] [Google Scholar]
- 55.Willis J, Augustine D, Shah R, Stevens C, Easaw J. Right ventricular normal measurements: time to index? Journal of the American Society of Echocardiography 2012. 25 1259–1267. ( 10.1016/j.echo.2012.06.015) [DOI] [PubMed] [Google Scholar]
- 56.Qasem M, George K, Somauroo J, Forsythe L, Brown B, Oxborough D. Influence of different dynamic sporting disciplines on right ventricular Structure and function in elite male athletes. International Journal of Cardiovascular Imaging 2018. 34 1067–1074. ( 10.1007/s10554-018-1316-2) [DOI] [PubMed] [Google Scholar]
- 57.Zaidi A, Ghani S, Sharma R, Oxborough D, Panoulas VF, Sheikh N, Gati S, Papadakis M, Sharma S. Physiological right ventricular adaptation in elite athletes of African and Afro-Caribbean origin. Circulation 2013. 127 1783–1792. ( 10.1161/CIRCULATIONAHA.112.000270) [DOI] [PubMed] [Google Scholar]
- 58.Oxborough D, Augustine D, Gati S, George K, Harkness A, Mathew T, Papadakis M, Ring L, Robinson S, Sandoval J, et al A guideline update for the practice of echocardiography in the cardiac screening of sports participants: a joint policy statement from the British Society of Echocardiography and Cardiac Risk in the Young. Echo Research and Practice 2018. 5 G1–G10. ( 10.1530/ERP-17-0075) [DOI] [PMC free article] [PubMed] [Google Scholar]
- 59.Knight DS, Schwaiger JP, Krupickova S, Davar J, Muthurangu V, Coghlan JG. Accuracy and test-retest reproducibility of two-dimensional knowledge-based volumetric reconstruction of the right ventricle in pulmonary hypertension. Journal of the American Society of Echocardiography 2015. 28 989–998. ( 10.1016/j.echo.2015.02.020) [DOI] [PMC free article] [PubMed] [Google Scholar]
- 60.Giusca S, Dambrauskaite V, Scheurwegs C, D’Hooge J, Claus P, Herbots L, Magro M, Rademakers F, Meyns B, Delcroix M, et al Deformation imaging describes right ventricular function better than longitudinal displacement of the tricuspid ring. Heart 2010. 96 281–288. ( 10.1136/hrt.2009.171728) [DOI] [PubMed] [Google Scholar]
- 61.Fisher MR, Forfia PR, Chamera E, Housten-Harris T, Champion HC, Girgis RE, Corretti MC, Hassoun PM. Accuracy of Doppler echocardiography in the hemodynamic assessment of pulmonary hypertension. American Journal of Respiratory and Critical Care Medicine 2009. 179 615–621. ( 10.1164/rccm.200811-1691OC) [DOI] [PMC free article] [PubMed] [Google Scholar]
- 62.Lafitte S, Pillois X, Reant P, Picard F, Arsac F, Dijos M, Coste P, Dos Santos P, Roudaut R. Estimation of pulmonary pressures and diagnosis of pulmonary hypertension by Doppler echocardiography: a retrospective comparison of routine echocardiography and invasive hemodynamics. Journal of the American Society of Echocardiography 2013. 26 457–463. ( 10.1016/j.echo.2013.02.002) [DOI] [PubMed] [Google Scholar]


 This work is licensed under a