Abstract
Increased stiffness characterizes the early change in the arterial wall with subclinical atherosclerosis. Proteins inducing arterial stiffness in diabetes and hypercholesterolaemia are largely unknown. This study aimed at determining the pattern of protein expression in stiffening aorta of diabetic and hypercholesterolaemic mice. Male Ins2+/Akita mice were crossbred with ApoE−/− (Ins2+/Akita: ApoE−/−) mice. Relative aortic distension (relD) values were determined by ultrasound analysis and arterial stiffness modulators by immunoblotting. Compared with age‐ and sex‐matched C57/BL6 control mice, the aortas of Ins2+/Akita, ApoE−/− and Ins2+/Akita:ApoE−/− mice showed increased aortic stiffness. The aortas of Ins2+/Akita, ApoE−/− and Ins2+/Akita:ApoE−/− mice showed greater expression of VCAM‐1, collagen type III, NADPH oxidase and iNOS, as well as reduced elastin, with increased collagen type III‐to‐elastin ratio. The aorta of Ins2+/Akita and Ins2+/Akita:ApoE−/− mice showed higher expression of eNOS and cytoskeletal remodelling proteins, such as F‐actin and α‐smooth muscle actin, in addition to increased glycosylated aquaporin (AQP)‐1 and transcription factor NFAT5, which control the expression of genes activated by high glucose‐induced hyperosmotic stress. Diabetic and hypercholesterolaemic mice have increased aortic stiffness. The association of AQP1 and NFAT5 co‐expression with aortic stiffness in diabetes and hypercholesterolaemia may represent a novel molecular pathway or therapeutic target.
Keywords: arterial stiffening, cytoskeletal remodelling, diabetes, hypercholesterolaemia, hyperosmolarity, subclinical atherosclerosis
1. BACKGROUND
Compared with non‐diabetic individuals, diabetic patients suffer more aggressive, rapidly progressive atherosclerosis often with earlier complications, such as arterial stiffness.1, 2 This is because altered glucose metabolism in diabetes can modify and increase the impact of comorbidities, such as hypercholesterolaemia.3 In these patients at high risk of cardiovascular events, the identification of clinical and molecular markers that allow an early diagnosis of atherosclerosis is essential. Arterial stiffening is also an established clinical marker of early subclinical atherosclerosis.2, 4, 5
The arterial stiffness has been shown to be associated with hypertension6 and kidney disease.7 The underlying mechanisms may be attributed to (a) endothelial dysfunction leading to vasoconstriction; (b) oxidative stress and inflammatory factors;8 and (c) vascular calcifications.9 However, proteins that promote the arterial stiffening in diabetes and hypercholesterolaemia are less known. Pathogenetic mechanisms and biomarkers of early‐stage vascular abnormalities, such as arterial stiffening, can be identified through animal models of diabetes and hypercholesterolaemia.10 Cytoskeletal reorganization and arterial remodelling are adaptive responses to altered biomechanical stress. Reorganization of the vascular cytoskeleton is causally connected with arterial stiffening and contractile dysfunction.11 It can be favoured by an increase in wall stress or biomechanical stretching caused by high blood pressure.11 In diabetes, arterial remodelling can occur as the result of a chronic increase in wall stress or biomechanical stretching due to high glucose‐induced hyperosmolar stress, often fluctuating in uncontrolled diabetes. We have previously shown that concentrations of glucose up to 30.5 mmol/L, attainable under hyperglycaemic conditions, induce an up‐regulation of F‐actin, α‐smooth muscle actin (ASMA) and cytoskeletal remodelling in human‐induced pluripotent stem (iPS) cells.12 These effects appeared to be mediated through an aquaporin isoform 1 (AQP1)‐ and transcription factor nuclear factor of activated T cells 5 (NFAT5)‐dependent hyperosmolar stress which, through this mechanism, promotes cell migration.12 Thus, hyperosmolar stress can act as a most important biophysical factor that promotes cytoskeletal remodelling and the migration of vascular cells, such as vascular smooth muscle cells (VSMCs), within the arterial media. Directed migration of VSMCs requires a polarized reorganization of the cytoskeleton actin. From the six mammalian actin genes, the expression of VSMC‐specific cytoskeleton actin ASMA appears to be regulated by both CArG promoter elements, such as the transcriptional coactivator myocardin,13 and NFAT5.14 NFAT5, a rel/NF‐κB family member, is a transcription factor activated by hyperosmolar stress, which regulates the expression of osmosensing genes, including those involved in cell migration and cytoskeletal remodelling.12, 15, 16, 17, 18
In the present research, we sought to determine the impact of hypercholesterolaemia and diabetes on arterial wall stiffness in the aortas of genetic diabetes and hypercholesterolaemia mice models. We also analysed gene expression underlying arterial stiffening at the protein level, including the product of genes responsive to biomechanical stretch, such as high glucose‐induced hyperosmolar stress. Understanding changes in protein expression and molecular circuits activated by concomitantly present risk factors, such as hypercholesterolaemia and diabetes, may indicate new targets for diagnostic and therapeutic strategies aimed at early atherosclerosis in high‐risk patients.
2. METHODS
2.1. Materials
All chemicals were purchased from Sigma St Louis MO, unless otherwise specified.
2.2. Experimental animals
Ins2+/Akita heterozygous, C57BL/6J and apoE−/− homozygous mutation (apoE‐knockout) mice were originally obtained from The Jackson Laboratory (Bar Harbor, ME) ref 28, 29. All mice were on a C57BL/6J background. All procedures were approved by the Institutional Ethics Committee for Animal Research (Protocol number 11/2012/CEISA/COM). All animal experiments complied with the ARRIVE guidelines and were carried out in accordance with the United Kingdom Animals (Scientific Procedures) Act, 1986 and associated guidelines, the European Union (EU) Directive 2010/63/EU for animal experiments and the United States of America (USA) National Institutes of Health guide for the care and use of Laboratory animals (NIH Publications No. 8023, revised 1978).
2.3. Generation of Ins2+/Akita: ApoE−/− mice and study population
Diabetic male Ins2+/Akita: ApoE+/+ (Ins2+/Akita heterozygous mice) were crossed with non‐diabetic female Ins2+/+Akita: ApoE −/− mice (F0). The resulting F1 generation consisted of heterozygous apoE± (Ins2+/Akita:apoE± and Ins2+/+:apoE±) mice. From this F1 generation, diabetic male Ins2+/Akita:apoE± mice were crossed with non‐diabetic female Ins2+/+:apoE−/− mice. The resulting F2 generation consisted of homozygous apoE−/− (Ins2+/Akita:apoE−/− and Ins2+/+:apoE−/−) and heterozygous apoE± (Ins2+/Akita:apoE± and Ins2+/+: apoE±) mice. Subsequently, diabetic male Ins2+/Akita:apoE−/− mice (from F2 generation) and non‐diabetic female Ins2+/+:apoE−/− were set up as breeding pairs to produce an F3 generation of diabetic Ins2+/Akita:apoE−/− mice and non‐diabetic control Ins2+/+:apoE−/− mice. For the present study, we used male mice from the F3 generation (diabetic and non‐diabetic control) because male Ins2+/Akita mice exhibit a more severe and homogeneous diabetic phenotypes compared with female mice.19 The study population comprised male wild‐type C57BL/6 mice (bodyweight: 15 ± 4 g, age: 3 months; n = 3), male Ins2+/Akita diabetic mice (bodyweight: 11 ± 2 g, n = 3), male apoE−/− mice (bodyweight: 21 ± 5 g, n = 3) and male Ins2+/Akita:apoE−/− mice (bodyweight: 19 ± 2 g, n = 3). All animals were specific pathogen‐free and kept in a temperature‐controlled environment in a ventilated rack with a 12‐h:12‐h light:dark cycle. Mice had free access to water and standard rodent chow diet (Teklad 2018; Harlan Laboratories), which contains <0.1% cholesterol and fat as 18% of total calories. Genotypes were determined by polymerase chain reaction (PCR) amplification of tail DNA using protocols provided by The Jackson Laboratory. The diabetic phenotype was confirmed in mice at 4‐5 weeks after birth by blood glucose values >250 mg/dL with a hand‐held glucometer (Contour; Bayer Health Care) measured with a drop of blood from tail puncture. The hypercholesterolaemic phenotype was confirmed by total cholesterol values >150 mg/dL. The disease penetrance was 100% in mice with the Ins2Akita mutation.20
2.4. Biochemical assays
Plasma glucose, total cholesterol and triglyceride concentrations were measured using an enzymatic colorimetric method by Vitros DT60 II Chemistry System (Ortho‐Clinical Diagnostics) according to the manufacturer's instructions (Table 1).
Table 1.
Phenotypic and biochemical characteristics of Ins2+/Akita, ApoE−/− and Ins2+/Akita:ApoE−/− mice
| C57/BL6 control | Ins2+/Akita | ApoE−/− | Ins2+/Akita:ApoE−/− | |
|---|---|---|---|---|
| Bodyweight, g | 30 ± 0.5 | 22 ± 0.3 | 35 ± 0.7 | 26 ± 0.5 |
| Fasted plasma glucose, mg/dL | 110 ± 10 | 350 ± 20* | 150 ± 15 | 390 ± 25* |
| Fasted plasma total cholesterol, mg/dL | 105 ± 5 | 125 ± 8 | 425 ± 25* | 625 ± 15*, § |
| Fasted plasma triglyceride, mg/dL | 89 ± 7 | 105 ± 5 | 95 ± 6 | 103 ± 10 |
Data shown are mean ± SD (n = 7 mice/group). To determine plasma glucose and lipid levels, tail blood samples were collected from each group of mice under fasting conditions.
Abbreviation: ApoE, apolipoprotein E.
P < .05 vs C57/BL6 control mice.
P < .05 vs ApoE−/− mice.
2.5. Mouse ultrasound imaging
Transthoracic ultrasound imaging on wild‐type C57BL/6 male mice and sex/age‐matched Ins2+/Akita, apoE−/− and Ins2+/Akita:apoE−/− mice was performed to determine systolic and diastolic aortic diameters. Two‐dimensional and M‐mode echocardiographic images were recorded and analysed using a portable ultrasound apparatus (Esaote) equipped with a 21‐MHz linear probe. Images were obtained in the parasternal long‐axis view. Aortic diameter instantaneous values were derived from B‐mode images and were recorded in late systole and late diastole using edge detection.21 Mean diameter (Dm) and relative distension (relD) values (this latter considered as a surrogate marker for arterial stiffness) were evaluated from the obtained diameter waveforms; relD was calculated as (Ds − Dd)/Dd and expressed as a percentage (where Ds is the diameter in systole and Dd the diameter in diastole). After measurements, mice were killed, and their aorta excised for protein extraction.
2.6. Immunoblotting
Total proteins from aortas, harvested from wild‐type C57BL/6 male mice and sex/age‐matched Ins2+/Akita, apoE−/− and Ins2+/Akita:apoE−/− mice, were isolated, electroblotted and incubated with the following primary and secondary antibodies: (a) mouse monoclonal anti‐collagen type III (dilution 1:2000, Sigma Aldrich); (b) mouse monoclonal anti‐elastin (dilution 1:2000, Sigma Aldrich); (c) mouse monoclonal anti‐AQP1 (dilution 1:600, Santa Cruz Biotechnologies); (d) rabbit polyclonal anti‐F‐Actin (dilution 1:500, Santa Cruz); (e) mouse policlonal anti‐eNOS (dilution 1:2500, BD Transduction Laboratories, San Jose, CA); (f) rabbit polyclonal anti‐VCAM‐1 (dilution 1:600, Santa Cruz); (g) rabbit polyclonal anti‐ICAM‐1 (dilution 1:600, Santa Cruz); (h) mouse monoclonal anti‐IL‐1β (dilution 1:200, R&D Systems); (i) mouse monoclonal anti‐TNF‐α (dilution 1:200, R&D Systems); (j) rabbit monoclonal anti‐NADPH oxidase (dilution 1:1000, Abcam); (k) rabbit polyclonal anti‐NFAT5 (dilution 1:600, Santa Cruz); (l) mouse policlonal iNOS (dilution 1:2500, BD Transduction Laboratories); (m) rabbit monoclonal anti‐NFAT5 (dilution 1:600, Santa Cruz); (n) mouse monoclonal anti‐ASMA (dilution 1:2000, Sigma Aldrich); (o) mouse monoclonal anti‐β‐actin (Sigma); and (p) mouse anti‐GAPDH (dilution 1:5000, Ambion), as previously described.22
2.7. Statistical analysis
Groups were compared by one‐way analysis of variance followed by Scheffé's test for multiple comparisons. Statistical significance was defined as P < .05.
3. RESULTS
3.1. Aortic stiffness
To develop a murine model that can be used to study the role of diabetes and hypercholesterolaemia in aortic stiffness and in its protein expression, diabetic hypercholesterolaemic male Ins2+/Akita:apoE−/− mice and non‐diabetic hypercholesterolaemic female Ins2+/+:apoE−/− were crossed to produce diabetic hypercholesterolaemic Ins2+/Akita:apoE−/− mice (Table 1). Three‐month‐old apoE−/− and Ins2+/Akita mice had significantly lower relative distension (relD) values than non‐diabetic non‐hypercholesterolaemic control mice (Figure 1). The combination of the two comorbidities further reduced aortic distension: compared with Ins2+/Akita mice and apoE−/− mice, relD values were more than halved in Ins2+/Akita:apoE−/− mice (Figure 1).
Figure 1.
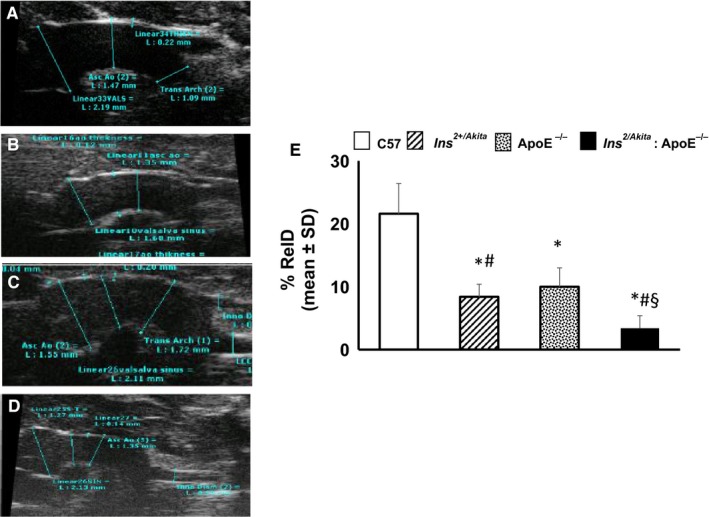
Aortic stiffness. B‐mode image sequence of the aortas was used to measure diameters and distension in Ins2Akita, ApoE−/− and Ins2Akita: ApoE−/− mice and from sex‐ and age‐matched (3 months old) C57BL/6 non‐diabetic non‐hypercholesterolaemic control mice. A‐D shows representative aorta images from sex‐ and age‐matched (3 months old) C57BL/6 non‐diabetic control mice (A), Ins2Akita mice (B), ApoE−/− mice (C) and Ins2Akita: ApoE−/− mice (D). E, The bar graph represents the mean ± SD of each relative distension (relD) values from 3 separate experiments. *P < .05 vs C57BL/6 control mice; #P < .05 vs ApoE−/− mice; §P < .05 vs Ins2Akita mice and ApoE−/− mice; N = 8 mice/group
3.2. Structural proteins
Collagen and elastin are the main structural proteins related to aortic stiffness. Abnormalities in the quantity and quality of collagen and elastin contribute to aortic stiffening.23 The aortas of 3‐month‐old apoE−/− and Ins2+/Akita mice had significantly higher levels of collagen type III (Figure 2A) and lower levels of elastin (Figure 2B), with increased collagen type III‐to‐elastin ratio (Figure 2C) than non‐diabetic, non‐hypercholesterolaemic control mice. The combination of the two comorbidities further modified the expression of these proteins and their ratio, as levels of collagen type III and elastin were higher and lower in Ins2+/Akita:apoE−/− mice compared with Ins2+/Akita mice and apoE−/− mice, respectively (Figure 2).
Figure 2.
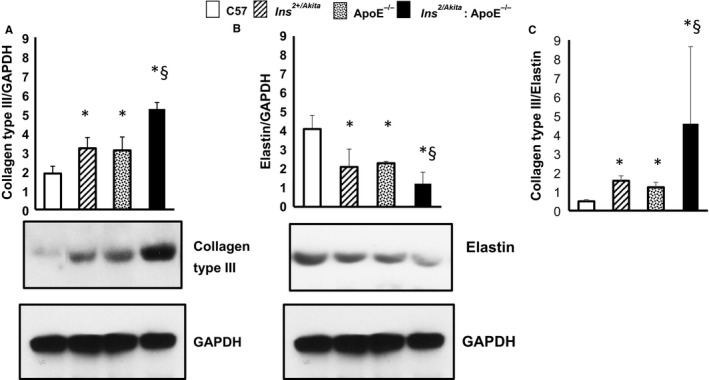
Expression of collagen type III and elastin. Western analysis of (A) collagen type III, (B) elastin expression and (C) collagen type III/elastin ratio in aortas from Ins2Akita, ApoE−/− and Ins2Akita: ApoE−/− mice and from sex‐ and age‐matched (3 months old) C57BL/6 non‐diabetic control mice, with GAPDH serving as a loading control. The bar graph represents for each value the mean ± SD from 3 separate experiments. *P < .05 vs C57BL/6 control mice; #P < .05 vs ApoE−/− mice; §P < .05 vs Ins2Akita mice and ApoE−/− mice; N = 8 mice/group
3.3. VCAM‐1
An increased expression of pro‐inflammatory cytokines and adhesion molecules has been suggested to contribute to collagen quality abnormalities, which can destabilize collagen fibres in the vascular wall.24, 25 While there were no apparent changes in the expression of monocyte chemotactic protein‐1, intercellular adhesion molecule (ICAM‐1), tumour necrosis factor α and interleukin‐1 in the aortas of apoE−/− and Ins2+/Akita mice (Figure 3B‐D), the expression of vascular cell adhesion molecule (VCAM)‐1 was significantly higher in Ins2+/Akita mice and apoE−/− mice than in non‐diabetic non‐hypercholesterolaemic control mice (Figure 3A). The combination of the two comorbidities further increased the expression of VCAM‐1, as the levels of this early pro‐inflammatory adhesion protein were higher in Ins2+/Akita:apoE−/− mice compared with Ins2+/Akita mice and apoE−/− mice (Figure 3A).
Figure 3.
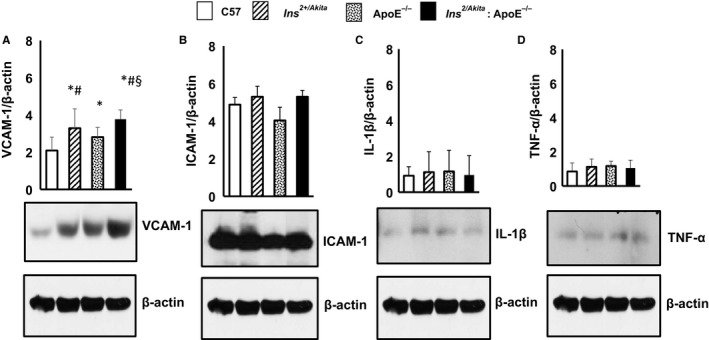
Expression of VCAM‐1, ICAM‐1, IL‐1β and TNF‐α. Western analysis of (A) VCAM‐1 (B) ICAM‐1, (C) IL‐1β and (D) TNF‐α expression in aortas from Ins2Akita, ApoE−/− and Ins2Akita: ApoE−/− mice and from sex‐ and age‐matched (3 months old) C57BL/6 non‐diabetic control mice, with β‐actin serving as a loading control. The bar graph represents for each value the mean ± SD from 3 separate experiments. *P < .05 vs C57BL/6 control mice; #P < .05 vs ApoE−/− mice; §P < .05 vs Ins2Akita mice and ApoE−/− mice; N = 8 mice/group
3.4. Nitric oxide synthase and NADPH oxidase
Increased formation of reactive oxygen species (ROS), including peroxynitrite and nitrotyrosine, may contribute to abnormalities in the quality and destabilization of collagen fibres in the vascular wall.24, 25 NAD(P)H oxidases produce O2 − and play a major role in ROS generation and oxidative stress. Increased nitric oxide (NO) synthesis and reduced NO bioavailability, which leads to an increase in the NO pool, have been demonstrated in diabetes.26, 27 Such excess of NO can cause the formation of peroxynitrite and nitrotyrosine. The aortas of 3‐month‐old apoE−/− and Ins2+/Akita mice had significantly higher levels of iNOS and NADPH oxidase than non‐diabetic non‐hypercholesterolaemic control mice (Figure 4A). The combination of diabetes and hypercholesterolaemia further increased the expression of iNOS and NADPH oxidase, as the levels of these proteins were higher in Ins2+/Akita:apoE−/− mice compared with Ins2+/Akita mice and apoE−/− mice (Figure 4A). Interestingly, only the aorta of Ins2+/Akita mice and Ins2+/Akita:ApoE−/− mice showed greater expression of eNOS (Figure 4B), suggesting that the up‐regulation of both iNOS and eNOS may contribute to the increased NO pool in diabetic animal models with chronic hyperglycaemia.
Figure 4.
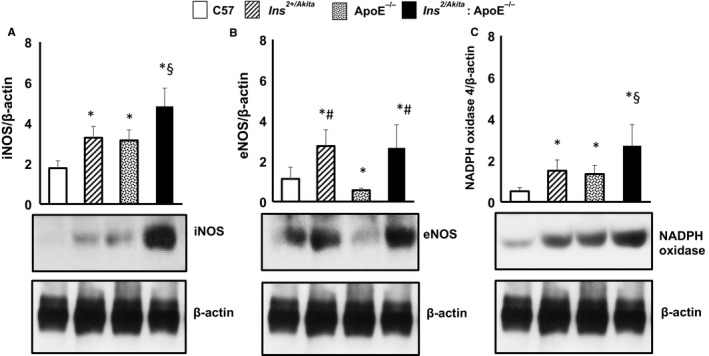
Expression of iNOS, eNOS and NADPH oxidase. Western analysis of (A) iNOS, (B) eNOS and (C) NADPH oxidase expression in aortas from Ins2Akita, ApoE−/− and Ins2Akita: ApoE−/− mice and from sex‐ and age‐matched (3 months old) C57BL/6 non‐diabetic control mice, with β‐actin serving as a loading control. The bar graph represents for each value the mean ± SD from three separate experiments. *P < .05 vs C57BL/6 control mice; #P < .05 vs ApoE−/− mice; §P < .05 vs Ins2Akita mice and ApoE−/− mice; N = 8 mice/group
3.5. Cytoskeletal remodelling and expression of AQ1 and NFAT5
Arterial stiffening depends on cytoskeletal remodelling besides the accumulation of collagen. Cytoskeletal remodelling requires a polarized reorganization of cytoskeletal actin, which involves the switch from globular actin (G‐actin) to filamentous actin (F‐actin) and the increased synthesis of VSMC‐specific cytoskeletal ASMA. AQP1 and NFAT5 are key proteins that regulate cellular homeostasis and the expression of hypertonicity‐responsive genes, including the cytoskeleton‐remodelling proteins F‐actin and ASMA. In our murine model of diabetes and hypercholesterolaemia, only the aorta of Ins2+/Akita mice and Ins2+/Akita: ApoE−/− mice featured greater expressions of ASMA (Figure 5A) and F‐actin (Figure 5B). In parallel, the aorta of Ins2+/Akita mice and Ins2+/Akita: ApoE−/− mice showed a higher expression of glycosylated AQP1 (Figure 6A) and NFAT5 (Figure 6B).
Figure 5.
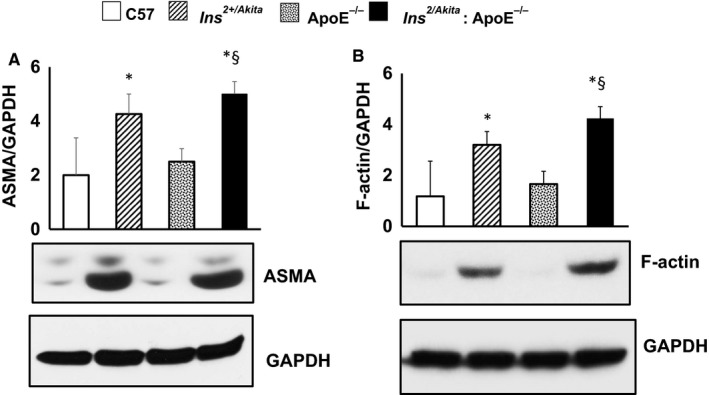
Expression of smooth muscle α‐actin and F‐actin. Western analysis of (A) smooth muscle α‐actin (ASMA) and (B) F‐actin expression in aortas from Ins2Akita, ApoE−/− and Ins2Akita: ApoE−/− mice and from sex‐ and age‐matched (3 months old) C57BL/6 non‐diabetic control mice, with GAPDH serving as a loading control. The bar graph represents for each value the mean ± SD from three separate experiments. *P < .05 vs C57BL/6 control mice; §P < .05 vs Ins2Akita mice and ApoE−/− mice; N = 8 mice/group
Figure 6.
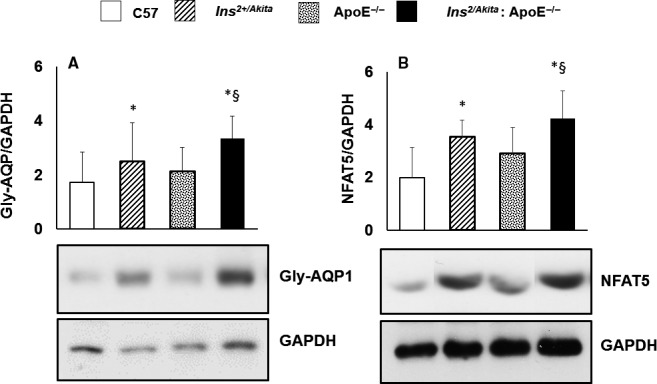
Expression of glycosylated AQP1 isoform and NFAT5. Western analysis of glycosylated AQP1 isoform and NFAT5 expression in aortas Ins2Akita, ApoE−/− and Ins2Akita: ApoE−/− mice and from sex‐ and age‐matched (3 months old) C57BL/6 non‐diabetic control mice, with GAPDH serving as a loading control. The bar graph represents for each value the mean ± SD from three separate experiments. *P < .05 vs C57BL/6 control mice and ApoE−/− mice; §P < .05 vs Ins2Akita mice and ApoE−/− mice; N = 8 mice/group
4. DISCUSSION
The current study demonstrates, for the first time in literature, that diabetic hypercholesterolaemic Ins2+/Akita: ApoE−/− mice are characterized by increased arterial stiffness, in a manner associated with up‐regulation of hypertonicity‐responsive factors, such as AQ1 and NFAT5, along with genes implicated in early inflammation and atherosclerosis, such as VCAM‐1; cytoskeletal remodelling, such as F‐actin and ASMA; endothelial dysfunction, such as iNOS and eNOS; and ROS generation, such as NADPH oxidase. These findings suggest that (a) diabetes and hypercholesterolaemia add on and perhaps synergize in inducing aortic stiffening; (b) the biomechanical stretch due to hyperglycaemia‐induced hyperosmolar stress is specifically associated with aortic stiffening in diabetes; and (c) the hypertonicity‐responsive transcription factor NFAT5 may play a key role in cytoskeletal remodelling and the subsequent arterial stiffening in diabetes.
Several factors can determine the increase in arterial stiffness, including decreased synthesis of elastin, increased collagen content and altered organization of elastic and collagen fibres.30, 31 In the present study, we analysed the expression of collagen type III and elastin, which are the main structural proteins in the aortic wall, using Western analysis. In the aortas of diabetic and hypercholesterolaemic mice, we observed quantitative changes in the collagen and elastin contents, associated with the up‐regulation of early pro‐inflammatory and pro‐atherogenic molecules, such as VCAM‐1, and increased expression of nitric oxide synthases iNOS and eNOS, and NADPH oxidase. VCAM‐1 is an early pro‐inflammatory molecule that plays a key pro‐atherogenic role in macrophage infiltration in the aortic wall.32 The up‐regulation of iNOS and eNOS leads to increased NO pool, with consequent formation of peroxynitrite and nitrotyrosine and increased oxidative stress in the aortic wall.26, 27 The up‐regulation of NADPH oxidases contributes to increased oxidative stress. Inflammation and oxidative stress have been shown to cause abnormalities in the quality of collagen fibres and a disarray of elastic fibres, due to elastolysis, which in turn impairs the elastic properties and the structural integrity of the aortic wall, leading to arterial stiffening.33 Our results imply that diabetes and hypercholesterolaemia can both contribute to arterial stiffening at least in part through inflammation and increased oxidative stress in the aortic wall, leading to abnormalities in the quality of elastic and collagen fibres. These effects might be aggravated in ageing, although in our study we did not analyse the influence of ageing as a comorbidity.
Here, we provide the first evidence that NFAT5 and AQP1 are involved in the hypertonicity‐related induction of arterial stiffening, since NFAT5 and AQP1 were increased in the aortas of diabetic Ins2+/Akita mice exposed to high glucose‐induced hyperosmolar stress, independent of the presence of hypercholesterolaemia. AQP1 is a water channel protein expressed widely in vascular endothelia and smooth muscle cells, where it increases cell membrane water permeability, as well as cell motility and migration, and regulates cellular homeostasis during osmolarity changes.12, 34 NFAT5 is a transcription factor that regulates cellular homeostasis in response to hyperosmolar stress.15, 35, 36, 37, 38 Furthermore, NFAT5 regulates cell migration and the expression of cytoskeletal proteins, including actins, in several cell types, including VSMCs 14 and iPS cells under high glucose‐induced hyperosmolar conditions.12 Thus, in conditions of increased wall stress, such as arterial hypertension 11, 39 or high glucose‐induced hyperosmolar stress (as shown in the present study), NFAT5 contributes to the transition of VSMCs in the arterial media from quiescence to a motility state. These changes, together with wall thickening, characterize vascular remodelling and arterial stiffening,11, 40 and are controlled by a wide range of transcription factors, such as AP‐1, serum response factor and myocardin.41, 42 In this context, we revealed that the hyperosmolar stretch‐stimulated aortic wall responds by enhancing protein abundance of NFAT5, in line with observations made by other research groups.43 Our results suggest that cytoskeletal remodelling is a specific mechanism of aortic stiffening in diabetes, with AQP1 and NFAT5 as main candidates involved in the specific cell signalling leading to an up‐regulation of cytoskeleton‐remodelling proteins.
We acknowledge some limitations of our study. First, ours is a cross‐sectional study; thus, proteins that have been shown to be modulated by diabetes and hypercholesterolaemia could play a role as biomarkers rather than to be a direct cause of arterial stiffening. Thus, the mechanisms through which the up‐regulated proteins shown here as associated with aortic stiffening operate on vascular disease are still incompletely worked out and deserve further investigation. Second, we still need to show that in vivo disruption of the AQP1/NFAT5 signalling, shown here as associated with aortic stiffening in diabetic mice, will mitigate in vivo vascular disease in response to high glucose. The absence of AQP1 and NFAT1 knockout mice having the comorbidities of diabetes and hypercholesterolaemia complicates the performance of this type of experiments. A possible solution might be the use of specific drugs for AQP1 and NFAT5, currently not available.
5. CONCLUSION
Diabetic and hypercholesterolaemic Ins2+/Akita: ApoE−/− mice develop aortic stiffening, associated with up‐regulation of hypertonicity‐responsive gene such as AQ1 and NFAT5, along with genes implicated in early inflammation and atherosclerosis, such as VCAM‐1; cytoskeletal remodelling, such as F‐actin and ASMA; endothelial dysfunction, such as iNOS and eNOS; and ROS generation such as NADPH oxidase. These changes in gene expression may be important mechanisms leading to the development of arterial stiffening in diabetes and hypercholesterolaemia.
CONFLICT OF INTEREST
PF is the founder and CEO of Pharmahungary Group, a group of R&D companies.
AUTHOR CONTRIBUTIONS
Rosalinda Madonna designed and performed the experiments, analysed the data and wrote the manuscript. Vanessa Doria performed in vitro experiments and analysed the data. Nino Cocco analysed the data, provided advice. Anikó Görbe, Péter Ferdinandy, Yong‐Jian Geng and Sante Donato Pierdomenico analysed the data, provided advice support, corrected the final manuscript. Raffaele De Caterina analysed the data, provided advice and financial support, and reviewed and corrected the final manuscript.
ETHICAL APPROVAL
All procedures were approved by the Institutional Ethics Committee for Animal Research (Protocol number 11/2012/CEISA/COM).
Madonna R, Doria V, Görbe A, et al. Co‐expression of glycosylated aquaporin‐1 and transcription factor NFAT5 contributes to aortic stiffness in diabetic and atherosclerosis‐prone mice. J Cell Mol Med. 2020;24:2857–2865. 10.1111/jcmm.14843
Funding information
Institutional funds from the Center of Excellence on Aging and Regenerative Medicine (CeSI‐Met), “G. d'Annunzio” University Chieti, Italy (to RDC.).
DATA AVAILABILITY STATEMENT
Original data are available upon request from the journal.
REFERENCES
- 1. Lee CH, Lee SW, Park SW. Diabetes and subclinical coronary atherosclerosis. Diabetes Metab J. 2018;42:355‐363. [DOI] [PMC free article] [PubMed] [Google Scholar]
- 2. Madonna R, Selvaggio S, Selvaggio G, Coronelli M, Cocco N. "State‐of‐Art" paper of the Italian Working Group on Atherosclerosis: preclinical assessment of early coronary atherosclerosis. Int J Cardiol. 2016;214:442‐447. [DOI] [PubMed] [Google Scholar]
- 3. Dobrian A, Simionescu M. Irreversibly glycated albumin alters the physico‐chemical characteristics of low density lipoproteins of normal and diabetic subjects. Biochim Biophys Acta. 1995;1270:26‐35. [DOI] [PubMed] [Google Scholar]
- 4. Nurnberger J, Kribben A, Philipp T, Erbel R. [Arterial compliance (stiffness) as a marker of subclinical atherosclerosis]. Herz. 2007;32:379‐386. [DOI] [PubMed] [Google Scholar]
- 5. Camplain R, Meyer ML, Tanaka H, et al. Smoking behaviors and arterial stiffness measured by pulse wave velocity in older adults: the Atherosclerosis Risk in Communities (ARIC) study. Am J Hypertens. 2016;29:1268‐1275. [DOI] [PMC free article] [PubMed] [Google Scholar]
- 6. Laurent S, Boutouyrie P, Lacolley P. Structural and genetic bases of arterial stiffness. Hypertension. 2005;45:1050‐1055. [DOI] [PubMed] [Google Scholar]
- 7. Demer LL, Tintut Y, Parhami F. Novel mechanisms in accelerated vascular calcification in renal disease patients. Curr Opin Nephrol Hypertens. 2002;11:437‐443. [DOI] [PubMed] [Google Scholar]
- 8. Oh YS. Arterial stiffness and hypertension. Clin Hypertens. 2018;24:17. [DOI] [PMC free article] [PubMed] [Google Scholar]
- 9. London GM. Arterial stiffness in chronic kidney disease and end‐stage renal disease. Blood Purif. 2018;45:154‐158. [DOI] [PubMed] [Google Scholar]
- 10. Baylis RA, Gomez D, Owens GK. Shifting the focus of preclinical, murine atherosclerosis studies from prevention to late‐stage intervention. Circ Res. 2017;120:775‐777. [DOI] [PMC free article] [PubMed] [Google Scholar]
- 11. Olivetti G, Melissari M, Marchetti G, Anversa P. Quantitative structural changes of the rat thoracic aorta in early spontaneous hypertension. Tissue composition, and hypertrophy and hyperplasia of smooth muscle cells. Circ Res. 1982;51:19‐26. [DOI] [PubMed] [Google Scholar]
- 12. Madonna R, Geng YJ, Shelat H, Ferdinandy P, De Caterina R. High glucose‐induced hyperosmolarity impacts proliferation, cytoskeleton remodeling and migration of human induced pluripotent stem cells via aquaporin‐1. Biochim Biophys Acta. 2014;1842:2266‐2275. [DOI] [PubMed] [Google Scholar]
- 13. Li S, Wang DZ, Wang Z, Richardson JA, Olson EN. The serum response factor coactivator myocardin is required for vascular smooth muscle development. Proc Natl Acad Sci U S A. 2003;100:9366‐9370. [DOI] [PMC free article] [PubMed] [Google Scholar]
- 14. Halterman JA, Kwon HM, Zargham R, Bortz PDS, Wamhoff BR. Nuclear factor of activated T cells 5 regulates vascular smooth muscle cell phenotypic modulation. Arterioscler Thromb Vasc Biol. 2011;31:2287‐2296. [DOI] [PMC free article] [PubMed] [Google Scholar]
- 15. Miyakawa H, Woo SK, Dahl SC, Handler JS, Kwon HM. Tonicity‐responsive enhancer binding protein, a rel‐like protein that stimulates transcription in response to hypertonicity. Proc Natl Acad Sci U S A. 1999;96:2538‐2542. [DOI] [PMC free article] [PubMed] [Google Scholar]
- 16. Jauliac S, Lopez‐Rodriguez C, Shaw LM, Brown LF, Rao A, Toker A. The role of NFAT transcription factors in integrin‐mediated carcinoma invasion. Nat Cell Biol. 2002;4:540‐544. [DOI] [PubMed] [Google Scholar]
- 17. Go WY, Liu X, Roti MA, Liu F, Ho SN. NFAT5/TonEBP mutant mice define osmotic stress as a critical feature of the lymphoid microenvironment. Proc Natl Acad Sci U S A. 2004;101:10673‐10678. [DOI] [PMC free article] [PubMed] [Google Scholar]
- 18. O'Connor RS, Mills ST, Jones KA, Ho SN, Pavlath GK. A combinatorial role for NFAT5 in both myoblast migration and differentiation during skeletal muscle myogenesis. J Cell Sci. 2007;120:149‐159. [DOI] [PubMed] [Google Scholar]
- 19. Yoshioka M, Kayo T, Ikeda T, Koizumi A. A novel locus, Mody4, distal to D7Mit189 on chromosome 7 determines early‐onset NIDDM in nonobese C57BL/6 (Akita) mutant mice. Diabetes. 1997;46:887‐894. [DOI] [PubMed] [Google Scholar]
- 20. Wang J, Takeuchi T, Tanaka S, et al. A mutation in the insulin 2 gene induces diabetes with severe pancreatic beta‐cell dysfunction in the Mody mouse. J Clin Invest. 1999;103:27‐37. [DOI] [PMC free article] [PubMed] [Google Scholar]
- 21. Faita F, Di Lascio N, Rossi C, Kusmic C, Solini A. Ultrasonographic characterization of the db/db mouse: an animal model of metabolic abnormalities. J Diabetes Res. 2018;2018:4561309. [DOI] [PMC free article] [PubMed] [Google Scholar]
- 22. Madonna R, Giovannelli G, Confalone P, Renna FV, Geng YJ, De Caterina R. High glucose‐induced hyperosmolarity contributes to COX‐2 expression and angiogenesis: implications for diabetic retinopathy. Cardiovasc Diabetol. 2016;15:18. [DOI] [PMC free article] [PubMed] [Google Scholar]
- 23. Prockop DJ, Kivirikko KI. Collagens: molecular biology, diseases, and potentials for therapy. Annu Rev Biochem. 1995;64:403‐434. [DOI] [PubMed] [Google Scholar]
- 24. Collins C, Osborne LD, Guilluy C, et al. Haemodynamic and extracellular matrix cues regulate the mechanical phenotype and stiffness of aortic endothelial cells. Nat Commun. 2014;5:3984. [DOI] [PMC free article] [PubMed] [Google Scholar]
- 25. Rodríguez C, Alcudia JF, Martínez‐González J, Raposo B, Navarro MA, Badimon L. Lysyl oxidase (LOX) down‐regulation by TNFalpha: a new mechanism underlying TNFalpha‐induced endothelial dysfunction. Atherosclerosis. 2008;196:558‐564. [DOI] [PubMed] [Google Scholar]
- 26. Nagareddy PR, Xia Z, McNeill JH, MacLeod KM. Increased expression of iNOS is associated with endothelial dysfunction and impaired pressor responsiveness in streptozotocin‐induced diabetes. Am J Physiol Heart Circ Physiol. 2005;289:H2144‐H2152. [DOI] [PubMed] [Google Scholar]
- 27. Pandolfi A, De Filippis EA. Chronic hyperglicemia and nitric oxide bioavailability play a pivotal role in pro‐atherogenic vascular modifications. Genes Nutr. 2007;2:195‐208. [DOI] [PMC free article] [PubMed] [Google Scholar]
- 28. Johnson LA, Maeda N. Macrovascular complications of diabetes in atherosclerosis prone mice. Expert Rev Endocrinol Metab. 2010;5:89‐98. [DOI] [PubMed] [Google Scholar]
- 29. Jun JY, Ma Z, Segar L. Spontaneously diabetic Ins2(+/Akita):apoE‐deficient mice exhibit exaggerated hypercholesterolemia and atherosclerosis. Am J Physiol Endocrinol Metab. 2011;301:E145‐E154. [DOI] [PMC free article] [PubMed] [Google Scholar]
- 30. Cattell MA, Anderson JC, Hasleton PS. Age‐related changes in amounts and concentrations of collagen and elastin in normotensive human thoracic aorta. Clin Chim Acta. 1996;245:73‐84. [DOI] [PubMed] [Google Scholar]
- 31. Gaballa MA, Jacob CT, Raya TE, Liu J, Simon B, Goldman S. Large artery remodeling during aging: biaxial passive and active stiffness. Hypertension. 1998;32:437‐443. [DOI] [PubMed] [Google Scholar]
- 32. De Caterina R, Basta G, Lazzerini G, et al. Soluble vascular cell adhesion molecule‐1 as a biohumoral correlate of atherosclerosis. Arterioscler Thromb Vasc Biol. 1997;17:2646‐2654. [DOI] [PubMed] [Google Scholar]
- 33. Diez J. Arterial stiffness and extracellular matrix. Adv Cardiol. 2007;44:76‐95. [DOI] [PubMed] [Google Scholar]
- 34. Carter EP, Olveczky BP, Matthay MA, Verkman AS. High microvascular endothelial water permeability in mouse lung measured by a pleural surface fluorescence method. Biophys J. 1998;74:2121‐2128. [DOI] [PMC free article] [PubMed] [Google Scholar]
- 35. Lopez‐Rodriguez C, Aramburu J, Rakeman AS, Rao A. NFAT5, a constitutively nuclear NFAT protein that does not cooperate with Fos and Jun. Proc Natl Acad Sci U S A. 1999;96:7214‐7219. [DOI] [PMC free article] [PubMed] [Google Scholar]
- 36. Dahl SC, Handler JS, Kwon HM. Hypertonicity‐induced phosphorylation and nuclear localization of the transcription factor TonEBP. Am J Physiol Cell Physiol. 2001;280:C248‐C253. [DOI] [PubMed] [Google Scholar]
- 37. Ferraris JD, Williams CK, Persaud P, Zhang Z, Chen Y, Burg MB. Activity of the TonEBP/OREBP transactivation domain varies directly with extracellular NaCl concentration. Proc Natl Acad Sci U S A. 2002;99:739‐744. [DOI] [PMC free article] [PubMed] [Google Scholar]
- 38. Lee SD, Colla E, Sheen MR, Na KY, Kwon HM. Multiple domains of TonEBP cooperate to stimulate transcription in response to hypertonicity. J Biol Chem. 2003;278:47571‐47577. [DOI] [PubMed] [Google Scholar]
- 39. Haudenschild CC, Grunwald J, Chobanian AV. Effects of hypertension on migration and proliferation of smooth muscle in culture. Hypertension. 1985;7:I101‐I104. [DOI] [PubMed] [Google Scholar]
- 40. Intengan HD, Schiffrin EL. Structure and mechanical properties of resistance arteries in hypertension: role of adhesion molecules and extracellular matrix determinants. Hypertension. 2000;36:312‐318. [DOI] [PubMed] [Google Scholar]
- 41. Wang Z, Wang DZ, Hockemeyer D, McAnally J, Nordheim A, Olson EN. Myocardin and ternary complex factors compete for SRF to control smooth muscle gene expression. Nature. 2004;428:185‐189. [DOI] [PubMed] [Google Scholar]
- 42. Demicheva E, Hecker M, Korff T. Stretch‐induced activation of the transcription factor activator protein‐1 controls monocyte chemoattractant protein‐1 expression during arteriogenesis. Circ Res. 2008;103:477‐484. [DOI] [PubMed] [Google Scholar]
- 43. Scherer C, Pfisterer L, Wagner AH, et al. Arterial wall stress controls NFAT5 activity in vascular smooth muscle cells. J Am Heart Assoc. 2014;3:e000626. [DOI] [PMC free article] [PubMed] [Google Scholar]
Associated Data
This section collects any data citations, data availability statements, or supplementary materials included in this article.
Data Availability Statement
Original data are available upon request from the journal.


