

Abstract
Background.
Rural communities in the United States have been disproportionately affected by the opioid crisis. Little research has explored the relationship between polysubstance use and overdose experiences among people who inject drugs (PWID) in rural communities. We sought to identify classes of polysubstance drug use among rural PWID and evaluate the associations between polysubstance drug use classes, recent overdose experiences, and receipt of take-home naloxone (THN).
Methods.
We surveyed 420 PWID (June-July 2018) who had injected drugs in the previous 6 months in Cabell County, West Virginia. Participants were recruited from the local syringe services program and through street-based recruitment. We conducted a latent class analysis using 9 measures of injection and non-injection drug use and tested for associations with having experienced an overdose in the past 6 months and having received THN in the past 6 months.
Results.
We identified four substance use classes in our sample: polydrug/polyroute use (35.0% of the sample), polyroute stimulant/injection opioid use (33.3%), polyroute stimulant use (20.3%), and injection opioid use (11.3%). Overall, 42.6% of the sample had experienced an overdose in the past 6 months. The classes differed in terms of overdose (χ=91.53, p<0.001), with the polydrug/polyroute use class having the highest probability of overdose and the polyroute stimulants class having the lowest. Only 46.5% of participants had received THN, and probabilities differed between classes (χ=21.93, p<0.001). The polyroute stimulants/injection opioid use and polydrug/polyroute use classes had the highest levels of THN receipt while the polyroute stimulants use class had the least.
Conclusion.
Among rural PWID in West Virginia, polysubstance use was prevalent and associated with overdose and THN acquisition. These analyses demonstrate the importance of scaling up naloxone distribution in rural settings. Overdose prevention initiatives are reaching persons at high risk of overdose, but expansion of services is needed.
Keywords: Polysubstance use, people who inject drugs, rural drug use, latent class analysis
Introduction
Rural regions of the United States (US) have been deeply affected by the modern opioid crisis. Non-medical prescription opioid use and illicit drug use rates have risen dramatically in recent years (1–3), precipitating increases in injection drug use (4, 5). These trends are troubling given that rural communities often have insufficient access to essential evidence-based programs (e.g., syringe services programs [SSPs], medication assisted recovery programs) that can decrease injection drug use-associated consequences, such as overdose and infectious disease outbreaks, among people who inject drugs (PWID) (6, 7). Further, PWID who attempt to access medication assisted recovery programs in rural communities may experience both long waitlists and be required to travel long distances to access services due to geographical isolation, resulting in increased risks for adverse health outcomes (8–10). With 19% of the population of the US residing in rural communities, better understanding the unique characteristics of substance use and associated services utilization in non-urban areas is essential for the implementation of effective public health response initiatives (11).
Increasing rates of injection drug use in rural communities have coincided with similar rises in overdose rates (12–15). Between 1999 and 2004, non-metropolitan areas experienced a 159% increase in drug overdose mortality, contrasting sharply with the 51% increase metropolitans areas experienced during the same time period (15). These increases in rural overdose mortality continued and even accelerated in much of the country through 2016, and these changes varied widely by region (13). States in hard-hit areas were not affected equally; for instance, West Virginia (WV) had the highest per capita overdose fatality rate in the US in 2017 (16). Overdose rates in WV have more than tripled since the early 2000s (17). Overdose fatalities are not distributed equally in WV; Cabell County (characterized by the US Census Bureau as 86% rural by land space) has the highest rate of fatal heroin-related overdoses in the state and was among the top three counties in WV for both oxycodone and fentanyl-associated deaths (17, 18). Given the burden of overdose in rural communities, it is imperative that public health programs be implemented that are tailored to the needs of local PWID populations.
Take-home naloxone (THN) distribution initiatives have been implemented in many settings as a response to the opioid crisis and associated epidemics of fatal and non-fatal overdose. THN programs were first implemented in the US in the 1990s and involve the dispensation of naloxone (an opioid antagonist used to reverse opioid overdoses) to persons at risk for witnessing or experiencing an overdose and training persons on how to effectively respond during an overdose event (19, 20). THN programs are well-researched in urban areas and their implementation has been shown to effectively reduce overdose fatalities (19, 21–24). Access to THN among at-risk populations has also been improved through structural changes. For example, most states have standing orders that allow persons to access naloxone provided that predetermined conditions have been met (e.g., at-risk of witnessing or experiencing an overdose) (25). In Cabell County, efforts to prevent overdose fatalities include THN distribution and the implementation of quick response teams that aim to link persons who recently overdosed to healthcare services. These local overdose prevention services in Cabell County are also nested within co-occurring efforts at the state level to prevent overdose, such as through the implementation of a Good Samaritan law and standing order for naloxone (26–28).
Polysubstance use (the concurrent use of multiple drugs) is a strong driver of overdose among people who use drugs and presents unique prevention challenges. Combining central nervous system depressants or stimulants with opioids have each been associated with increased risks for experiencing a fatal overdose (29–32). Fatal overdoses involving stimulants (both cocaine and methamphetamine) and benzodiazepines have increased in recent years, and the majority of deaths involving these drugs have also involved opioids (33). As of 2015, approximately 63% of cocaine related deaths also involved opioids (34). In 2016, nearly 80% of overdose fatalities that involved a synthetic opioid (e.g., fentanyl and its analogs) also involved another substance (35). Overdoses involving fentanyl often require multiple doses of naloxone to reverse due to its high potency. Naloxone can only reverse the effects of opioids, and no equivalent medication currently exists for other drugs. Understanding patterns of polysubstance use among PWID and their association with health outcomes and service utilization could enable communities to implement public health initiatives that address the overlapping and synergistic risks for overdose among PWID.
To date, most studies that examine patterns of polysubstance use have used relatively simplistic measures to understand concurrent use of multiple drugs, such as counts of individual drugs used or diagnoses of polysubstance use disorders. These measures can mask the diversity of substance use that may contribute to adverse health outcomes. For example, individuals who report the same number of drugs used may use different classes of drugs and by varying routes of administration. Some research has used latent class analysis (LCA) (19) to improve the measurement of polysubstance use among people who use drugs (36–42). LCA allows for the identification of groups that are homogenous in terms of their drug use classes (43, 44). To our knowledge, only one study has utilized LCA to understand polysubstance use among rural US adults (45). This study focused on the entire non-metropolitan US population and used substance use disorder (SUD) diagnostic criteria as its measure of drug use. While informative, this study did not yield significant insights into the relationships between polysubstance use and health outcomes (e.g., overdose) and access to prevention resources (e.g., naloxone) among PWID. This is a key gap in the overdose prevention literature as rural PWID are at disproportionate risk for experiencing an overdose. Better understanding classes of polysubstance use among rural PWID and their relationship with overdose experiences and THN access could inform how overdose prevention initiatives are implemented to reach those at greatest risk. In this study, we aimed to identify classes of polysubstance drug use in a rural sample of PWID, identify sociodemographic correlates of these drug use classes, and test for associations between drug use classes and overdose history and receipt of take-home naloxone.
Methods
Study Design and Recruitment.
The current analysis uses data from the West Virginia COUNTS! study, which aimed to estimate the number of people who inject drugs in Cabell County, West Virginia. A detailed description of the methodology used in the parent study has been previously published; therefore, we briefly summarize the procedures here (46). Inclusion criteria for participation were individuals had to be at least 18 years old and to have ever used drugs of any form and by any route of administration. Data collection occurred in two phases during June and July 2018. In the first phase, we recruited PWID at the Cabell-Huntington Harm Reduction Program (CHHRP), which is housed in the Cabell-Huntington Health Department. The CHHRP was created in 2015 to decrease the significant health burden of the opioid epidemic in Cabell County. The program provides comprehensive harm reduction services, including syringe access, naloxone, referrals to substance use treatment, and related health services. As of August 2018, the CHHRP distributed an estimated 12,000 THN doses in the community (M. E. Kilkenny, e-mail communication, August 28, 2018). In the second study phase, we recruited participants in areas where PWID were known to congregate (e.g., public parks, transit centers). In total, 797 surveys were completed with 53% (n=421) reflecting unique individuals who reported injection drug use in the past 6 months. We excluded one survey from a transgender participant to preserve their anonymity, which yielded a final analytic sample 420 PWID. This study was approved by the Johns Hopkins Bloomberg School of Public Health Institutional Review Board.
Measures.
Past 6-Month Drug Use.
We asked participants a series of questions about their drug use in the past 6 months by routes of administration. Drug use was assessed using the following question form: “Have you (route of administration) (drug type) in the past 6 months?” Routes of administration included injected, snorted, swallowed, and smoked. Participants reported if they had injected each of the following drug types: heroin by itself, cocaine by itself, cocaine and heroin together (speedball), crystal methamphetamine, opioid painkillers (Oxycontin, Percocet, Codeine, Darvon, Percodan, Dilaudid, and Demerol were listed), fentanyl or fentanyl analogues, and buprenorphine or Suboxone. Participants also reported past 6-month non-injection use of the following drug types: heroin by itself, cocaine by itself, crack, crystal methamphetamine, opioid painkillers (Oxycontin, Percocet, Codeine, Darvon, Percodan, Dilaudid, and Demerol were listed again), sedatives/tranquilizers, and buprenorphine or Suboxone. We combined all non-injection use of a specific drug together (i.e. smoking and snorting heroin were both considered non-injection heroin use). We further combined some drugs into the following categories: injected stimulants (cocaine, crystal methamphetamine), non-injected stimulants (cocaine, crack, crystal methamphetamine), injected opioids (heroin, painkillers), non-injected opioids (heroin, painkillers). These categories were created to improve the estimability of the model used in this study. This procedure resulted in the following 9 binary drug use indicators capturing any use of drug types in the past 6 months: injection stimulants, injection opioids, injection speedball, injection fentanyl, injection buprenorphine/Suboxone, non-injection stimulants, non-injection opioids, non-injection sedatives/tranquilizers, and non-injection buprenorphine/Suboxone. Given the high potency of fentanyl, it was retained independent of the injected opioids category. For each drug, we utilized a binary indicator (yes/no) for any use in the past 6 months.
Sociodemographic Characteristics.
Demographic measures included age (in years), gender (male and female), and education level. Participants reported their education based on 8 categories ranging from never attending any school to graduate school, which we collapsed to three categories (less than high school graduate, high school graduate or equivalent, and some college or more). Participants reported their race as White, Black, Asian, Pacific Islander, American Indian/Alaskan Native, Multi-Racial, or Other. Participants also reported whether they considered themselves Hispanic. Given the low prevalence of participants who reported anything other than non-Hispanic, White in our sample, we dichotomized these categories into White and Other for our analysis. Finally, participants reported whether they considered themselves homeless (yes/no).
Past 6-Month Overdose History.
Participants reported how many times they had overdosed to the point of passing out in the previous 6 months. We used this information to generate a binary variable indicating having experienced any overdose in the past 6 months compared to no overdoses.
Past 6-Month Take-Home Naloxone.
We asked participants if they had received naloxone/Narcan to carry with them from any source in the past 6 months (yes/no).
Analysis.
First, we conducted a latent class analysis (19) using the drug use variables described above as manifest indicators to identify classes of polysubstance use. We used the LCA method to identify homogenous subgroups of polysubstance use (referred to as “classes”) by estimating a series of models with increasing numbers of classes (one to six classes) using a full information maximum likelihood estimator (43, 44). We then used the Akaike Information Criteria (AIC), Bayesian Information Criteria (BIC), and Lo-Mendell-Rubin Likelihood Ratio Tests (LRT) to select the preferred model (47). We also considered the substantive interpretations of the classes to select the final number of classes. To assess the relationships between the classes and overdose and THN, we used the Vermut 3-step approach to account for potential misclassification in the latent classes (48). We adjusted the associations between the latent classes and outcomes for gender, race, age, education, and homelessness. We then used Wald Tests to identify overall differences in each outcome (i.e., overdose, THN) between the classes and followed up these tests with model constraints to identify any pairwise differences between classes. We conducted the analyses using Mplus8.1 (49).
Results
Our sample (n=420) was primarily male (61.2%) and White (83.6%) (Table 1). The average age was 35.8 (standard deviation: 8.5). In our sample, 27.4% had less than a high school education, 34.8% had a high school education or equivalent, and 37.8% had some college education or more. More than half of the sample considered themselves homeless (56.0%). Injection opioids was the most commonly reported drug category in our sample (85.7%), followed by injection (76.9%) and non-injection stimulants (78.1%). Injection (30.2%) and non-injection buprenorphine/Suboxone (29.1%) were the least commonly reported. A large proportion of our sample reported experiencing an overdose (42.6%) in the past 6 months. A similar proportion reported receiving THN (46.5%) in the past 6 months.
Table 1.
Prevalences of Demographic Characteristics, Injection Drug Use Indicators, and Outcomes (N = 420)
| Prevalence (%) | |
|---|---|
| Demographic Characteristics | |
| Age, M(SD) | 35.8 (8.5) |
| Gender | |
| Male | 61.2 |
| Female | 38.8 |
| Race | |
| White | 83.6 |
| Other | 16.4 |
| Education | |
| Less than HS | 27.4 |
| 12th grade or GED | 34.8 |
| Some college or more | 37.8 |
| Homeless | 56.0 |
| Past 6-Month Injection Drug Use | |
| Stimulants | 76.9 |
| Opioids | 85.7 |
| Speedball | 38.3 |
| Fentanyl | 54.8 |
| Buprenorphine/Suboxone | 30.2 |
| Past 6-Month Non-Injection Drug Use | |
| Stimulants | 78.1 |
| Opioids | 47.6 |
| Sedatives/Tranquilizers | 41.7 |
| Buprenorphine/Suboxone | 29.1 |
| Outcomes | |
| Overdose in Past 6-months | 42.6 |
| Take-Home Naloxone | 46.5 |
Latent Classes of Polysubstance Injection.
The fit statistics from the class enumeration procedure are reported in Table 2. We selected a four-class solution given these fit statistics and the substantive interpretation of the classes. The probabilities of each indicator by class are presented in Figure 1. The four classes identified were: polydrug/polyroute use, polyroute stimulant/injection opioid use, injection opioid use, and polyroute stimulant use. The largest class (polydrug/polyroute use) contained 35.0% of the sample based on posterior probabilities of most likely class membership and was characterized by high use across drug categories. The next largest class (polyroute stimulant/injection opioid use) contained 33.3% of the sample and was characterized primarily by stimulant use (both injection and non-injection) and injection opioid use. A third class (polyroute stimulant use) containing 20.3% of the sample was characterized by high stimulant use across routes of administration. The smallest class (injection opioid use) contained 11.3% of the sample and consisted of individuals who primarily injected opioids.
Table 2.
Latent Class Model Fit Statistics
| Classes | Smallest Class | Log Likelihood | AIC | BIC | Entropy | LRT p-value |
|---|---|---|---|---|---|---|
| 2 | 40.7% | −2147.071 | 4332.14 | 4408.91 | 0.69 | <0.001 |
| 3 | 21.8% | −2080.283 | 4218.57 | 4335.73 | 0.72 | 0.022 |
| 4 | 11.3% | −2047.387 | 4172.77 | 4330.34 | 0.78 | 0.003 |
| 5 | 7.9% | −2029.603 | 4157.21 | 4355.18 | 0.79 | 0.437 |
| 6 | 2.9% | −2017.133 | 4152.27 | 4390.64 | 0.83 | 0.059 |
Figure 1.
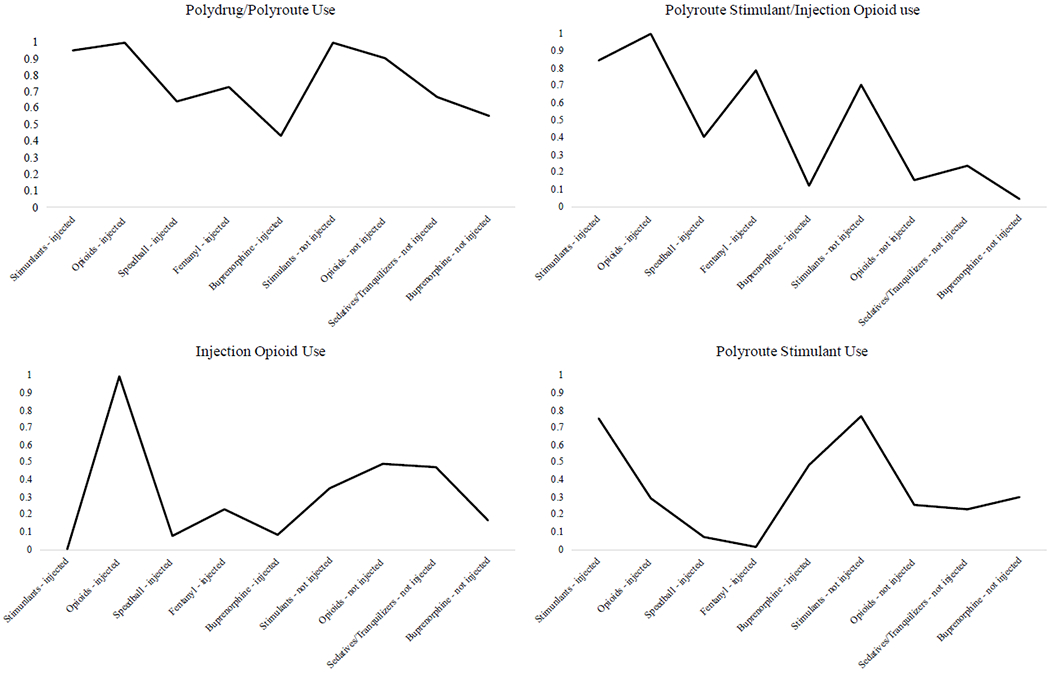
Probabilities of Drug Use Indicators in Each Latent Class
Sociodemographic Correlates of Latent Class Membership.
Table 3 summarizes the demographic correlates of class membership. In terms of age, the polyroute stimulant use class was younger than both the injection opioid (β=-0.080, p=0.008) and polydrug/polyroute use (β=−0.050, p=0.031) classes. The polyroute stimulants class had a greater proportion of males than the polyroute stimulants/injection opioid class (β=0.893, p=0.016), and a marginally greater proportion males than the injection opioid use (β=0.930, p=0.061) and polydrug/polyroute use classes (β=0.650, p=0.070). The polyroute stimulant/injection opioid use, injection opioid use, and polydrug/polyroute use classes did not differ in terms of gender. There were also no significant differences between classes for race/ethnicity or education. The polyroute stimulant use (β=−0.795, p=0.027) class had less homelessness than the polyroute stimulant/injection opioid use class. The polyroute stimulant class also had less homelessness than the polydrug/polyroute use class (β=−1.103, p=0.001). Finally, the polydrug/polyroute use class had more homelessness than the injection opioid class (β=1.443. p=0.002).
Table 3.
Distribution of Demographic Characteristics by Latent Class Membership
| Polydrug/Polyroute Use | Polyroute Stimulant/Injection Opioid Use | Injection Opioid Use | Polyroute Stimulant Use | |
|---|---|---|---|---|
| Age, Mean | 36.0 | 35.4 | 39.5 | 33.6 |
| Gender, % | ||||
| Male | 61.4 | 54.6 | 55.7 | 73.4 |
| Female | 38.6 | 45.4 | 44.3 | 26.6 |
| Race, % | ||||
| White | 85.6 | 83.5 | 78.1 | 84.5 |
| Non-White | 14.4 | 16.5 | 21.9 | 15.5 |
| Education, % | ||||
| Less than HS | 33.7 | 23.6 | 18.9 | 27.5 |
| 12th grade or GED | 34.9 | 33.7 | 35.3 | 35.4 |
| Some college or more | 31.4 | 42.7 | 45.8 | 37.1 |
| Homeless, % | 68.0 | 60.3 | 30.8 | 42.6 |
Overdose History and THN by Latent Class.
The probabilities of having recently experienced an overdose and received THN in each latent class are shown in Figure 2. The overall test for differences by class with respect to recent overdose was significant (χ=91.53, p<0.001). The classes had the following probability estimates of past 6-month overdose: 65.3% in the polydrug/polyroute use class, 49.3% in the polyroute stimulant/injection opioid use class, 16.0% in the injection opioid use class, and 9.1% in the polyroute stimulant use class. The polydrug/polyroute use class had a higher probability of overdose than the injection opioid use (p<0.001) and polyroute stimulant use (p<0.001) classes. The polyroute stimulant/injection opioid use class also had higher probabilities of overdose than the injection opioid use (p<0.001) and polyroute stimulant use (p<0.001) classes. The classes also differed in terms of THN receipt (χ=21.93, p<0.001). The probabilities of having received THN by class were: 59.4% in the polydrug/polyroute use class, 53.6% in the polyroute stimulant/injection opioid use class, 39.4% in the injection opioid class, and 23.3% in the polyroute stimulant use class. The polydrug/polyroute use class had a higher probability of receiving THN than the injection opioid use (p=0.022) and polyroute stimulant use (p<0.001) classes but did not differ from the polyroute stimulant/injection opioid use class (p=0.422). The polyroute stimulant/injection opioid use class was more likely to receive THN than the polyroute stimulant use class (p<0.001).
Figure 2. Probability of Past 6-Month Overdose History and Take-Home Naloxone Receipt by Polysubstance Drug Use Latent Class.
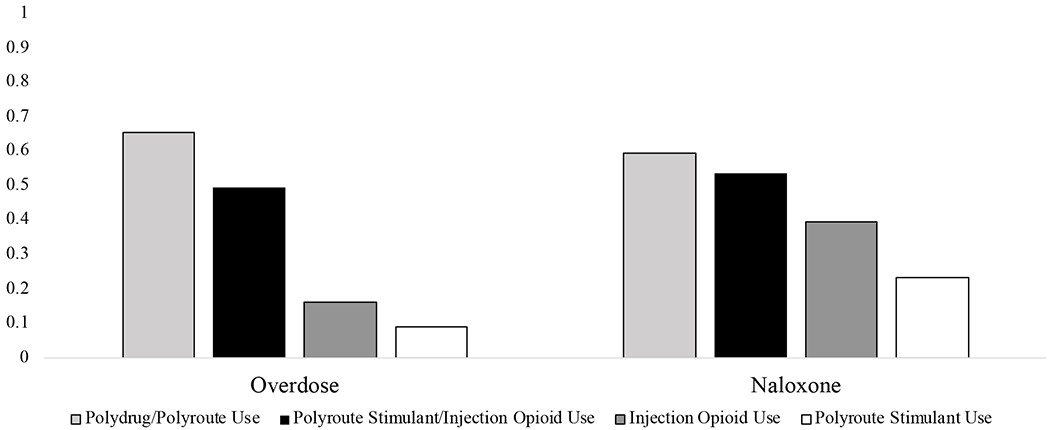
Note. The classes differed significantly in both their overdose history (χ=91.53, p<0.001) and THN possession (χ=21.93, p<0.001). The polydrug/polyroute use class had significantly higher rates of overdose than the injection opioid use (p<0.001) and stimulant use (p<0.001) classes and marginally higher rates than the stimulant and opioid (p=0.056). The stimulant and opioid use class had higher rates of overdose than the injection opioid (p<0.001) and stimulant (p<0.001) classes. The polydrug/polyroute use class had higher rates of THN than the injection opioid use (p=0.022) and stimulant use (p<0.001) classes. The stimulant and opioid use class had higher THN than the stimulant only class (p<0.001).
Discussion
Our study sought to understand what classes of polysubstance use exist among PWID in rural West Virginia and how polysubstance use is related to overdose and THN acquisition. We identified four classes of polysubstance use in our sample of rural PWID: polydrug/polyroute use, polyroute stimulant/injection opioid use, injection opioid use, and polyroute stimulant use. Among these classes, the polydrug/polyroute use and polyroute stimulant/injection opioid use classes had the highest probability of having experienced an overdose in the past 6 months. These same two classes were also most likely to have received THN in our study. The high prevalence of overdose in our sample is striking. Forty-two percent of our participants had experienced an overdose in the past 6 months, which contrasts sharply with existing estimates of national and global overdose rates among PWID (14% and 17% in the past year, respectively) (50, 51).
Our results suggest that the subgroups of PWID with the greatest probabilities of recent overdose were more likely to have recently received THN. This finding suggests that existing THN programs in Cabell County are reaching polysubstance use classes of PWID at high risk for overdose. However, there remains a significant gap in naloxone coverage at the population-level as less than half of our sample reported having received THN in the past 6 months. Our findings should also be contextualized within the broader opioid crisis in Cabell County. The emergence of fentanyl in the drug supply warrants increased efforts to enhance naloxone access as fentanyl-associated overdoses may require repeated naloxone administrations to reverse (52). Cabell County scaled up its overdose prevention initiatives in recent years to combat the ongoing crisis; for example, following an outbreak of 20 opioid overdoses in 53 hours, overdose prevention initiatives were catalyzed, leading to the implementation of quick response teams that aim to link persons who overdose to recovery services and community naloxone distribution campaigns (53). Preliminary data suggest that overdose prevention initiatives are working in Cabell County; calls for overdose-related emergency medical services decreased by 40% in 2018 compared to 2017 (54). Ongoing and expanded efforts to make THN available to all at-risk persons are essential to sustaining the positive changes in overdose trends. Further, tailoring THN distribution to the needs of subpopulations of PWID may result in greater reductions in overdose mortality.
We identified sociodemographic correlates of polysubstance use classes and found several distinctions between them. The polyroute stimulant use group was more likely to be male and younger than other classes. Importantly, we found that the classes with the highest probabilities of recent overdose (polydrug/polyroute use, polyroute stimulant/injection opioid use) were also characterized by homelessness. This is consistent with the broader literature that consistently identifies homelessness as a risk factor for overdose (55–59). As such, further integrating harm reduction services, like naloxone trainings, into existing programs targeting homeless individuals may help provide lifesaving services directly to the individuals at highest risk for poor health outcomes. Our findings help illuminate ways in which naloxone distribution programs can potentially be targeted to maximize their impact for the most vulnerable PWID in the community.
Our study has several limitations and strengths that are important to consider. First, our sample lacks demographic diversity. While this limits our ability to examine the influences of race/ethnicity, it does reflect the relative homogeny of the population in Cabell County (46). As previously mentioned, our study is also limited by our measurement of THN. We only measured whether a person had received THN in the past 6 months from any source and therefore could not evaluate whether individuals received enough naloxone to meet their needs, were able to easily refill used doses, or where individuals received the naloxone. Future work should be conducted to better understand strategies to increase naloxone coverage among rural PWID. Additionally, access to and receipt of THN are non-equivalent; it is possible that some participants who reported not having received THN were offered it and declined it. We also did not measure co-use of drugs on the same drug use occasion in this study (except for speedball use), only the use of drugs within the same time period. We also did not include a nuanced measure of frequency of use for each drug, which is an important area of future inquiry as frequency of use may affect overdose risks. Similarly, we did not measure alcohol use, limiting our ability to comprehensively understand the totality of substance use among this population. We should also note that while approximately one-third of our sample reported injecting buprenorphine/Suboxone, we cannot provide any additional insights into this behavior. Future work is needed to better understand buprenorphine/Suboxone injection and how it may affect risks for overdose. Despite these limitations, our study also has several strengths that make it an important contribution to the literature. First, latent class analysis is a powerful statistical approach allows for the identification of subgroups of individuals with homogenous profiles of the indicators of interest, in this case, polysubstance use. Latent class analysis allows for a more holistic understanding of individuals’ behaviors than more simplified approaches. Additionally, we highlight important correlates of high-risk polysubstance use patterns that can be used to inform public health program planning. Future research should further this line of questioning to understand other important health consequences of polysubstance use, like injection-related infectious disease (HIV, Hepatitis C) transmission and physical health morbidities (abscesses). Additional studies should also explore why particular drugs may be combined and how this behavior relates to attitudes towards and interest in medication assisted recovery.
Conclusions.
Our study provides a first step in understanding how polysubstance use is related to overdose outcomes and take-home naloxone receipt among people who inject drugs in rural Appalachia. We found that persons who use stimulants and opioids or who use a variety of drugs through multiple routes of administration had the highest probability of having experienced an overdose in the past 6 months. While these groups were also more likely to have received take-home naloxone, expansion of naloxone services are needed to provide comprehensive coverage to the entire PWID population at-risk of overdose.
Acknowledgements:
We are grateful for the collaboration of the Cabell Huntington Health Department, without which this project would not have been possible. We are especially grateful to Tim Hazelett, Thommy Hill, Tyler Deering, Kathleen Napier, Jeff Keatley, Michelle Perdue, Chad Helig, and Charles “CK” Babcock for all their support throughout the study implementation. We are also grateful for the hard work of the West Virginia COUNTS! research team: Megan Keith, Anne Maynard, Aspen McCorkle, Terrance Purnell, Ronaldo Ramirez, Kayla Rodriguez, Lauren Shappell, Brad Silberzahn, Dominic Thomas, Kevin Williams, and Hayat Yusuf. We gratefully acknowledge the West Virginia Department of Health and Human Resources. We also wish to acknowledge Josh Sharfstein, Michelle Spencer, Dori Henry, and Akola Francis for their support throughout each phase of the study. Most importantly, we are grateful to our study participants.
Funding: This research was supported in part by the National Institute on Drug Abuse (T32DA007292, KES supported; 1K01DA046234-01, PI: STA) and by the Bloomberg American Health Initiative at the Johns Hopkins Bloomberg School of Public Health. This research has been facilitated by the infrastructure and resources provided by the Johns Hopkins University Center for AIDS Research, an NIH funded program (P30AI094189) and the District of Columbia Center for AIDS Research, an NIH funded program (AI117970). The content is solely the responsibility of the authors and does not necessarily represent the views of the funders.
Footnotes
Publisher's Disclaimer: This is a PDF file of an unedited manuscript that has been accepted for publication. As a service to our customers we are providing this early version of the manuscript. The manuscript will undergo copyediting, typesetting, and review of the resulting proof before it is published in its final form. Please note that during the production process errors may be discovered which could affect the content, and all legal disclaimers that apply to the journal pertain.
Disclosures: Dr. Susan G. Sherman is an expert witness for plaintiffs in opioid litigation. No other authors have competing interests to disclose.
References:
- 1.Han B, Compton WM, Jones CM, Cai R. Nonmedical prescription opioid use and use disorders among adults aged 18 through 64 years in the United States, 2003-2013. Jama. 2015;314(14):1468–78. [DOI] [PubMed] [Google Scholar]
- 2.Jones CM, Logan J, Gladden RM, Bohm MK. Vital signs: demographic and substance use trends among heroin users—United States, 2002–2013. MMWR Morbidity and mortality weekly report. 2015;64(26):719. [PMC free article] [PubMed] [Google Scholar]
- 3.Kolodny A, Courtwright DT, Hwang CS, Kreiner P, Eadie JL, Clark TW, et al. The prescription opioid and heroin crisis: a public health approach to an epidemic of addiction. Annual review of public health. 2015;36:559–74. [DOI] [PubMed] [Google Scholar]
- 4.Wejnert C, Hess K, Hall H, Van Handel M, Hayes D, Fulton P Jr, et al. Vital Signs: Trends in HIV Diagnoses, Risk Behaviors, and Prevention Among Persons Who Inject Drugs-United States. MMWR Morbidity and mortality weekly report. 2016;65(47):1336. [DOI] [PubMed] [Google Scholar]
- 5.Zibbell JE, Asher AK, Patel RC, Kupronis B, Iqbal K, Ward JW, et al. Increases in acute hepatitis C virus infection related to a growing opioid epidemic and associated injection drug use, United States, 2004 to 2014. American journal of public health. 2018;108(2):175–81. [DOI] [PMC free article] [PubMed] [Google Scholar]
- 6.Des Jarlais DC, Nugent A, Solberg A, Feelemyer J, Mermin J, Holtzman D. Syringe service programs for persons who inject drugs in urban, suburban, and rural areas—United States, 2013. MMWR Morb Mortal Wkly Rep. 2015;64(48):1337–41. [DOI] [PubMed] [Google Scholar]
- 7.Dick AW, Pacula RL, Gordon AJ, Sorbero M, Bums RM, Leslie D, et al. Growth in buprenorphine waivers for physicians increased potential access to opioid agonist treatment, 2002–11. Health Affairs. 2015;34(6):1028–34. [DOI] [PMC free article] [PubMed] [Google Scholar]
- 8.Rosenblum A, Cleland CM, Fong C, Kayman DJ, Tempalski B, Parrino M. Distance traveled and cross-state commuting to opioid treatment programs in the United States. Journal of environmental and public health. 2011. ;2011. [DOI] [PMC free article] [PubMed] [Google Scholar]
- 9.Schwartz RP, Highfield DA, Jaffe JH, Brady JV, Butler CB, Rouse CO, et al. A randomized controlled trial of interim methadone maintenance. Archives of General Psychiatry. 2006;63(1):102–9. [DOI] [PubMed] [Google Scholar]
- 10.Sigmon SC. Access to treatment for opioid dependence in rural America: challenges and future directions. JAMA psychiatry. 2014;71(4):359–60. [DOI] [PubMed] [Google Scholar]
- 11.US Census Bureau. 2010 Summary File 1. https://assets.nhgis.org/2010sfl.pdf. 2010.
- 12.Jalal H, Buchanich JM, Roberts MS, Balmert LC, Zhang K, Burke DS. Changing dynamics of the drug overdose epidemic in the United States from 1979 through 2016. Science. 2018;361(6408):eaaul 184. [DOI] [PMC free article] [PubMed] [Google Scholar]
- 13.Rigg KK, Monnat SM, Chavez MN. Opioid-related mortality in rural America: Geographic heterogeneity and intervention strategies. International Journal of Drug Policy. 2018;57:119–29. [DOI] [PubMed] [Google Scholar]
- 14.Keyes KM, Cerda M, Brady JE, Havens JR, Galea S. Understanding the rural–urban differences in nonmedical prescription opioid use and abuse in the United States. American journal of public health. 2014;104(2):e52–e9. [DOI] [PMC free article] [PubMed] [Google Scholar]
- 15.Paulozzi LJ, Xi Y. Recent changes in drug poisoning mortality in the United States by urban–rural status and by drug type. Pharmacoepidemiology and drug safety. 2008;17(10):997–1005. [DOI] [PubMed] [Google Scholar]
- 16.Scholl L, Seth P, Kariisa M, Wilson N, Baldwin G. Drug and opioid-involved overdose deaths—United States, 2013–2017. Morbidity and Mortality Weekly Report. 2019;67(5152):1419. [DOI] [PMC free article] [PubMed] [Google Scholar]
- 17.West Virginia Department of Health & Human Resources. West Virginia Drug Overdose Deaths: Historical Overview 2001–2015. Charleston, WV, Bureau for Public Health; 2017. [Google Scholar]
- 18.US Census Bureau. 2010 census urban and rural classification and urban area criteria 2012 [Available from: https://www.census.gov/geo/reference/ua/urban-rural-2010.html.
- 19.Mueller SR, Walley AY, Calcaterra SL, Glanz JM, Binswanger IA. A review of opioid overdose prevention and naloxone prescribing: implications for translating community programming into clinical practice. Substance abuse. 2015;36(2):240–53. [DOI] [PMC free article] [PubMed] [Google Scholar]
- 20.McDonald R, Campbell ND, Strang J. Twenty years of take-home naloxone for the prevention of overdose deaths from heroin and other opioids—Conception and maturation. Drug and alcohol dependence. 2017;178:176–87. [DOI] [PubMed] [Google Scholar]
- 21.Eggleston W, Podolak C, Sullivan RW, Pacelli L, Keenan M, Wojcik S. A randomized usability assessment of simulated naloxone administration by community members. Addiction. 2018;113( 12):2300–4. [DOI] [PubMed] [Google Scholar]
- 22.Lewis DA, Park JN, Vail L, Sine M, Welsh C, Sherman SG. Evaluation of the overdose education and naloxone distribution program of the Baltimore Student Harm Reduction Coalition. American journal of public health. 2016;106(7):1243–6. [DOI] [PMC free article] [PubMed] [Google Scholar]
- 23.McDonald R, Strang J. Are take- home naloxone programmes effective? Systematic review utilizing application of the Bradford Hill criteria. Addiction. 2016;111(7):1177–87. [DOI] [PMC free article] [PubMed] [Google Scholar]
- 24.Wheeler E, Jones TS, Gilbert MK, Davidson PJ. Opioid overdose prevention programs providing naloxone to laypersons—United States, 2014. MMWR Morbidity and mortality weekly report. 2015;64(23):631. [PMC free article] [PubMed] [Google Scholar]
- 25.OSF. Widening the Net of Naloxone Prescribers –The Standing Order Model 2013. [Available from: http://www.naloxoneinfo.org/case-studies/standing-orders.
- 26.Science Legal. Good Samaritan Overdose Prevention laws. Prescription drug abuse policy system; 2018. [Google Scholar]
- 27.Standing order naloxone prescription for overdose prevention [press release]. Charleston, WV: West Virginia Department of Health and Human Resources; 2018. [Google Scholar]
- 28.West Virginia Board of Pharmacy. Naloxone Protocol 2018. [Available from: https://www.wvbop.com/article.asp?ty=CTTS&action2=showArticle&id=14.
- 29.Coffin PO, Galea S, Ahem J, Leon AC, Vlahov D, Tardiff K. Opiates, cocaine and alcohol combinations in accidental drug overdose deaths in New York City, 1990–98. Addiction. 2003;98(6):739–47. [DOI] [PubMed] [Google Scholar]
- 30.Darke S, Darke S, Williamson A, Darke S, Williamson A, Ross J, et al. Non-fatal heroin overdose, treatment exposure and client characteristics: findings from the Australian treatment outcome study (ATOS). Drug and alcohol review. 2005;24(5):425–32. [DOI] [PubMed] [Google Scholar]
- 31.Degenhardt L, Hall W. Extent of illicit drug use and dependence, and their contribution to the global burden of disease. The Lancet. 2012;379(9810):55–70. [DOI] [PubMed] [Google Scholar]
- 32.Sorg MH, Long DL, Abate MA, Kaplan JA, Kraner JC, Greenwald MS, et al. Additive effects of cointoxicants in single-opioid induced deaths. Academic forensic pathology. 2016;6(3):532–42. [DOI] [PMC free article] [PubMed] [Google Scholar]
- 33.Centers for Disease Control and Prevention. Multiple Cause of Death 1999-2017 CDC WONDER Online Database. National Center for Health Statistics; 2018. [Google Scholar]
- 34.Jones CM, Logan J, Gladden RM, MK B. Vital signs: demographic and substance use trends among heroin users—United States, 2002–2013. Morbidity and Mortality Weekly Report 2015;64(26):719. [PMC free article] [PubMed] [Google Scholar]
- 35.Jones CM, Einstein EB, WM C. Changes in Synthetic Opioid Involvement in Drug Overdose Deaths in the United States, 2010-2016. JAMA. 2018;319(17):1819–21. [DOI] [PMC free article] [PubMed] [Google Scholar]
- 36.Choi HJ, Lu Y, Schulte M, Temple JR. Adolescent substance use: Latent class and transition analysis. Addictive behaviors. 2018;77:160–5. [DOI] [PMC free article] [PubMed] [Google Scholar]
- 37.Liu Y, Elliott AL, Serdarevic M, Leeman RF, Cottier LB. A latent class analysis of the past-30-day substance use patterns among lifetime cocaine users: Findings from a community sample in North Central Florida. Addictive Behaviors Reports. 2019;9:100170. [DOI] [PMC free article] [PubMed] [Google Scholar]
- 38.Meacham MC, Roesch SC, Strathdee SA, Lindsay S, Gonzalez-Zuniga P, Gaines TL. Latent classes of polydrug and polyroute use and associations with human immunodeficiency virus risk behaviours and overdose among people who inject drugs in Tijuana, Baja California, Mexico. Drug and alcohol review. 2018;37(1):128–36. [DOI] [PMC free article] [PubMed] [Google Scholar]
- 39.Meacham MC, Rudolph AE, Strathdee SA, Rusch ML, Brouwer KC, Patterson TL, et al. Polydrug use and HIV risk among people who inject heroin in Tijuana, Mexico: A latent class analysis. Substance use & misuse. 2015;50(10):1351–9. [DOI] [PMC free article] [PubMed] [Google Scholar]
- 40.Quek L-H, Chan GC, White A, Connor JP, Baker P, Saunders JB, et al. Concurrent and simultaneous polydrug use: latent class analysis of an Australian nationally representative sample of young adults. Frontiers in public health. 2013;1:61. [DOI] [PMC free article] [PubMed] [Google Scholar]
- 41.Sanudo A, Andreoni S, Sanchez ZM. Polydrug use among nightclub patrons in a megacity: a latent class analysis. International Journal of Drug Policy. 2015;26(12):1207–14. [DOI] [PubMed] [Google Scholar]
- 42.Shiu-Yee K, Brincks AM, Feaster DJ, Frimpong JA, Nijhawan A, Mandler RN, et al. Patterns of Substance Use and Arrest Histories Among Hospitalized HIV Drug Users: A Latent Class Analysis. AIDS and Behavior. 2018;22(9):2757–65. [DOI] [PMC free article] [PubMed] [Google Scholar]
- 43.Goodman LA. Exploratory latent structure analysis using both identifiable and unidentifiable models. Biometrika. 1974;61(2):215–31. [Google Scholar]
- 44.Lazarsfeld P, Henry N. Latent structure analysis. Houghton Mifflin Company, Boston, Massachusetts; 1968. [Google Scholar]
- 45.Brooks B, McBee M, Pack R, Alamian A. The effects of rurality on substance use disorder diagnosis: a multiple-groups latent class analysis. Addictive behaviors. 2017;68:24–9. [DOI] [PubMed] [Google Scholar]
- 46.Allen ST, O’Rourke A, White RH, Schneider KE, Kilkenny M, Sherman SG. Estimating the Number of People Who Inject Drugs in A Rural County in Appalachia. American journal of public health. 2019(0):e1–e6. [DOI] [PMC free article] [PubMed] [Google Scholar]
- 47.Nylund KL, Asparouhov T, Muthén BO . Deciding on the number of classes in latent class analysis and growth mixture modeling: A Monte Carlo simulation study. Structural equation modeling: A multidisciplinary Journal. 2007;14(4):535–69. [Google Scholar]
- 48.Vermunt JK. Latent class modeling with covariates: Two improved three-step approaches. Political analysis. 2010;18(4):450–69. [Google Scholar]
- 49.Muthén LK, Muthén BO. Mplus User’s Guide. Los Angeles, CA: Muthén & Muthén; 1998-2017. [Google Scholar]
- 50.Martins SS, Sampson L, Cerdá M, Galea S. Worldwide prevalence and trends in unintentional drug overdose: a systematic review of the literature. American journal of public health. 2015;105(11):e29–e49. [DOI] [PMC free article] [PubMed] [Google Scholar]
- 51.Robinson WT, Kazbour C, Nassau T, Fisher K, Sheu S, Rivera AV, et al. Brief Report: Nonfatal Overdose Events Among Persons Who Inject Drugs Findings From Seven National HIV Behavioral Surveillance Cities 2009 & 2012. JAIDS Journal of Acquired Immune Deficiency Syndromes. 2017;75:S341–S5. [DOI] [PubMed] [Google Scholar]
- 52.Fairbaim N, Coffin PO, Walley AY. Naloxone for heroin, prescription opioid, and illicitly made fentanyl overdoses: challenges and innovations responding to a dynamic epidemic. International Journal of Drug Policy. 2017;46:172–9. [DOI] [PMC free article] [PubMed] [Google Scholar]
- 53.Massey J, Kilkenny M, Batdorf S, Sanders SK, Ellison D, Halpin J, et al. Opioid overdose outbreak—West Virginia, August 2016. MMWR Morbidity and mortality weekly report. 2017;66(37):975. [DOI] [PMC free article] [PubMed] [Google Scholar]
- 54.Nash B Cabell County see 40 percent drop in overdoses. The Herald-Dispatch. 2019. January 3, 2019. [Google Scholar]
- 55.Fischer B, Brissette S, Brochu S, Bruneau J, El-Guebaly N, Noël L, et al. Determinants of overdose incidents among illicit opioid users in 5 Canadian cities. Cmaj. 2004;171(3):235–9. [DOI] [PMC free article] [PubMed] [Google Scholar]
- 56.Galea S, Nandi A, Coffin PO, Tracy M, Piper TM, Ompad D, et al. Heroin and cocaine dependence and the risk of accidental non-fatal drug overdose. Journal of addictive diseases. 2006;25(3):79–87. [DOI] [PubMed] [Google Scholar]
- 57.Kerr T, Fairbaim N, Tyndall M, Marsh D, Li K, Montaner J, et al. Predictors of non-fatal overdose among a cohort of polysubstance-using injection drug users. Drug and alcohol dependence. 2007;87(1):39–45. [DOI] [PubMed] [Google Scholar]
- 58.O’Driscoll PT, McGough J, Hagan H, Thiede H, Critchlow C, Alexander ER. Predictors of accidental fatal chug overdose among a cohort of injection drug users. American Journal of Public Health. 2001;91(6):984. [DOI] [PMC free article] [PubMed] [Google Scholar]
- 59.Park JN, Weir BW, Allen ST, Chaulk P, Sherman SG. Fentanyl-contaminated chugs and non-fatal overdose among people who inject chugs in Baltimore, MD. Harm reduction journal. 2018;15(1):34. [DOI] [PMC free article] [PubMed] [Google Scholar]