

Abstract
Rationale and Objective:
The interplay between bariatric surgery, type 2 diabetes, and chronic kidney disease (CKD) is poorly understood. We therefore studied in patients with type 2 diabetes if diabetes remission induced by bariatric surgery influences indicators of CKD and if the presence of pre-operative CKD predicts diabetes remission after bariatric surgery.
Study Design:
Prospective observational study.
Study Participants:
737 bariatric surgery patients with type 2 diabetes who participated in multicenter cohort study for up to five years.
Predictors:
Demographics, blood pressure, medications, type of bariatric surgery, anthropometrics, markers of kidney disease, and circulating levels of gut hormones and peptides
Main Outcomes:
Estimated glomerular filtration rate (eGFR), urinary albumin excretion, prognostic risk for CKD as defined by an international consortium, and remission of diabetes.
Analytic Approach:
Linear mixed models for eGFR, generalized linear mixed models with logit link for albuminuria, prognostic risk for CKD, and diabetes remission.
Results:
Remission of diabetes at 5 years post-bariatric surgery was independently associated with a lower risk of moderately/severely increased albuminuria and stabilization in the prognostic risk for CKD but not with eGFR. Lower pre-operative eGFR and higher prognostic risk for CKD were independently associated with a reduced likelihood of diabetes remission.
Limitations:
Minority of participants with baseline CKD; lack of comparison group; no information on duration of diabetes, other important endpoints, or kidney biopsy results.
Conclusions:
Remission of type 2 diabetes at 5 years post-bariatric surgery was associated with improved urinary albumin excretion and stabilization of prognostic risk for CKD but not with eGFR. Additionally, the presence of baseline CKD reduced the likelihood of post-bariatric surgery diabetes remission. These results highlight the need to further study if bariatric surgery can delay the progression of CKD in type 2 diabetes and to identify which patients would most benefit.
Keywords: obesity, CKD, bariatric surgery, eGFR, albuminuria, type 2 diabetes
Plain Language Summary:
Type 2 diabetes is closely linked to obesity and is the main cause of chronic kidney disease (CKD) worldwide but the relationship between CKD, diabetes, and obesity needs more exploration. We therefore studied if bariatric surgery is associated with improvements in CKD and if the presence of CKD at time of bariatric surgery influences the likelihood of remission of diabetes after surgery. We found in 737 bariatric surgery patients with type 2 diabetes followed for 5 years that bariatric surgery is associated with improvements in certain parameters of CKD. We also observed that patients with CKD are less likely to have diabetes remission after bariatric surgery. These new observations warrant further study as they may lead to better treatment strategies.
BACKGROUND
Type 2 diabetes-related kidney disease is the leading cause of chronic kidney disease (CKD) and end-stage renal disease (ESRD) worldwide.1,2 Current recommended treatment options for CKD in patients with type 2 diabetes offer only limited benefits.3 Given the strong link between type 2 diabetes and obesity, intentional weight loss should be explored as additional treatment option for CKD.4 Such an approach would potentially have a major advantage over conventional therapy in that it could lead not only to remission of type 2 diabetes, which is a necessary precondition for diabetic kidney disease, but also to improvements in hypertension and other obesity-related risk factors for CKD.5
Unfortunately there is a lack of information on how remission of diabetes would influence CKD in patients with type 2 diabetes since remission is a very difficult state to achieve. Bariatric surgery, which is the most effective method for inducing and sustaining weight loss, is able to induce remission of type 2 diabetes in a substantial proportion of patients.6 It therefore offers a unique model in which to evaluate whether remission of type 2 diabetes through weight loss mitigates the course of CKD.
The bariatric surgery model also allows investigators to study whether the presence of CKD influences remission of diabetes. A well-established link between kidney disease and insulin resistance7 exists but it is uncertain whether patients with type 2 diabetes and CKD are less likely to achieve diabetes remission after bariatric surgery due to underlying insulin resistance or other CKD-related factors. Addressing this question will help improve our understanding of the potential benefits of bariatric surgery as well as the interplay between obesity, type 2 diabetes, and CKD.
Our study was performed in a large prospective multicenter cohort of obese patients with type 2 diabetes who underwent bariatric surgery and had regular follow-up over five years. The aims were to assess if remission of diabetes after bariatric surgery influences indicators of CKD and understand how the presence of baseline CKD influences the likelihood of diabetes remission after bariatric surgery. Data on circulating gut hormones and peptides and mediators of glycemia that are influenced by bariatric surgery and are also increasingly found to have important physiological effects on organs such as the kidney were included in the analysis to offer additional biological insights.
METHODS
Study Population
The study was comprised of participants in the Longitudinal Assessment of Bariatric Surgery-2 (LABS-2) study, an NIH-sponsored, prospective longitudinal multicenter trial designed to study the long-term safety and efficacy of bariatric surgery and its effects on a variety of health-related parameters.8 LABS-2 participants were at least 18 years old and underwent first-time bariatric procedures with a surgeon participating in the LABS consortium, which was comprised of 10 hospitals at 6 US clinical centers. Approval was obtained from each center’s institutional review board. Participants provided written informed consent and underwent surgery between March 2006 and April 2009.
Measures
Details on data collection, measurements, and definitions of diseases in LABS-2 were previously published.8,9 Laboratory measurements were performed in the fasting state (but not necessarily first morning void). Kidney disease was a pre-specified endpoint of LABS-2 so serum creatinine and cystatin C and the urine albumin-to-creatinine (ACR, mg/g) ratio were measured at baseline and annually for five years after the surgery. Creatinine was measured using the Roche creatinine plus enzymatic reaction assay (Roche, Basel, Switzerland) that was traceable to IDMS. Cystatin C and urine albumin were measured using a Siemens Dade Behring BN II Nephelometer (Siemens Inc., Munich, Germany). Primary renal outcomes included estimated glomerular filtration rate (eGFR, ml/min/1.73m2) and ACR, the two major clinical markers of kidney disease. eGFR was derived from a CKD-EPI equation that uses serum creatinine and cystatin C10 and that we previously identified as being the most accurate in bariatric surgery patients.11 Moderately increased albuminuria was defined as an ACR 30-300 mg/g and severely increased albuminuria as >300 mg/g. As an additional renal outcome we included the prognostic risk for CKD12 definition using the Kidney Disease Improving Global Outcomes (KDIGO) consortium nomenclature system13 developed from 45 cohorts that included more than 1.5 million participants. The classification offers four prognostic risk categories based on a combination of eGFR and ACR: (1) Low - eGFR ≥ 60 ml/min/1.73 m2 and an ACR <30 mg/g. This category includes patients without CKD; (2) Moderate - eGFR between 45-59 ml/min/1.73 m2 and an ACR <30 mg/g or an eGFR ≥ 60 and an ACR between 30-300 mg/g; (3) High - eGFR between 30-44 ml/min/1.73 m2 and an ACR <30 mg/g or an eGFR 45-59 and an ACR between 30-300 mg/g or an eGFR ≥60 ml/min/1.73 m2 and an ACR >300 mg/g; and (4) Very High - eGFR <30 ml/min/1.73 m2 and an ACR <30 mg/g or an eGFR <45 ml/min/1.73 m2 and an ACR between 30-300 mg/g or an eGFR <60 ml/min/1.73 m2 and an ACR >300 mg/g. These categories predict the likelihood of having progressive CKD, acute kidney injury, or kidney failure and also closely correlate with risk for cardiovascular and all-cause mortality.13
Diabetes was defined as currently taking diabetes medication, having a glycated hemoglobin (HbA1c) measure of 6.5% or greater or fasting plasma glucose value of 126 mg/dL (7 mmol) or greater if HbA1c level was unavailable.14 Partial diabetes remission was defined as a HbA1c of 5.7% to < 6.5% or fasting glucose 100 mg/dL to ≤ 125 mg/dL if HbA1c was not available. Complete remission was defined as HbA1c < 5.7% or fasting glucose < 100 mg/dL if HbA1c was not available. For both groups absence of active drug treatment of diabetes (with exception of metformin alone in patients who did not self-report diabetes or reported diagnosis of polycystic ovarian syndrome) was also required.14 Homeostatic Model Assessment (HOMA) %S (which estimates steady state beta cell function as a percentage of the normal reference population) and HOMA %B (which estimates insulin sensitivity) were calculated using The University of Oxford HOMA Calculator website.15 Measurements of leptin, ghrelin, insulin, proinsulin, free fatty acids, and C-peptide were performed using standard assays as previously described.6
Statistical Analysis
Baseline characteristics of LABS-2 participants with diabetes prior to surgery were summarized using frequencies and percentages for categorical data, and median and interquartile ranges (IQR) for continuous data. Annual measures on weight, percent weight loss from baseline (calculated for each annual post-surgery visit), CKD parameters (serum creatinine, serum cystatin C, eGFR, eGFR change from baseline, ACR, and prognostic risk for CKD), and diabetes remission (no remission, partial remission, and complete remission) after surgery are also summarized at each annual visit.
Outcomes and corresponding statistical models.
Several post-surgery outcomes were investigated over time in separate analyses: (1) eGFR, (2) moderately/severely increased albuminuria, (3) stabilization (i.e. no improvement or worsening) of prognostic risk for CKD, (4) improvement of prognostic risk for CKD, and (5) diabetes remission. To account for within-subject correlations due to repeated measures, appropriate mixed models were used (i.e. linear mixed models (LMMs) for eGFR, generalized linear mixed models (GLMMs) with logit link for moderately or severely increased albuminuria and stabilization or improvement in prognostic risk for CKD).
For modeling the association between pre-surgery CKD parameters (e.g. baseline eGFR, ACR, and prognostic risk for CKD) and post-surgery diabetes remission status as three categories (no remission, partial remission, and complete remission) we used generalized linear mixed models for ordinal outcome with a logit link (proportional odds model) to account for within-subject correlations in repeated measures. For this model, proportional odds assumption was tested graphically with the finding that the relationship between each pair of outcomes groups was the same and hence proportional odds assumption was appropriate.
Handling missing data.
Baseline variables associated with the absence of outcome data post-surgery were first identified through GLMMs with binary missing status (missing or not missing) as the outcome. Based on the results baseline age and clinical sites were independently associated with missing follow-up data for eGFR and ACR. Baseline age, race, clinical sites, and circulating ghrelin were independently associated with missing follow-up data for prognostic risk for CKD. Baseline age, sex, and clinical sites were related to missing follow-up data on diabetes remission. These variables were adjusted for in models with corresponding outcomes to make the estimated results unbiased under the missing-at-random assumption. The missing-at-random assumption was deemed reasonable because no systematic patterns giving rise to incomplete data for respective outcomes at follow-up were detected after adjusting for baseline variables that were independently associated with missing follow-up data.
Variable selection.
For each outcome analysis, we adopted the step-wise variable selection approach described below. The association between baseline covariates (listed in Table 1) and the outcome of interest, and between percent weight loss from baseline and the outcome of interest were first tested individually. Variables with p-value <0.2 significance level in the univariable analysis were included in the multivariable model wherein a stepwise regression with p-value cut-off of 0.1 for both entry and removal was used for covariate screening. This resulted in our main-effect model. Since a variable with a large p-value can sometimes become statistically significant in multivariable models, the above main-effect model was refined as follows: Covariates that were not considered in the stepwise selection (univariable p-value >= 0.20) were entered in this main-effect model one at a time and kept in the multivariable model if p-value was <0.1. Several exceptions are noted: Covariates that were selected a priori to be in the multivariable models to investigate the relationship between diabetes remission and post-surgery CKD parameters included type of bariatric surgery and corresponding baseline CKD parameters (i.e., baseline eGFR in models for eGFR, baseline ACR in models for moderately or severely increased albuminuria, and baseline prognostic risk for CKD in models for stabilization or improvement in prognostic risk for CKD). Type of bariatric surgery was the covariate selected a priori to be in the multivariable models when examining the relationship between baseline CKD indicators and post-surgery diabetes status. Two-way interactions of baseline covariates in the main-effect model and their interaction with time since surgery, baseline prognostic risk for CKD, and type of bariatric surgery were considered. They were kept in the multivariable model if the corresponding p-value was <0.05.
Table 1:
Baseline Characteristics of the LABS-2 Participants with Diabetes
| Characteristics | N | n (%) or median (IQR) |
|---|---|---|
| Age (years) | 737 | 52 (44, 58) |
| Gender | 737 | |
| Male | 217 (29.4) | |
| Female | 520 (70.6) | |
| Race | 729 | |
| White | 617 (84.6) | |
| Non-white | 112 (15.4) | |
| Annual household income | 663 | |
| < $25,000 | 144 (21.7) | |
| $25,000-$49,000 | 175 (26.4) | |
| $50,000-$74,999 | 147 (22.2) | |
| $75,000-$99,999 | 97 (14.6) | |
| ≥ $100,000 | 100 (15.1) | |
| Education | 682 | |
| High school or less | 173 (25.4) | |
| Some college/post HS education | 283 (41.5) | |
| College degree or higher | 226 (33.1) | |
| Private medical insurance | 634 | |
| No | 233 (36.8) | |
| Yes | 401 (63.2) | |
| BMI (kg/m2) | 737 | 46 (42, 52) |
| Waist circumference (cm) | 685 | 136.3 (124.9, 147.6) |
| High sensitivity C-reactive protein (mg/L) | 593 | 7.0 (3.5, 12.4) |
| Glucose (mmol/L) | 590 | 6.94 (5.72, 8.88) |
| HbA1c (%) | 700 | 6.9 (6.2, 7.9) |
| C-peptide (nmol/L) | 590 | 1.32 (0.89, 1.73) |
| Insulin (pmol/L) | 593 | 165.3 (103.5, 272.2) |
| Proinsulin (pM/L) | 586 | 32.7 (17.1, 59.3) |
| Proinsulin/insulin ratio | 585 | 0.20 (0.11, 0.35) |
| Leptin (µg/L) | 586 | 52.3 (38.0, 69.8) |
| Leptin/fat mass ratio (µg/L/kg) | 478 | 0.78 (0.58, 1.05) |
| HOMA %S* | 580 | 30.5 (18.9, 48.4) |
| HOMA %B* | 580 | 109.6 (66.4, 171.6) |
| Ghrelin total (pg/mL) | 586 | 695.2 (581.9, 825.5) |
| Free fatty acids (mmol/L) | 590 | 0.71 (0.55, 0.91) |
| Serum creatinine (mg/dL) | 706 | 0.8 (0.6, 0.9) |
| Serum cystatin C (mg/L) | 707 | 0.91 (0.77, 1.11) |
| eGFR (ml/min/1.73 m2) | 699 | 94 (75, 108) |
| eGFR < 60 | 85 (12.2) | |
| ACR (mg/g) | 650 | 8.9 (5.5, 24.5) |
| ACR 30-300 (microalbuminuria) | 101 (15.5) | |
| ACR >300 (macroalbuminuria) | 40 (6.2) | |
| Prognostic Risk for CKD | 638 | |
| Low | 446 (69.9) | |
| Moderate | 120 (18.8) | |
| High | 51 (8.0) | |
| Very High | 21 (3.3) | |
| Presence of hypertension | 730 | |
| No | 98 (13.4) | |
| Yes | 632 (86.6) | |
| Systolic blood pressure (mmHg) | 726 | 130 (120, 140) |
| Diastolic blood pressure (mmHg) | 726 | 77 (69, 84) |
| Length of time with DM (yrs) | 352 | |
| < 5 | 114 (32.4) | |
| 5 - 10 | 108 (30.7) | |
| ≥ 10 | 130 (36.9) | |
| Insulin use | 690 | |
| No | 500 (72.5) | |
| Yes | 190 (27.5) | |
| Number of non-insulin diabetes medications | 737 | |
| 0 | 115 (15.6) | |
| 1 | 45 (6.1) | |
| 2 | 258 (35.0) | |
| ≥3 | 319 (43.3) | |
| Use of RAAS blocking agents | 737 | |
| No | 287 (38.9) | |
| Yes | 450 (61.1) | |
| Bariatric surgery type | 737 | |
| RYGB | 543 (73.7) | |
| LAGB | 167 (22.7) | |
| Others** | 27 (3.7) | |
Abbreviations: BMI = body mass index; HOMA %S = insulin sensitivity by homeostatic model assessment; HOMA %B = beta-cell function by homeostatic model assessment; eGFR = estimated glomerular filtration rate; ACR = urine albumin-to-creatinine ratio; SBP = systolic blood pressure; DBP = diastolic blood pressure; RAAS = renin-angiotensin-aldosterone; RYGB = Roux-en-Y Gastric Bypass; LAGB = Laparoscopic gastric band.
HOMA %S and HOMA %B were calculated using HOMA Calculator ©The University of Oxford 201315.
Including gastric sleeve, biliopancreatic diversion with duodenal switch and banded gastric bypass.
Effect Reporting.
For LMM (i.e. eGFR) we reported estimated regression coefficients with 95% confidence intervals whereas for GLMM with logit link we presented odds ratios with 95% confidence intervals. Effects involving continuous interactions were represented with interaction plots and through coefficients/odds ratios estimated at the first quartile, median, and the third quartile of the continuous variable.
Analyses were conducted using SAS version 9.4 (SAS Institute, Inc., Cary, NC). All reported p-values are two sided. Statistical significance was defined as p <0.05.
RESULTS
Baseline Characteristics and Five-Year Outcomes of Study Cohort
Study flow is shown in Supplementary Figure 1. Characteristics of the 737 bariatric surgery patients with diabetes at baseline are shown in Table 1. 71% of participants were women, 85% were white, and 75% had some post-secondary school education. Median HbA1c was 6.9%. The cohort consisted of patients with type 2 diabetes as reflected in C-peptide levels.16 Over 78% of participants used 2 or more non-insulin diabetes medications with 28% requiring insulin. Median eGFR was 94 ml/min/1.73 m2 with 12% of patients having an eGFR<60 ml/min/1.73 m2. Median ACR was 8.9 mg/g with 22% of participants having moderately/severely increased albuminuria. 18.8% of patients had moderate, 8% high, and 3.3% very high prognostic risk for CKD.
Measures of weight, CKD parameters, study time points, and diabetes remission up to 5 years after bariatric surgery in the 737 bariatric surgery patients with diabetes at baseline are shown in Supplementary Table 1. By the end of year 5, median percent weight loss was 24%, change in eGFR was negligible (median of −1 ml/min/1.73 m2), 34% (48/141) patients had regression of their moderately/severely increased albuminuria, and 47% (257/553 with data) achieved remission of diabetes.
Relationship between Post-Surgical Remission of Diabetes and Parameters of CKD
The relationship between post-bariatric surgery remission of diabetes and eGFR and ACR levels during follow-up were each examined separately in adjusted analyses. Results in Table 2 show that remission of diabetes was not significantly associated with eGFR after surgery [β=0.43, 95% CI (−0.86, 1.72)] and this held true in a sensitivity analysis that excluded persons with hyperfiltration (i.e. eGFR >120 ml/min/1.73m2). A shorter time length since surgery, younger age at time of surgery, higher household income, lower baseline systolic blood pressure, higher baseline eGFR, and Roux-en-Y gastric bypass were associated with a higher eGFR after surgery.
Table 2:
Adjusted Associations between Patient Characteristics and eGFR over 5 Year Follow-Up after Bariatric Surgery*
| Variables | Regression coefficient, β (95% CI) | p-value |
|---|---|---|
| Time since Surgery (at median age=52) | 0.04 | |
| Year 2 versus Year 1 | 1.52 (0.47, 2.57) | 0.005 |
| Year 3 versus Year 1 | −0.83 (−1.90, 0.24) | 0.1 |
| Year 4 versus Year 1 | −4.13 (−5.21, −3.06) | <0.001 |
| Year 5 versus Year 1 | −7.37 (−8.44, −6.30) | <0.001 |
| Baseline Characteristics** | ||
| Age (years) (per 5-year decrease) | 0.04 | |
| At Year 1 | 1.42 (0.80, 2.04) | <0.001 |
| At Year 2 | 1.64 (0.99, 2.28) | <0.001 |
| At Year 3 | 1.83 (1.16, 2.50) | <0.001 |
| At Year 4 | 2.13 (1.47, 2.80) | <0.001 |
| At Year 5 | 2.23 (1.57, 2.89) | <0.001 |
| Annual household income | 0.04 | |
| <$25,000 versus ≥ $100,000 | −2.23 (−5.35, 0.89) | 0.2 |
| $25,000 - $49,999 versus ≥ $100,000 | −4.66 (−8.03, −1.28) | 0.01 |
| $50,000 - $74,999 versus ≥ $100,000 | −4.11 (−7.20, −1.02) | 0.01 |
| $75,000 - $99,999 versus ≥ $100,000 | −3.47 (−6.49, −0.45) | 0.02 |
| Systolic blood pressure (mmHg) (per 10 mmHg decrease) | 1.29 (0.70, 1.89) | <0.001 |
| eGFR (ml/min/1.73 m2) (per 10 unit increase) | 6.91 (6.47, 7.36) | <0.001 |
| Bariatric surgery type | ||
| RYGB versus LAGB | 4.97 (2.60, 7.35) | <0.001 |
| Time varying characteristics | ||
| Remission of diabetes (partial or complete) | ||
| Yes versus No | 0.43 (−0.86, 1.72) | 0.5 |
eGFR measured in ml/min/1.73m2. Analysis adjusted for missing related baseline variables, site and age. n=586.
The interaction between age and time since surgery was statistically significant (p = 0.04) such that a five-year decrease in age was associated with variable increases in mean eGFR over time. The time effect was evaluated at median age and the age effect was evaluated separately for all years after surgery. For instance, a participant 1 year after surgery is expected to have 1.4 ml/min/1.73 m2 higher eGFR compared to a similar but 5-year younger participant; this difference in eGFR increases to 2.2 ml/min/1.73 m2 by year 5 post-surgery.
Abbreviations: eGFR = estimated glomerular filtration rate; RYGB = Roux-en-Y Gastric Bypass; LAGB = Laparoscopic adjustable gastric banding.
Table 3 demonstrates that participants with partial or complete remission of diabetes had a lower odds of moderately/severely increased albuminuria post-surgery compared to those with no remission (OR [95% CI]: 0.66 [0.48, 0.90]) after adjusting for baseline characteristics. A sensitivity analysis excluding 3 patients with baseline ACR levels >2000 mg/g found no qualitative difference in this result (0.70 [0.50, 0.97]). In addition to diabetes remission, younger age at time of surgery, female sex, white race, lower baseline ACR and HOMA %B and no use of renin-angiotensin-aldosterone (RAAS) blocking agents were also significantly associated with lower odds of moderately/severely increased albuminuria.
Table 3:
Adjusted Associations between Patient Characteristics and Moderately/Severely Increased Albuminuria over 5 Year Follow-Up after Bariatric Surgery*
| Variables | Risk Ratio (95% CI) | p-value |
|---|---|---|
| Time since Surgery (at median age=52) | 0.01 | |
| Year 2 versus Year 1 | 0.90 (0.70, 1.15) | 0.4 |
| Year 3 versus Year 1 | 0.94 (0.70, 1.25) | 0.7 |
| Year 4 versus Year 1 | 0.89 (0.66, 1.19) | 0.4 |
| Year 5 versus Year 1 | 0.86 (0.63, 1.18) | 0.4 |
| Baseline Characteristics | ||
| Age (in years) (per 5-year decrease) | 0.01 | |
| At Year 1 | 1.04 (0.92, 1.18) | 0.5 |
| At Year 2 | 0.90 (0.78, 1.03) | 0.1 |
| At Year 3 | 0.81 (0.70, 0.94) | 0.01 |
| At Year 4 | 0.86 (0.74, 0.999) | 0.05 |
| At Year 5 | 0.80 (0.68, 0.93) | 0.004 |
| Sex | ||
| Female versus Male | 0.65 (0.44, 0.97) | 0.04 |
| Race | ||
| White versus Non-white | 0.53 (0.32, 0.86) | 0.01 |
| ACR (mg/g) (per 10 mg/g decrease) | 0.997 (0.996, 0.998) | <0.001 |
| Glucose (mmol/L) (per 0.5 mmol/L decrease) | 0.98 (0.95, 1.003) | 0.08 |
| HOMA2 %B (per 10% decrease) | 0.994 (0.989, 0.998) | 0.003 |
| Use of RAAS blocking agents | ||
| No versus Yes | 0.60 (0.40, 0.90) | 0.01 |
| Bariatric surgery type | ||
| RYGB versus LAGB | 1.004 (0.66, 1.54) | 0.9 |
| Time varying characteristics | ||
| Remission (partial or complete) of diabetes | ||
| Yes versus No | 0.66 (0.48, 0.90) | 0.01 |
Adjusted for missing related baseline variables, site and age. n=477.
A significant interaction between age and time since surgery (p = 0.01) is noted such that longer follow-up time since surgery intensifies the age effect. For instance, at year 1 after surgery the odds of moderately/severely increased albuminuria for a participant was very similar to an otherwise similar but 5-year younger participant (OR = 1.04, p = 0.5); this odds ratio decreased to 0.8 (p = 0.004) at 5 years after surgery, meaning participants who are 5 years younger have a 20% lower odds of moderately/severely increased albuminuria compared to an otherwise similar participant.
Abbreviations: ACR = urine albumin-to-creatinine ratio; HOMA %B = beta cell function by homeostatic model assessment; RAAS = renin-angiotensin-aldosterone; RYGB = Roux-en-Y Gastric Bypass; LAGB = Laparoscopic adjustable gastric banding
As described in Table 4, complete or partial remission of diabetes at 5 years was significantly associated with a greater likelihood of stabilization in the prognostic risk for CKD as compared to no remission. This association was dependent on baseline ghrelin levels (p= 0.02 for interaction between baseline ghrelin and diabetes remission). This interaction is graphically presented in Supplementary Figure 2 which shows that the predicted probability of stabilization improves with increasing ghrelin levels for those without remission of diabetes but remains stable for any ghrelin level in those who achieved remission. Other baseline characteristics associated with stabilization of prognostic risk included private medical insurance, lower baseline systolic blood pressure, no use of RAAS blocking agents, and having moderate or high versus low prognostic risk for CKD (with stabilization in the low risk group being inversely related to circulating insulin levels (Supplementary Figure 3)). Longer time since surgery was associated with worsened prognostic risk for CKD (particularly at year 5 versus year 1, odds of stabilization of CKD risk (0.93 [0.89-0.97])). Of note, remission of diabetes was not significantly associated with an improvement in the prognostic risk for CKD by five years (Supplementary Table 2).
Table 4:
Adjusted Associations between Patient Characteristics and Stabilization in the Prognostic Risk for CKD over 5 Years after Bariatric Surgery*
| Characteristics | Risk ratio (95% CI) | P value |
|---|---|---|
| Time since Surgery | 0.02 | |
| Year 2 versus Year 1 | 0.99 (0.96, 1.02) | 0.5 |
| Year 3 versus Year 1 | 0.99 (0.96, 1.03) | 0.6 |
| Year 4 versus Year 1 | 0.99 (0.95, 1.02) | 0.4 |
| Year 5 versus Year 1 | 0.93 (0.89, 0.97) | 0.001 |
| Baseline Characteristics | ||
| Age (years) (per 5-year increase) | 1.00 (0.99, 1.01) | 0.5 |
| Race | ||
| White versus Non-white | 0.99 (0.96, 1.03) | 0.7 |
| Private medical insurance | ||
| Yes versus No | 1.03 (1.002, 1.07) | 0.04 |
| Systolic blood pressure (per 20 mmHg decrease) | 1.02 (1.003, 1.05) | 0.02 |
| Use of RAAS blocking agents | ||
| No versus Yes | 1.03 (1.001, 1.06) | 0.04 |
| Baseline prognostic risk for CKD (by baseline insulin) Moderate/High risk versus Low risk | 0.02 | |
| At 1st quartile (102.8 pmol/L) | 1.03 (1.003, 1.07) | 0.03 |
| At median (162.2 pmol/L) | 1.04 (1.01, 1.07) | 0.01 |
| At 3rd quartile (266.7 pmol/L) | 1.05 (1.02, 1.08) | 0.001 |
| Bariatric surgery type | ||
| RYGB versus LAGB | 1.01 (0.97, 1.06) | 0.5 |
| Time Dependent Variables | ||
| Diabetes remission (partial or complete) (by baseline ghrelin) Yes versus No | 0.02 | |
| At 1st quartile (587.4 pg/mL) | 1.04 (0.997, 1.08) | 0.07 |
| At median (697.6 pg/mL) | 1.02 (0.99, 1.06) | 0.2 |
| At 3rd quartile (828.8 pg/mL) | 1.01 (0.98, 1.04) | 0.6 |
| % Weight loss from baseline (per 10% m weight) | 0.99 (0.97, 1.001) | 0.06 |
GLMM were used to model the stabilization in prognostic risk for CKD (stable vs. not stable). Missing related baseline covariates, including age, race, clinical sites, and baseline ghrelin total level were adjusted in the models, n=408.
Abbreviations: RAAS = renin-angiotensin-aldosterone; RYGB = Roux-en-Y Gastric Bypass; LAGB = Laparoscopic adjustable gastric banding
Relationship between Baseline Indicators of CKD and Likelihood of Post-Bariatric Surgery Remission of Diabetes
A higher baseline eGFR was associated with an increased odds of partial or complete diabetes remission (p<0.001), and this effect was amplified at higher C-peptide levels (see Figure 1 and odds ratios in Supplementary Table 3). In contrast, baseline ACR was not significantly associated (1.004 [0.999, 1.01]) with remission of diabetes (Supplementary Table 3).
Figure 1:
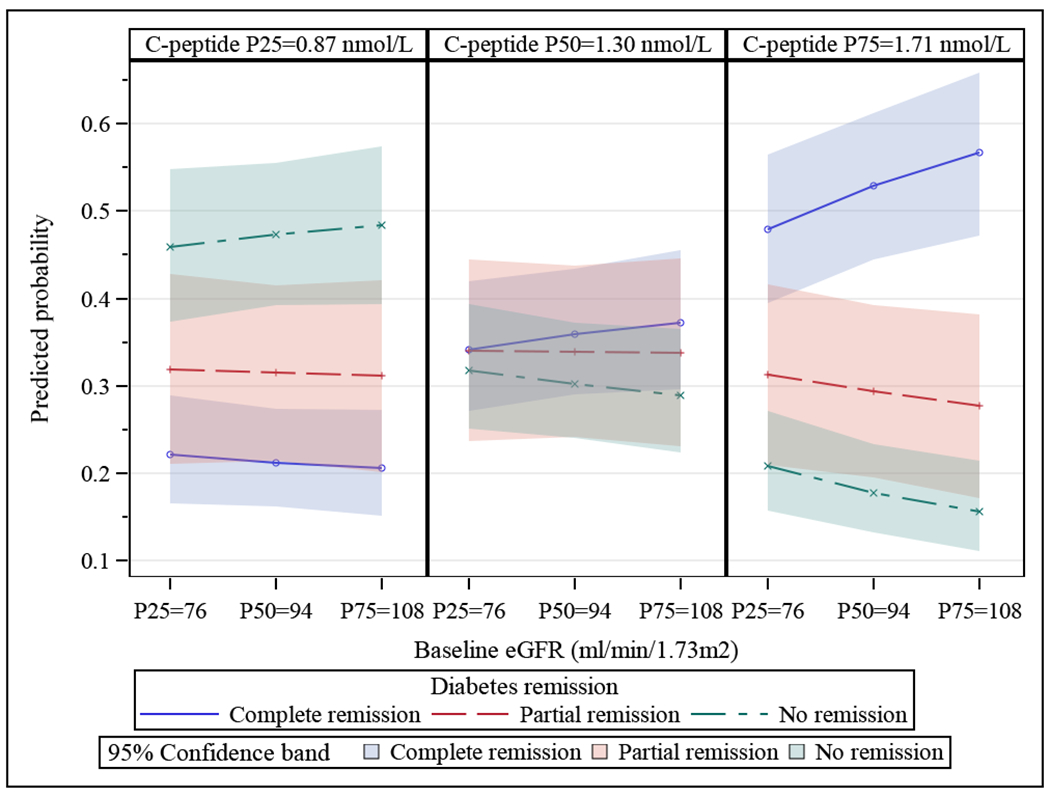
Interaction between Baseline eGFR and C-Peptide Levels and the Likelihood of Remission of Diabetes by 5 Years after Bariatric Surgery. Each of the three figures show baseline eGFR (x-axis, where P25, P50, and P75 are 25th, 50th, 75th percentiles of eGFR levels at baseline) for the 25th (P25) (figure on left), 50th (P50) (middle figure) and 75th (P75) (figure on right) percentiles of baseline C-peptide. The predicted probability of remission (none, partial, complete) of diabetes is seen on the y-axis. Predicted probabilities were obtained from generalized linear mixed models with diabetes remission as ordinal outcome and with the covariates baseline C-peptide, baseline eGFR, and their interaction while adjusting for missing related baseline covariates age, gender, and clinic sites. N=559. P-value=0.001.
Similarly, individuals with a low or moderate prognostic risk for CKD had a higher likelihood of diabetes remission during the 5 years after bariatric surgery compared to persons with high or very high baseline risk (Table 5). This relationship was influenced by baseline C-peptide whereby higher circulating levels of C-peptide amplified the likelihood of remission of diabetes. Other variables associated with increased odds of diabetes remission included shorter time since surgery, younger age, male sex, treatment with Roux-en-Y gastric bypass (versus adjustable laparoscopic banding), lower HbA1c, lower circulating insulin, no baseline use of insulin, two or fewer non-insulin diabetes medications, and greater weight loss. A higher circulating C-peptide was linked to higher rates of diabetes remission in patients undergoing bariatric surgery and was especially pronounced in the Roux-en-Y bypass cohort (Supplementary Figure 4). A similar pattern was seen in patients with low or moderate baseline prognostic risk for CKD (Supplementary Figure 5).
Table 5.
Adjusted Association between Patient Characteristics and Remission of Diabetes over 5 Years after Bariatric Surgery*
| Characteristics | Odds ratio (95% CI) | P value |
|---|---|---|
| Time since Surgery | 0.03 | |
| Year 2 versus Year1 | 1.05 (0.73, 1.52) | 0.8 |
| Year 3 versus Year1 | 0.80 (0.55, 1.17) | 0.3 |
| Year 4 versus Year1 | 0.72 (0.49, 1.05) | 0.09 |
| Year 5 versus Year1 | 0.61 (0.42, 0.90) | 0.01 |
| Pre-operative Characteristics | ||
| Age (per 5 years decrease) | 1.28 (1.17, 1.42) | <0.001 |
| Gender (Male versus Female) | 1.82 (1.21, 2.73) | 0.004 |
| Education | 0.09 | |
| Some college/post high school versus High school or less | 0.69 (0.43, 1.11) | 0.1 |
| College degree or higher versus High school or less | 1.05 (0.64, 1.71) | 0.9 |
| Bariatric Surgery Type (by baseline C-peptide) RYGB versus LAGB | <0.001 | |
| At 1st quartile (0.87 nmol/L) | 3.00 (1.63, 5.52) | <0.001 |
| At median (1.30 nmol/L) | 4.62 (2.76, 7.73) | <0.001 |
| At 3rd quartile (1.71 nmol/L) | 7.02 (4.13, 11.95) | <0.001 |
| Prognostic risk for CKD (by baseline C-peptide) Low/Moderate risk versus High/Very high risk | 0.01 | |
| At 1st quartile (0.87 nmol/L) | 1.38 (0.74, 2.59) | 0.3 |
| At median (1.30 nmol/L) | 2.09 (1.18, 3.69) | 0.01 |
| At 3rd quartile (1.71 nmol/L) | 3.11 (1.67, 5.78) | <0.001 |
| HbA1c (per 0.5% decrease) | 1.26 (1.17, 1.35) | <0.001 |
| Insulin (per 40 pmol/L decrease) | 1.04 (1.01, 1.08) | 0.02 |
| Proinsulin (per 20 pM/L decrease) | 1.10 (0.99, 1.22) | 0.06 |
| Insulin use (No versus Yes) | 2.15 (1.32, 3.48) | 0.002 |
| Number of non-insulin diabetes medications (≤2 versus ≥3) | 3.02 (2.05, 4.44) | <0.001 |
| Time Dependent Variables | ||
| % weight loss from baseline (per 10% more loss in weight) | 2.31 (1.95, 2.74) | <0.001 |
GLMM with ordinal diabetes remission as outcome was used to model the probability of having complete/partial remissions. Missing related baseline covariates age, sex, and clinical sites were adjusted for in the model. N=466.
Abbreviations: RYGB = Roux-en-Y Gastric Bypass; LAGB = Laparoscopic adjustable gastric banding.
DISCUSSION
Our study found that remission of diabetes over five years after bariatric surgery was associated with an improvement in albuminuria and stabilization of prognostic risk for CKD. We also observed an inverse relationship between eGFR and prognostic risk for CKD and the likelihood of diabetes remission after bariatric surgery. These novel findings have important clinical implications for the management of obesity, type 2 diabetes, and kidney disease. Bariatric surgery offers a unique model with which to study these topics since aside from pancreas transplantation for (type 1) diabetes it is the only therapeutic intervention for (type 2) diabetes known to consistently result in clinically significant rates of diabetes remission.6 In contrast, intensive lifestyle management is much less effective at inducing long-term remission of type 2 diabetes.17
A major finding in the present study was that partial or complete remission of type 2 diabetes five years after bariatric surgery was linked to an improvement in albuminuria and a stabilization in the prognostic risk for CKD. However, we did not see a relationship between remission of diabetes and changes in eGFR or any improvement in the prognostic risk for CKD categories. This last result contrasts with our previous finding that bariatric surgery was associated with an improvement in CKD prognostic risk in a larger cohort mostly free of diabetes who were followed for up to seven years.12 One possible reason for the difference may relate to timing. Pathologic changes in the kidney indicative of type 1 diabetic kidney disease appear to start regressing only beginning five years from the time of pancreas transplantation.18 Our results suggest that the benefits of type 2 diabetes remission may take longer than our study period of five years. Alternatively, it is possible that our patients are at higher risk for CKD progression than those without diabetes and that stabilization of CKD risk does actually represent an improvement. Other as yet unidentified factors may be also playing a role.
We also observed that higher baseline ghrelin levels were associated with stabilization of CKD prognostic risk though primarily in patients whose diabetes did not remit. Ghrelin is an orexigenic peptide secreted by the stomach that acts as a key mediator of hunger and energy balance. Ghrelin’s biologic role is complex and still being elucidated but it has been demonstrated in rodent models to have diuretic19, vasodilatory20,21, anti-hypertensive21, and anti-inflammatory22 effects that offer reno-20,23 and cardioprotection. Why a beneficial effect of ghrelin was not observed in patients with diabetes remission is not clear and should be confirmed in future studies. We found a statistically significant association between weight loss and improvement in prognostic risk for CKD which is consistent with what we previously reported.12 However, it was not associated with individual improvements in albuminuria or eGFR.
Another major finding was that a higher baseline eGFR and lower prognostic risk for CKD were both independently associated with a greater likelihood of diabetes remission after bariatric surgery. One possible explanation involves a pattern of insulin resistance observed in CKD patients7 that could be acting as a counterbalance to the insulin-sensitizing effects of the surgery. The cause of insulin resistance and glucose intolerance in CKD appears to be related to deranged post-insulin receptor signaling in muscle tissues24,25 perhaps from a heightened inflammatory state or other abnormalities.7 More recent studies also raise the possibility that additional factors independent of GFR, such as body composition, also play a role in influencing insulin activity.26–28 However, in our study patients with high or very high prognostic risk for CKD had a lower rate of diabetes regression even after independently controlling for body mass. Also of note was that higher baseline C-peptide levels enhanced the association between a higher eGFR/lower prognostic risk for CKD and likelihood of diabetes remission. C-peptide is produced with insulin in equimolar amounts and is a good indicator of pancreatic β-cell function. In our study C-peptide may be acting as a surrogate for the resilience of the β-cell mass, where higher blood levels reflect a greater capacity to secrete insulin in the amounts necessary to remit diabetes, and vice versa. Another possible explanation for the inverse relationship between preexisting baseline kidney disease and future likelihood of remission is that worse kidney function may simply reflects a longer duration of diabetes and/or pancreatic exhaustion.
These observations describe a complex interplay between kidney disease, diabetes and bariatric surgery. On the one hand bariatric surgery stabilizes or improves certain indicators of CKD. In light of the tremendous health and financial toll attributable to CKD in patients with type 2 diabetes, this may be of great importance. In fact, preliminary research supports the idea that bariatric surgery may especially effective in slowing progression to kidney failure in patients with more severe diabetes or CKD, such as persons with higher levels of circulating insulin or albuminuria29,30. On the other hand patients with worse kidney function at baseline (in our study, lower GFR or higher prognostic risk for CKD) have a substantially lower likelihood of reaping one of the major potential benefits of bariatric surgery, which is remission of diabetes. A clearer understanding of how these conflicting effects influence patient outcomes requires additional study. It is tempting to speculate that while patients who achieve complete remission of diabetes will have the lowest absolute risk of CKD-associated mortality, patients with the highest pre-operative CKD risk who do not achieve remission but merely improve control of their diabetes may have the largest relative risk reduction for CKD-associated mortality.
In addition to studying eGFR and albuminuria, we also included a third relatively recently developed factor (i.e. prognostic risk for CKD) that has been validated as representing risk for future CKD (as well as other major outcomes) by KDIGO in a cohort of 1.5 million patients. Clinicians are well aware that eGFR or albuminuria alone may not represent a complete picture of CKD risk. The value of including prognostic risk for CKD is that it includes both eGFR and albuminuria in its assessment of risk and thereby provides more information than each variable would alone. We felt this risk marker would be useful to use in a cohort such as ours (similar to how it was used in a previous landmark trial31) in which only a minority of individuals had CKD at baselines.
Our study has several strengths, including its large size, years-long follow-up, and availability of a wide variety of clinical data and biomarkers related to kidney disease, diabetes, and adiposity. Routine availability of serum creatinine, cystatin C, and albuminuria allowed us to estimate the glomerular filtrate rate using what we previously reported to be the most accurate equation in bariatric surgery patients11 and assess prognostic risk for CKD using internationally accepted criteria.13 Remission of diabetes was also defined using a contemporary definition. The availability of data on gut hormones/peptides and biomarkers of glycemia allowed us to explore and identify new biologic relationships. Taken together these strengths allowed us make the several observations described above.
The study also had limitations. There were not enough patients with established or advanced kidney disease or long enough follow-up to assess harder outcomes such as death or ESRD. The lack of a comparison group prevented us from determining the relative effects of bariatric surgery. Episodes of hospitalizations and acute kidney injury were not included in the analyses and this may have underestimated the impact of the variables studied on adverse outcomes. We did not have information on duration of diabetes. There was an abrupt but modest early shift in cystatin C measurements related to the manufacturer’s calibrator method, but previous sensitivity analyses that substituted a creatinine-based eGFR equation for the combined creatinine and cystatin C-based equation did not qualitatively change findings12. Finally, kidney biopsies were not available to determine the precise cause of CKD in our study patients. However, routine kidney biopsies are not usually performed in patients with presumed diabetic kidney disease making our results pertinent to routine clinical practice.
In summary, we report that partial or complete remission of type 2 diabetes at 5 years after bariatric surgery is associated with an improvement in moderately/severely increased albuminuria and stabilization of prognostic risk for CKD. Additionally, worse kidney function at time of bariatric surgery was linked to a lower likelihood of diabetes remission. These intriguing findings warrant further study to determine if bariatric surgery can prevent or delay the progression to kidney failure in this population and to identify which patients would most benefit.
Supplementary Material
Supplementary Table 1: Measures of Weight, CKD Parameters, and Diabetes Remission among LABS-2 Participants with Diabetes by 5 Years Since Surgery
Supplementary Table 2. Adjusted Associations between Patient Characteristics and Improvement in Prognostic Risk for CKD over 5 Years after Bariatric Surgery
Supplementary Table 3. Adjusted Association between Baseline eGFR and Remission of Diabetes over 5 Years after Bariatric Surgery
Supplementary Figure 1. Flow Chart of Study Participant Selection
Supplementary Figure 2: Interaction of Diabetes Remission and Baseline Ghrelin Levels on the Predicted Probability of Stabilization of Prognostic Risk for CKD over 5 Years after Bariatric Surgery
Supplementary Figure 3: Interaction between Baseline Prognostic Risk for CKD and Baseline Insulin Levels on Stabilization of Prognostic Risk for CKD over 5 Years after Bariatric Surgery
Supplementary Figure 4: Interaction between Baseline C-Peptide and Type of Bariatric Surgery on Remission of Diabetes over 5 Years after Bariatric Surgery
Supplementary Figure 5: Interaction between Baseline C-Peptide levels and Prognostic Risk for CKD on Remission of Diabetes over 5 Years after Bariatric Surgery
ACKNOWLEDGMENTS
This clinical study was a cooperative agreement funded by the National Institute of Diabetes and Digestive and Kidney Diseases (NIDDK). Grant numbers: DCC -U01 DK066557; Columbia - U01-DK66667 (in collaboration with Cornell University Medical Center CTRC, Grant UL1-RR024996); University of Washington - U01-DK66568 (in collaboration with CTRC, Grant M01RR-00037); Neuropsychiatric Research Institute - U01-DK66471; East Carolina University – U01-DK66526; University of Pittsburgh Medical Center – U01-DK66585 (in collaboration with CTRC, Grant UL1-RR024153); Oregon Health & Science University – U01-DK66555. This study was a cooperative agreement funded by the National Institute of Diabetes and Digestive and Kidney Diseases (NIDDK). NIDDK scientists contributed to the design and conduct of the study which included collection and management of data. The project scientist from the NIDDK served as a member of the steering committee along with the principal investigator from each clinical site and the data coordinating center. The data coordinating center housed all data during the study and performed data analyses according to a pre-specified plan developed by the data coordinating center biostatistician and approved by the steering committee and independent data and safety monitoring board. The decision to publish was made by the LABS-2 steering committee, with no restrictions imposed by the sponsor.
Footnotes
DISCLOSURES:
None
REFERENCES
- 1.Atkins RC, Zimmet P. Diabetic kidney disease: act now or pay later. Kidney Int. 2010;77(5):375–377. [DOI] [PubMed] [Google Scholar]
- 2.U.S. Renal Data System, USRDS 2018 Annual Data Report: Atlas of End-Stage Renal Disease in the United States. Bethesda, MD: National Institutes of Health, National Institute of Diabetes and Digestive and Kidney Diseases, 2018. [Google Scholar]
- 3.Slinin Y, Ishani A, Rector T, et al. Management of hyperglycemia, dyslipidemia, and albuminuria in patients with diabetes and CKD: a systematic review for a KDOQI clinical practice guideline. Am J Kidney Dis. 2012;60(5):747–769. [DOI] [PubMed] [Google Scholar]
- 4.Friedman AN, Wolfe B. Is Bariatric Surgery an Effective Treatment for Type II Diabetic Kidney Disease? Clin J Am Soc Nephrol. 2016;11(3):528–535. [DOI] [PMC free article] [PubMed] [Google Scholar]
- 5.D’Agati VD, Chagnac A, de Vries AP, et al. Obesity-related glomerulopathy: clinical and pathologic characteristics and pathogenesis. Nature reviews. Nephrology. 2016;12(8):453–471. [DOI] [PubMed] [Google Scholar]
- 6.Purnell JQ, Selzer F, Wahed AS, et al. Type 2 Diabetes Remission Rates After Laparoscopic Gastric Bypass and Gastric Banding: Results of the Longitudinal Assessment of Bariatric Surgery Study. Diabetes Care. 2016;39(7):1101–1107. [DOI] [PMC free article] [PubMed] [Google Scholar]
- 7.Spoto B, Pisano A, Zoccali C. Insulin resistance in chronic kidney disease: a systematic review. Am J Physiol-Renal. 2016;311(6):F1087–F1108. [DOI] [PubMed] [Google Scholar]
- 8.Belle SH, Berk PD, Chapman WH, et al. Baseline characteristics of participants in the Longitudinal Assessment of Bariatric Surgery-2 (LABS-2) study. Surg Obes Relat Dis. 2013;9(6):926–935. [DOI] [PMC free article] [PubMed] [Google Scholar]
- 9.Belle SH, Berk PD, Courcoulas AP, et al. Safety and efficacy of bariatric surgery: Longitudinal Assessment of Bariatric Surgery. Surg Obes Relat Dis. 2007;3(2):116–126. [DOI] [PMC free article] [PubMed] [Google Scholar]
- 10.Inker LA, Schmid CH, Tighiouart H, et al. Estimating glomerular filtration rate from serum creatinine and cystatin C. N Engl J Med. 2012;367(1):20–29. [DOI] [PMC free article] [PubMed] [Google Scholar]
- 11.Friedman AN, Moe S, Fadel WF, et al. Predicting the Glomerular Filtration Rate in Bariatric Surgery Patients. Am J Nephrol. 2014;39(1):8–15. [DOI] [PMC free article] [PubMed] [Google Scholar]
- 12.Friedman AN, Wahed AS, Wang J, et al. Effect of Bariatric Surgery on CKD Risk. J Am Soc Nephrol. 2018;29(4):1289–1300. [DOI] [PMC free article] [PubMed] [Google Scholar]
- 13.Kidney Disease Improving Global Outcomes Kidney CKD Working Group. KDIGO clinical practice guideline for the evaluation and management of chronic kidney disease. Kidney Int. 2013;3(Suppl):1–150. [Google Scholar]
- 14.Buse JB, Caprio S, Cefalu WT, et al. How do we define cure of diabetes? Diabetes Care. 2009;32(11):2133–2135. [DOI] [PMC free article] [PubMed] [Google Scholar]
- 15.The Oxford Centre for Diabetes E, and Metabolism. HOMA2 Calculator. 2019; https://www.dtu.ox.ac.uk/homacalculator/. Accessed February 21, 2019. [Google Scholar]
- 16.Jones AG, Hattersley AT. The clinical utility of C-peptide measurement in the care of patients with diabetes. Diabet Med. 2013;30(7):803–817. [DOI] [PMC free article] [PubMed] [Google Scholar]
- 17.Gregg EW, Chen H, Wagenknecht LE, et al. Association of an intensive lifestyle intervention with remission of type 2 diabetes. JAMA. 2012;308(23):2489–2496. [DOI] [PMC free article] [PubMed] [Google Scholar]
- 18.Fioretto P, Steffes MW, Sutherland DE, Goetz FC, Mauer M. Reversal of lesions of diabetic nephropathy after pancreas transplantation. N Engl J Med. 1998;339(2):69–75. [DOI] [PubMed] [Google Scholar]
- 19.Aoki H, Nakata M, Dezaki K, et al. Ghrelin counteracts salt-induced hypertension via promoting diuresis and renal nitric oxide production in Dahl rats. Endocr J. 2013;60(5):571–581. [DOI] [PubMed] [Google Scholar]
- 20.Takeda R, Nishimatsu H, Suzuki E, et al. Ghrelin improves renal function in mice with ischemic acute renal failure. J Am Soc Nephrol. 2006;17(1):113–121. [DOI] [PubMed] [Google Scholar]
- 21.Mao YJ, Tokudome T, Kishimoto I. Ghrelin and Blood Pressure Regulation. Curr Hypertens Rep. 2016;18(2). [DOI] [PubMed] [Google Scholar]
- 22.Sun GX, Ding R, Li M, et al. Ghrelin Attenuates Renal Fibrosis and Inflammation of Obstructive Nephropathy. J Urology. 2015;193(6):2107–2115. [DOI] [PubMed] [Google Scholar]
- 23.Rajan D, Wu RQ, Shah KG, Jacob A, Coppa GF, Wang P. Human ghrelin protects animals from renal ischemia-reperfusion injury through the vagus nerve. Surgery. 2012;151(1):37–47. [DOI] [PMC free article] [PubMed] [Google Scholar]
- 24.DeFronzo R, Alvestrand A, Smith D, Hendler R, Hendler E, Wahren J. Insulin resistance in uremia. J Clin Invest. 1981;67(2):563–568. [DOI] [PMC free article] [PubMed] [Google Scholar]
- 25.Cecchin F, Ittoop O, Sinha MK, Caro JF. Insulin Resistance in Uremia - Insulin-Receptor Kinase-Activity in Liver and Muscle from Chronic Uremic Rats. Am J Physiol. 1988;254(4):E394–E401. [DOI] [PubMed] [Google Scholar]
- 26.de Boer IH, Zelnick L, Afkarian M, et al. Impaired Glucose and Insulin Homeostasis in Moderate-Severe CKD. J Am Soc Nephrol. 2016;27(9):2861–2871. [DOI] [PMC free article] [PubMed] [Google Scholar]
- 27.Fliser D, Pacini G, Engelleiter R, et al. Insulin resistance and hyperinsulinemia are already present in patients with incipient renal disease. Kidney International. 1998;53(5):1343–1347. [DOI] [PubMed] [Google Scholar]
- 28.Trirogoff ML, Shintani A, Himmelfarb J, Ikizler TA. Body mass index and fat mass are the primary correlates of insulin resistance in nondiabetic stage 3–4 chronic kidney disease patients. Am J Clin Nutr. 2007;86(6):1642–1648. [DOI] [PubMed] [Google Scholar]
- 29.Shulman A, Peltonen M, Sjostrom CD, et al. Incidence of end-stage renal disease following bariatric surgery in the Swedish Obese Subjects Study. Int J Obes (Lond). 2018;42(5):964–973. [DOI] [PMC free article] [PubMed] [Google Scholar]
- 30.O’Brien R, Johnson E, Haneuse S, et al. Microvascular Outcomes in Patients With Diabetes After Bariatric Surgery Versus Usual Care: A Matched Cohort Study. Ann Intern Med. 2018;169(5):300–310. [DOI] [PMC free article] [PubMed] [Google Scholar]
- 31.The Look ARG. Effect of a long-term behavioural weight loss intervention on nephropathy in overweight or obese adults with type 2 diabetes: a secondary analysis of the Look AHEAD randomised clinical trial. The lancet. Diabetes & endocrinology. 2014. [DOI] [PMC free article] [PubMed] [Google Scholar]
Associated Data
This section collects any data citations, data availability statements, or supplementary materials included in this article.
Supplementary Materials
Supplementary Table 1: Measures of Weight, CKD Parameters, and Diabetes Remission among LABS-2 Participants with Diabetes by 5 Years Since Surgery
Supplementary Table 2. Adjusted Associations between Patient Characteristics and Improvement in Prognostic Risk for CKD over 5 Years after Bariatric Surgery
Supplementary Table 3. Adjusted Association between Baseline eGFR and Remission of Diabetes over 5 Years after Bariatric Surgery
Supplementary Figure 1. Flow Chart of Study Participant Selection
Supplementary Figure 2: Interaction of Diabetes Remission and Baseline Ghrelin Levels on the Predicted Probability of Stabilization of Prognostic Risk for CKD over 5 Years after Bariatric Surgery
Supplementary Figure 3: Interaction between Baseline Prognostic Risk for CKD and Baseline Insulin Levels on Stabilization of Prognostic Risk for CKD over 5 Years after Bariatric Surgery
Supplementary Figure 4: Interaction between Baseline C-Peptide and Type of Bariatric Surgery on Remission of Diabetes over 5 Years after Bariatric Surgery
Supplementary Figure 5: Interaction between Baseline C-Peptide levels and Prognostic Risk for CKD on Remission of Diabetes over 5 Years after Bariatric Surgery