Background: Virologically confirmed cases of 2019 novel coronavirus (2019-nCoV) in China and other countries have increased sharply (1, 2), leading to concerns regarding its pandemic potential. Viral epidemiology has been characterized sufficiently to permit construction of transmission models that predict the future course of this epidemic (3).
Objective: To provide insight into the changing nature of case findings and epidemic growth.
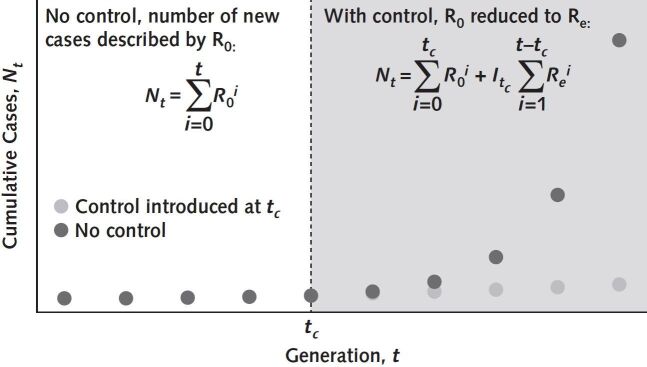
Methods: We developed a simple disease-transmission model in which the 2019-nCoV epidemic was modeled as a branching process starting in mid-November 2019, with a serial interval of 7 days (time between cases) and a basic reproduction number (R0) of 2.3 (new cases from each old case), based on available data and assuming no intervention (Figure 1). The epidemic start date aligned our modeled case counts to point estimates from international case exportation data (4). The model estimated plausible values of the effective reproduction number (Re; reproduction number in the presence of control efforts) after implementation of a quarantine in Wuhan and surrounding areas of China on 24 January 2020 (3) (Figure 1).
Figure 1.
Estimation of cumulative cases with and without implementation of control measures.
Serial interval is the average time between cases in a chain of transmission and is used to calculate the number of generations in an epidemic (time since epidemic start ÷ serial interval duration). In the absence of control measures, the total number of cases after t serial intervals depends on R0 (the number of new cases created by an index case in a completely susceptible population in the absence of intervention) and the number of epidemic generations (left-hand equation). Introduction of control is assumed to reduce the reproduction number to Re. The last generation with uncontrolled growth is indicated by tc, with an incident case count of Itc, and we can use the right-hand equation to calculate case numbers in the presence of control. The difference between the 2 curves shows the effect of introducing control measures vs. continued epidemic growth without control. R0 = basic reproduction number; Re = effective reproduction number.
Re values after intervention can be plotted as epidemic curves in a series of “contours,” similar to altitude values on a map. Because many combinations of model parameters create plausible epidemic trajectories, we have created an interactive tool that produces models with and without control efforts (https://art-bd.shinyapps.io/nCov_control).
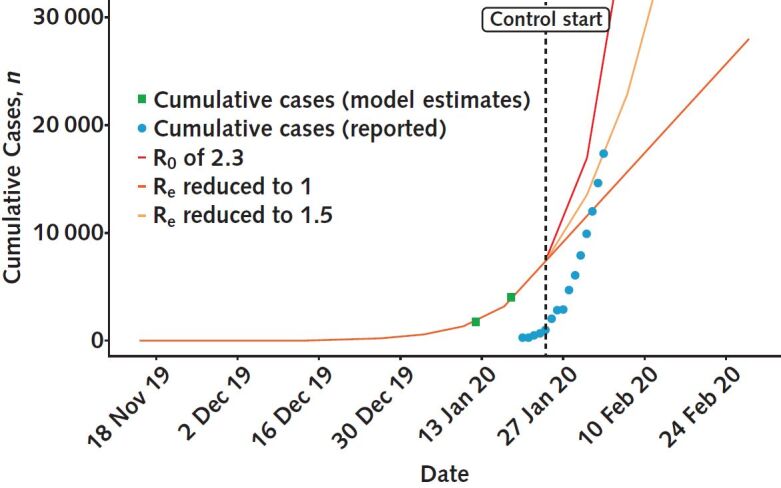
Findings: Comparison of cumulative case numbers versus model-generated counts shows that reported case numbers remain lower than modeled estimates, but ascertainment is increasingly complete over time (Figure 2). Based on previously published model estimates (4), the fraction of cases reported increased from 2.4% on 12 January 2020 to 11% on 18 January 2020 (4). Our model suggests that (assuming Re remained close to 2.3 after the quarantine on 24 January 2020) reported cases increased to 59% by 31 January 2020 (9930 reported cases vs. 16 860 modeled cases) (1, 2). The fraction of cases reported would be even higher if the reproduction number were lower because of control efforts.
Figure 2.

Simulated epidemic trajectories and reported cumulative case counts for 2019-nCoV.
The initial growth of the epidemic is based on introduction of the pathogen in mid-November 2019, with R0 = 2.3 and a serial interval of 7 d. The model reproduces estimates of case counts based on volume of internationally exported cases (green squares) (4). Daily cumulative counts of virologically confirmed cases are based on publicly available reports (blue circles) (1, 2). Case counts reported on 3 February 2020 are not compatible with reduction of Re to 1 but could be compatible with reduction to 1.5. If control is achieved, reported case counts will intersect horizontally with the contour lines on this graph. When reported cases move beyond contours vertically, the reproduction numbers represented by those contours become implausible. 2019-nCoV = 2019 novel coronavirus; R0 = basic reproduction number; Re = effective reproduction number.
Figure 2 shows a narrowing (horizontal distance) between case counts generated by the model and those reported by public health authorities over time. This suggests decreasing reporting times (from >10 days on 27 January 2020 to approximately 4 days by 3 February 2020). Contours generated by the model with intervention give us information about which (average) reproduction numbers may be plausible and which are implausible (Figure 2). If Re had fallen to 1.0 after 24 January 2020, the model predicts fewer cases than are currently being reported (as of 3 February 2020), making this level of control implausible. By contrast, reduction to an Re of 1.5 is plausible on the basis of reported cases and model estimates up to 3 February 2020, but it would also imply complete reporting.
Discussion: Using a simple model of epidemic growth that includes the representation of control efforts can provide helpful insights into the growth of the 2019-nCoV epidemic that are not directly observable in publicly reported data. Comparison of modeled and reported case counts suggests that reporting lags are decreasing and case ascertainment increasing over time. The narrowing gap between modeled and confirmed cases shows that the massive public health effort under way in China is increasing ascertainment of 2019-nCoV cases. Large leaps in reported case counts represent both disease activity and a surveillance effort that is “catching up” with an epidemic.
Contour plots can be used to indirectly estimate Re after introduction of control efforts, because case counts exceeding a given contour suggest that an Re value is implausible. Potential limitations of this model include underrepresentation of mild infections and its focus on an epidemic currently centered in China. If this epidemic becomes a pandemic, epidemiology in individual countries may diverge. Nonetheless, the tool may help policymakers by allowing inferences about likely underlying dynamics of the epidemic, even when available disease data are delayed or incomplete.
We will continue to plot case counts against such projections moving forward (with updated counts incorporated into our online tool). If cumulative case counts flatten and intersect with contour lines horizontally, either control is improving and the mean reproduction number is decreasing or (a pessimistic interpretation) case ascertainment efforts are flagging because of limited laboratory or human resources. Conversely, if reported case counts cross the contour lines above them, that would imply an ever higher minimum value for Re.
Biography
Disclaimer: The tool, available at https://art-bd.shinyapps.io/nCov_control, was developed by the authors for this article using a third-party application, which may have limited access and functionality. Neither Annals of Internal Medicine nor the American College of Physicians is responsible for the content and functionality of this online application. Questions regarding the use of the application should be addressed to the corresponding author (e-mail, david.fisman@utoronto.ca).
Disclosures: Authors have disclosed no conflicts of interest. Forms can be viewed at www.acponline.org/authors/icmje/ConflictOfInterestForms.do?msNum=M20-0358.
Reproducible Research Statement: Study protocol and statistical code: Described in Methods. Data set: Derived from reference 1 and available at https://docs.google.com/spreadsheets/d/19qC9EK2ydaSoKDMkmbbarXBo8Ism_1_6zeMrJh5kZ9Y/edit?usp=sharing.
Footnotes
This article was published at Annals.org on 5 February 2020.
References
- BNO News. BNO News. Tracking coronavirus: map, data and timeline. 2 February 2020. Accessed at https://bnonews.com/index.php/2020/02/the-latest-coronavirus-cases. on 3 February 2020.
- China Centers for Disease Control. China Centers for Disease Control. Distribution of pneumonia in a new coronavirus infection. 2020. Accessed at http://2019ncov.chinacdc.cn/2019-nCoV. on 3 February 2020.
- Wu JT, Leung K, Leung GM. Wu JT Leung K Leung GM Nowcasting and forecasting the potential domestic and international spread of the 2019-nCoV outbreak originating in Wuhan, China: a modelling study. Lancet. 2020 doi: 10.1016/S0140-6736(20)30260-9. [DOI] [PMC free article] [PubMed] [Google Scholar]
- Imai N, Cori A, Dorigatti I, et al. Imai N, Cori A, Dorigatti I, et al. Report 3: transmissibility of 2019-nCoV. 25 January 2020. Accessed at www.imperial.ac.uk/mrc-global-infectious-disease-analysis/news--wuhan-coronavirus. on 25 January 2020.


