Abstract
BACKGROUND AND PURPOSE:
Multiple sclerosis lesions develop around small veins that are radiologically described as the so-called central vein sign. With 7T MR imaging and magnetic susceptibility–based sequences, the central vein sign has been observed in 80%–100% of MS lesions in patients’ brains. However, a lower proportion ∼50% has been reported at 3T using susceptibility-weighted angiography (SWAN). Our aim was to assess a modified version of SWAN optimized at 3T for sensitive detection of the central vein sign.
MATERIALS AND METHODS:
Thirty subjects with MS were scanned on a 3T clinical MR imaging system. 3D T2-weighted FLAIR and optimized 3D SWAN called SWAN-venule, were acquired after injection of a gadolinium-based contrast agent. Patients showing >3 focal white matter lesions were included. The central vein sign was recorded by 2 trained raters on SWAN-venule images in the supratentorial brain.
RESULTS:
Twenty patients showing >3 white matter lesions were included. A total of 380 white matter lesions (135 periventricular, 144 deep white matter, and 101 juxtacortical) seen on both FLAIR and SWAN-venule images were analyzed. Overall, the central vein sign was detected in 86% of the white matter lesions (periventricular, 89%; deep white matter, 95%; and juxtacortical, 78%).
CONCLUSIONS:
The SWAN-venule technique is an optimized MR imaging sequence for highly sensitive detection of the central vein sign in MS brain lesions. This work will facilitate the validation and integration of the central vein sign to increase the diagnostic certainty of MS and further prevent misdiagnosis in clinical practice.
Pathologic studies from last century1 have shown that MS lesions develop around small veins and venules. With the recent advancement of magnetic susceptibility–based MR imaging, these veins located centrally within MS lesions can now be depicted in vivo.2-4 Due to the paramagnetic nature of deoxyhemoglobin, venous structures can be visualized as hypointense lines or dots on susceptibility-based MR imaging (eg, T2*-weighted, susceptibility-weighted imaging). Recently, the radiologic definition of a vein located centrally within an MS lesion, the so-called central vein sign (CVS), has been proposed by the North American Imaging in Multiple Sclerosis Cooperative.5
By means of the higher image resolution and stronger susceptibility contrast provided by 7T MR imaging, the percentage of lesions with the CVS has been reported to vary between 80% and 100% of white matter lesions (WMLs) in the brains of patients with MS,3 with a decreased gradient from the periventricular areas to the neocortex,6 with similar percentages across the different MS phenotypes.7 Most interesting, a lower percentage of brain lesions with the CVS (0%-45%) was observed in other neurologic disorders such as aquaporin-4 immunoglobulin G4–positive neuromyelitis optica spectrum disorder,8 systemic autoimmune diseases,9 cerebral small vessel disease,10 Susac syndrome,11 and white matter migraine lesions.1 In a recent large multicenter study from the magnetic resonance imaging in multiple sclerosis (MAGNIMS) evaluating the diagnostic value of the CVS, a sensitivity of 68.1% and a specificity of 82.9% were reported for distinguishing MS using a 35% CVS proportion threshold.12 Therefore, CVS is a promising imaging biomarker that could help discriminate MS from its radiologic mimics and ultimately increase the accuracy of MS diagnosis 5 and reduce misdiagnosis.13
A variety of susceptibility-based MR imaging sequences may be used to detect the CVS at clinical field strength (1.5T or 3T), such as susceptibility-weighted angiography (SWAN). However, SWAN has been shown to be less sensitive at 3T than optimized sequences, such as the T2*-weighted 3D echo-planar imaging sequence.14-16 The objective of the study was to assess the performance of a newly optimized SWAN sequence in detecting the CVS.
MATERIALS AND METHODS
Patients
Thirty patients from the FLENI MS Clinic were scanned consecutively. Brain MR imaging showing >3 typical hyperintense focal lesions was analyzed.
MR Image Acquisition
Subjects were scanned on a 3T MR imaging system (Discovery MR750; GE Healthcare, Milwaukee, Wisconsin) using a 32-channel head coil array. A comprehensive MS protocol was performed, including the following—3D T2-weighted FLAIR: FOV = 26 × 26 cm; number of slices = 146; voxel resolution = 0.47 × 0.47 × 1.2 mm; TE = 116 ms; TR = 6200 ms; TI = 1710 ms; echo-train length = 220; acquisition time = 4.18 minutes; and optimized 3D SWAN-venule: FOV = 22 × 16 cm; number of slices = 126; voxel resolution = 0.4 × 0.4 × 0.8 mm, with the possibility to reformat to 0.4 × 0.4 × 0.4 mm; TR = 47 ms; TE = 28 ms; flip angle = 8°; echo-train length = 9; acquisition time = 7.38 minutes. SWAN-venule was optimized by modifying the clinically available SWAN sequence in the following manner: reduction of the section thickness from 3 to 0.8 mm; reduction of the flip angle from 20° to 10° and finally to 8°, which minimized T1-weighted contrast and increased T2-weighted contrast; and reduction of the TR to the minimal value allowed by the gradient performance, reducing the acquisition time. Both FLAIR and SWAN-venule sequences were immediately acquired after the intravenous administration of 0.1 mmol/kg of gadolinium-based contrast agent (gadoterate meglumine, Dotarem; Guerbet, Aulnay-sous-Bois, France).
Image Analysis
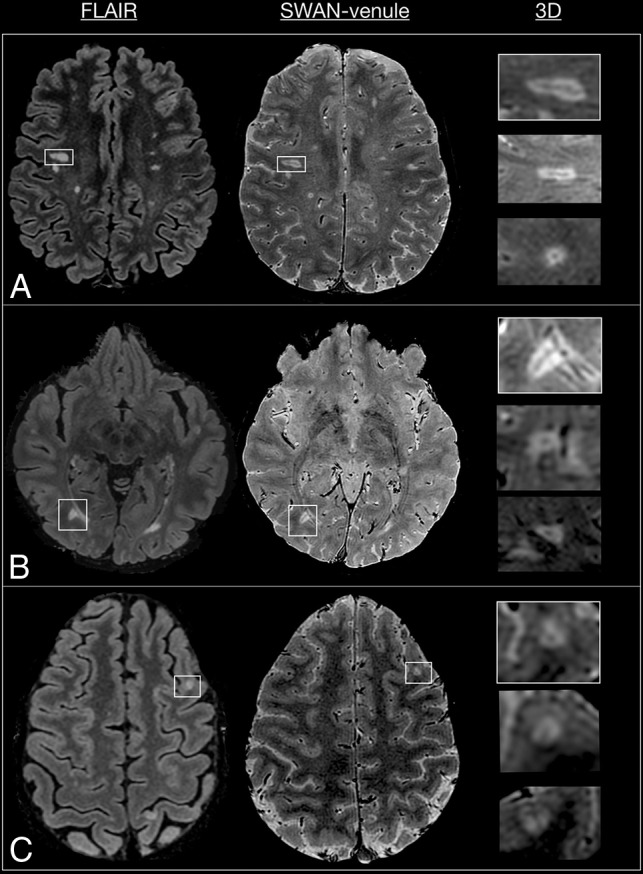
A neuroradiologist (P.Y.) and a neurologist trained in MR imaging and MS (M.I.G.) were the 2 independent readers. Image interpretation was performed on a standard PACS workstation. The quality of SWAN-venule images for visualizing WMLs was compared with FLAIR images in 3 cases (Fig 1). SWAN-venule images were coregistered to FLAIR images using the synchronization tool of the workstation. All the supratentorial nonconfluent lesions, >3 mm and <15 mm in-plane, visible on both SWAN-venule and FLAIR images, were recorded. These lesions were then classified as periventricular (T2-hyperintense cerebral white matter lesions abutting the lateral ventricles without white matter in between, including lesions in the corpus callosum but excluding lesions in deep gray matter structures),17,18 deep white matter, or juxtacortical (T2-hyperintense cerebral white matter lesions abutting the cortex, not separated from it by white matter).17,18 Afterward, each lesion was evaluated for the CVS on SWAN-venule images according to the radiologic definition of the North American Imaging in Multiple Sclerosis Cooperative consensus statement:5 a thin hypointense line or small hypointense dot, visualized in at least 2 perpendicular MR imaging planes, centered on a lesion. Lesions with a vein located at the periphery or lesions with multiple veins were counted as negative for the CVS.
Fig 1.

Comparison between FLAIR and SWAN-venule images from 3 patients with RRMS. Lesions seen in FLAIR are visible in SWAN-venule. White boxes mark lesions magnified in 3 planes. A, White box magnifies a deep white matter lesion. B, White box magnifies a periventricular lesion. C, White box magnifies a juxtacortical lesion.
RESULTS
Participants
The complete brain MR imaging protocol was performed on 30 patients with MS. A total of 20 patients who presented with >3 supratentorial WMLs were included. Demographic and clinical information of the patients is the following: 19 with relapsing-remitting MS (RRMS); 1 with primary-progressive MS; 11 women and 9 men; mean age, 38.9 years; range, 34.8–42.9 years; mean disease duration, 5.8 years; range, 3.7–7.9 years; Expanded Disability Status Scale score range, 0–6.
White Matter Lesions
A total of 380 WMLs were analyzed, of which 135 were periventricular, 144 were deep white matter, and 101 were juxtacortical.
Central Vein Sign
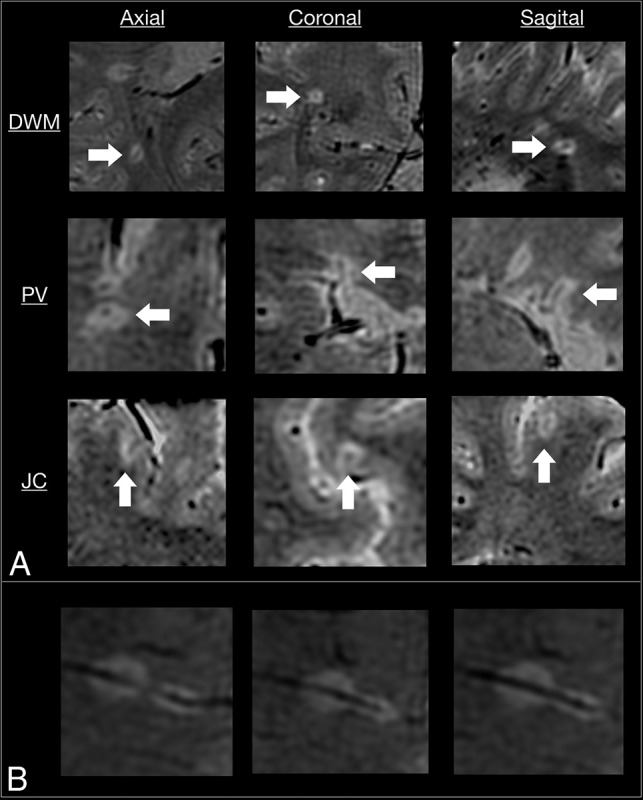
Overall, 86% of the lesions (327/380) presented with the CVS. The agreement coefficient among the evaluators was 93%, with a substantial reliability of 0.71 (range, 0.61–0.81) (Cohen κ). When the lesions were classified according to their location, the central vein was detected in 89% of periventricular lesions, 95% of deep white matter lesions, and 78% of juxtacortical lesions (Fig 2).
Fig 2.

SWAN-venule acquired in 3 subjects with RRMS. A, Examples of lesions with central veins in 3 planes. In each raw, arrows point the same lesion in three different planes. An example of a deep white matter (DWM) lesion, a periventricular lesion, and a juxtacortical lesion shows the central vein in 3 different planes. B, Example of 2 deep white matter lesions that developed along the same vein. PV indicates periventricular; JC, juxtacortical.
DISCUSSION
The overinterpretation of focal nonspecific white matter lesions is an important factor contributing to MS misdiagnosis, mainly by erroneously fulfilling the radiologic criterion of dissemination in space.19 Therefore, there is an urgent need for the use of a novel radiologic biomarker specific to MS, such as the central vein sign.
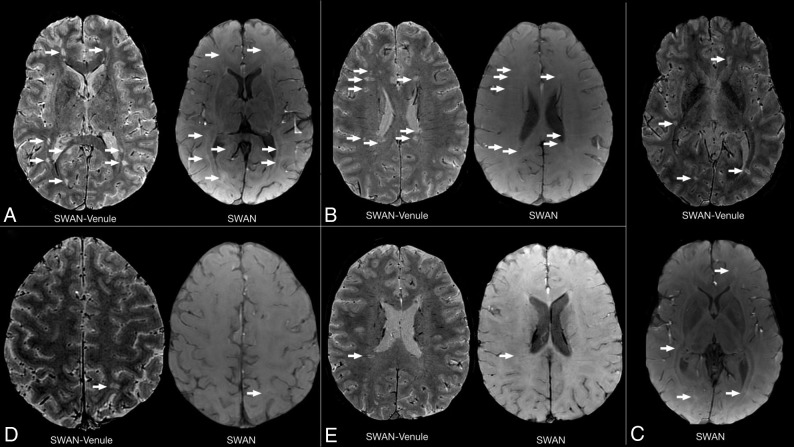
In this work, an optimized SWAN sequence, called SWAN-venule, is proposed for imaging the central vein sign using 3T MR imaging. To our knowledge, there is only 1 publication that evaluated the performance of the standard SWAN sequence for detecting the CVS.15 Unlike this smaller prior study, we were able to detect 86% of CVSs when using SWAN-venule with contrast. As mentioned by the authors, it was difficult to visualize WMLs on SWAN images. We observed the same issue at our center when using the standard SWAN protocol. This problem was solved by our new SWAN-venule protocol, which uses a lower flip angle, improving the tissue contrast (Fig 3). The increased sensitivity of our optimized MR imaging technique may also be due to the reduction in the voxel dimensions, allowing better capturing of small venules. Note that the use of high image resolution for SWAN-venule required a 32-channel head coil array for providing sufficient SNR. Another possible contribution is the injection of gadolinium-based contrast agent during the acquisition. As previously shown, gadolinium increases the phase effects around blood vessels, increasing the visibility of small veins.14,16 Because the recommended MR imaging brain protocols for MS20,21 require the intravenous injection of contrast followed by a 5-minute delay before the T1-weighted scan, acquiring SWAN-venule during the delay will not increase the overall scan time of the protocol. This higher percentage of WMLs centered by veins is in line with previous studies investigating the CVS in patients with MS at 7T3,4 or using optimized techniques at 3T, such as T2*-weighted 3D-EPI or FLAIR.9,13,16,22,23 Because of the use of small voxel dimensions and the 3D acquisition mode, SWAN-venule images could also be combined with 3D-FLAIR images to generate FLAIR* contrast,24 thus facilitating the workflow of the CVS evaluation by requiring reading only 1 contrast image.
Fig 3.
Quality comparison between standard SWAN and SWAN-venule. Comparison of SWAN and SWAN-venule acquired during the same year in 2 subjects with RRMS who were radiologically stable. Arrows point to lesions in SWAN-venule and the same area in SWAN, in which lesions are difficult to depict. A–C, A 28-year-old female patient with RRMS. D and E, A 31-year-old male patient with RRMS.
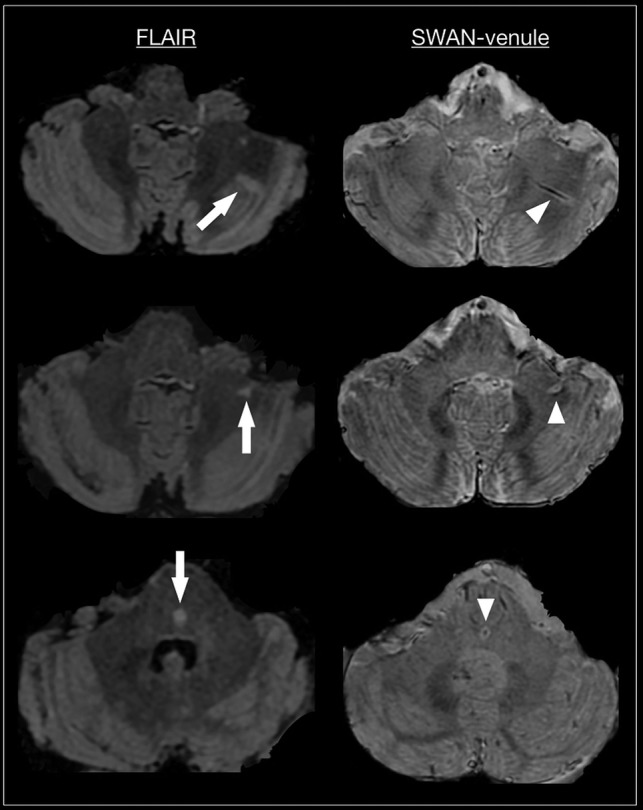
Although our image analysis focused on the supratentorial brain of patients with MS, we observed that most lesions visible in the brain stem and cerebellum also showed the CVS (Fig 4), similar to a previous study imaging infratentorial MS brains.2 Moreover, we found a very high percentage (95%) of deep white matter lesions centered by veins. Therefore, the inclusion of CVS-positive deep white matter lesions in future revisions of the McDonald criteria could help to achieve a more accurate and earlier MS diagnosis. Finally, recent data showed that cases of radiologically isolated syndrome can have a high proportion of CVS-positive lesions.25 Therefore, CVS appears to be a radiologic biomarker present even in the presymptomatic phase of the disease.
Fig 4.

Axial FLAIR and SWAN-venule from 3 patients with RRMS. Arrow points to infratentorial lesions in FLAIR. Arrowhead points to the corresponding central vein in SWAN-venule.
One of the limitations of our study is that we did not perform a head-to-head comparison of the conventional SWAN sequence versus our newly optimized SWAN-venule sequence. Another limitation is the relatively long acquisition time (∼7–8 minutes) of our SWAN-venule sequence, which most likely increases the risk of motion artifacts. Last, comprehensive MR imaging analysis, such as localized gray matter atrophy, which has a strong correlation with disease disability or progression, was not performed. Further work is needed to characterize the CVS as a potential biomarker for predicting disease severity and monitoring progression.
CONCLUSIONS
We introduce an optimized susceptibility-based MR imaging sequence, called SWAN-venule, a dedicated long-acquisition postcontrast imaging for sensitive detection of central veins inside brain lesions at 3T. MR imaging centers equipped with a clinical 3T system can easily integrate this optimized clinically available sequence, thus providing radiologists and neurologists with the opportunity to assess the clinical value of the CVS as an imaging biomarker for the differential diagnosis of MS.
Acknowledgment
Dr Sati is supported by the Intramural Research Program of NINDS.
ABBREVIATIONS:
- CVS
central vein sign
- RRMS
relapsing-remitting MS
- SWAN
susceptibility-weighted angiography
- WML
white matter lesion
Footnotes
Paper previously presented at: Annual Meeting of the European Committee for Treatment and Research in Multiple Sclerosis, September 11–13, 2019; Stockholm, Sweden.
Disclosures: Maria Ines Gaitán—RELATED: Support for Travel to Meetings for the Study or Other Purposes: Merck Serono Argentina, Comments: travel/accommodations/meeting expenses to European Committee for Treatment and Research in Multiple Sclerosis 2019, where I presented part of the data; UNRELATED: Payment for Development of Educational Presentations: Biogen Argentina, Merck Serono Argentina, Novartis Argentina; Travel/Accommodations/Meeting Expenses Unrelated to Activities Listed: Biogen Argentina, Merck Serono Argentina, Roche Argentina. Eduardo Figueiredo—UNRELATED: Employment: GE Healthcare. Jorge Correale—UNRELATED: Consultancy: Merck Serono Argentina, Biogen Argentina, Biogen Global, Genzyme Argentina, Genzyme Global, Novartis Argentina, Roche Argentina; Payment for Lectures Including Service on Speakers Bureaus: Merck Serono Argentina, Novartis Argentina, Genzyme Argentina, Roche Argentina, Biogen Argentina; Travel/Accommodations/Meeting Expenses Unrelated to Activities Listed: Merck Serono Argentina.
References
- 1.Adams CW. The onset and progression of the lesion in multiple sclerosis. J Neurol Sci 1975;25:165–82 10.1016/0022-510x(75)90138-0 [DOI] [PubMed] [Google Scholar]
- 2.Tan IL, van Schijndel RA, Pouwels PJ, et al. MR venography of multiple sclerosis. AJNR Am J Neuroradiol 2000;21:1039–42 [PMC free article] [PubMed] [Google Scholar]
- 3.Tallantyre EC, Brookes MJ, Dixon JE, et al. Demonstrating the perivascular distribution of MS lesions in vivo with 7-Tesla MRI. Neurology 2008;70:2076–78 10.1212/01.wnl.0000313377.49555.2e [DOI] [PubMed] [Google Scholar]
- 4.Tallantyre EC, Morgan PS, Dixon JE, et al. A comparison of 3T and 7T in the detection of small parenchymal veins within MS lesions. Invest Radiol 2009;44:491–94 10.1097/RLI.0b013e3181b4c144 [DOI] [PubMed] [Google Scholar]
- 5.Sati P, Oh J, Constable RT, et al. ; NAIMS Cooperative. The central vein sign and its clinical evaluation for the diagnosis of multiple sclerosis: a consensus statement from the North American Imaging in Multiple Sclerosis Cooperative. Nat Rev Neurol 2016;12:714–22 10.1038/nrneurol.2016.166 [DOI] [PubMed] [Google Scholar]
- 6.Kilsdonk ID, Lopez-Soriano A, Kuijer JP, et al. Morphological features of MS lesions on FLAIR* at 7T and their relation to patient characteristics. J Neurol 2014;261:1356–64 10.1007/s00415-014-7351-6 [DOI] [PubMed] [Google Scholar]
- 7.Kuchling J, Ramien C, Bozin I, et al. Identical lesion morphology in primary progressive and relapsing-remitting MS: an ultrahigh field MRI study. Mult Scler 2014;20:1866–71 10.1177/1352458514531084 [DOI] [PubMed] [Google Scholar]
- 8.Cortese R, Magnollay L, Tur C, et al. Value of the central vein sign at 3T to differentiate MS from seropositive NMOSD. Neurology 2018;90:e1183–90 10.1212/WNL.0000000000005256 [DOI] [PubMed] [Google Scholar]
- 9.Maggi P, Absinta M, Grammatico M, et al. Central vein sign differentiates multiple sclerosis from central nervous system inflammatory vasculopathies. Ann Neurol 2018;83:283–94 10.1002/ana.25146 [DOI] [PMC free article] [PubMed] [Google Scholar]
- 10.Kilsdonk ID, Wattjes MP, Lopez-Soriano A, et al. Improved differentiation between MS and vascular brain lesions using FLAIR* at 7 Tesla. Eur Radiol 2014;24:841–49 10.1007/s00330-013-3080-y [DOI] [PubMed] [Google Scholar]
- 11.Wuerfel J, Sinnecker T, Ringelstein EB, et al. Lesion morphology at 7 Tesla MRI differentiates Susac syndrome from multiple sclerosis. Mult Scler 2012;18:1592–99 10.1177/1352458512441270 [DOI] [PubMed] [Google Scholar]
- 12.Sinnecker T, Clarke MA, Meier D, et al. ; MAGNIMS Study Group. Evaluation of the central vein sign as a diagnostic imaging biomarker in multiple sclerosis. JAMA Neurol 2019. August 19. [Epub ahead of print] 10.1001/jamaneurol.2019.2478] [DOI] [PMC free article] [PubMed] [Google Scholar]
- 13.Solomon AJ, Schindler MK, Howard DB, et al. “Central vessel sign” on 3T FLAIR* MRI for the differentiation of multiple sclerosis from migraine. Ann Clin Transl Neurol 2016;3:82–87 10.1002/acn3.273 [DOI] [PMC free article] [PubMed] [Google Scholar]
- 14.Sati P, Thomasson DM, Li N, et al. Rapid, high-resolution, whole-brain, susceptibility-based MRI of multiple sclerosis. Mult Scler 2014;20:1464–70 10.1177/1352458514525868 [DOI] [PMC free article] [PubMed] [Google Scholar]
- 15.Samaraweera AP, Clarke MA, Whitehead A, et al. The central vein sign in multiple sclerosis lesions is present irrespective of the T2* sequence at 3 T. J Neuroimaging 2017;27:114–21 10.1111/jon.12367 [DOI] [PubMed] [Google Scholar]
- 16.Dixon JE, Simpson A, Mistry N, et al. Optimisation of T(2)*-weighted MRI for the detection of small veins in multiple sclerosis at 3 T and 7 T. Eur J Radiol 2013;82:719–27 10.1016/j.ejrad.2011.09.023 [DOI] [PubMed] [Google Scholar]
- 17.Filippi M, Rocca MA, Ciccarelli O, et al. ; MAGNIMS Study Group. MRI criteria for the diagnosis of multiple sclerosis: MAGNIMS consensus guidelines. Lancet Neurol 2016;15:292–303 10.1016/S1474-4422(15)00393-2 [DOI] [PMC free article] [PubMed] [Google Scholar]
- 18.Thompson AJ, Banwell BL, Barkhof F, et al. Diagnosis of multiple sclerosis: 2017 revisions of the McDonald criteria. Lancet Neurol 2018;17:162–73 10.1016/S1474-4422(17)30470-2 [DOI] [PubMed] [Google Scholar]
- 19.Solomon AJ, Bourdette DN, Cross AH, et al. The contemporary spectrum of multiple sclerosis misdiagnosis: a multicenter study. Neurology 2016;87:1393–99 10.1212/WNL.0000000000003152 [DOI] [PMC free article] [PubMed] [Google Scholar]
- 20.Maggi P, Absinta M, Sati P, et al. The “central vein sign” in patients with diagnostic “red flags” for multiple sclerosis: a prospective multicenter 3T study. Mult Scler 2019. September 19. [Epub ahead of print] 10.1177/1352458519876031 [DOI] [PMC free article] [PubMed] [Google Scholar]
- 21.Campion T, Smith RJ, Altmann DR, et al. FLAIR* to visualize veins in white matter lesions: a new tool for the diagnosis of multiple sclerosis? Eur Radiology 2017;27:4257–63 10.1007/s00330-017-4822-z [DOI] [PMC free article] [PubMed] [Google Scholar]
- 22.Wattjes MP, Rovira A, Miller D, et al. ; MAGNIMS study group. Evidence-based guidelines: MAGNIMS consensus guidelines on the use of MRI in multiple sclerosis–establishing disease prognosis and monitoring patients. Nat Rev Neurol 2015;11:597–606 10.1038/nrneurol.2015.157 [DOI] [PubMed] [Google Scholar]
- 23.Rovira A, Wattjes MP, Tintore M, et al. ; MAGNIMS study group. Evidence-based guidelines: MAGNIMS consensus guidelines on the use of MRI in multiple sclerosis-clinical implementation in the diagnostic process. Nat Rev Neurol 2015;11:471–82 10.1038/nrneurol.2015.106 [DOI] [PubMed] [Google Scholar]
- 24.Sati P, George IC, Shea CD, et al. FLAIR*: a combined MR contrast technique for visualizing white matter lesions and parenchymal veins. Radiology 2012;265:926–32 10.1148/radiol.12120208 [DOI] [PMC free article] [PubMed] [Google Scholar]
- 25.Suthiphosuwan S, Sati P, Guenette M, et al. The central vein sign in radiologically isolated syndrome. AJNR Am J Neuroradiol 2019;40:776–83 10.3174/ajnr.A6045 [DOI] [PMC free article] [PubMed] [Google Scholar]


