Abstract
Mitral valve (MV) closure depends upon the proper function of each component of the valve apparatus, which includes the annulus, leaflets, and chordae tendineae (CT). Geometry plays a major role in MV mechanics and thus highly impacts the accuracy of computational models simulating MV function and repair. While the physiological geometry of the leaflets and annulus have been previously investigated, little effort has been made to quantitatively and objectively describe CT geometry. The CT constitute a fibrous tendon-like structure projecting from the papillary muscles (PMs) to the leaflets, thereby evenly distributing the loads placed on the MV during closure. Because CT play a major role in determining the shape and stress state of the MV as a whole, their geometry must be well characterized. In the present work, a novel and comprehensive investigation of MV CT geometry was performed to more fully quantify CT anatomy. In vitro micro-tomography 3D images of ovine MVs were acquired, segmented, then analyzed using a curve-skeleton transform. The resulting data was used to construct B-spline geometric representations of the CT structures, enriched with a continuous field of cross-sectional area (CSA) data. Next, Reeb graph models were developed to analyze overall topological patterns, along with dimensional attributes such as segment lengths, 3D orientations, and CSA. Reeb graph results revealed that the topology of ovine MV CT followed a full binary tree structure. Moreover, individual chords are mostly planar geometries that together form a 3D load-bearing support for the MV leaflets. We further demonstrated that, unlike flow-based branching patterns, while individual CT branches became thinner as they propagated further away from the PM heads towards the leaflets, the total CSA almost doubled. Overall, our findings indicate a certain level of regularity in structure, and suggest that population-based MV CT geometric models can be generated to improve current MV repair procedures.
Keywords: Mitral valve, Image-based modeling, Curve-skeleton representation, Reeb graphs, Full binary tree, Population-representative statistics
INTRODUCTION
Mitral valve (MV) disease is a long-standing medical condition with an increasing prevalence, particularly among the elderly.9 MV regurgitation (MVR) is the most common disorder among the major forms of MV disease. It afflicts 1% of the United States population,42 and carries a high mortality rate.45 MVR is classified into primary and secondary types based on etiological factors.10 In primary or “organic” MVR, the cause of MV insufficiency is attributed to alterations in tissue structure mainly due to myxomatous degeneration, fibroelastic deficiency, or calcification.13 In secondary or “functional” MVR, regurgitation is induced by geometric changes in the left ventricular (LV) wall associated with myocardial infarction or idiopathic cardiomyopathy.46 Almost all forms of MV insufficiency are linked to the disturbances in shape or structure of the MV constituents (annulus, leaflets, chordae tendineae, and papillary muscles).43,44 Furthermore, the interaction of these constituents is especially important for ensuring proper valve function. Recent studies have shown a strong association between the geometric configuration of MV components and the reoccurrence of MVR after surgical intervention.3
MV chordae tendineae (CT) are tree-like structures composed of dense collagenous connective tissue that protrude from the papillary muscle (PM) tips and insert into the MV leaflets (Fig. 1). From a mechanical perspective, the PMs and CT form an integrated unit (the “sub-valvular apparatus”) that provides the structural support for MV leaflets during ventricular contraction.30 Most pathologic conditions associated with MVR are characterized by deviations of the sub-valvular apparatus from its healthy, homeostatic state.8 In ischemic MVR, for example, geometric changes in the sub-valvular apparatus caused by LV remodeling lead to leaflet tethering and ultimately blood regurgitation.10 Moreover, chordal rupture, which is a very common lesion among the aging population,14 often leads to leaflet prolapse and blood leakage.31
FIGURE 1.
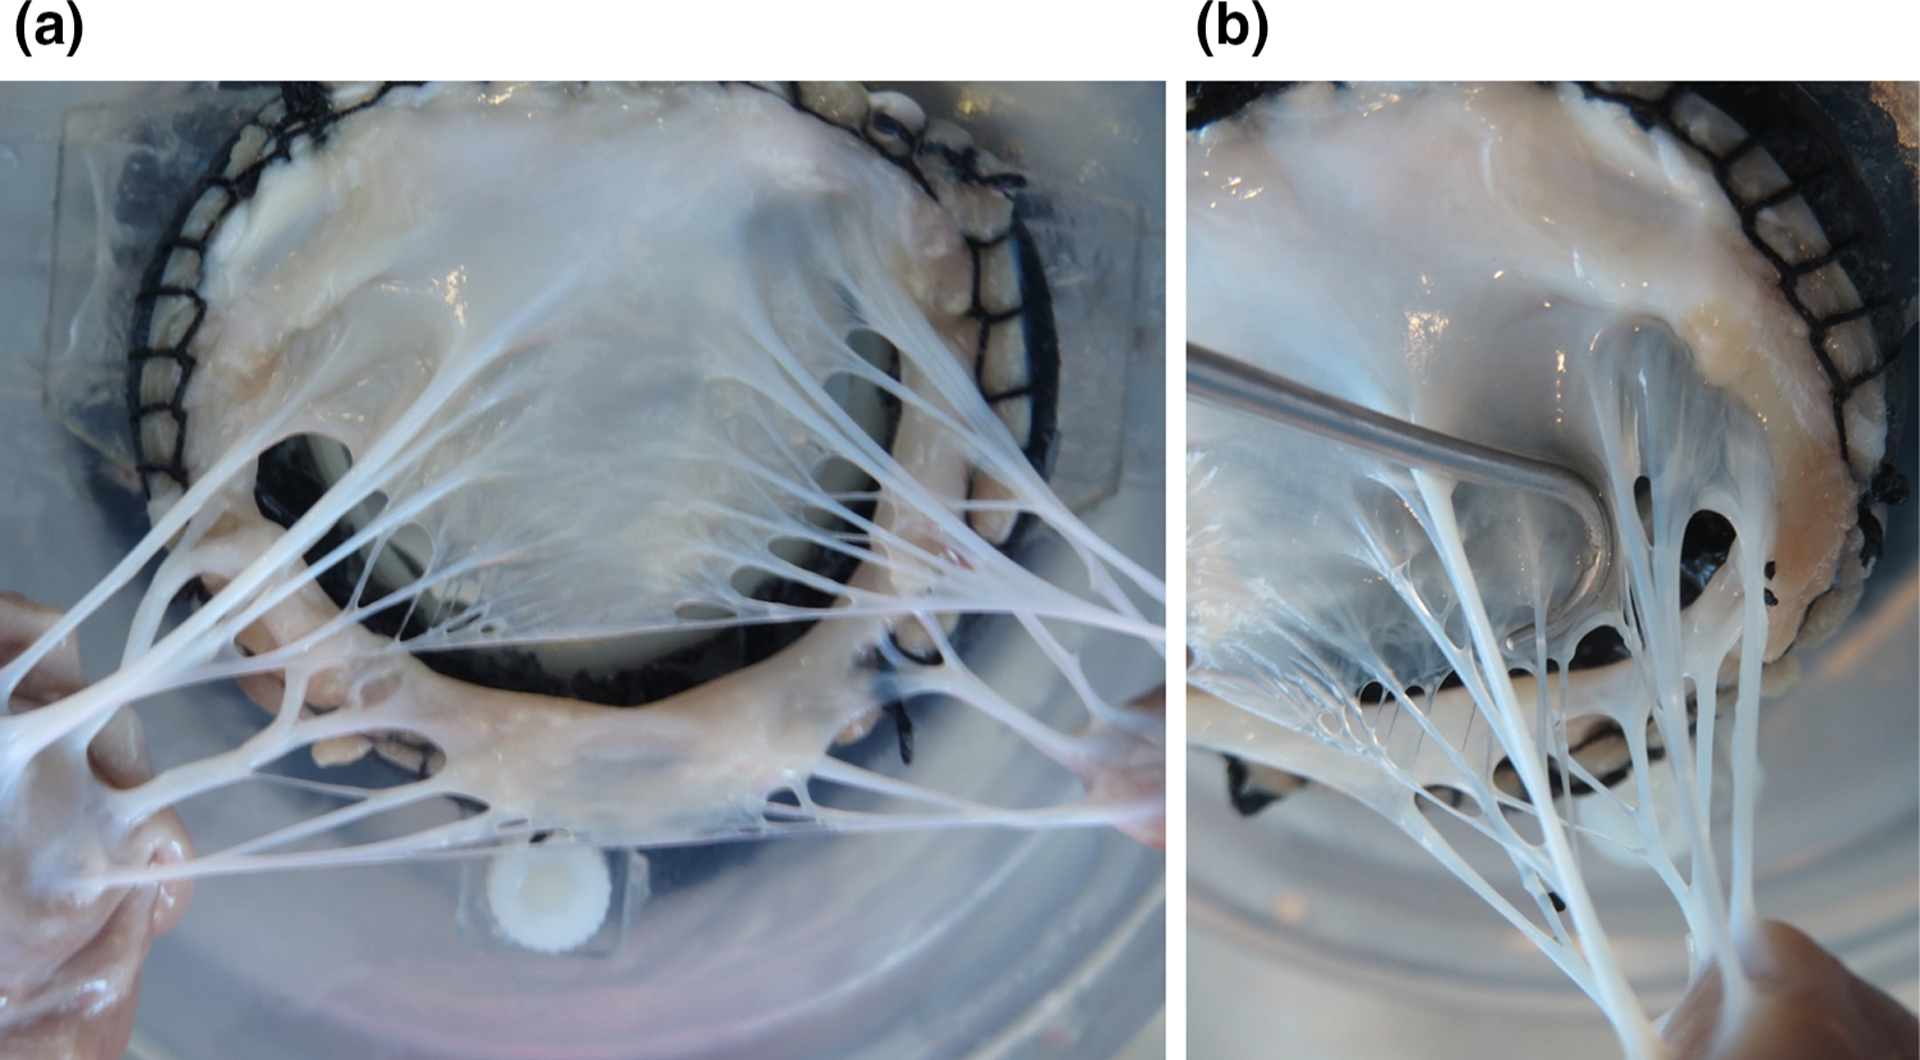
Photographs of excised ovine MV: (a) overall view of a CT structure, (b) close-up showing the intricate branching of MV CT. The CT structure of each valve is comprised of about 10–20 individual chords, each of which split into several segments before inserting into the leaflets.
In MV repair, which is becoming increasingly preferred over replacement for treating MVR,4,11 the chordal structure is often modified to improve leaflet coaptation and restore valvular function.7 These modifications may include repair, reattachment, or rearrangement of chords,39 adding artificial chords,20 or even cutting existing CT.28 It has thus become increasingly clear that advanced simulation technologies with realistic CT models can aid in the improvement of treatments for MVR. Such approaches, in principle, should take into account detailed MV anatomy, including the morphology of chordal structure along with modifications to the shape and size of other MV constituent parts.36,47 However, while the MV leaflets and annular geometry have been extensively studied,5,21,32 little is known about the geometric properties of the MV CT.12
To improve treatment outcome and optimize surgical strategies, it is crucial to quantify the normal structure of CT and establish their physiological role in the functionality of the MV. Previous studies on the MV CT have mainly focused on force distribution, mechanical and structural properties, and simple geometric characteristics of the chordal structure. For instance, He et al.18 performed anatomic, biomechanical, and hemodynamic measurements of MV function and showed that the spatial distribution of chords significantly impacts MV competence. Lomholt et al.26 reported elevated tensile forces in different CT under ischemic conditions. Additionally, several studies have investigated the internal architecture and material properties of the chordal structure in healthy,25,37 aged,33 and diseased6,17 states. Millington-Sanders et al.29 focused on the basic descriptive statistics of the human chordal structures, and found that human MV CT consist of 8–12 chords, each 15–20 mm long with an approximate diameter of 0.45 mm. Hutchison and Rea19 conducted a comparative study across different species and reported no gross morphological differences between or among ovine, bovine, and porcine CT. In a human study, Gunnal et al.16 recently investigated 116 cadaveric hearts and defined more than 21 classes to describe the chordal geometry. While the above studies have elucidated the general characteristics of MV CT anatomy, to our knowledge there has been no fundamental investigation of MV CT geometric properties.
In the present work, we have developed and implemented a robust methodology for the geometric characterization of MV CT. We sought to answer the following questions: Is there an underlying topological structure for the MV CT? What fundamental features characterize the general shape of the MV CT? What are the natural variations in the structure of CT? We believe such information is crucial in the development of anatomically faithful computational models of the MV that can address critical modeling issues, such as the level of anatomic fidelity required for accurate surgical simulations.
METHODOLOGY
Design of Experiment
We utilized high-resolution micro-CT derived 3D images to analyze and characterize the MV chordal structure, as well as to investigate the fundamental geometric features that define and modulate the chordal structure. Previous studies showing that MV CT have very high tensile stiffness23,25 suggest that CT do not stretch appreciably over the cardiac cycle. Throughout our study, we assumed that while the MV CT undergo large geometric reconfigurations during loading they do not experience significant deformation, in contrast with the MV leaflets and PMs. This allowed us to utilize the geometry of MV CT in the fully loaded configuration to investigate dimensional attributes. The fully closed state of the valve is both very reproducible and physiologically important as it mimics the physiologic state of MV in end-systole.2 This experimental design has several essential advantages. First, this approach enabled us to obtain the highly detailed geometry of the MV apparatus and successfully resolve fine CT features. Note that in an unloaded configuration, small branches buckle and stick together, making the extraction of such geometric details impossible. Furthermore, the unloaded (end-diastole) state is very difficult to reproduce in vitro even if it can be defined in vivo. Thus, by simulating the closed state, we enforced the reproducibility required to build correspondence between various samples and in turn compare CT structures of different MVs. The closed state also provides the most natural chordal configuration to investigate which structural features of the CT impact the functional behavior of MV. Our study provides the means to ultimately build anatomically accurate yet optimally detailed geometric models of the MV chordal structure for high-fidelity computational simulations and developing population-representative models.
Data Acquisition
We procured 10 fresh male Dorset ovine hearts from a USDA-approved abattoir (Superior Farms, CA, USA) and acquired micro-computed tomography (micro-CT) images in the Georgia Tech Cylindrical Left Heart Simulator (CLHS).35 For this study, we selected MV samples with similar annular dimensions but imposed no restrictions on the MV chordal geometry. The experimental protocols using Georgia Tech CLHS were extensively validated as described in our previous publications.15,24,38 Briefly, we first simulated the healthy hemodynamic conditions of the end-systolic state (100 mmHg TVP) to recover the fully closed configuration of MV apparatus. Then, each valve was placed in the bore of a Siemens Inveon scanner (Siemens Medical Solutions USA Inc., Malvern, PA) and imaged using the settings optimized for soft tissue imaging (80 kV energy, 500 μA intensity, 650 ms integration time). Each imaging data set was then stored in a DICOM format as stacks of 1024 orthogonally co-registered 2D images with the isometric voxel size of 43 μm. The same procedure was repeated 10 times to collect the imaging data for all specimens used for this study.
Image Processing
We loaded DICOM images into the ScanIP software suite (Simpleware Ltd., Exeter, UK) to perform noise reduction, contrast enhancement, and image segmentation (Fig. 2). First, a diffusion-based curvature-flow filter27 was applied to attenuate noise in the micro-CT images. Each imaging data set was then segmented using a thresholding method and a binary mask denoting the full MV apparatus was generated. Lastly, to clearly differentiate individual chords for each valve, we used ZBrush sculpting software (Pixologic Inc., CA, USA) and digitally dissected the segmented data for each valve into the individual chords (Fig. 2c).
FIGURE 2.
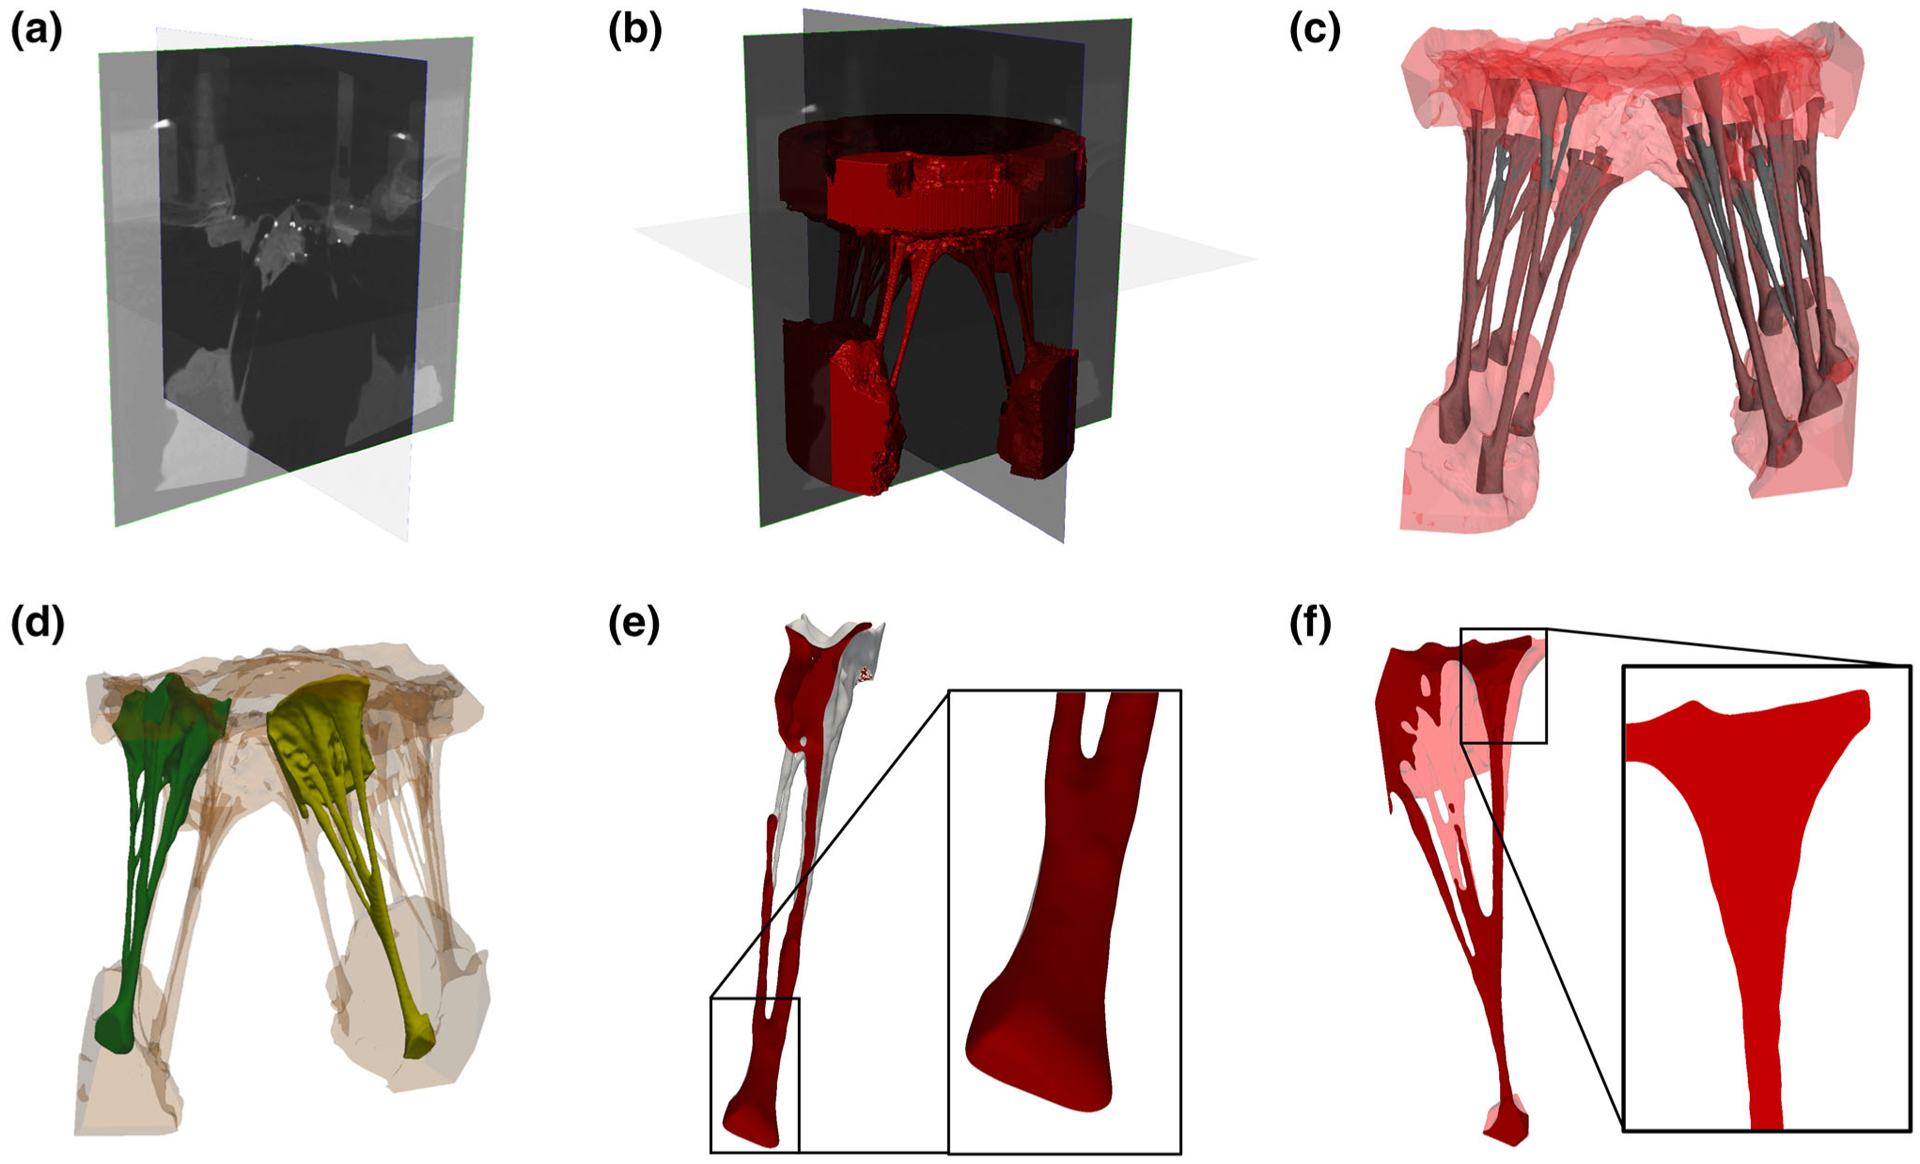
Proposed image-to-geometry processing pipeline: (a) 3D micro-CT image, (b) segmented image, (c) sculpted chordal structure. The representative CT are highlighted in (d). Sub-figures (e) and (f) illustrate the smooth change in the CSA values at the chord-to-PM and chord-to-leaflet attachment regions.
Throughout the sculpting step, we preserved parts of the PM head and MV leaflet tissue when extracting the chordal geometry from the surrounding structure (Fig. 2d). The CT smoothly protrude from several PM tips, without any abrupt change in shape (Fig. 2e), and then fuse and merge with the leaflets over continuous transition zones (Fig. 2f). Consequently, delineating each chord from the PM head and MV leaflet structure can be subjective. To circumvent this issue, we introduced a secondary trimming step later in our pipeline to consistently trim each chord and develop models of the MV CT with well-defined boundaries.
We processed all 10 imaging data sets using the described pipeline and obtained geometric representations of the ovine MV CT population (Fig. 3). The samples in our population all shared the same coordinate system, subsequent to data acquisition using the same imaging setup. Moreover, since the valves were preselected to have similar commissure-to-commissure size, we considered the geometric dimensions to be comparable without any need for size scale normalization. In the following sections, we discuss the development of geometric models for individual valves and also the grouping of results from all specimens for population-level statistical analysis.
FIGURE 3.
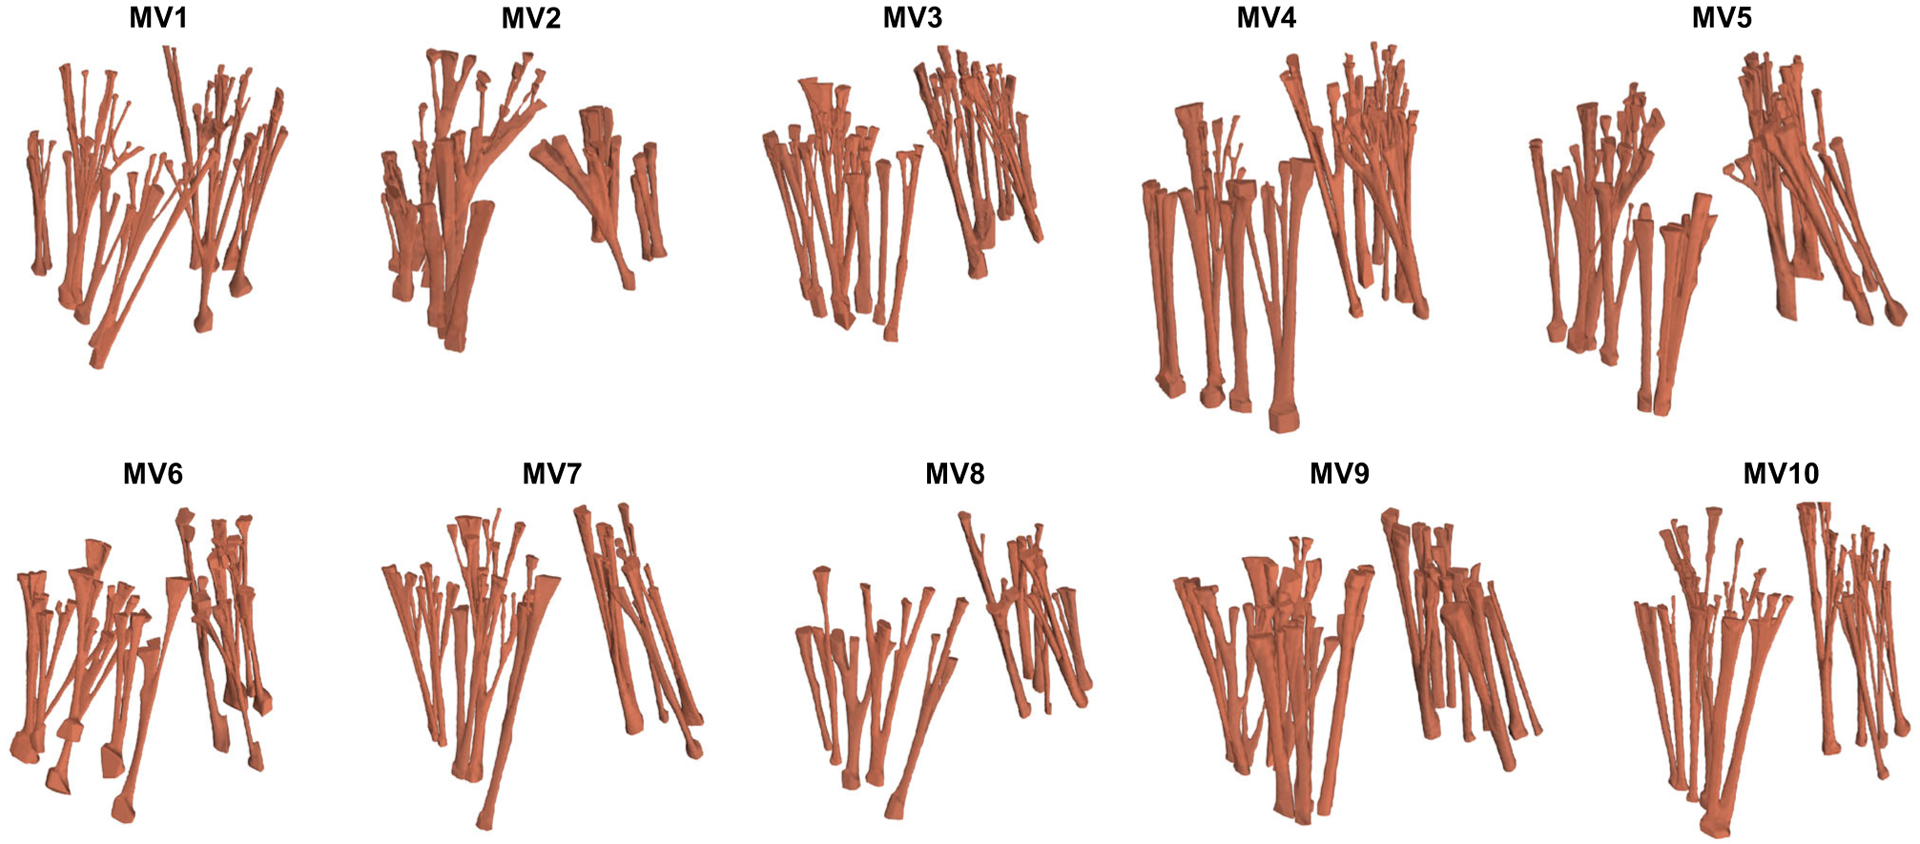
All trimmed MVCT imaging data sets collected in this study. We collected high-resolution micro-CT images for 10 ovine MVs in the simulated closed state of valvular geometry.
Geometry Modeling
To extract geometric properties and analyze topologic characteristics of the MV CT, we developed curve-skeleton representations derived from segmented images (Fig. 4). The curve-skeleton models provide a natural and computationally efficient means to represent branching tubular geometries like the MV CT.40 In this work, we used the centerline-modeling module in ScanIP to extract chordal skeletons and pointwise mean cross-sectional area (CSA) values (Fig. 4b). This representation provides explicit definitions of geometric landmarks and separation of segments in the chordal skeleton.
FIGURE 4.
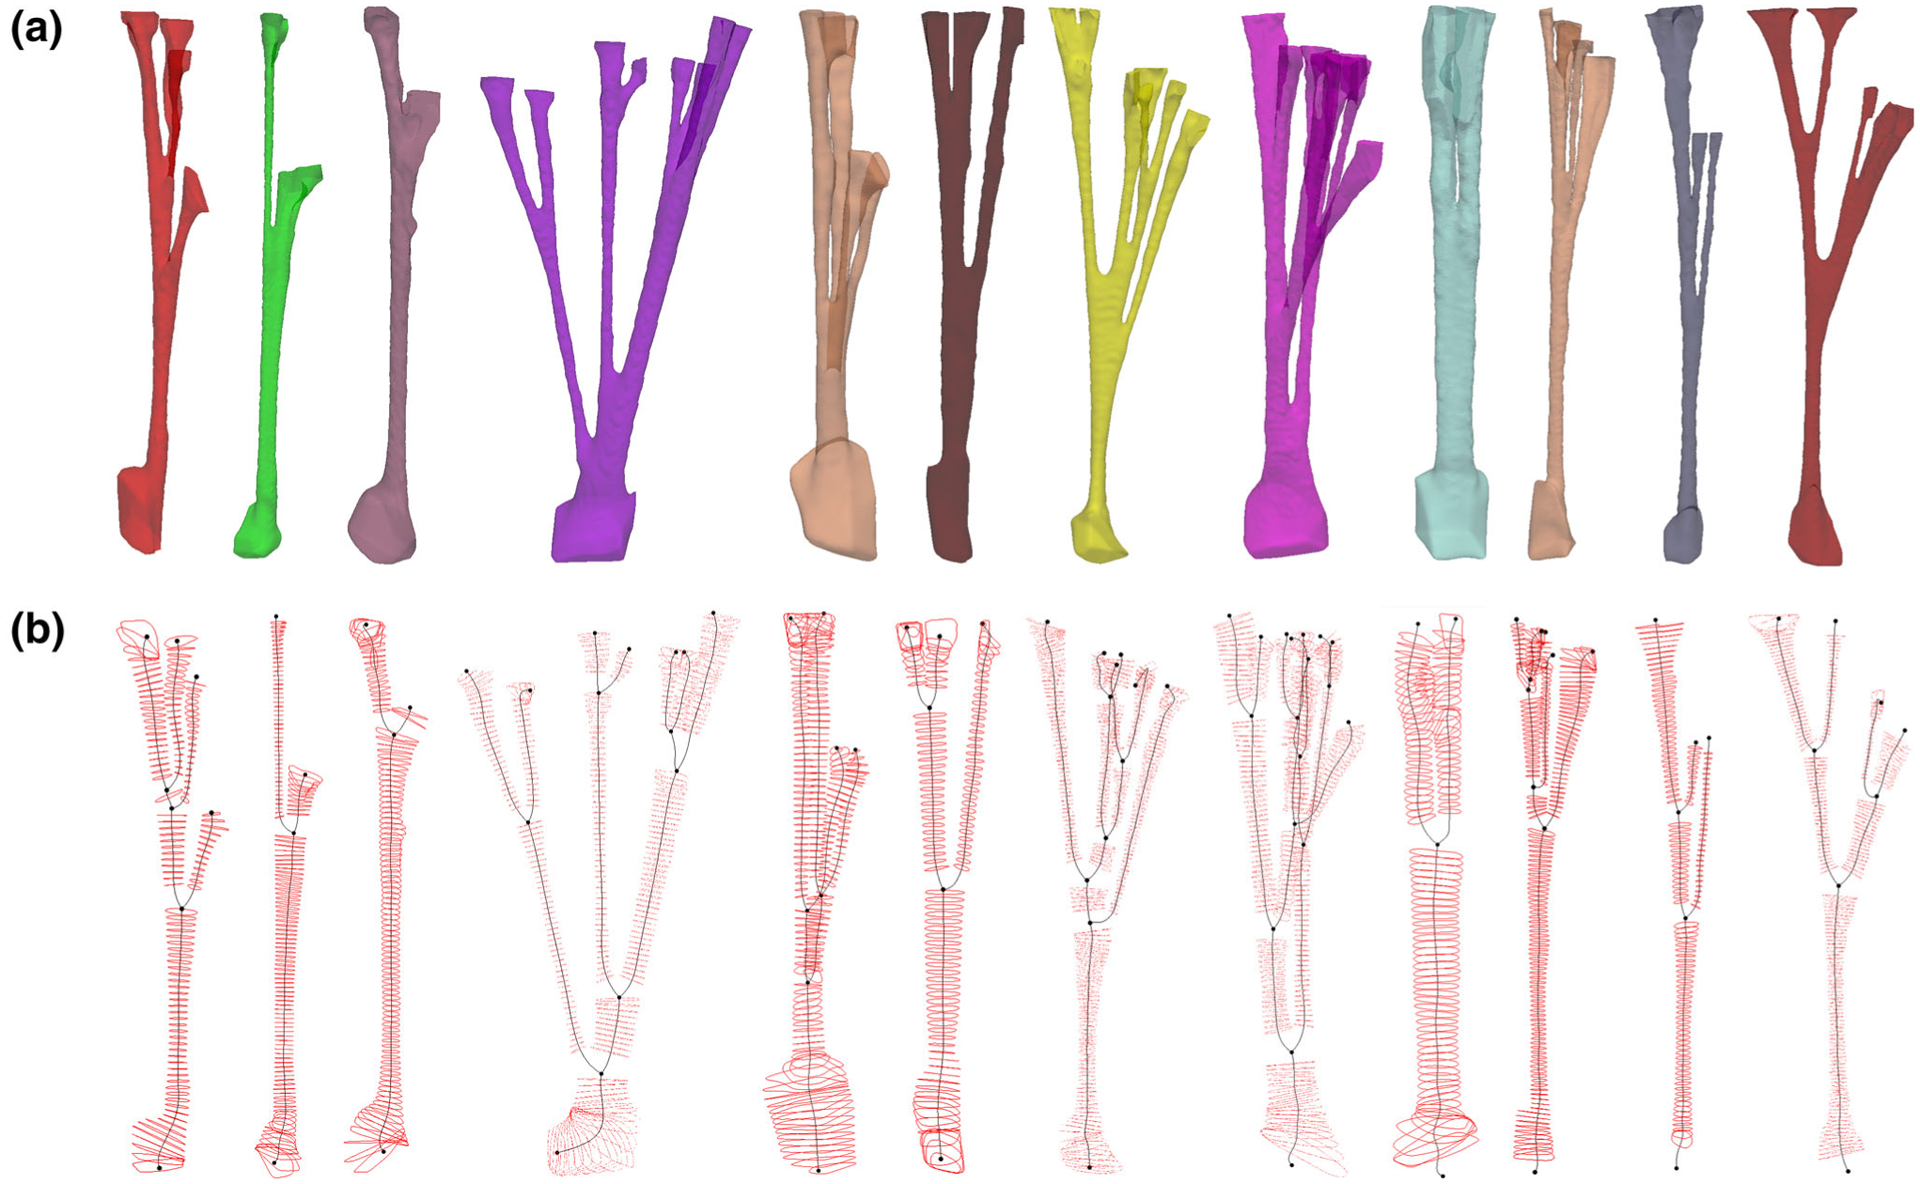
All CT of a representative valve are arranged in a planar view for visualization: (a) segmented data, (b) the curve-skeleton representation enriched with scalar fields of CSA. The CSA outlines sampled at 0.8 mm stepping for visualization.
To systematically trim the chordal skeleton, we then developed a smooth and continuous representation of the CSA values registered along the corresponding curve-skeleton models (Fig. 5). Briefly, we built smooth B-spline parametric representations of the MV CT skeleton using
| (1) |
where Ni,3(u) is the degree-3 B-spline basis function corresponding to the ith control point Pi. The range of summation denotes the total number of control points I in computing each curve, which varied in accordance with the length and tortuosity of each segment to ensure fitting errors smaller than 100 μm. The B-spline basis functions are defined according to the Cox de Boor recursive relation34 as
| (2) |
where ui values are the knot vector entities, which regulate the local effect of control points on the computed curve. In this study, an open, uniform knot vector was chosen to compute the cubic B-spline representation of MV CT skeleton. Similarly, the CSA values were reconstructed in the same parametric form following
| (3) |
Here, βi coefficients substitute the control point coordinates in Eq. (1) and in turn reconstruct the scalar field of CSA values in the same parametric space of the CT curve-skeleton model. The reconstruction was performed using a regularized least squares regression as given by
| (4) |
Herein, the first term on the right hand side of Eq. (4) is a measure of the discrepancy between the extracted CSA values Cj and the continuous parametric reconstruction of CSA field f(u) at total of J locations. The second term enforces smoothness on the reconstructed function f(u) through second-order Tikhonov regularization. This specific regularization effectively attenuates the noise in CSA data by penalizing sudden variations in the CSA reconstruction.
FIGURE 5.
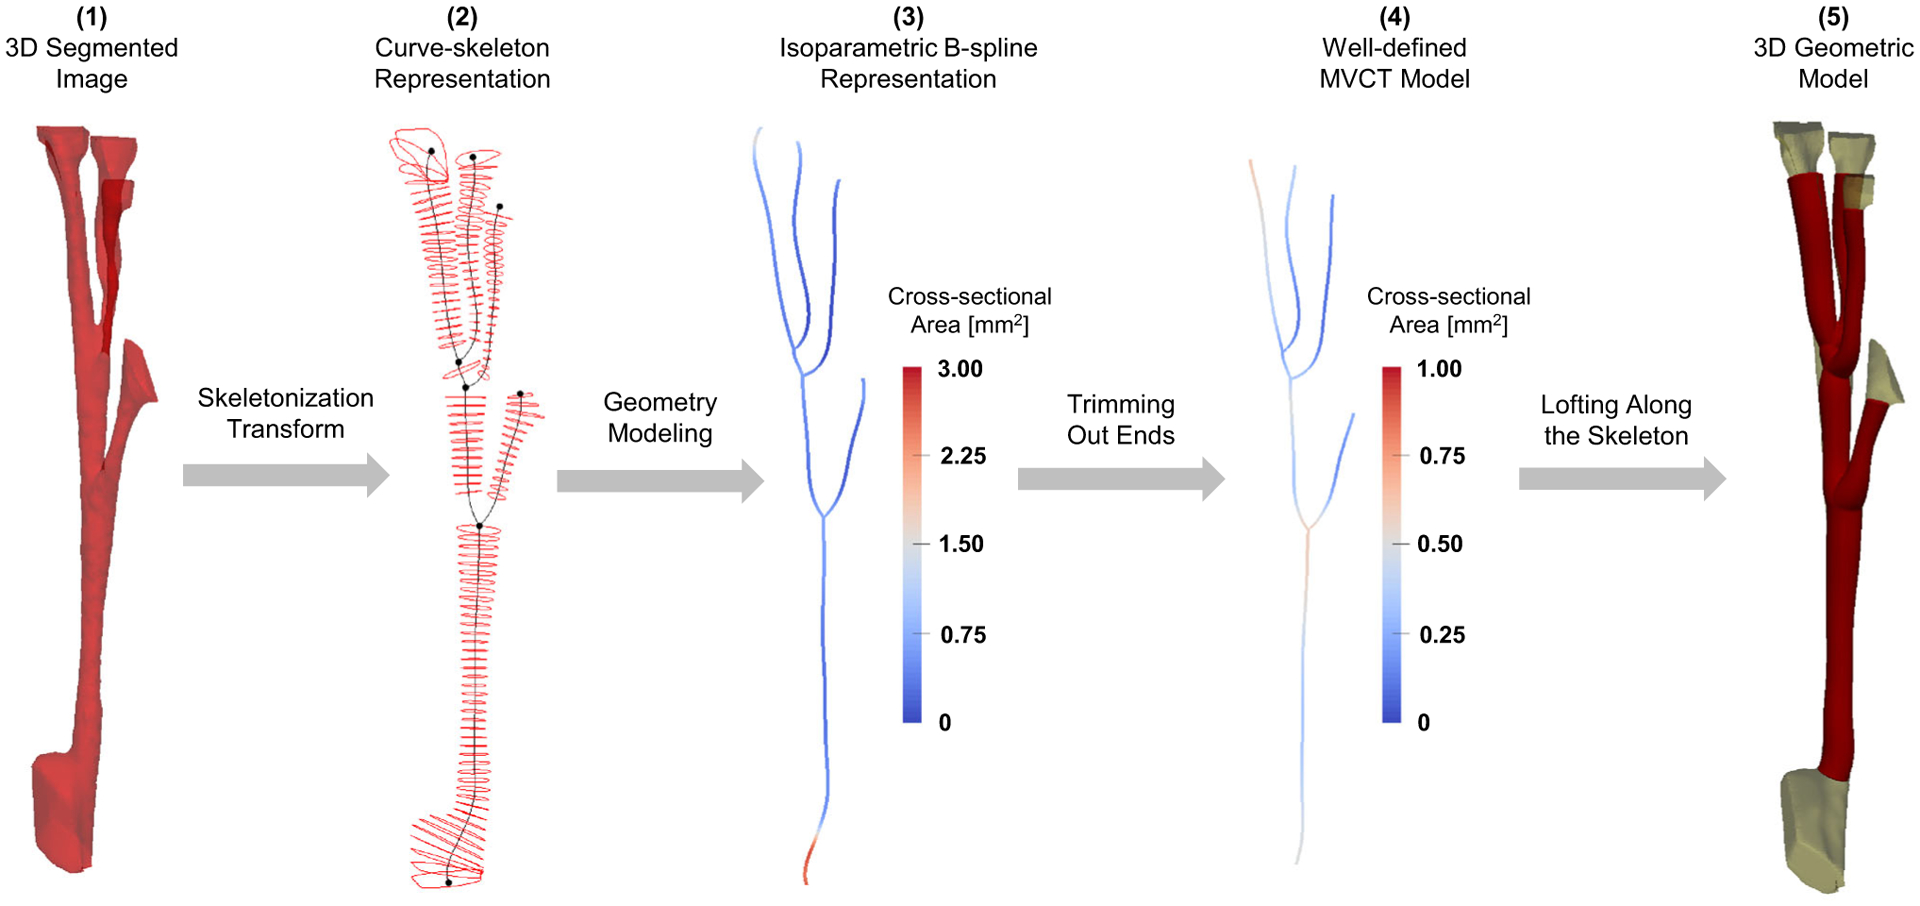
Major steps of the proposed pipeline to process the high resolution images into 3D geometric tubular models.
In our computations, we empirically set the regularization weight λ to 10−3 and iteratively minimized the objective function F to compute the coefficients βi that best interpolated the discrete field of CSA values. The minimization problem was solved with the convergence criterion set to , where k denotes the number of iterations. This procedure enabled us to construct a curve-skeleton representation of the MV CT enriched with a reconstruction of CSA values within an isoparametric paradigm. However, prior to further analysis, we needed to define anatomically relevant boundaries for the skeletonized representation of the MV CT.
To partition the PM heads and MV leaflets from the MV CT geometry, we defined the boundaries by identifying the locations of rapid changes in CSA values (inflection points). Thus, we applied a soft threshold on the rate of change in the CSA values (dimensionless ratio of equivalent radius to the arc length of each chord) and subsequently defined boundary points for the MV CT. For the studied population, cut-off threshold values of 0.15 ± 0.05 were set on the rate of change in CSA to separate CT from PM heads and MV leaflets. The B-spline reconstruction of the CSA field enabled exact and straightforward way to compute CSA derivative values according to Eq. (3) Upon finding the parameter locations of the boundary points, these values were substituted into Eq. (1) to trim the chordal skeleton. Ultimately, our modeling resulted in an attribute-rich, parametric representation with well-defined boundaries for each investigated MV specimen.
Topology Characterization
To characterize the topology of the chordal structure, we utilized Reeb graph1 representations of the MV CT geometry (Fig. 6) as Reeb graphs reduce the curve skeleton models to only signify topology. Furthermore, the Reeb graph vertices naturally correspond to landmark locations with geometric significance. In our analysis, we developed 2D Reeb graphs for the 3D chordal geometry to focus on the connectivity of fiducial landmarks irrespective of their spatial distribution. Then, we categorized the Reeb graph vertices into three categories: (i) origin, (ii) bifurcation, and (iii) insertion. Each chord has one origin corresponding to its protrusion from a PM, zero or more bifurcation locations referring to the branching instances in the chordal geometry, and one or more insertion points denoting its attachment to a leaflet.
FIGURE 6.
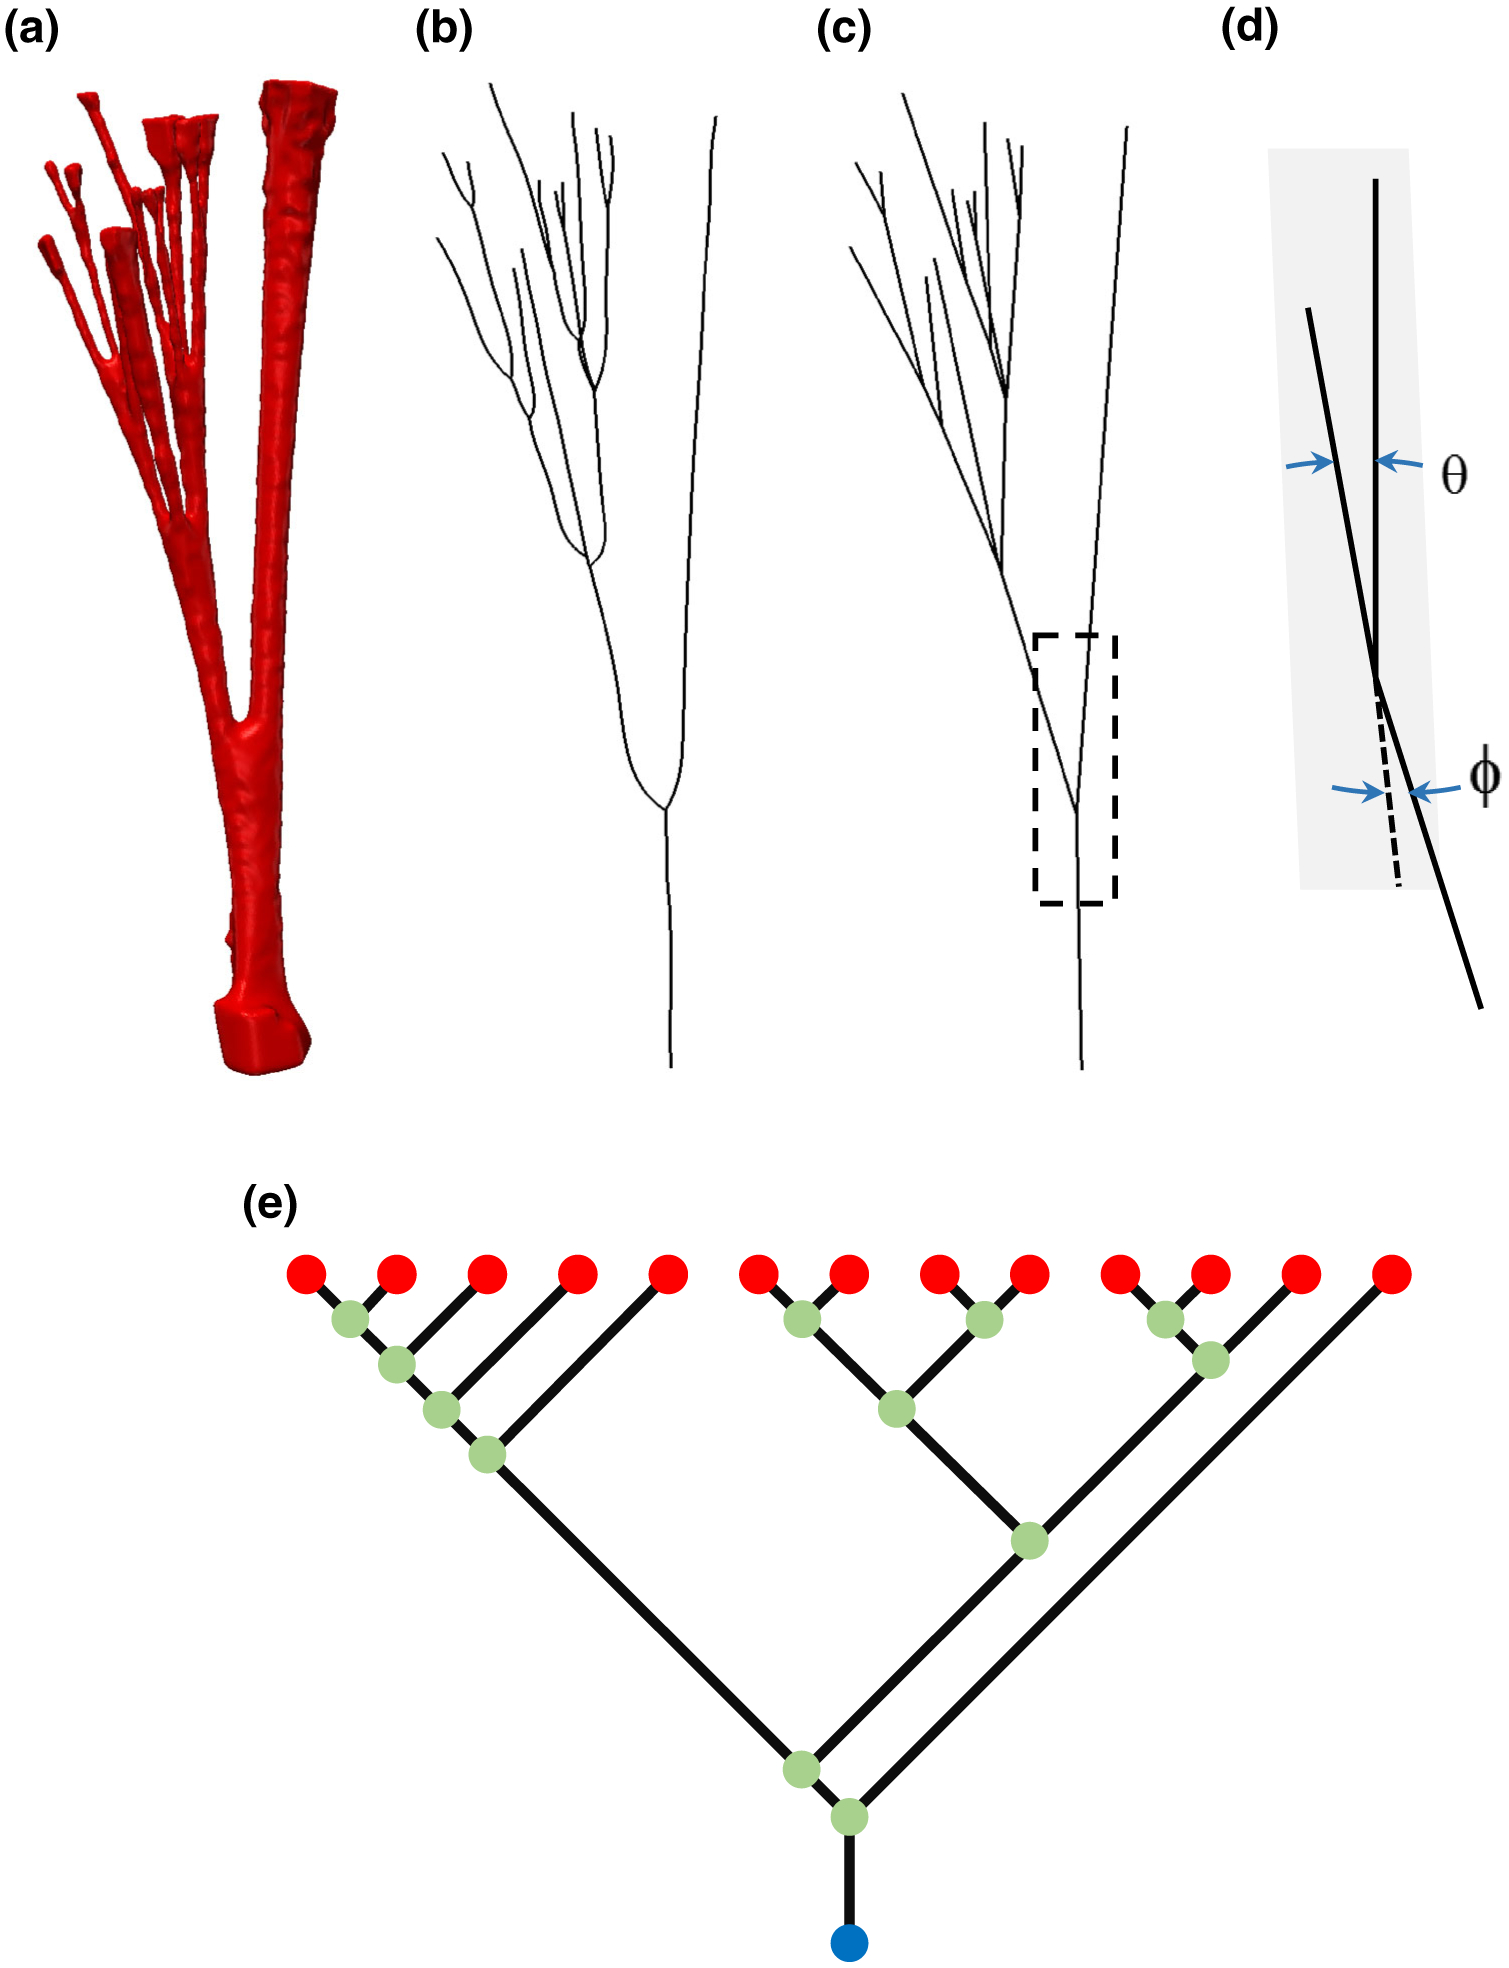
From images to Reeb graphs: The segmented surface of a representative chord is shown in (a), from which we extracted a curve-skeleton representation (b) and then linearized (c) to identify fiducial locations. In (d), we define the angular quantities used for 3D orientation analysis: bifurcation angle θ and non-planarity angle φ. These two angles quantify the symmetry and non-planarity of each branching incidence, respectively. Reeb graph models (e) illustrate the topology: connectivity pattern between the natural fiducial points.
Geometry Quantification
We performed a detailed study of the CSA variations, 3D orientations, and length distributions of the branch segments in CT based on curve-skeleton representations. our ultimate goal was to identify trends and regularities within the population while also differentiating between the samples. To this end, we extracted bifurcation and non-planarity angles from the linearized skeleton models of the MV CT (Fig. 6d). The bifurcation angle measures the relative orientation of child branches at a bifurcation. The non-planarity angle quantifies the rotation of the bifurcation plane (defined by the two child branches) from the axis of the parent branch. We also determined the average CSA and chord lengths for each segment of the chordal structure. Computing all of these geometric attributes enabled us to study the properties of MV CT at the chord level, valve level, and ultimately at the population level.
To build population statistics from the resulting measurements, we used a maximum likelihood estimation (MLE) approach to describe the chordal geometric attributes for the following quantities: (i) non-planarity angle, (ii) bifurcation angle, (iii) segment CSA, and (iv) segment length. First, we selected a candidate distribution function and applied MLE to optimize for the set of parameters that fit the data for each quantity of interest. Then, we measured the sum of squared errors between the empirical and fitted cumulative distribution functions. These two steps were repeated using all distribution functions implemented in the software package R,41 which enabled us to both select and fit an appropriate distribution function for each quantity of interest.
RESULTS
Topologic Traits
The Reeb graph analysis revealed that the branching pattern of the ovine MV CT can be modeled using full binary trees, with the origin included as an additional root node (Fig. 7). In other words, at each bifurcation, only two outgoing branches emerge from an incoming branch. This observation was consistent in our studies of 122 ovine chords from 10 samples. In two valves, however, we idealized the chordal branching pattern when sculpting images by ignoring thin connections between parallel chords. Interestingly, in the considered population, only four such connections were present among 510 bifurcation instances in the collected ovine MV data set.
FIGURE 7.
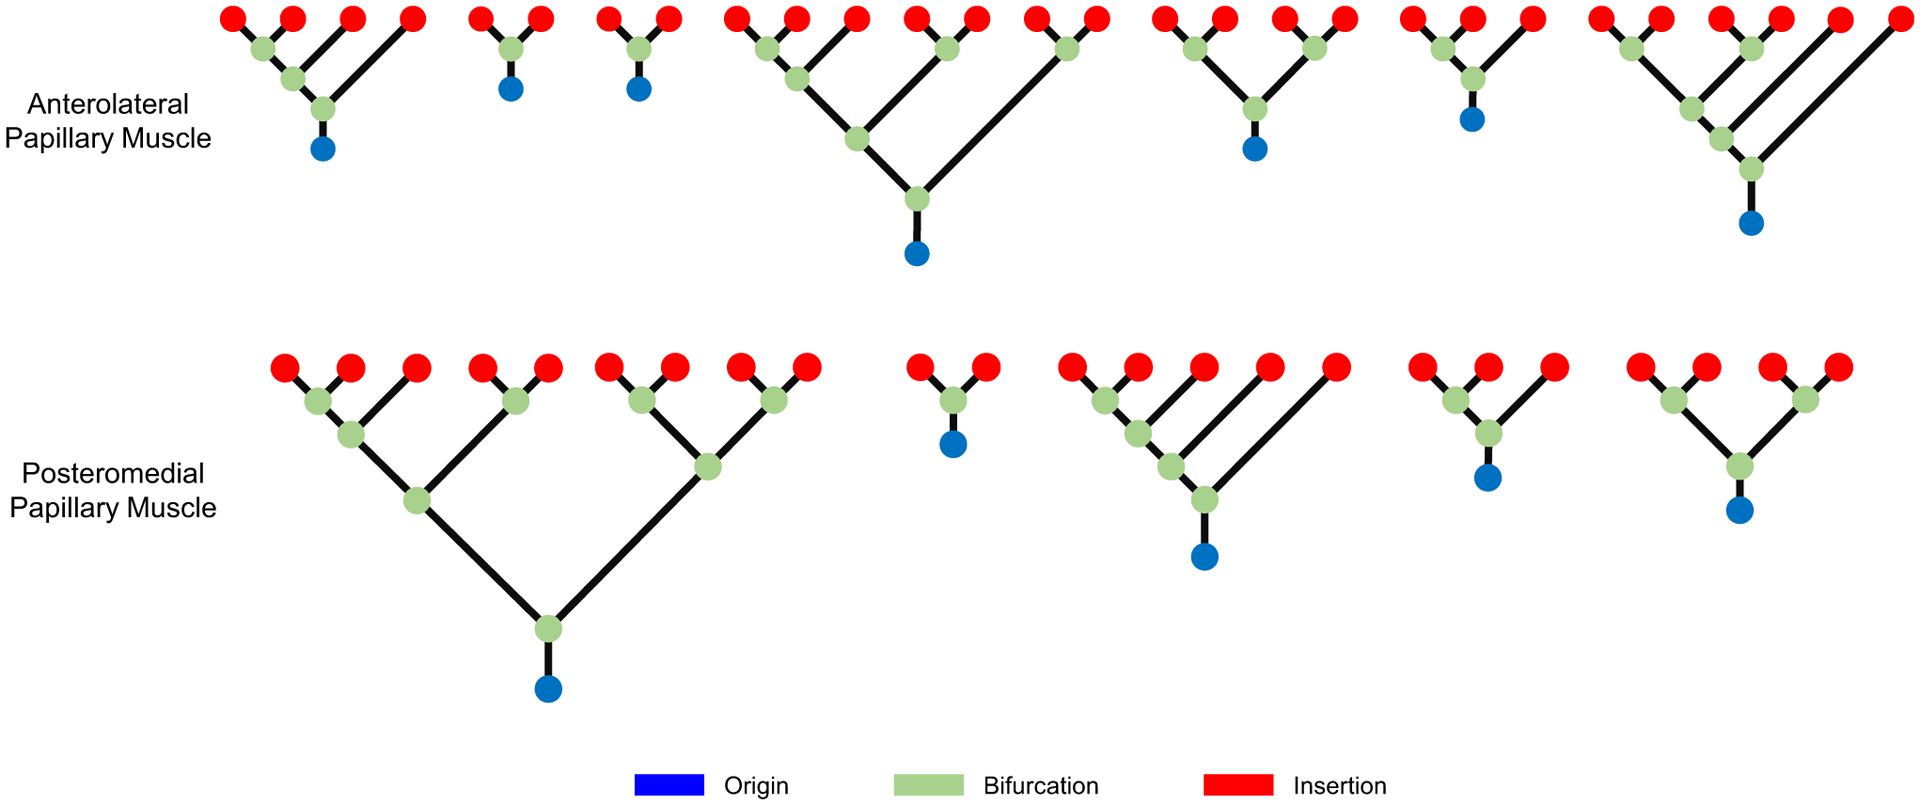
A collection of Reeb graphs of the entire chordal structure for a representative MV. All graphs have the structure of a full binary tree: the branching pattern of the ovine MV CT can be faithfully described using this model.
In terms of topological statistics, the average number of chords is 12 ± 1 with 63 ± 4 insertion sites per valve (mean ± standard error) or 5 ± 1 insertions per chord. The number of insertions consistently equaled the summation of origin (12 ± 1) and branching points (51 ± 3) (Fig. 8a). This regularity trivially follows from the full binary tree branching pattern, and can potentially be exploited to predict the number of bifurcations in a chord if its insertions are known. Furthermore, we analyzed the spatial distribution of insertion sites, which indicated noticeable clustering in certain leaflet regions (Fig. 8b). The significance of these two results becomes even more evident when one takes into account the fact that the chordal structure remains undetectable via in vivo imaging. We also observed that the chords are mostly distributed equally between the anterolateral and posteromedial PM heads.
FIGURE 8.
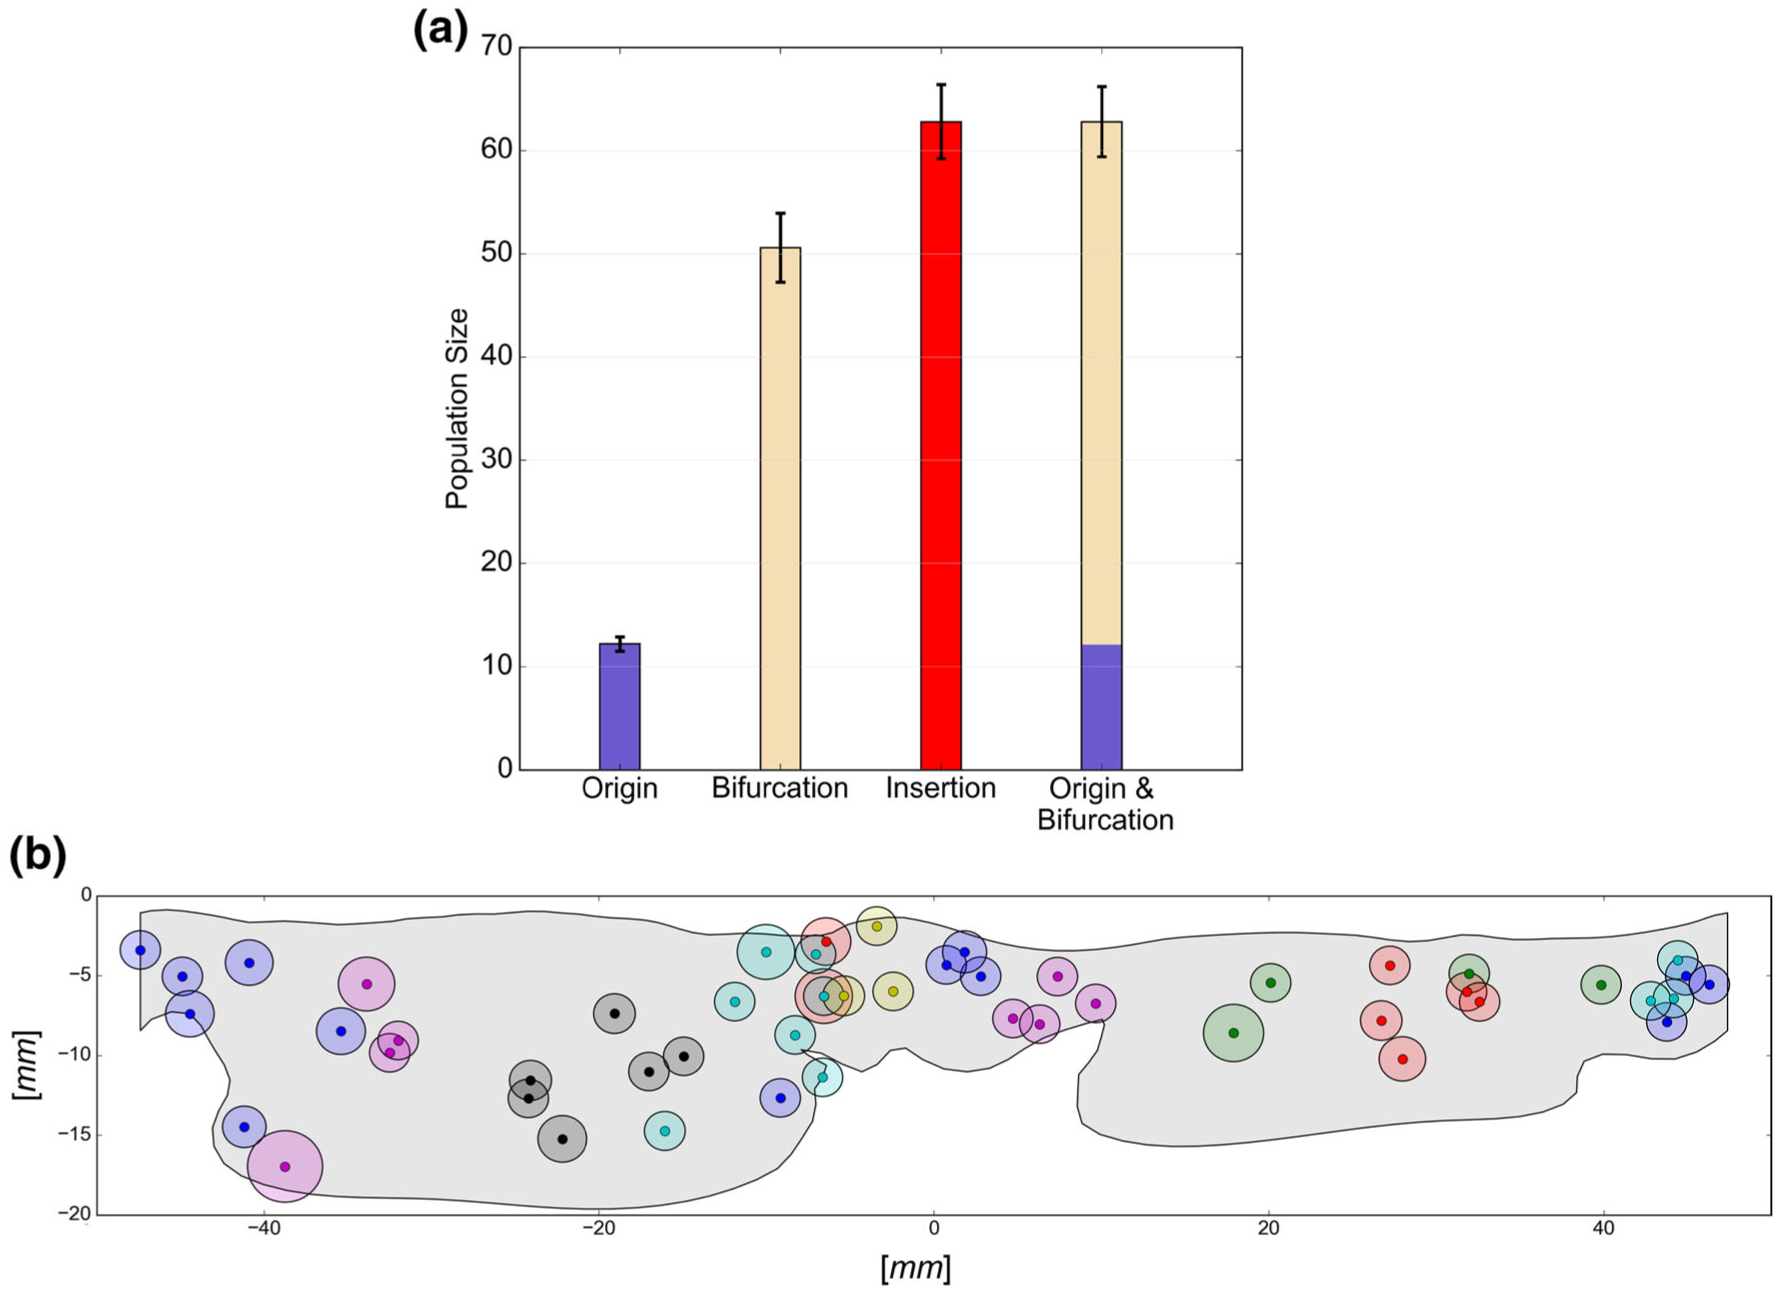
(a) Shows the relationship between the number of origin, branching, and insertion locations within each MV: bar graphs represent the average values, error bars represent standard errors. Following the full binary tree structure, the number of insertions always equals to the summation of origin and branching points. In (b), the insertion locations of an individual valve’s CT are shown in the cylindrical coordinate system overlaid with MV leaflet outline.
Geometric Properties
Upon analyzing the 3D orientation of constituents in the MV CT, we observed that each individual chord in the closed state is mostly planar (Fig. 9). In other words, chords are primarily 2D geometries that collectively form a 3D load-bearing support structure for the MV leaflets. The pooled statistics of non-planarity angles revealed that the three chordal segments at each bifurcation virtually lie in the plane that passes through the two child branches. This finding suggests negligible flexural rigidity for the MV CT and supports the assumption of approximating the MV chordal geometry with truss elements for computational simulations of the MV apparatus.
FIGURE 9.
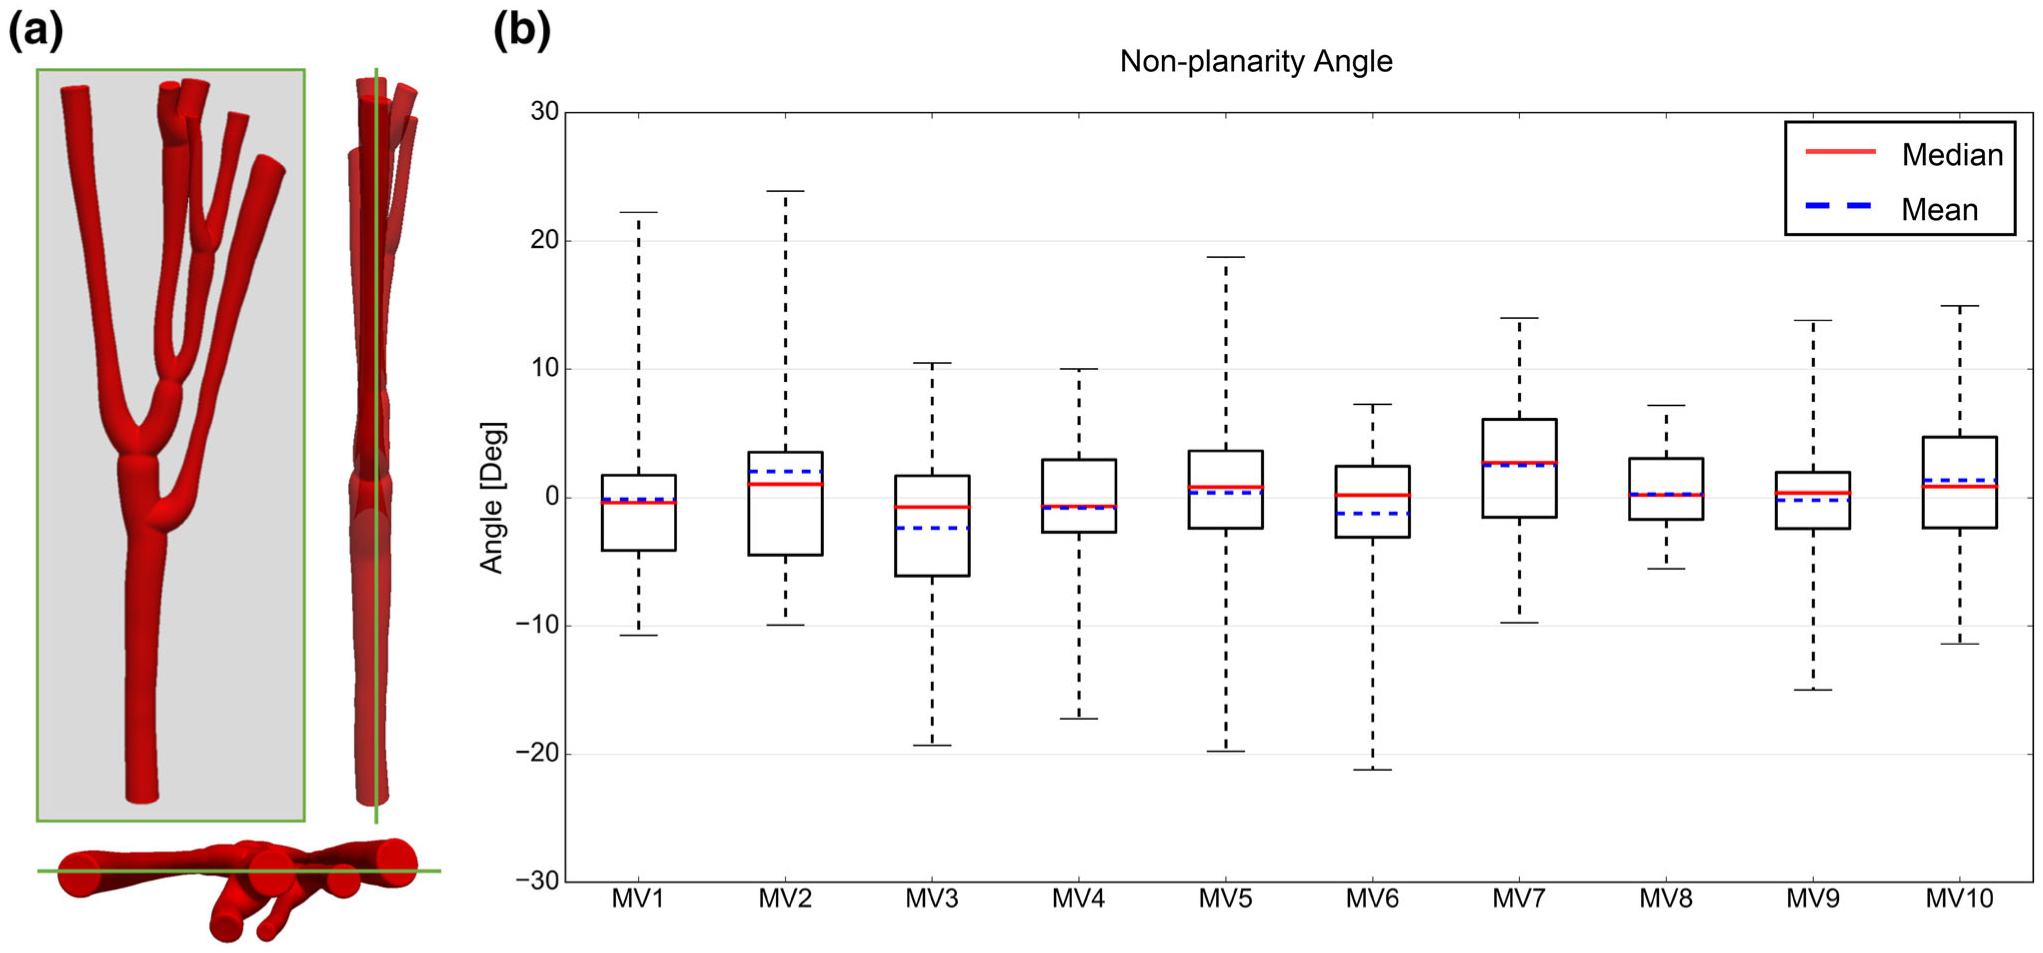
Individual chords are mostly 2D structures. (a) Shows a typical chord visualized in principal orientations. (b) Represents the collective population of non-planarity angles for 10 valves.
Our analysis showed that at bifurcation sites, there is a statistically significant difference in the CSA of the two outgoing segments (Wilcoxon signed-rank hypothesis test, p<0.001) (Fig. 10a). Interestingly, the thicker segment is generally also more aligned with the orientation of incoming segment (Wilcoxon signed-ranked hypothesis test, p<0.005) (Fig. 10b). This geometric property suggests that each chord can be characterized with one main load-bearing backbone, while other branches provide secondary support for the structure.
FIGURE 10.
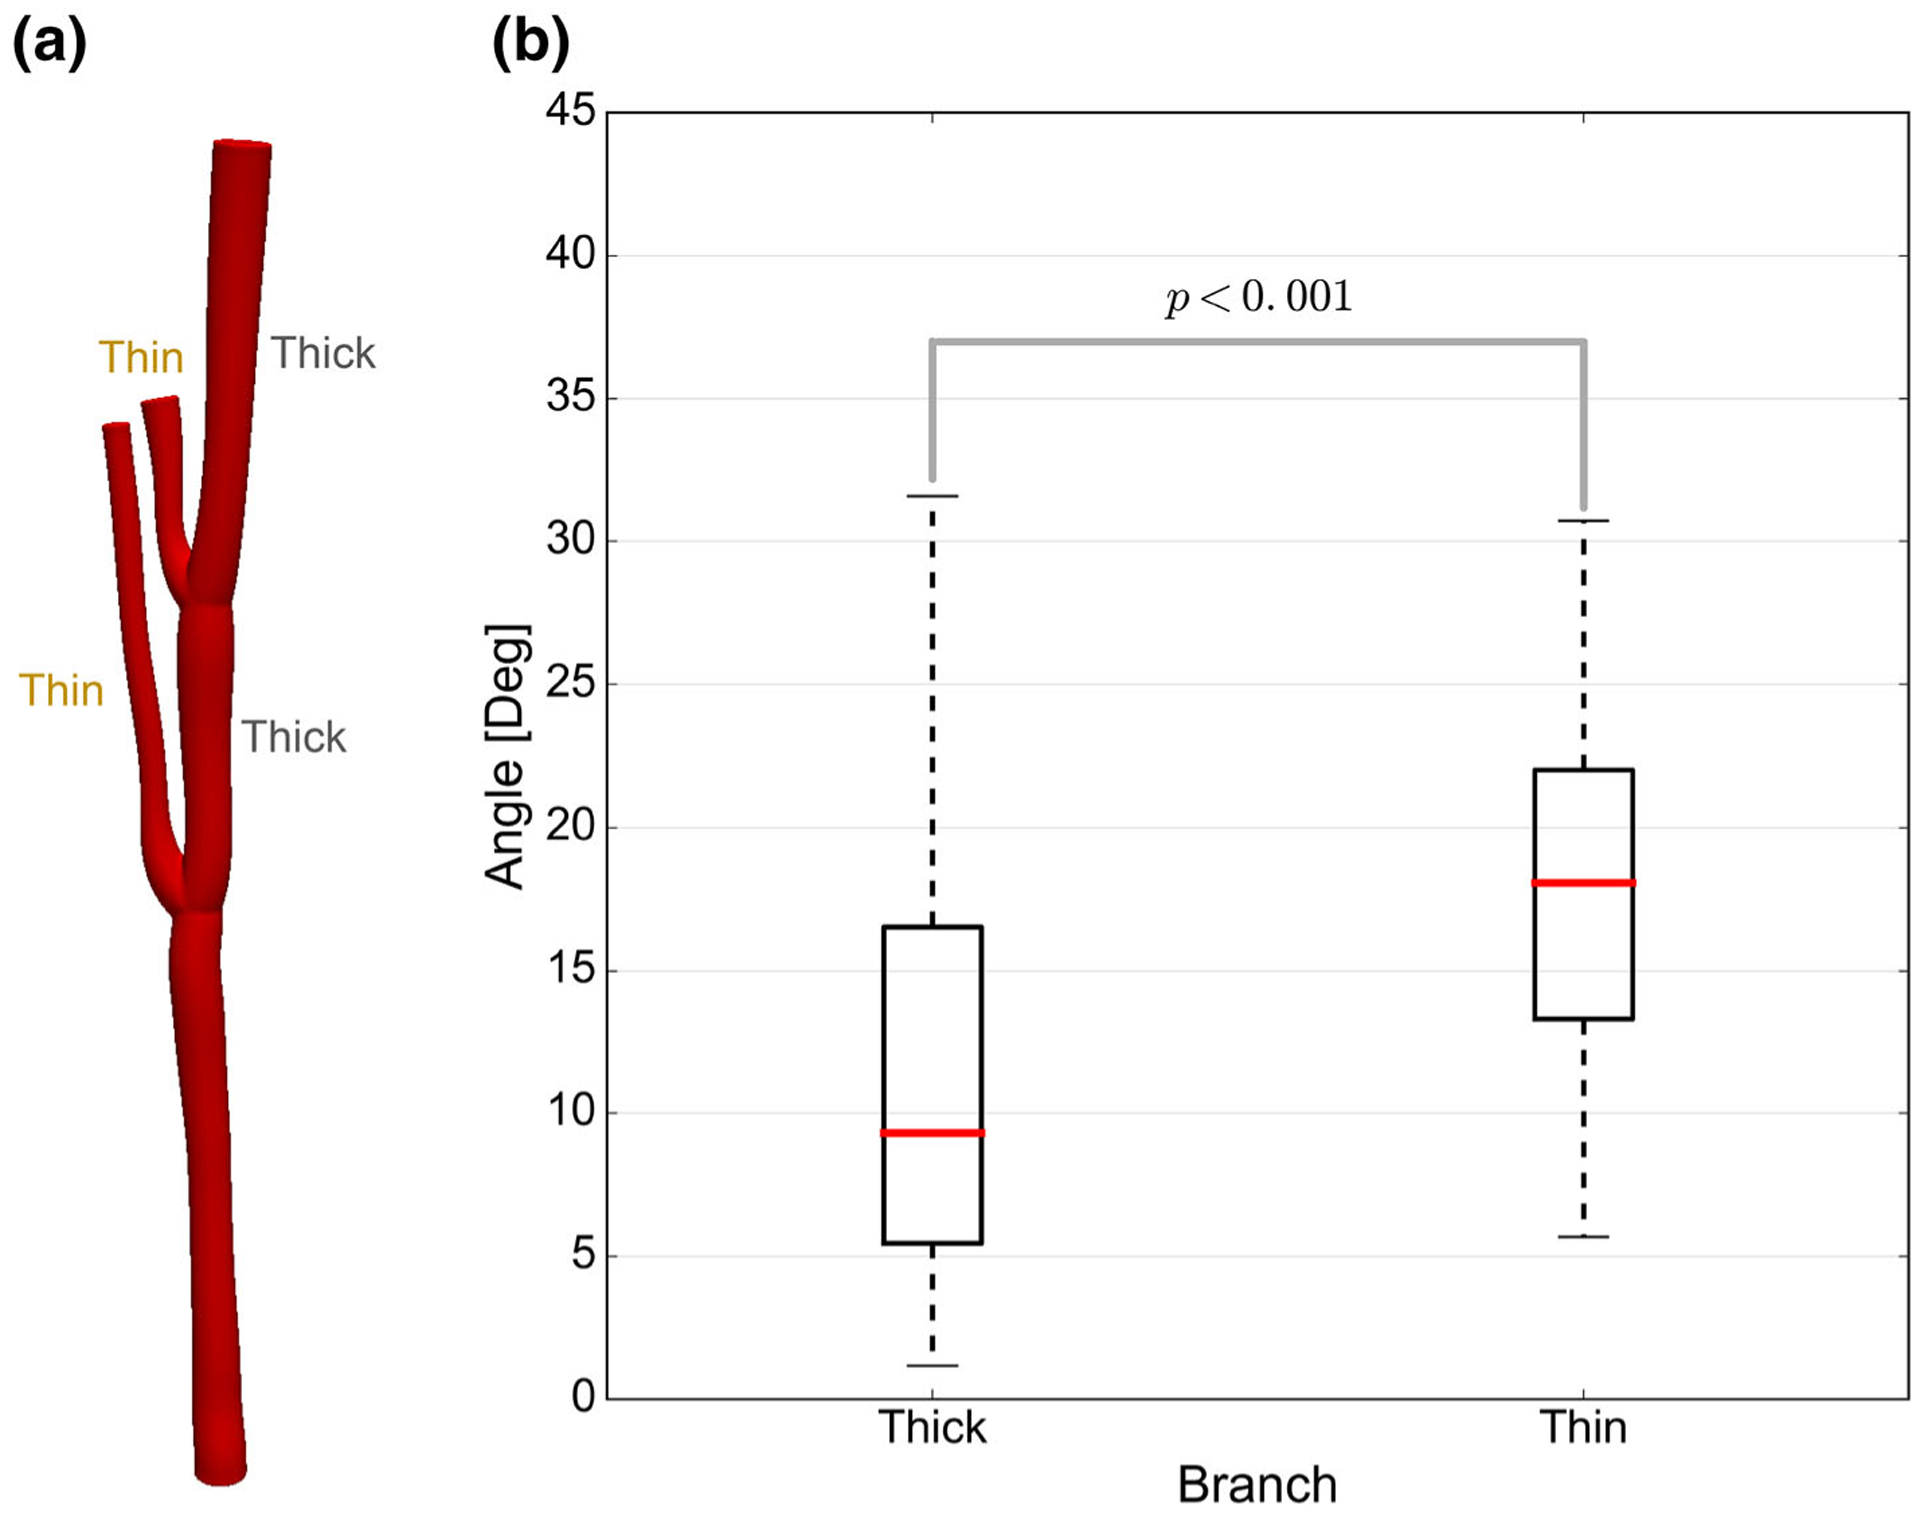
The asymmetry of a typical chordal branching structure is illustrated. Based on segment-averaged CSA, we can tag branches as either thick or thin with respect to their counterpart at each bifurcation (a). Using Wilcoxon signed-rank hypothesis testing, we showed that the thicker branches are generally closer to the direction of incoming segment at bifurcation locations (b).
We also analyzed the geometric attributes across the population and observed significantly similar trends for bifurcation angles and chordal dimensions, like the CSA and length of segments (Fig. 11). The population of these quantities for the chords of each valve can be characterized with positively shifted, right-tailed density functions. The observed trends were consistently present for all of the studied valves. However, we noticed that one of the valves (MV2) had significantly different statistical parameters (Fig. 12). Using a Kolmogorov–Smirnoff test, we rejected the hypothesis that MV2 belongs to the same family of valves as the other samples in our database (p = 0.01). Thus, in our analysis, we excluded this valve from population-averaged statistics (see population averaging section).
FIGURE 11.
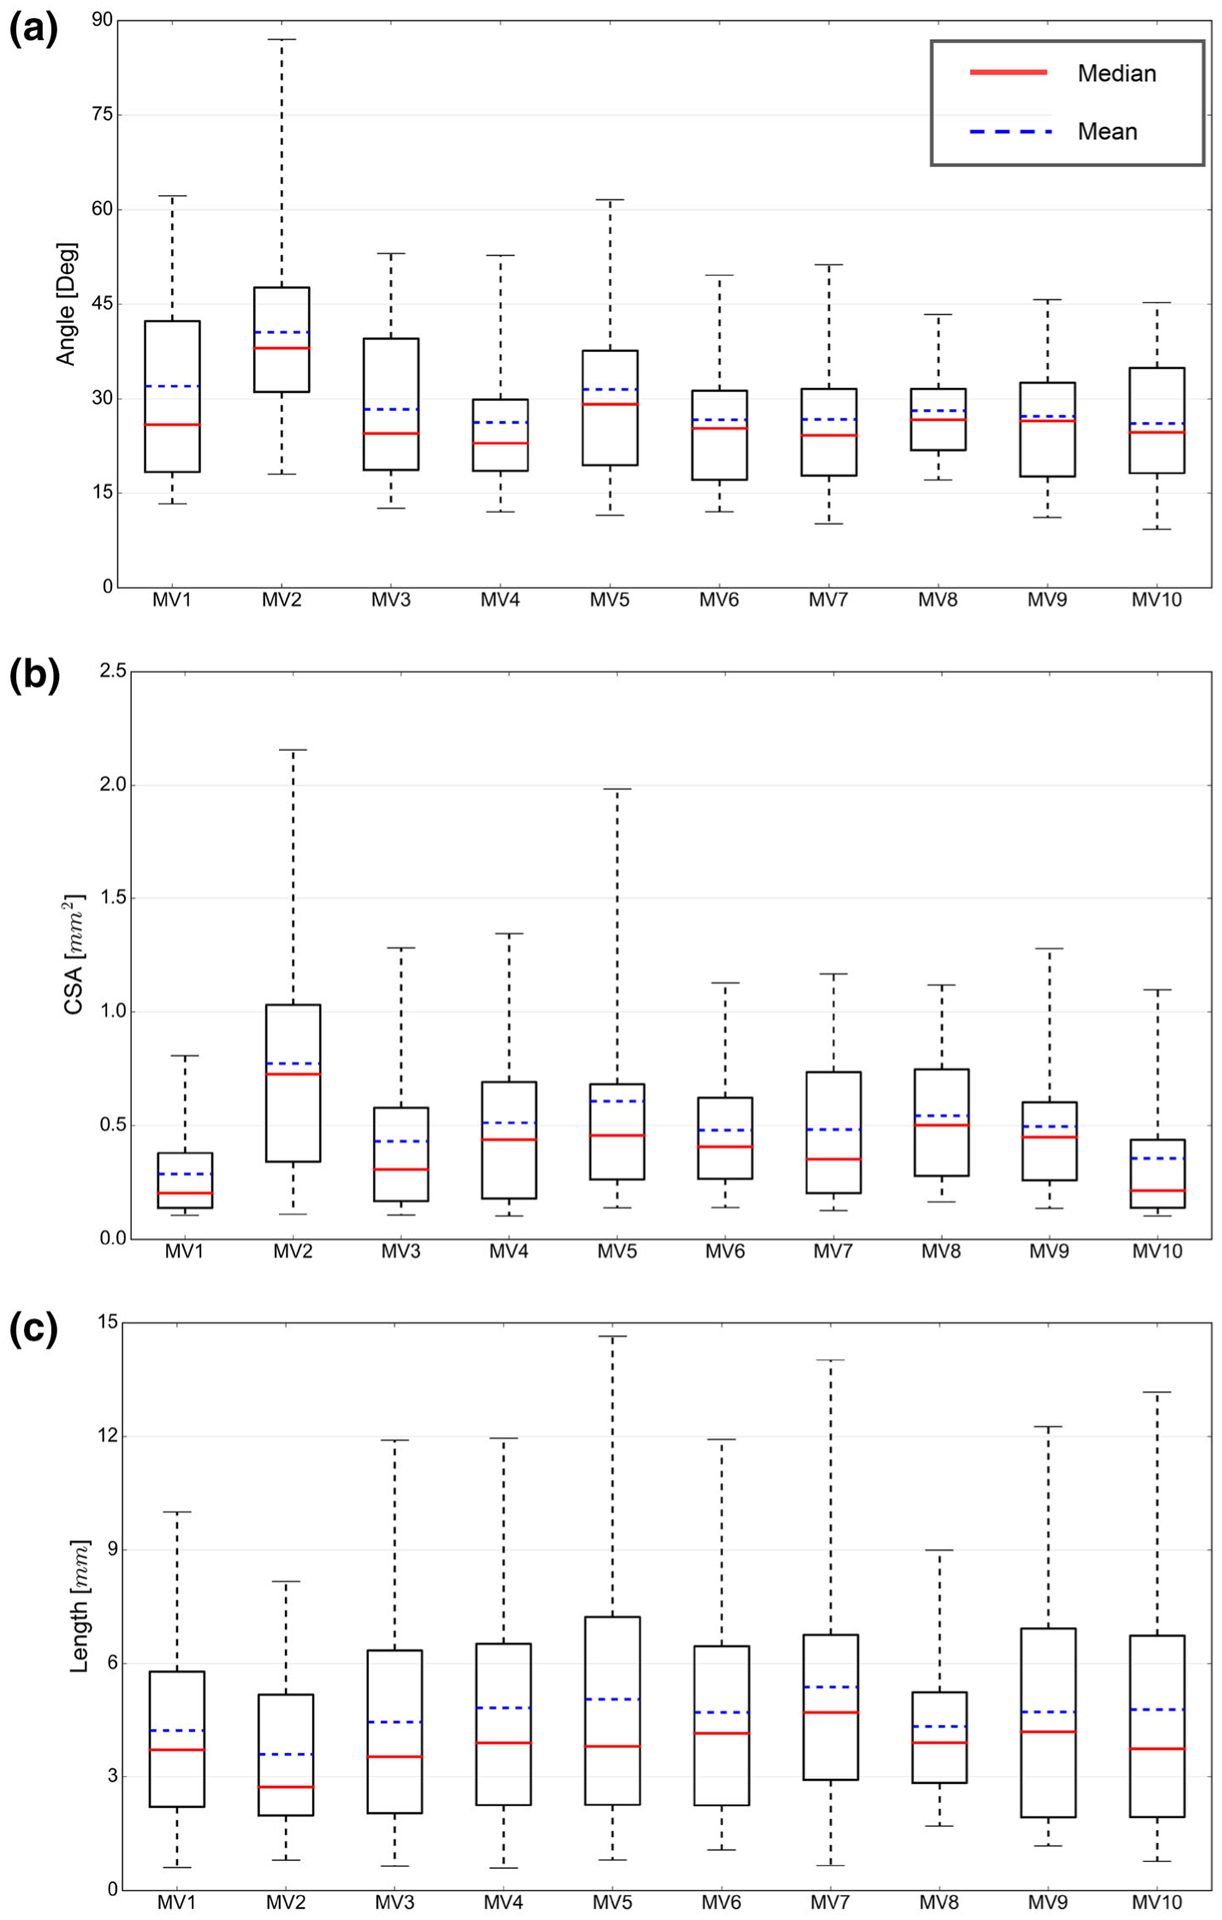
The geometric attributes characterizing MV CT are shown for a population of 10 valves. Plots (a) to (c) show the inter-valve population of bifurcation angles and segment-averaged CSA, and segment length respectively. Note that all these properties follow positively shifted, right-tailed distribution functions.
FIGURE 12.
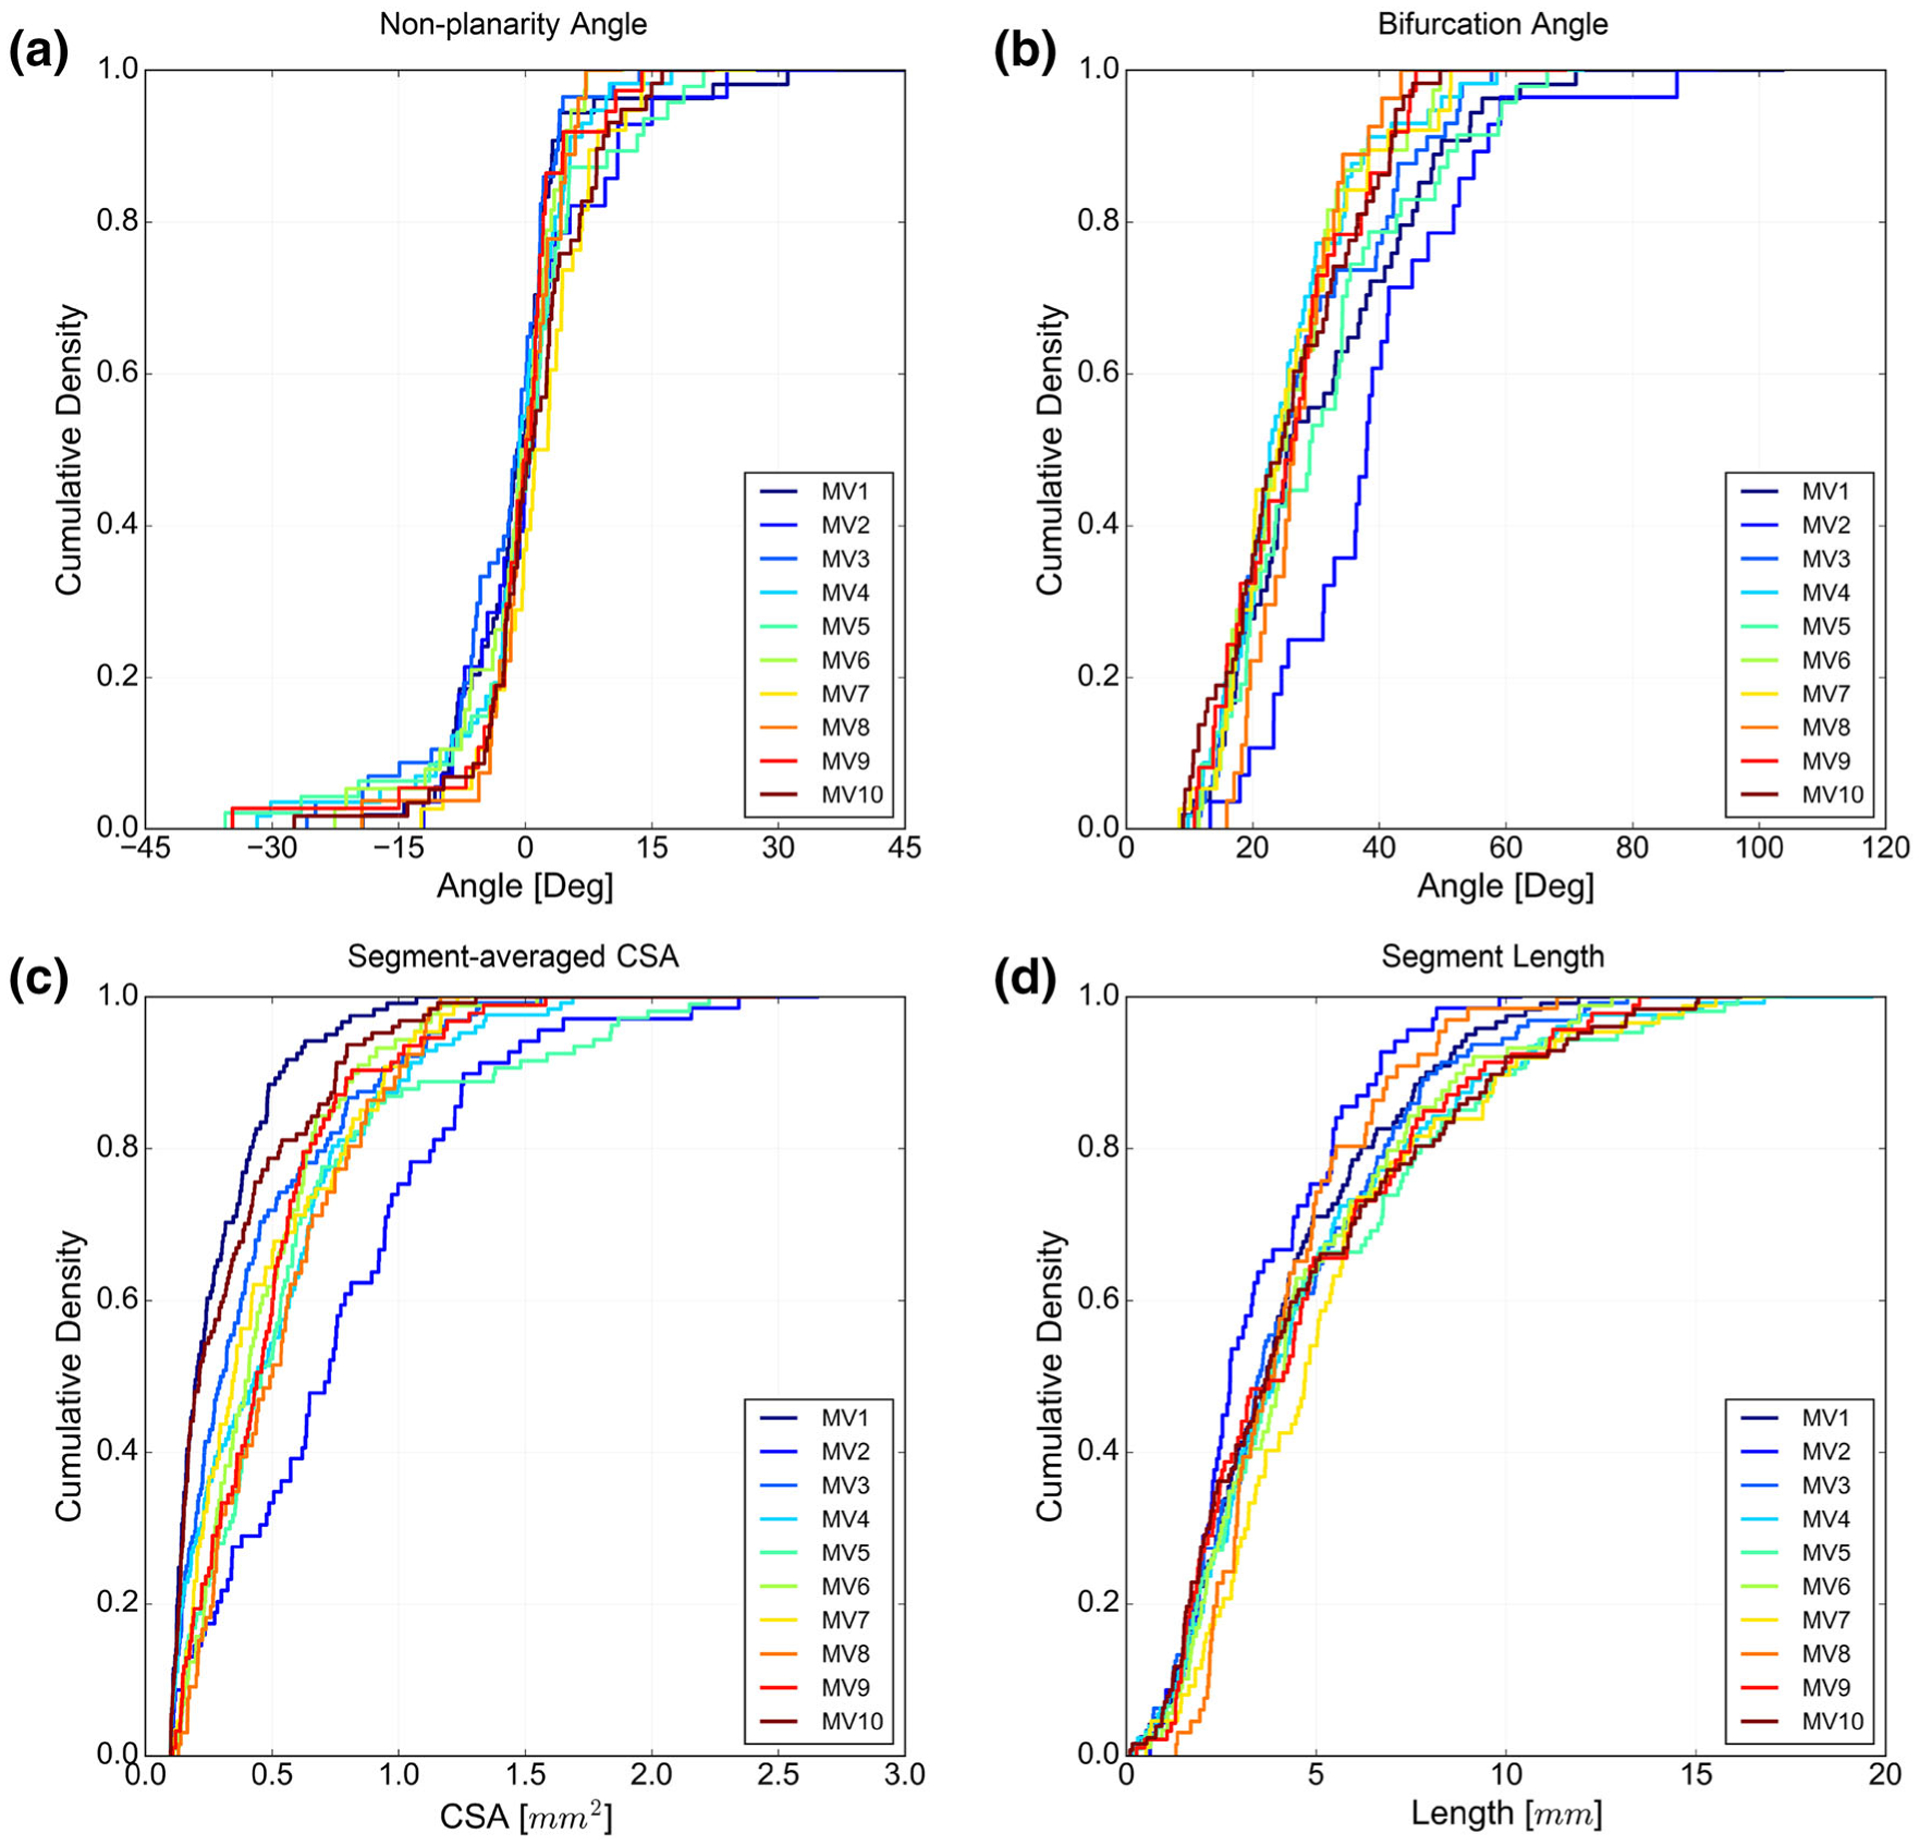
The empirical cumulative density functions for all the studied geometric attributes are shown. All of the studied valves follow similar trends, which suggests that the acquired attributes can effectively characterize the chordal geometry. Nonetheless, a Kolmogorov–Smirnoff test revealed that one valve (MV2) exhibits significantly different attribute distributions, leading us to conclude that it belongs to a different family than the other 9 samples.
CSA Variations
To study CSA variations, we performed a detailed analysis based on our isoparametric B-spline-based representation of the MV CT (Fig. 13). Overall, the CSA trends show remarkable resemblance yet distinct dissimilarities across the studied population. More specifically, our analysis showed that the CSA variation along each chordal segment follows a dogbone profile (Fig. 13a). Furthermore, the chordal structure generally becomes thinner as it gets further away from the PM tip with the average CSA consistently decreasing (Fig. 13c). However, the total area when summing over the segments of all chords generally increases from origin locations on the PM heads to the insertion sites on the leaflets.
FIGURE 13.
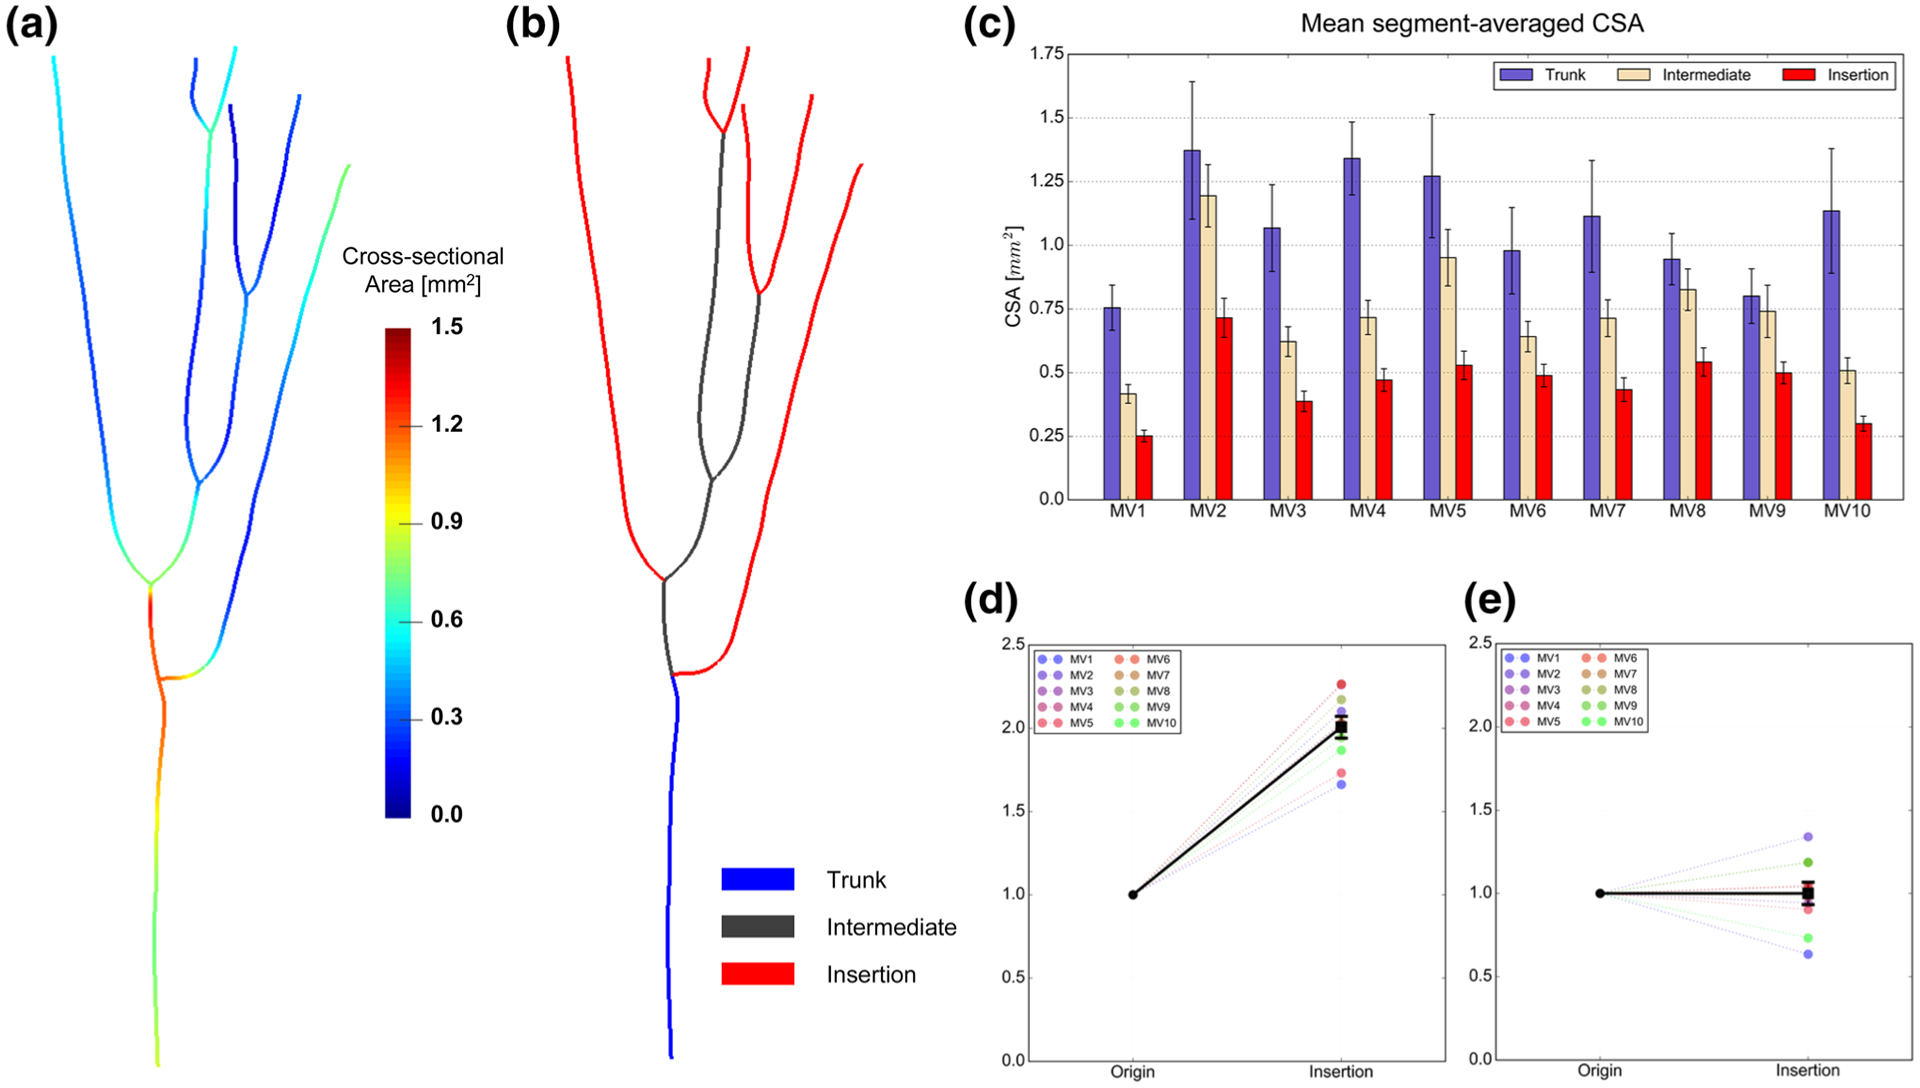
An illustration of our analysis of CSA variations along the chordal structure. (a) Shows the continuous reconstruction of CSA. In (b), we show our classification of the chordal segments to perform a topologically relevant intra- and inter-valve CSA comparison. The average area decreases (c) along the chordal structure in the direction from origin to insertion, while at the same time the total area increases (d). At the same time, (e) shows that the relative CSA values projected onto the skeleton curves for each chord vary between 0.64 and 1.34.
At the organ level, we analyzed CSA values at the two ends of the chordal structure (origin and insertion points), which revealed remarkable regularities. First, the total area at the insertion sites is almost exactly twice the area at origin points (2.007 ± 0.065) (Fig. 13d). This gradual increase of total CSA can be described as a smooth geometric flaring so the chordal geometry homogeneously merges with the MV leaflets. We also computed the projected area along the trunk for each chord and interestingly found that on average the structurally effective total area remains almost constant (0.999 ± 0.067) (Fig. 13e). This might suggest that the MV chordal structure is optimized to uniformly distribute the loads on the MV leaflets toward the PM heads.
Population Averaging
Based on data from nine valves, we developed a set of population-representative statistical models to describe the chordal geometric attributes (Fig. 14). As mentioned earlier (see Fig. 12), using a statistical hypothesis test, we showed that one of the valves in our population belongs to a different family and thus was excluded in our analysis. The results of analyzing nine other valves show that analytical statistical models can effectively describe the geometric quantities that characterize the MV CT.
FIGURE 14.
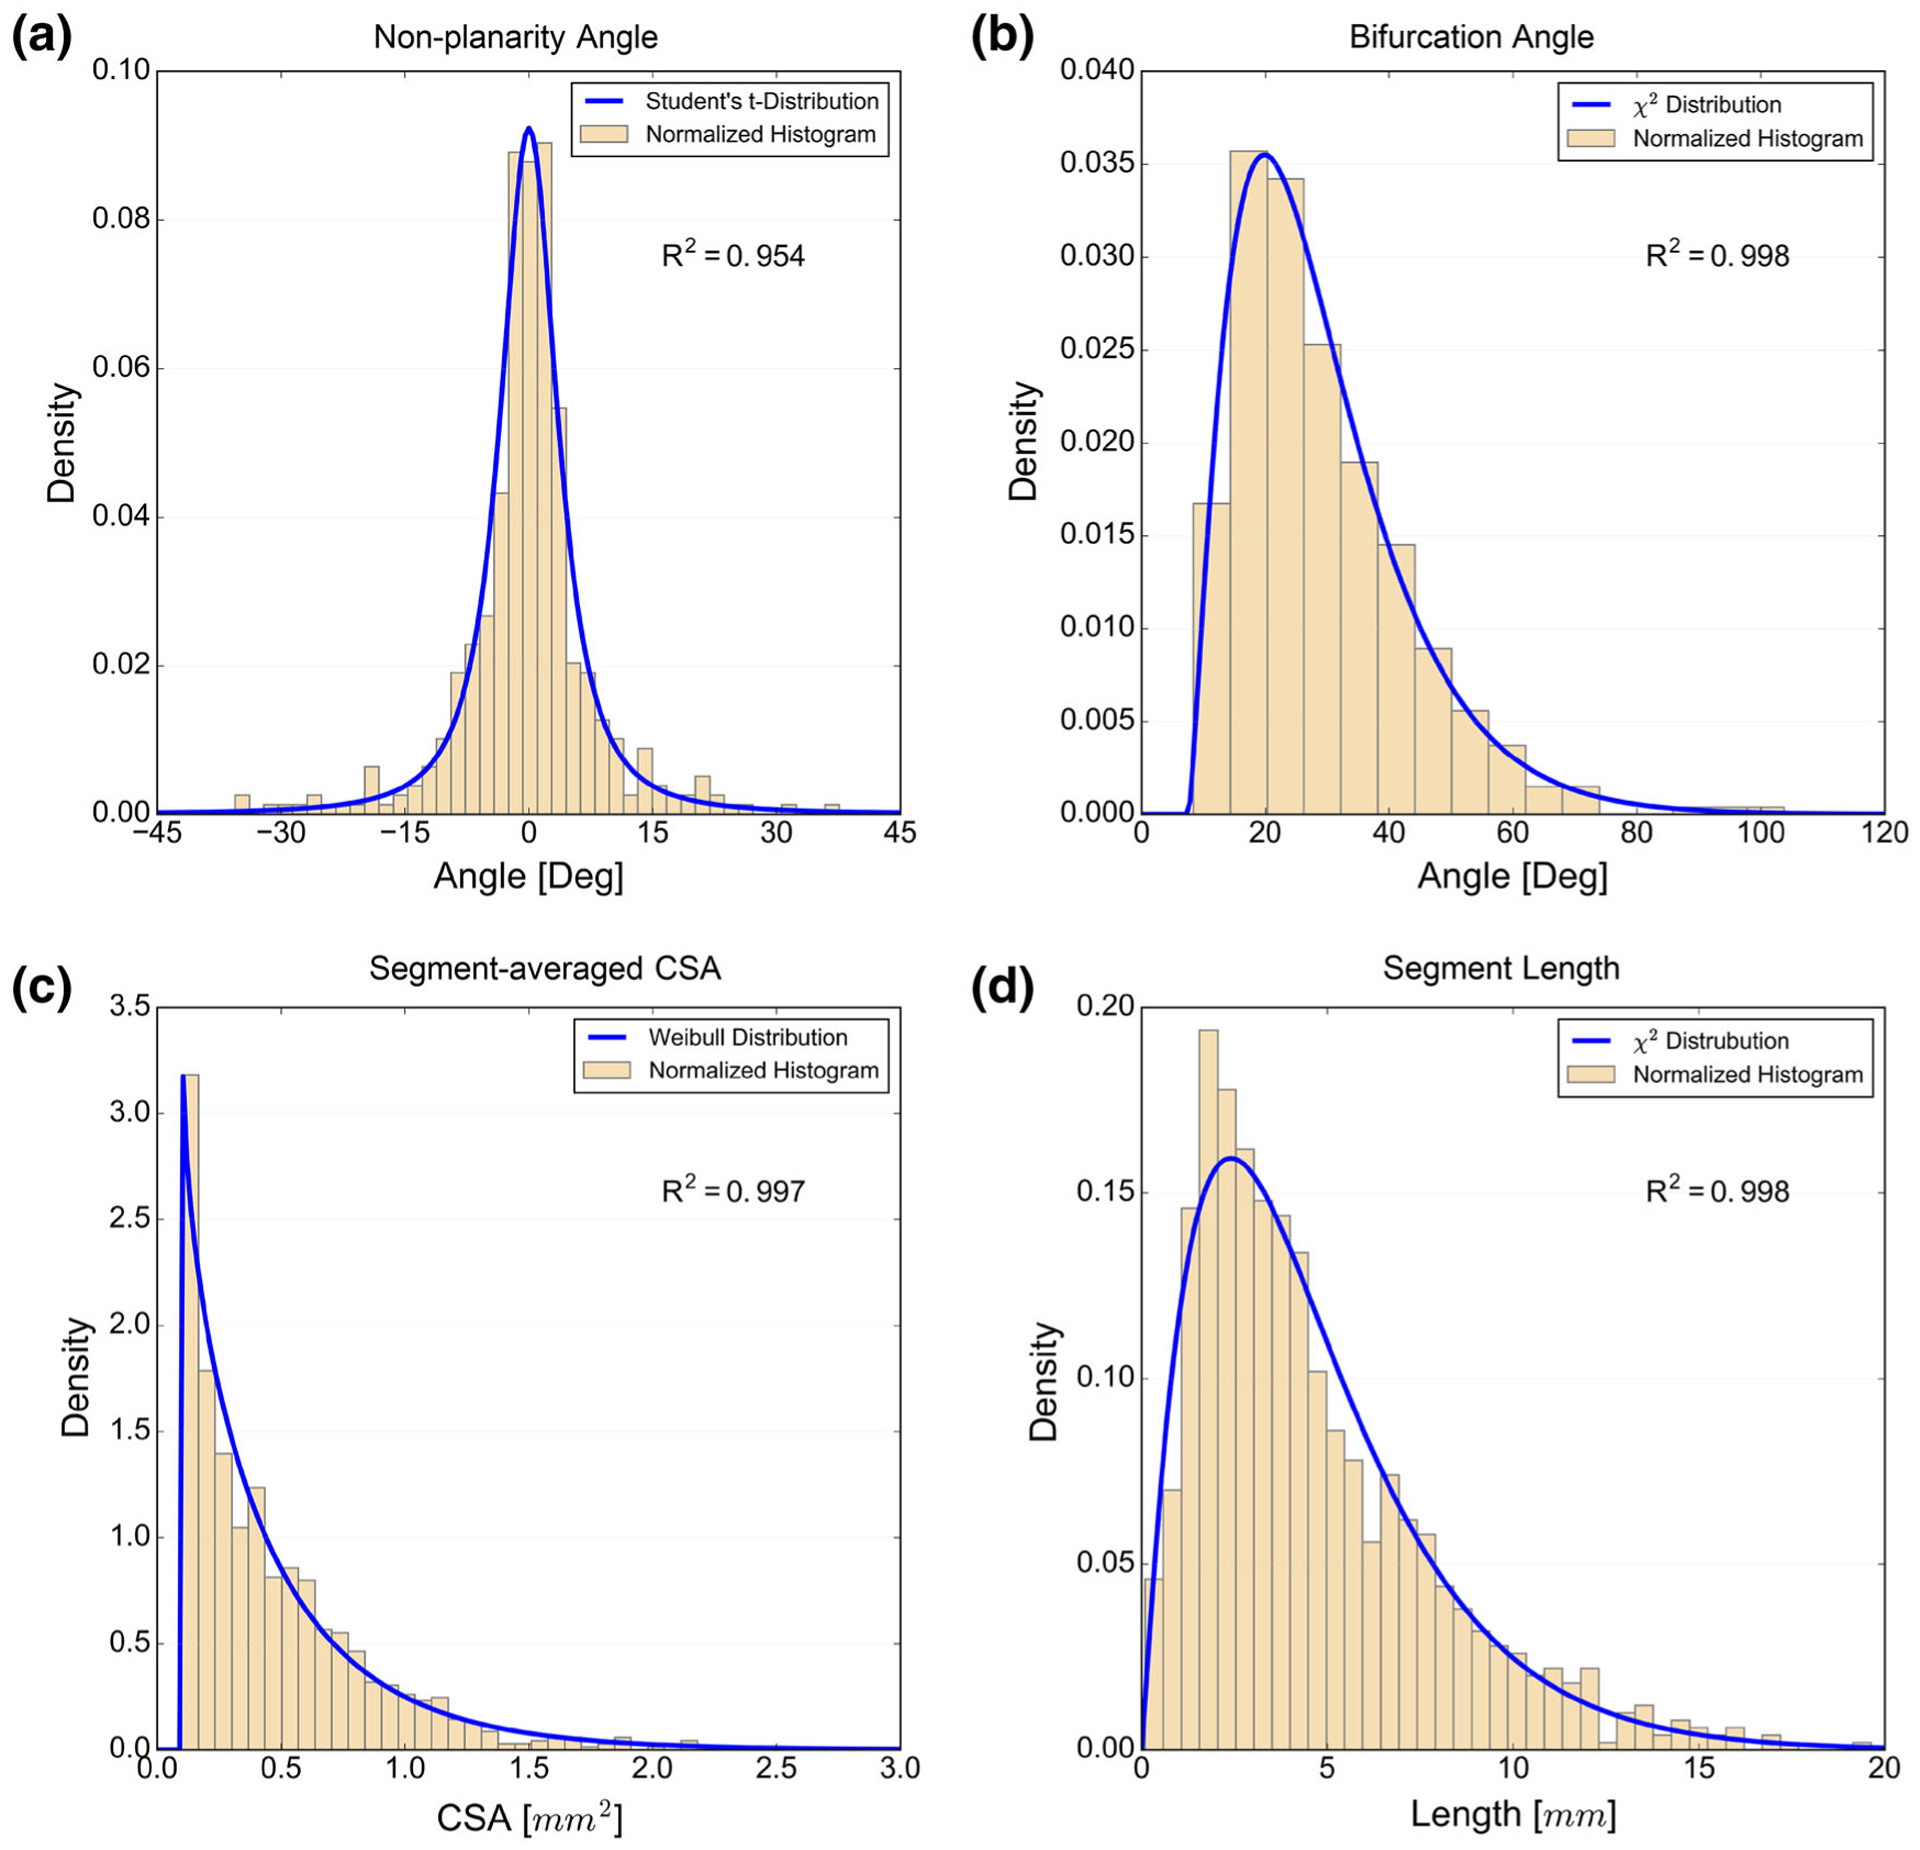
The population-representative distribution functions are shown. The analytic probability density functions used to model data were set empirically and further investigation might be able to explain the specific forms of distribution functions determined here by linking together the function, geometry, and biological factors.
DISCUSSION
General Findings
Based on our collective findings, we concluded that the topology of ovine MV CT can be effectively represented using a full binary tree model. This interesting finding suggests that the structure of MV CT is not random, and, in fact, is tied to some specific fundamental factors. Moreover, we believe this regularity is serving some specific functionality and thus should be considered in the development of computational MV CT models. Another significant regularity that we observed in the chordal structure is the planarity of individual chords in the end-systolic state. We speculate that this specific pattern relates to the underlying mechanism of CT formation through fetal heart growth. Together, the full binary tree and planarity pattern greatly help toward providing correspondence between different valves and also predicting possible shapes for the MV chordal structure.
We also studied the population of anatomical landmarks (origin, insertion, and branching locations) in the chordal structure and observed that, in an average sense, for a single MV the CT can be topologically approximated with 12 chords, each with five insertion sites. Since the chordal geometry remains undetectable via in vivo imaging, such simplified models provide a meaningful first-order approximation of the MV CT to build computational models based on clinical imaging data. It should be noted that developing average geometric models of the CT landmarks requires co-registration of different valves, which is beyond the scope of this study. We are currently working on mapping landmark locations to the open state of the valve, perform registration using continuous models, and then develop population-representative statistics.
In terms of geometric attributes, we found that the area contributing to bearing pressure load remains relatively constant along the chord length, until it thickens with a flaring profile at the leaflet attachment locations (see Fig. 13). This geometric structure suggests that there is no distinct sharp boundary between the highly aligned collagenous tissue in MV CT and the leaflet tissue. Functionally, this serves to gradually distribute the CT unidirectional forces to the membrane-like MV leaflet.
We also developed population-representative models of the geometric attributes which indicated that there exists some fundamental underlying features that govern the shape of chordal structure. This remarkable regularity further supports our hypothesis that the average CT models can be developed and might be quite effective in predicative computational simulations of the MV. Further, we hope that upon the development of average CT models, they can be used as templates to faithfully predict patient-specific chordal structures and in turn perform high-fidelity simulations using anatomically accurate models.
Limitations
While we utilized a total of 10 ovine MVs, they were pre-selected to match the specifications of our in vitro left heart simulator. It should be noted that the only major requirement imposed by our setup was to use valves within a specific range of annular sizes. While this size restriction might have limited the range of topologies observed, we believe the trends extracted in the topology and geometry characteristics are reliable and were unaffected by our experimental protocols. That said, the generalization of our methods to humans will require a larger number of specimens from a more representative cohort. Furthermore, we developed geometric models of the MV chordal structure in the fully loaded (coapted) configuration. We acknowledge that developing computational models of the full MV to simulate the valve’s closing behavior requires reconstruction of the MV CT in the open state. To this end, the geometric models of the MV CT developed here need to be morphed back to the open state in order to be integrated with computational MV leaflet models.22
Future Directions
Overall, our findings suggest that the chordal structure is sufficiently consistent to develop population-based computational models of the MV for improving valve repair procedures and inspiring novel treatment strategies. Since the chordal geometry remains undetectable via in vivo imaging, such simplified models provide a meaningful approximation of the MV CT to build computational models based on clinical imaging data. Furthermore, we believe algorithmic approaches can be designed to approximate the patient-specific geometry of CT from clinical images, based on the underlying regularity in the chordal structure, even though the thin chordal structure is hard to recover from in vivo images. Computational tools can then be used to faithfully simulate personalized MV repair procedures or optimize patient-customized implants (e.g. patient-specific annuloplasty rings).
In our future studies, we thus aim to apply our modeling methodology and analysis pipeline to study the anatomic geometry of human MV CT. We are also working on developing statistical models of the MV CT geometric landmarks, which are required to develop population-representative average models of the chordal structure. It is worth noting that our purely geometric framework places no restrictions on subject species and the efficiency of our modeling approach only relies on image resolution to fully recover the fine features of the MV CT. However, further investigation is required to test if the full binary tree pattern can effectively model the branching pattern of human MV CT.
ACKNOWLEDGMENTS
Research reported in this publication was supported by National Heart, Lung, and Blood Institute of the National Institutes of Health under Award Number R01-HL119297. The content is solely the responsibility of the authors and does not necessarily represent the official views of the National Institutes of Health. The authors gratefully acknowledge Bruno V. Rego for helpful discussions.
LIST OF SYMBOLS
- MV
Mitral valve
- LV
Left ventricle
- PM
Papillary muscle
- CSA
Cross sectional area
- Micro-CT
Micro computed tomography
- TVP
Trans-valvular pressure
- MLE
Maximum likelihood estimation
REFERENCES
- 1.Biasotti S, Giorgi D, Spagnuolo M, and Falcidieno B. Reeb graphs for shape analysis and applications. Theor. Comput. Sci 392(1):5–22, 2008. [Google Scholar]
- 2.Bloodworth CH, Pierce EL, Easley TF, Drach A, Khalighi AH, Toma M, Jensen MO, Sacks MS, and Yoganathan AP. Ex vivo methods for informing computational models of the mitral valve. Ann. Biomed. Eng 1–12, 2016. [DOI] [PMC free article] [PubMed] [Google Scholar]
- 3.Bouma W, Lai EK, Levack MM, Shang EK, Pouch AM, Eperjesi TJ, Plappert TJ, Yushkevich PA, Mariani MA, Khabbaz KR, Gleason TG, Mahmood F, Acker MA, Woo YJ, Cheung AT, Jackson BM, Gorman JH 3rd, and Gorman RC. Preoperative three-dimensional valve analysis predicts recurrent ischemic mitral regurgitation after mitral annuloplasty. Ann. Thorac. Surg 101(2):567–575, 2016. [DOI] [PMC free article] [PubMed] [Google Scholar]
- 4.Braunberger E, Deloche A, Berrebi A, Abdallah F, Celestin JA, Meimoun P, Chatellier G, Chauvaud S, Fabiani JN, and Carpentier A. Very long-term results (more than 20 years) of valve repair with carpentier’s techniques in nonrheumatic mitral valve insufficiency. Circulation 104(12 Suppl 1):I8–I11, 2001. [PubMed] [Google Scholar]
- 5.Caiani EG, Fusini L, Veronesi F, Tamborini G, Maffessanti F, Gripari P, Corsi C, Naliato M, Zanobini M, and Alamanni F. Quantification of mitral annulus dynamic morphology in patients with mitral valve prolapse undergoing repair and annuloplasty during a 6-month follow-up. Eur. Heart J.-Cardiovasc. Imaging jer016, 2011. [DOI] [PubMed] [Google Scholar]
- 6.Casado JA, Diego S, Ferreño D, Ruiz E, Carrascal I, Méndez D, Revuelta JM, Pontón A, Icardo JM, and Gutiérrez-Solana F. Determination of the mechanical properties of normal and calcified human mitral chordae tendineae. J. Mech. Behav. Biomed. Mater 13:1–13, 2012. [DOI] [PubMed] [Google Scholar]
- 7.Chikwe J, and Adams DH. State of the art: degenerative mitral valve disease. Heart, Lung Circ. 18(5):319–329, 2009. [DOI] [PubMed] [Google Scholar]
- 8.Ciarka A, and Van de Veire N. Secondary mitral regurgitation: pathophysiology, diagnosis, and treatment. Heart 97(12):1012–1023, 2011. [DOI] [PubMed] [Google Scholar]
- 9.d’Arcy J, Prendergast B, Chambers J, Ray S, and Bridgewater B. Valvular heart disease: the next cardiac epidemic. Heart 97(2):91–93, 2011. [DOI] [PubMed] [Google Scholar]
- 10.Dal-Bianco JP, Aikawa E, Bischoff J, Guerrero JL, Handschumacher MD, Sullivan S, Johnson B, Titus JS, Iwamoto Y, Wylie-Sears J, Levine RA, and Carpentier A. Active adaptation of the tethered mitral valve: insights into a compensatory mechanism for functional mitral regurgitation. Circulation 120(4):334–342, 2009. [DOI] [PMC free article] [PubMed] [Google Scholar]
- 11.David TE, Armstrong S, McCrindle BW, and Manlhiot C. Late outcomes of mitral valve repair for mitral regurgitation due to degenerative disease. Circulation: CIRCULATIONAHA, 112.000699, 2013. [DOI] [PubMed] [Google Scholar]
- 12.Espino DM, Shepherd D, Hukins D, and Buchan KG. The role of Chordae tendineae in mitral valve competence. J. Heart Valve Dis 14(5):603–609, 2005. [PubMed] [Google Scholar]
- 13.Faletra FF, Pedrazzini G, Pasotti E, Petrova I, Drasutiene A, Dequarti MC, Muzzarelli S, and Moccetti T. Role of real-time three dimensional transoesophageal echocardiography as guidance imaging modality during catheter based edge-to-edge mitral valve repair. Heart 99(16):1204–1215, 2013. [DOI] [PubMed] [Google Scholar]
- 14.Gabbay U, and Yosefy C. The underlying causes of chordae tendinae rupture: a systematic review. Int. J. Cardiol 143(2):113–118, 2010. [DOI] [PubMed] [Google Scholar]
- 15.Grbic S, Easley TF, Mansi T, Bloodworth CH, Pierce EL, Voigt I, Neumann D, Krebs J, Yuh DD, and Jensen. Multi-modal validation framework of mitral valve geometry and functional computational models. Stat. Atlases Comput. Models Heart-Imaging Model. Chall, pp. 239–248, 2015. [Google Scholar]
- 16.Gunnal S, Wabale R, and Farooqui M. Morphological study of chordae tendinae in human cadaveric hearts. Heart Views: Off. J. Gulf Heart Assoc 16(1):1, 2015. [DOI] [PMC free article] [PubMed] [Google Scholar]
- 17.Gunning GM, and Murphy BP. Characterisation of the fatigue life, dynamic creep and modes of damage accumulation within mitral valve chordae tendineae. Acta Biomater. 24:193–200, 2015. [DOI] [PubMed] [Google Scholar]
- 18.He S, Weston MW, Lemmon J, Jensen M, Levine RA, and Yoganathan AP. Geometric distribution of chordae tendineae: an important anatomic feature in mitral valve function. J. Heart Valve Dis 9(4):495–501, 2000; (discussion 502–3). [PubMed] [Google Scholar]
- 19.Hutchison J, and Rea P. A comparative study of the morphology of mammalian true chordae tendineae of the atrioventricular valves. J. Morphol 32(2):71–77, 2015. [DOI] [PMC free article] [PubMed] [Google Scholar]
- 20.Ibrahim M, Rao C, and Athanasiou T. Artificial chordae for degenerative mitral valve disease: critical analysis of current techniques. Interact. Cardiovasc. Thorac. Surg 15(6):1019–1032, 2012. [DOI] [PMC free article] [PubMed] [Google Scholar]
- 21.Jassar AS, Vergnat M, Jackson BM, McGarvey JR, Cheung AT, Ferrari G, Woo YJ, Acker MA, Gorman RC, and Gorman JH. Regional annular geometry in patients with mitral regurgitation: implications for annuloplasty ring selection. Ann. Thorac. Surg 97(1):64–70, 2014. [DOI] [PMC free article] [PubMed] [Google Scholar]
- 22.Khalighi AH, Drach A, ter Huurne FM, Lee C-H, Bloodworth C, Pierce EL, Jensen MO, Yoganathan AP, and Sacks MS. A comprehensive framework for the characterization of the complete mitral valve geometry for the development of a population-averaged model. Funct. Imaging Model. Heart, 164–171, 2015. [Google Scholar]
- 23.Lee CH, Carruthers CA, Ayoub S, Gorman RC, Gorman JH 3rd, and Sacks MS. Quantification and simulation of layer-specific mitral valve interstitial cells deformation under physiological loading. J. Theor. Biol 373:26, 2015. [DOI] [PMC free article] [PubMed] [Google Scholar]
- 24.Lee CH, Rabbah JP, Yoganathan AP, Gorman RC, Gorman JH 3rd, and Sacks MS. On the effects of leaflet microstructure and constitutive model on the closing behavior of the mitral valve. Biomech. Model. Mechanobiol 14:1281, 2015. [DOI] [PMC free article] [PubMed] [Google Scholar]
- 25.Liao J, and Vesely I. A structural basis for the size-related mechanical properties of mitral valve chordae tendineae. J. Biomech 36(8):1125–1133, 2003. [DOI] [PubMed] [Google Scholar]
- 26.Lomholt M, Nielsen SL, Hansen S, Andersen NT, and Hasenkam JM. Differential tension between secondary and primary mitral chordae in an acute in vivo porcine model. J. Heart Valve Dis 11(3):337–345, 2002. [PubMed] [Google Scholar]
- 27.Malladi R, and Sethian JA. Image processing via level set curvature flow. Proc. Natl. Acad. Sci. USA 92(15):7046–7050, 1995. [DOI] [PMC free article] [PubMed] [Google Scholar]
- 28.Messas E, Guerrero JL, Handschumacher MD, Conrad C, Chow CM, Sullivan S, Yoganathan AP, and Levine RA. Chordal cutting: a new therapeutic approach for ischemic mitral regurgitation. Circulation 104(16):1958–1963, 2001. [DOI] [PubMed] [Google Scholar]
- 29.Millington-Sanders C, Meir A, Lawrence L, and Stolinski C. Structure of chordae tendineae in the left ventricle of the human heart. J. Anat 192(04):573–581, 1998. [DOI] [PMC free article] [PubMed] [Google Scholar]
- 30.Neely RC, Leacche M, Byrne CR, Norman AV, and Byrne JG. New approaches to cardiovascular surgery. Curr. Probl. Cardiol 39(12):427–466, 2014. [DOI] [PubMed] [Google Scholar]
- 31.Osmundson PJ, Callahan JA, and Edwards JE. Ruptured mitral chordae tendineae. Circulation 23(1):42–54, 1961. [DOI] [PubMed] [Google Scholar]
- 32.Owais K, Montealegre-Gallegos M, Jeganathan J, Matyal R, Khabbaz KR, and Mahmood F. Dynamic changes in the ischemic mitral annulus: implications for ring sizing. Ann. Card. Anaesth 19(1):15, 2016. [DOI] [PMC free article] [PubMed] [Google Scholar]
- 33.Pham T, and Sun W. Material properties of aged human mitral valve leaflets. J. Biomed. Mater. Res. Part A 102(8):2692–2703, 2014. [DOI] [PMC free article] [PubMed] [Google Scholar]
- 34.Piegl L, and Tiller W. The NURBS Book. New York: Springer, 1997. [Google Scholar]
- 35.Rabbah J-P, Saikrishnan N, and Yoganathan AP. A novel left heart simulator for the multi-modality characterization of native mitral valve geometry and fluid mechanics. Ann. Biomed. Eng 41(2):305–315, 2013. [DOI] [PMC free article] [PubMed] [Google Scholar]
- 36.Rao C, Hart J, Chow A, Siannis F, Tsalafouta P, Murtuza B, Darzi A, Wells FC, and Athanasiou T. Does preservation of the sub-valvular apparatus during mitral valve replacement affect long-term survival and quality of life? A microsimulation study. J. Cardiothorac. Surg 3(1):17, 2008. [DOI] [PMC free article] [PubMed] [Google Scholar]
- 37.Ritchie J, Jimenez J, He Z, Sacks MS, and Yoganathan AP. The material properties of the native porcine mitral valve chordae tendineae: an in vitro investigation. J. Biomech 39(6):1129–1135, 2006. [DOI] [PubMed] [Google Scholar]
- 38.Siefert AW, Rabbah JPM, Koomalsingh KJ, Touchton SA, Saikrishnan N, McGarvey JR, Gorman RC, Gorman JH, and Yoganathan AP. In vitro mitral valve simulator mimics systolic valvular function of chronic ischemic mitral regurgitation ovine model. Ann. Thorac. Surg 95(3):825–830, 2013. [DOI] [PMC free article] [PubMed] [Google Scholar]
- 39.Sousa UM, Grare P, Jebara V, Fuzelier J, Portoghese M, Acar C, Relland J, Mihaileanu S, Fabiani J, and Carpentier A. Transposition of chordae in mitral valve repair. Mid-term results. Circulation 88(5 Pt 2):II35–II38, 1993. [PubMed] [Google Scholar]
- 40.Tagliasacchi A Skeletal representations and applications. arXiv preprint arXiv:1301.6809, 2013. [Google Scholar]
- 41.Team, R. C. R: a language and environment for statistical computing, 2013.
- 42.Thom T, Haase N, Rosamond W, Howard VJ, Rumsfeld J, Manolio T, Zheng ZJ, Flegal K, O’Donnell C, Kittner S, Lloyd-Jones D, Goff DC Jr, Hong Y, Adams R, Friday G, Furie K, Gorelick P, Kissela B, Marler J, Meigs J, Roger V, Sidney S, Sorlie P, Steinberger J, Wasserthiel-Smoller S, Wilson M, and Wolf P. Heart disease and stroke statistics–2006 update: a report from the American Heart Association Statistics Committee and Stroke Statistics Subcommittee. Circulation 113(6):e85–e151, 2006. [DOI] [PubMed] [Google Scholar]
- 43.Tibayan FA, Rodriguez F, Zasio MK, Bailey L, Liang D, Daughters GT, Langer F, Ingels NB, and Miller DC. Geometric distortions of the mitral valvular-ventricular complex in chronic ischemic mitral regurgitation. Circulation 108(10 suppl 1):II-116–II-121, 2003. [DOI] [PubMed] [Google Scholar]
- 44.Watanabe N, Ogasawara Y, Yamaura Y, Wada N, Kawamoto T, Toyota E, Akasaka T, and Yoshida K. Mitral annulus flattens in ischemic mitral regurgitation: geometric differences between inferior and anterior myocardial infarction a real-time 3-dimensional echocardiographic study. Circulation 112(9 suppl):I-458–I-462, 2005. [DOI] [PubMed] [Google Scholar]
- 45.Wilcken D, and Hickey AJ. Lifetime risk for patients with mitral valve prolapse of developing severe valve regurgitation requiring surgery. Circulation 78(1):10–14, 1988. [DOI] [PubMed] [Google Scholar]
- 46.Yiu SF, Enriquez-Sarano M, Tribouilloy C, Seward JB, and Tajik AJ. Determinants of the degree of functional mitral regurgitation in patients with systolic left ventricular dysfunction: a quantitative clinical study. Circulation 102(12):1400–1406, 2000. [DOI] [PubMed] [Google Scholar]
- 47.Yun KL, Sintek CF, Miller DC, Schuyler GT, Fletcher AD, Pfeffer TA, Kochamba GS, Khonsari S, and Zile MR. Randomized trial of partial versus complete chordal preservation methods of mitral valve replacement a preliminary report. Circulation 100(suppl 2):II-90–II-94, 1999. [DOI] [PubMed] [Google Scholar]


