. 2020 Mar 6;9:e53868. doi: 10.7554/eLife.53868

Figure 5. RNA-guided Sleeping Beauty transposition in human cells.

(A) Schematic representation of the analysis of SB retargeting. Targeting windows are defined as DNA extending a certain number of base pairs upstream or downstream of the sgRNA target sites (yellow – sgRNA target, green – ‘hit’ insertion, red – ‘miss’ insertion). (B) Percentages of integrations recovered from windows of different sizes along with the total numbers of integrations in the respective libraries. (C) Insertion frequencies relative to a dataset obtained with sgL1-1, in windows of various sizes around the targeted sites. Slight enrichment can be observed in a 200 bp window with dCas9-N57 and in a 500 bp window with dCas9-SB100X, although neither enrichment is statistically significant. The windows are cumulative, that is the 500 bp window also includes insertions from the 200 bp window. (D) Insertion frequencies in windows of various sizes, relative to a dataset obtained with sgL1-1, upstream and downstream of the target sites. Enrichment with dCas9-SB100X occurs downstream of the sgRNA target site, within a total insertion window of 300 bp (~1.5 fold enrichment, p=0.019). (E) The effect of the number of mismatches on the targeting efficiency of dCas9-SB100X. Relative insertion frequencies of the dCas9-SB100X sample into cumulative windows around perfectly matched target sites as well as sites with a single mismatch.

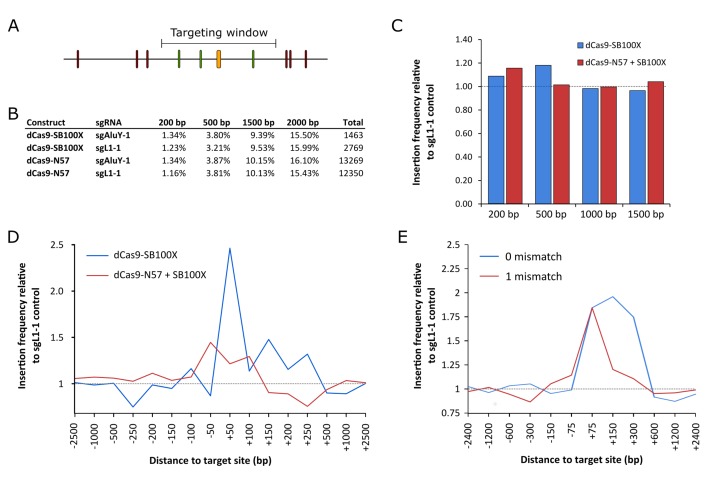
Figure 5—source data 1. Sleeping Beauty transposon integration sites obtained with dCas9-N57+SB100X and sgAluY-1.
Figure 5—source data 2. Sleeping Beauty transposon integration sites obtained with dCas9-N57+SB100X and sgL1-1.
Figure 5—source data 3. Sleeping Beauty transposon integration sites obtained with dCas9-SB100X and sgAluY-1.
Figure 5—source data 4. Sleeping Beauty transposon integration sites obtained with dCas9-SB100X and sgL1-1.

Figure 5.

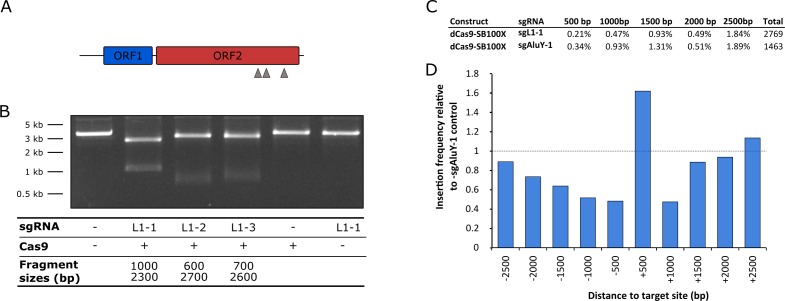
Figure 5—figure supplement 1. Design, in vitro validation and impact of sgRNAs against human L1 retrotransposon sequences.

Figure 5—figure supplement 1.

(A) Schematic representation of the human L1 retrotransposon and relative positions of the sgRNA binding sites. (B) In vitro digestion of a ~ 3.3 kb plasmid fragment carrying the target sites of sgRNAs with purified Cas9 and the three L1-specific sgRNAs. All three sgRNAs resulted in digestion of the input DNA and the resulting fragments’ relative sizes match the expected values. (C) Fractions of insertions into cumulative windows around sgL1-1 target sites. (D) Relative insertion frequencies of SB in the presence of sgL1-1 as compared to insertion frequencies of SB in the presence of sgAlu-1. An overall depletion of insertions and some enrichment in a 500 bp window downstream of the sgL1-1 binding sites is apparent. However, these ratios are based on only a few insertions falling into the mapping windows, and therefore lack statistical significance.