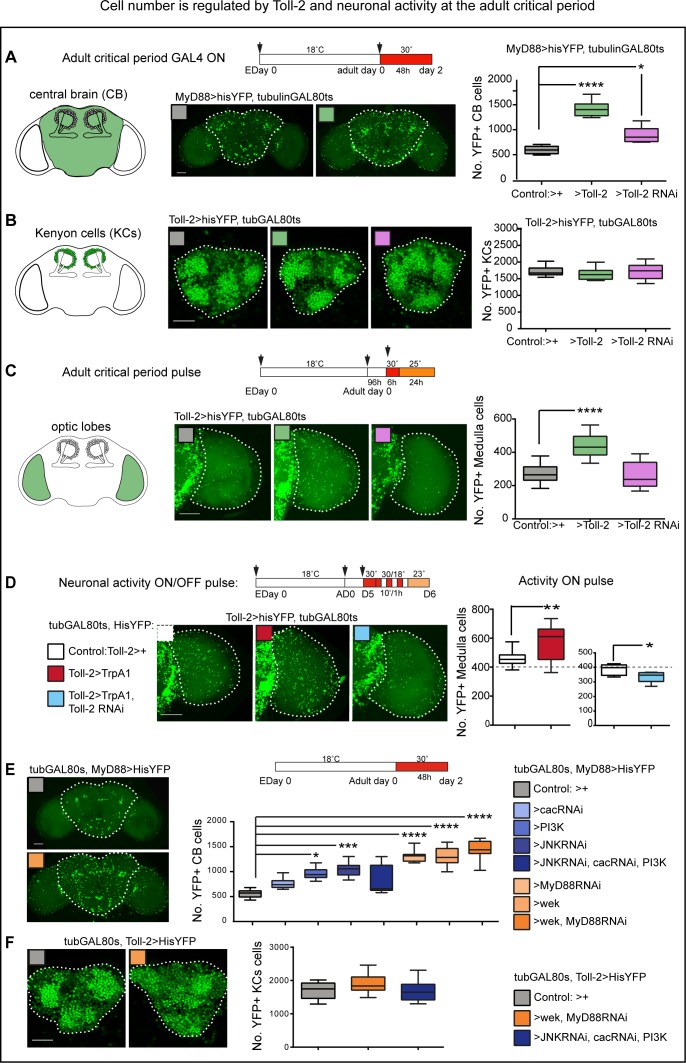
Figure 4. Cell number is regulated by Toll-2 and neuronal activity at the adult critical period.
At adult days 0–2 post-eclosion, within the critical period: (A) Conditional over-expression of Toll-2 increased MyD88 >hisYFP+ cell number in the central brain. Cells were counted automatically in 3D throughout the whole stack with DeadEasy Central Brain, dashed line in all figures indicates ROI quantified. Box-plots, Kruskal-Wallis p<0.0001, post-hoc Dunn test; (B) neither conditional over-expression nor knock-down of Toll-2, altered Toll-2 >hisYFP+ Kenyon cell number, counted automatically with DeadEasy Kenyon Cells, box-plots; (C) conditional over-expression of Toll-2 increased Toll-2 >hisYFP+ cell number in the optic lobe medulla, counted automatically with DeadEasy Optic Lobe. Box-plots, One Way ANOVA p<0.0001, post-hoc Dunnett; (D) pulses of neuronal activation with TrpA1 increased Toll-2 >hisYFP+ cell number in the medulla, and this could be rescued with Toll-2 RNAi knock-down. Box-plots: Left: Un-paired Student t-test, p=0.0058; Right: Un-paired Student t-test, p=0.0225. (E) Knocking-down JNK and cactus and over-expressing activated PI3K (UAS-Dp110CAAX), alone or in combination, in MyD88+ cells with tubGAL80ts, MyD88GAL4 increased cell number in the central brain, consistent with pro-survival signalling downstream of Toll-2. However, over-expressing either wek or MyD88 RNAi knock-down increased cell number in the central brain, and even further in combination, suggesting that Wek also has non-apoptotic functions that antagonise MyD88. Box-plots, Kruskal-Wallis ANOVA p<0.0001, post-hoc Dunn test. (F) By contrast, no statistically significant changes were detected in KCs upon manipulation of any of these downstream effectors, although a mild increase in cell number was observed with UAS-wek, UASMyD88RNAi. Box-plots, One Way ANOVA p=0.0354, post-hoc Dunnett. Dashed lines indicate regions of interest (ROI) for automatic cell counting with DeadEasy. Scale bars: A,C,D,E:50 μm; B,F:25 μm. For genotypes, sample sizes and statistical details, see Supplementary file 2. *p<0.05; **p<0.01; ***p<0.001; ****p<0.0001. See Figure 4—figure supplement 1.


