

Abstract
This study aimed to characterize the impact of dietary copper on the biochemical and hepatic metabolite changes associated with fructose toxicity in a Wistar rat model of fructose-induced liver disease. Twenty-four male and twenty-four female, 6-weeks old, Wister rats were separated into four experimental dietary treatment groups (6 males and 6 females per group) as follows: (1) A control diet: containing no fructose with adequate copper (i.e., CuA/0% Fruct); (2) a diet regime identical to the control and supplemented with 30% w/v fructose in the animals’ drinking water (CuA/30% Fruct); (3) a diet identical to the control diet but deficient in copper content (CuD/0% Fruct); and (4) a diet identical to the control diet but deficient in copper content and supplemented with 30% w/v fructose in the drinking water (CuD/30% Fruct). The animals were fed the four diet regimens for five weeks, followed by euthanization and assessment of histology, elemental profiles and identification and quantitation of liver metabolites. Results from 1H NMR metabolomics revealed mechanistic insights into copper modulation of fructose hepatotoxicity through identification of distinct metabolic phenotypes that were highly correlated with diet and sex. This study also identified previously unknown sex-specific responses to both fructose supplementation and restricted copper intake, while the presence of adequate dietary copper promoted most pronounced fructose-induced metabolite changes.
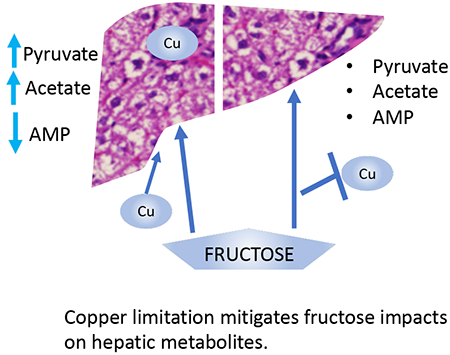
Graphical Abstract
1. Introduction:
Diet plays a crucial role in human health, disease prevention and treatment. It is increasingly clear that consumption of excess sugars, including fructose, is detrimental to health through direct effects on physiological functions, as well as through its influence on the homeostasis of essential nutrients such as copper (Cu). More than half of adults in the United States exceed recommended sugar intake [1]. While excess fructose consumption, in its monosaccharide form as well as in the sucrose disaccharide form, is widespread in the Western diet, the impact and potentially synergistic effects of trace micronutrients, such as Cu, has received little attention in liver disease pathogenesis. Cu is important in reactive oxygen species (ROS) detoxification processes, as well as in the regulation of both hepatic inflammation and lipid metabolism [2,3]. Although the average Cu consumption is slightly above the U.S. recommended daily intake (RDI), more than 25% of US adults fail to meet daily Cu intake recommendations [3]. These data are of concern, as both fructose and Cu are important nutrients that influence lipid metabolism, inflammatory responses, and insulin resistance [5–7]. Fructose consumption increases metabolic burden and subsequent oxidative stress in hepatocytes, promotes de novo lipogenesis and inflammation, and has been positively correlated with fibrosis severity in NAFUD patients [8–10]. An inverse correlation between hepatic steatosis and hepatic Cu levels has also been reported [11], while dietary fructose intake appears to exacerbate Cu deficiency (CuD). These data suggest that the pathological effects of a diet high in fructose and low in Cu may be additive. However, it has also been reported that the relationship between low Cu and liver steatosis is masked in patients with metabolic syndrome (MetS), suggesting a complex interplay between these factors [12].
NAFLD impacts individuals in both developed and developing countries, and is predicted to reach pandemic proportions in the next few decades [13]. Due to increases in worldwide rates of NAFLD and its potential progression to more serious hepatic diseases, including non-alcoholic steatohepatitis (NASH) or hepatocellular carcinoma (HCC), NAFLD is a major threat to public health [14]. NAFLD is defined as excessive hepatic fat deposition (steatosis) that arises when hepatic fatty acid availability, from both plasma and de novo triglyceride synthesis, exceeds hepatic fatty acid clearance via beta-oxidation and triglyceride export [9]. Hepatic steatosis is therefore the result of wide-ranging systemic imbalances between complex biochemical pathways involving lipid metabolism, glucose homeostasis, carbohydrate metabolism, systemic lipoprotein transport, and metabolite flow through distinct cellular pathways [15]. Recent findings suggest that NAFLD is a multifactorial disease arising from complex factors such as genetics, nutrition, and lifestyle [16,17]. While being the most prevalent liver disease in the United States, specific metabolic mechanisms and molecular parameters that promote NAFLD progression to more severe phenotypes of the disease are largely unknown, although age, type 2 diabetes, metabolic syndrome (MetS) and hypertension are major risk factors [18]. The prominence of liver dysfunction, NAFLD, and emerging roles for Cu and fructose in liver pathology have thus motivated the present study.
Animal models provide valuable insights into physiological and pathological responses to specific nutrients, including the interactions between fructose and Cu [5,10,19]. Reported studies indicate that diets high in sugars and low in Cu increase expression of characteristic molecular markers associated with oxidative stress, dysregulation of metabolic homeostasis, and specific hepatic pathologies. These markers are often associated with both NAFLD and metabolic syndrome (MetS) [5,10]. Previous studies, however, focused only on male animals that were fed fructose in addition to high sucrose-purified diets [5,19,20], and overall, very few studies have examined differences between male and female responses to NAFLD pathogenicity. Sex has thus been historically overlooked as a biological variable, but is suspected to significantly influence NAFLD progression, as regulation and response to metabolic burden, lipoprotein metabolism, Cu homeostasis and antioxidant capacity are all influenced by sex [18–22]. These observations are further supported by clinical data that report a higher prevalence of NAFLD in men, while NAFLD progression to NASH is higher in women over 50 compared to men of the same age group [26–28].
Herein, we investigated how Cu modulates the hepatotoxic effects of excess fructose consumption in a rat animal model with an emphasis on changes in metabolite profiles. We observed sex-specific and sex-independent responses that highlight critical cellular pathways through which dietary fructose consumption and Cu impact physiology. We find that diets high in fructose and adequate in Cu promote NAFLD-like pathologies and cause significant hepatic metabolic changes. Most notably, we find that insufficient dietary Cu intake partially attenuates the metabolic profile changes induced by fructose in our model. In addition, we find that dietary fructose impacts hepatic and circulating Cu levels in males, but not female rats, revealing a sex-specific Cu response. Lastly, we find that fructose intake generates distinct Cu-dependent and sex-specific changes in metabolic profiles (i.e., metabotypes), which illustrate physiological responses to diet in this rat animal model.
2. Materials and Methods
2.1. Animals and diet study.
Animal experiments were conducted in compliance with national and local guidelines of the US Public Health Service Policy, as documented by The Guide for the Care and Use of Laboratory Animals, Eighth Edition, and the University of Alaska Anchorage (UAA) Institutional Animal Care and Use Committee policy under assurance #A3710-01. Twenty-four female and twenty-four male, six-week-old, Wistar rats were separated into four diet treatment groups (6 female and 6 male rats per group), respectively, and housed at 20°C with a 12 hrs light / 12 hrs dark cycle in a common area in wire-top cages. All groups were fed ad libitium. Diets were based on a modified AIN93G [29] formulation that correspond, with respect to macronutrients, to approximately an average Western diet [30] (see Supplementary Table S1). These formulations included diets containing 12.0 mg/kg Cu, which represented a Cu adequate diet (CuA), or contained less than <0.2 mg/kg Cu content, which amounted to a Cu deficient diet (CuD). In addition to these two dietary formulations, either plain water or 30% weight/volume (w/v) fructose in water was provided ad libitium for a period of five weeks, resulting in the following four diet intervention groups: CuA/0%Fruct. (Cu Adequate and 0% w/v (i.e. no) fructose (control diet)), CuA/30%Fruct. (Cu Adequate and 30% w/v fructose), CuD/0%Fruct. (Cu deficient and 0% w/v fructose), and CuD/30%Fruct. (Cu deficient and 30% w/v fructose). Within five weeks of diet regimen, 30% fructose was sufficient to induce deleterious physiological traits in liver pathology, consistent with other short-term exposure studies [5]. Fructose supplementation allometrically scales to the equivalent of 452g per day for a 65kg human (i.e., Rat Weight 0.35kg, 9g fructose per day (30ml @30%) or slightly over 50% of a 3,000/day calorie human diet). This regimen amounted to a human intake of approximately 6.4 L of high-fructose corn syrup sweetened beverages, taking into consideration that these beverages contain 60-70 g/L fructose [31].
After 5 weeks of diet intervention, food was withdrawn for 16 hours prior to euthanization by CO2 asphyxiation, and subsequent collection of liver tissue, serum, and plasma from whole blood. To sustain a fructose-exposed metabolic state, animals that received fructose in their water were maintained on that regimen during the 16 hours prior to euthanization. One lobe of the liver was subsequently fixed in 10% formalin in phosphate buffered saline (PBS) solution and used for histological analysis, while the remaining hepatic tissue was flash frozen in liquid nitrogen and stored in a −80C freezer until further use for NMR metabolomics experiments, Western blotting, elemental analysis, or enzymatic activity assays.
2.2. Histology:
Hepatic tissue was fixed in 10% formalin solution for 48 hours. Tissue was post-fixed in sucrose, paraffin-embedded, and sectioned at 5-micron thickness. Samples were stained in Pinnacle Portfolio Hematoxylin Stain+ and Pinnacle Portfolio Eosin-Y Stain (Fisher Healthcare™) following a modified Tissue Tech DRS 2000 H&E procedure. Images were captured using an Olympus FSX-100 microscope at 40x magnification. Assessment of tissue pathology severity was conducted by 3 different individual assessors using a modified NAFLD Activity Score (NAS) scoring system (n=5-6) [32]. NAS scoring was analyzed by ordinal logistic fit of fructose, Cu and sex (JMP Pro 13, SAS Institute, Cary, NC).
2.3. Elemental analysis of tissue and serum:
Approximately 30 mg of frozen homogenized liver tissue was dried at 37° C for 24 hours, and dry weights were recorded. Metal content of dry liver tissue was determined using inductively-coupled plasma mass spectroscopy (ICP-MS) by Dr. M. Ralle, at Oregon Health & Science University Metal Ion Core (Portland, OR, USA). Serum was diluted and analyzed directly using ICP-MS.
2.4. SSAO Activity:
semicarbizide-sensitive amine oxidase (SSAO) activity levels were quantified by Amplex Red Amine Oxidase Assay Ref # A12214 (Invitrogen) (N=6).
2.5. Ceruloplasmin (Cp) activity:
Ceruloplasmin activity was quantified using the Invitrogen Ceruloplasmin Colorimetric Activity Kit (Catalog number: EIACPLC) on a Biotek Synergy HT model plate reader (N=6). Colorimetric assays were read with a Biotek Synergy HT plate reader.
2.6. Quantitative Western Blots:
A fraction of the frozen homogenized hepatic tissue was extracted with RIPA buffer solution (50 mM Tris-HCl pH 8.0, 150 mM NaCl, 1% w/v NP-40, 0.5% Na-deoxycholate) at a 1:15 w/v ratio, by adding acid washed glass beads followed by vortex mixing and sonication. The resulting protein solution was diluted 1:5 in a 62.5 mM Tris-HCl pH 8.8, 3.5 M urea gel loading buffer. Gels were run for each target protein as described briefly below. Resulting Western blots were imaged using Pierce Supersignal West Dura chemiluminescent HRP substrate (Pierce Inc.) and a ProteinSimple HD2 imager. Western blot signal intensities were normalized to Coomassie Brilliant Blue total protein staining of the PVDF blot, and analyzed with ImageJ [34] following the protocol reported by Eaton et al [35].
2.6.1. Atp7b Quantitative Western blot:
Diluted protein solution was loaded onto 7% polyacrylamide Tris-Glycine gels. Gels were run at 120V for 1.6 hours. Proteins were transferred to PVDF in a Towbin buffer (192 mM Tris, 25 mM glycine, 20% methanol) at 100v/400amp for 60 minutes. Western blot reactions were blocked at 4° C in 5% nonfat dry milk/TBS-T for 1 hour, followed by immunodetection as follows: primary antibody rabbit anti-ATP7B #ab124973 (Abcam) was used at a 1:2500 dilution in TBS-T for 16 hours; secondary antibody HRP conjugated goat anti-rabbit Ref# 12-348 (Millipore) at 1:20,000 dilution for 2 hours (n=4).
2.6.2. Ctr1 quantitative Western blot:
Diluted protein solution was loaded into 12.5% polyacrylamide gels and run at 120V for 1.6 hours. Gels were then transferred to PVDF in Towbin buffer at 100v/400amp for 1 hour. Western blots were incubated at 4° C in 5% nonfat dry milk/TBS-T for 1 hour, followed by immunodetection as follows: primary rabbit anti-CTR1 Ref# NB-100-402 (Novus Inc.) was used at a 1:3500 dilution in TBS-T for 16 hours; secondary antibody HRP conjugated goat anti-rabbit Ref# 12-348 (Millipore) at 1:20,000 dilution for 2 hours (n=4).
2.6.3. Complex IV Quantitative Western blot:
Diluted protein solution was loaded into 7% polyacrylamide gels, which were run at 120V for 1.6 hours. Gels were then transferred to PVDF in Towbin (20% methanol) at 100v/400amp for 1 hour. Western blots were incubated at 4° C in 5% nonfat dry milk/TBS-T for 1 hour, followed by immunodetection as follows: primary antibody rabbit anti-Complex IV Ref # A21348 (Invitrogen) was used at a 1:2500 dilution in TBS-T for 16 hours; secondary antibody HRP conjugated goat anti-rabbit Ref# 12-348 (Millipore) at 1:20,000 dilution for 2 hours (n=6).
2.6.4. Statistical analysis of targeted variables.
Elemental analysis, enzyme activities and quantitative Western blot data were analyzed by one-way ANOVA and Dunnett’s multiple comparison to control (CuA/0% Fruct) to compare diets. Two-way ANOVA was used to detect independent and interacting effects of Cu and/or fructose on the target analyte (dependent variable). Effects of Cu, fructose or interaction of independent variables are reported where significant. JMP Pro 13 (SAS Institute, Cary, NC) was used for these analyses.
2.7. Sample preparation and untargeted 1H NMR metabolomics analysis
2.7.1. Liver Tissue Homogenization:
70 mg of frozen liver tissue from 12 females and 12 male rats (3 per diet intervention group) each were used for untargeted 1H NMR metabolomics studies, which were conducted at Montana State University. Hepatic tissue was carefully weighed, thoroughly homogenized, and the resulting tissue powder transferred into 25 ml vials and stored at −80°C until further use.
2.7.2. Metabolite Extraction:
Frozen and homogenized hepatic tissue samples were transferred into 2 mL Eppendorf tubes and 900 μl of an ice cold 1:2 (v/v) methanol (MeOH) to chloroform (CHCl3) solution were added. Resulting samples were placed in an MP Biomedicals FastPrep-24 5G bead beater/vortexer and shaken continuously for 45 sec at a speed of 6.0 m/s. Subsequently, samples were removed, placed on ice, and an additional aliquot of 120 μl of cold deionized water was added to each sample tube. Two additional 45 sec vortexing cycles were repeated with 5 min rests between cycles. The solutions were then stored at −20°C for 1 hour to allow insoluble tissue and protein debris to precipitate out of solution. The samples were subsequently centrifuged (14,000 rpm, 10 min, 4°C), and the aqueous upper phase (250 μl volume) transferred into new 1.5 ml microcentrifuge tubes, followed by drying using a speed vacuum concentrator overnight with no heat. Dried metabolite samples were stored at −80°C until further use for 1H NMR metabolomics experiments.
2.7.3. NMR Analysis
Dried metabolite samples were re-suspended in 600 μl of NMR buffer, consisting of 0.25 mM 4,4-dimethyl-4-silapentane-1-sulfonic acid (DSS) in 90%H2O/10% D2O, 25 mM sodium phosphate, pH 7, and transferred into 5 mm NMR tubes. All one dimensional (1D) 1H NMR spectra were recorded at 298 K on MSU’s Bruker AVANCE III solution NMR spectrometer operating at 600.13 MHz (1H Larmor frequency) magnetic field strength, equipped with a 5 mm liquid-helium-cooled TCI cryoprobe with Z-gradient and a SampleJet automatic sample loading system. NMR data were acquired using the Bruker-supplied 1d excitation sculpting water suppression pulse sequence ‘zgesgp’ with 256 scans, a 1H spectral window of 9600 Hz, 32K data points, a dwell time interval of 52 μsec between data point collection, and a recovery (D1) delay of 5 sec between acquisitions. Extracted metabolite mixtures were run on the NMR spectrometer in triplicate to monitor data reproducibility. The resulting NMR spectra were processed using the Bruker TOPSPIN 3.5 software and standard parameters for chemical shift referencing and applying an exponential multiplication (EM) line broadening function of 0.3 Hz. Subsequently, the NMR spectra were phased manually and a qfil polynomial function (0.2 ppm in width) was applied to subtract the residual 1H water signal. The DSS (0.25 mM), added to each sample, was used as an internal standard for metabolite quantification, and the 1H NMR signals arising from imidazole were used to correct for small chemical shift changes due to slight sample pH variations. Metabolites were identified and quantified by fitting the 1D 1H spectral patterns, chemical shifts, and spectral intensities to reference spectral patterns of small molecules using Chenomx v8.3 [36] (Chenomx Inc., Edmonton, AB, Canada), following protocols described in [37], and using Chenomx small molecule spectral database for 600 MHz NMR spectrometers (Supplementary Figure S2).
Validation of metabolite IDs, which were annotated in Chenomx, was accomplished using 2D 1H-1H total correlation spectroscopy (TOCSY) NMR or by spiking, when available, pure metabolite standards into the samples and monitoring resulting spectral changes in the 1D 1H NMR spectra. The 2D 1H-1H TOCSY spectra were acquired for representative samples using the Bruker-supplied ‘mlevphpr.2/mlevgpph19’ pulse sequences (256 × 2048 data points, 2 s relaxation delay, 32 transients per FID. 1H spectral window of 6602.11 Hz, 80 ms TOCSY spin lock mixing period). 2D 1H-1H TOCSY spectra were processed using Topspin software (Bruker version 3.2).
2.7.4. NMR metabolomics Statistical Analysis
Resulting lists of identified metabolites and metabolite concentrations normalized to weight of liver tissue were uploaded to MetaboAnalyst 4.0 [38] for univariate and multivariate statistical analysis of the data. In MetaboAnalyst, metabolite concentrations were log-transformed and normalized using auto-scaling, i.e., mean centered values were divided by the standard deviation of each variable, prior to univariate and multivariate analysis. ANOVA and 2D principal component analysis (2D-PCA) were performed to identify metabolite profiles that may separate the different animal groups according to diet and sex differences. For hierarchal clustering analysis (HCA), distances were measured using a Euclidean correlation and Ward clustering algorithm. Metabolites, whose concentration changes contributed most to separation of the different diet groups, were identified, and their significance, selected based on t-test or ANOVA, was used to generate heatmap graphical representations of metabolite differences between the different diet treatment groups. Metabolites with significant concentration changes (p-values <0.05) between diet and sex groups were selected for analysis of impacted metabolic pathways, using the metabolic pathway impact module of MetaboAnalyst 4.0. This analysis highlighted important differences in specific metabolic pathway usage between the different animal groups that were subjected to the different diet regimens, and between male and female animal groups. For metabolic pathway impact analyses, the Rattus norvegicus (rat) pathway library was selected as the most relevant [38].
3. Results
3.1. Dietary fructose supplementation and dietary Cu restriction promote NAFLD-like hepatic pathologies
Histological examination of H&E stained specimens revealed increased micro- and macro-vesicular steatosis in all diet treatment groups compared to animals on the control diet. High fructose consumption, coupled with an adequate Cu intake (i.e., the CuA/30%Fruct diet), led to the most severe hepatic pathology observed for both male and female animals. Pathological features in addition to micro- and macro-vesicular steatosis included hepatocyte ballooning, lobular inflammation, and Mallory-Denke bodies (Figure 1). Blinded NAS scale histological scoring indicated a greater number of males than females with any pathology (15 vs. 10, respectively). (Supplementary Table S3, and statistical analysis below). Overall, males displayed increased extent of steatosis, with 50% of males having >5% steatosis and only ~35% of females having >5% steatosis. Steatosis in males was also graded as more severe (>33% steatosis), with ~ 21% of males and only ~9% of females exhibiting this phenotype. The CuA/30% Fruct diet group presented the highest grade of steatosis, followed by the inadequate Cu-high fructose (CuD/30% Fruct) diet group, for both male and female animals. Males in the inadequate Cu and no fructose (CuD/0% Fruct) diet group exhibited minimal steatosis, but within that category, displayed more steatosis than diet-matched (i.e., CuD/ 0%Fruct) females (Figure 1). Mallory-Denke body formation was graded “most severe” (i.e., “many Mallory-Denke bodies”) in 2/6 of the males fed the CuA-30% Fruct diet, and 1/6 of the males fed the CuD-30% Fruct diet, while no females of any diet group presented steatosis graded as “most severe”. Logistic fit of the ordinal NAS scores for fructose, Cu and sex resulted in a chi-square test statistic of 20.775 and probability of a value greater than chi-square by chance (Prob>ChiSq) of 0.0041, indicating these factors influence NAS score and pathology. Fructose had the greatest influence (Prob>ChiSq <0.0001), while sex was a significant factor (Prob>ChiSq = 0.0413). Disaggregating by sex for the same test suggested fructose, but not Cu, was a significant factor in pathology for both male and female rats. Prob>ChiSq for fructose was 0.0010 for female and 0.0117 for male rats. These results suggest fructose influences pathology in both male and female rats.
Figure 1 -. Pathologies consistent with NAFLD were induced by high fructose and/or low copper diets in this animal rat model.
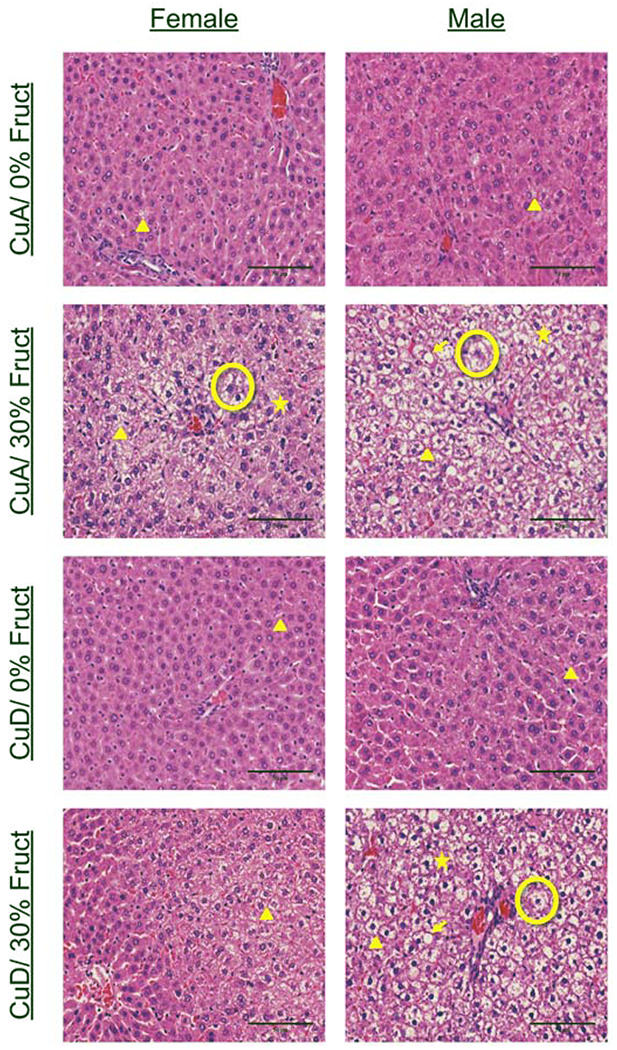
Representative H&E staining of liver tissue sections from all sexes and dietary groups. Features are marked as indicated: Triangle-microvesicular steatosis Arrow-macrovesicular steatosis Circle-ballooning hepatocyte Star- Mallory-Denke body. Pathologies consistent with NAFLD were observed in 30% CuA, 30% CuD, and 0% CuD diets, with the most severe pathologies being observed in 30% CuA groups. Pathological features such as hepatocyte ballooning, inflammation, and Mallory-Denke bodies were most common in the male 30% CuA group.
Males gained approximately 50-80g over the feeding period, while females gained 0-30g. No significant differences were observed in total weight or percentage of weight gain between any of the dietary groups of female or male animals. These results indicate that sex differences, fructose consumption, and dietary Cu all impact liver pathology, even in the absence of substantial weight gain or obesity.
3.1. Both dietary fructose and dietary Cu influence serum Cu levels in male, but not female rats.
Male but not female rats displayed a significant decrease in serum Cu levels when dietary Cu was limited, with 2-way analysis of variance (ANOVA) indicating effects of Cu (P<0.001) and interaction between Cu and fructose (P<0.001), while the effect of fructose independently was not significant (P=0.0637) (Figure 2A). Multiple comparisons by Dunnett’s (alpha 0.01) analysis indicated no significant differences between groups of female rats fed diets with altered Cu or fructose compared to the control (CuA/0% Fruct). However, 2-way analysis of variance (ANOVA) indicated effects of Cu (P<0.0262) and interaction between Cu and fructose (P<0.0323), while the effect of fructose independently was not significant (P=0.8794) (Figure 2A). Male rats fed the CuA/30% Fruct diet had increased serum Mo, while males fed the CuD/0% Fruct or CuD/30% Fruct displayed no significant difference in serum Mo levels compared to the control animals, 2-way ANOVA indicated independent effects of fructose (P=0.0069) and fructose interaction with Cu (P=0.0135) (Figure 2B). Female rats had higher serum levels of Cu, Fe, Mo and Zn compared males for all dietary groups (Supplementary Table S4).
Figure 2 – Dietary fructose and copper levels influence hepatic and serum bio-metals (ppb) for all dietary groups and sexes (n=6).
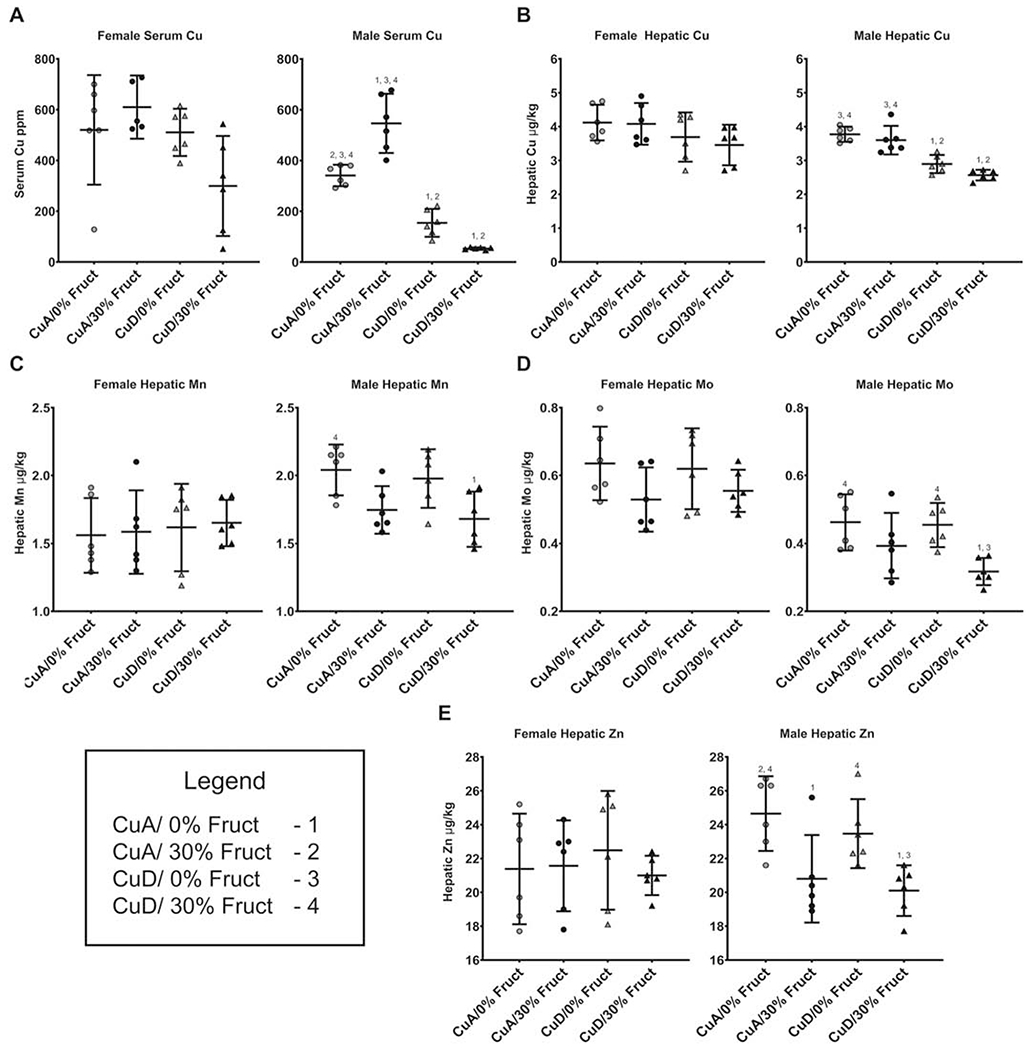
Numbers (1-4) indicate groups with means significantly different from the labeled group.
A) Male rats displayed significant differences (P<0.005) in serum Cu between all dietary groups, except between the 30% CuD (mean=52.933 ppb) and 0% CuD (mean=154.382 ppb) groups (P=0.059). Female rats had no difference in circulating Cu levels between any of the dietary groups.
B) Hepatic Cu levels were changed (P<0.005) in male rats by low dietary copper, while females displayed no change in hepatic Cu levels in response to either dietary fructose or copper.
C) Serum Mo levels in males were significantly lower (P<0.05) in the 30% CuD group when compared to both non-supplemented groups. Changes in fructose and/or Cu did not induce changes in circulating Mo in female rats.
D) Hepatic Mo levels in males were significantly lower (P<0.01) in the 30% CuD group when compared to both non-supplemented groups paralleling circulating Mo levels. No difference was seen between any of the female groups hepatic Mo levels.
E) Hepatic Zn increased in male rats fed excess fructose (P < 0.05), while Zn was not impacted by dietary Cu. The male 0% CuA group had significantly higher hepatic zinc when compared to the 30% CuD group. Female rats displayed no major changes to hepatic Zn in response to dietary treatments.
Diet treatments induced no significant change in serum levels of Ca, Fe, K, Mg, Mn or Zn in either males or females (Supplementary Table S4). These results indicate that changes in dietary Cu content, i.e. a shift from CuA to CuD diets with or without fructose, lead to sex-specific changes in circulating levels of transition metals, and that Cu dietary Cu and excess fructose may interact to influence serum metal levels. The new observation in this work is that excess fructose in the presence of adequate Cu (CuA/30% Fruct) leads to a significant increase in serum Cu levels in male but not female animals, suggesting the presence of a Cu-mobilization response to fructose toxicity that is more apparent in male rats than in female rats.
3.3. Dietary Cu restriction suppresses hepatic Cu levels in male, but not female rats.
Elemental analysis of liver tissue revealed a significant decrease (Dunnet’s p<0.05) in hepatic Cu in male rats that were fed CuD diets compared to those provided with adequate Cu (CuA). Two-way ANOVA indicated that Cu (P<0.001) and fructose (P=0.0351) independently influenced hepatic Cu in male rats, but no fructose-Cu interaction was detected (P=0.4930). No significant difference in hepatic Cu content was observed between any of the female dietary groups, although females had approximately ~ 0.6 μg/kg more hepatic Cu than males when fed either CuA or CuD diets (Supplementary Table S5). The lowest average hepatic Cu level was observed in the CuD/30% Fruct dietary groups for both males and females. Together, these findings indicate that the amount of dietary Cu intake significantly impacts hepatic Cu content in male rats, but not in females, and that dietary fructose influences hepatic Cu levels in males.
3.4. Fructose consumption suppresses hepatic manganese, molybdenum and zinc levels in male but not female rats.
Elemental analysis revealed differences (Dunnett’s P<0.05) in male hepatic levels of Mn, Mo and Zn, where significantly lower levels of these metals were present in animals fed the high fructose diets (i.e., CuA/30% Fruct and CuD/30% Fruct) compared to those on the control (CuA/0% Fruct) diet (Figure 2C–E). Two-way ANOVA did not detect interaction between fructose and Cu, but confirmed independent effects of fructose on hepatic Zn. Diet composition did not significantly impact (P>0.05) hepatic levels of Mn, Mo or Zn in female animals (Figure 2C–E). However, females subject to the CuD/30% Fruct diet presented significantly (p<0.05) elevated hepatic potassium (K) levels, compared to females on the control CuA/0% Fruct diet (Supplementary Table S5). No differences in hepatic Ca or Fe levels were observed for either males or females that were on the CuD/0% Fruct or CuD/30% Fruct diets.
3.5. Serum ceruloplasmin activity is influenced by dietary fructose or Cu limitation while cytochrome C oxidase and semicarbazide-sensitive amine oxidase are not impacted.
The activity of the Cu-dependent enzymes ceruloplasmin (Cp) and semicarbazide-sensitive amine oxidase (SSAO) was measured to assess the impact of dietary Cu and fructose intake on the level and activity of circulating Cu-requiring proteins. SSAO was recently identified in control of adipocyte size and may be important in metabolic syndrome [39] Serum Cp activity was analyzed as a measure of global Cu status and was significantly altered by both dietary Cu and fructose in males, i.e., male rats fed the CuD/30% Fruct diet (Figure 3A). Two-way ANOVA indicated significant effects of Cu (P<0.001) and fructose (P=0.0066), but no significant interaction (P=0.2711). A significant decrease in Cp activity was also observed in the female rats on the CuD/30% Fruct diet, and this Cp activity was markedly lower than that observed for females on either a CuA/30% Fruct or the CuD/0%Fruct diet (Figure 3A). Two-way ANOVA indicated no significant effects of Cu or fructose independently, but a significant Cu-fructose interaction was observed (P=0.0121); females exhibited higher overall serum Cp activity compared to diet-matched male groups (Figure 3A).
Figure 3: Diet induces significant differences in key copper protein levels.
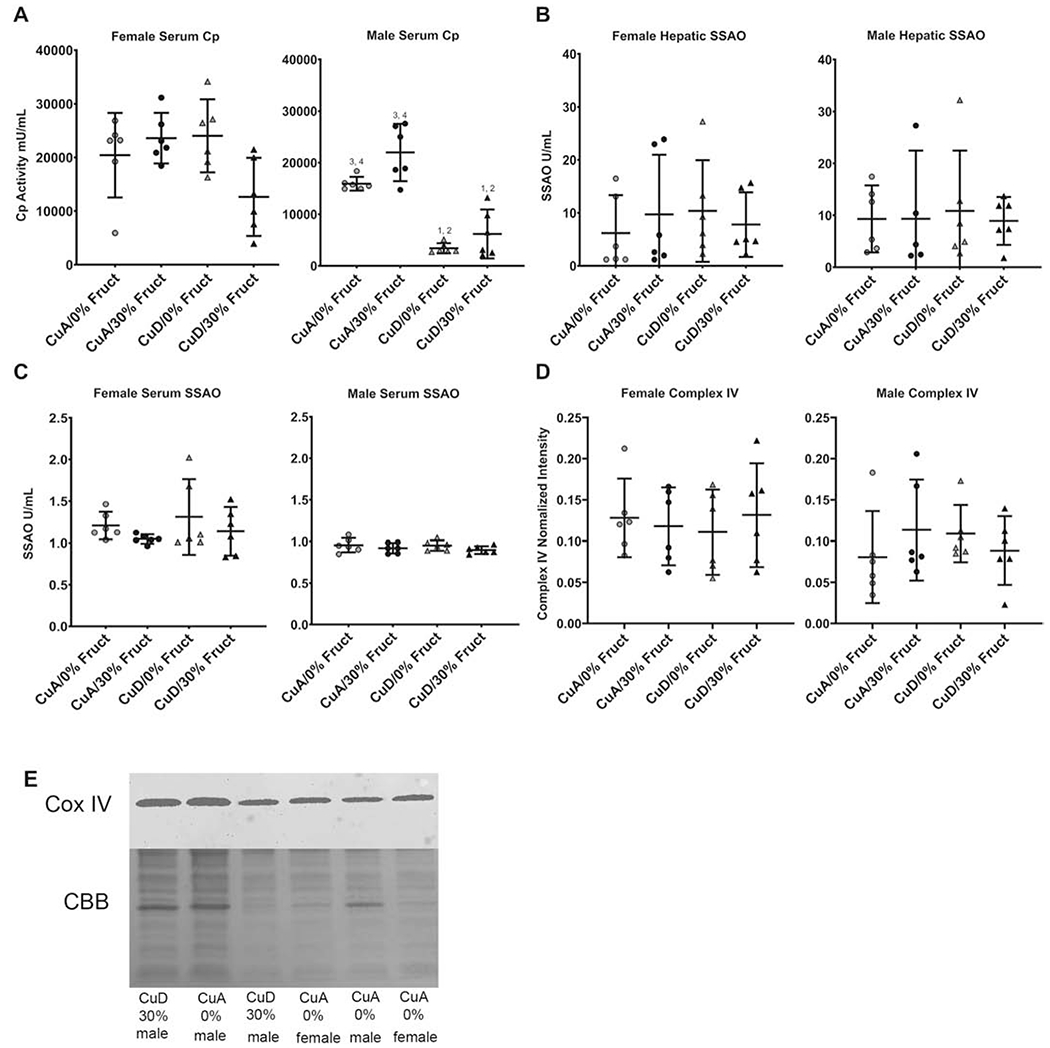
Numbers (1-4, as in Figure 2) indicate groups with means significantly different from the labeled group.
A) Serum ceruloplasmin activity in male and female rats fed indicated diets. Ceruloplasmin activity was decreased in male, but not female rats fed Cu deficient diets.
B) Hepatic SSAO activity was determined in homogenized liver tissue (n=6). No differences between dietary groups were observed in males or females. Males on average had higher hepatic SSAO activity, except in the 30% CuA group were females had higher SSAO activity.
C) Circulating SSAO activity was determined in serum (n=6). No differences between dietary groups were observed in males or females. Females on average had slightly higher circulating SSAO activity when compared to males.
D) Mitochondrial Complex IV abundance as determined by quantitative western blot (n=6). No differences in Complex IV quantity were observed across male and female models in any dietary treatment groups.
E) Representative Western blot and immunodetection for Complex IV. Coomassie brilliant blue image of blot (CBB) was used for normalization.
In contrast, diet did not significantly impact serum SSAO enzyme activity, while females had overall higher SSAO activity levels compared to diet-matched males. No differences were observed between female and male hepatic SSAO activity levels, while circulating SSAO activity measurements varied less than those of hepatic SSAO activity for all sexes and dietary groups (Figure 3B).
Neither dietary fructose supplementation (30% Fruct) or dietary Cu restriction (CuD) had any influence on hepatic mitochondrial complex IV/ cytochrome C oxidase enzyme levels, suggesting that sufficient levels of mitochondrial Cu were maintained despite changes in total hepatic or circulating Cu levels (Figure 3C).
3.6. Dietary fructose induces increased hepatic Atp7b abundance in male rats when Cu is adequate.
Changes in serum and liver Cu levels and circulating Cp enzyme activity suggested that hepatic Cu transporter levels might be altered by diet. The impacts of dietary Cu levels, in combination with high fructose (i.e., CuA or CuD/30% Fruct diets), on the relative abundance of the hepatic Cu importer Ctr1 and exporter Atp7b were determined. No changes in Ctr1 abundance were observed in response to diet for either sex while both sexes had similar levels of hepatic Ctr1 (Figure 4A). The Cu export protein Atp7b increased in abundance in the CuA/30% Fruct-fed male group compared to males on the control CuA/0% Fruct diet (Dunnett’s P<0.05). Moreover, males fed the CuD/30% Fruct diet had Atp7b protein levels comparable to those of the male control (CuA/0% Fruct diet) group (Figure 4B). Two-way analysis indicated interaction between Cu and fructose for male ATP7B abundance (P=0.0131). Changes in Atp7b protein abundance corresponded to increased serum and decreased hepatic Cu levels, as well as increased serum Cp levels, in male rats fed the CuA/30%Fruct diet (Figures 2A, B). This indicates that when male hepatic Cu levels are adequate, circulating Cp synthesis and hepatic export of Cu into the blood are favored, while fructose intake (i.e., as seen in animals subject to diet regimens containing 30% fructose) enhanced Cu transfer to Cp and Cu release into the bloodstream. When hepatic Cu levels are insufficient however, retention of hepatic Cu is preferred and Cu release into the circulation is decreased. No differences were observed in Atp7b protein levels between any of the female dietary groups (Figure 4B).
Figure 4 – Copper transporter expression in male, but not female rats is influenced by diet.
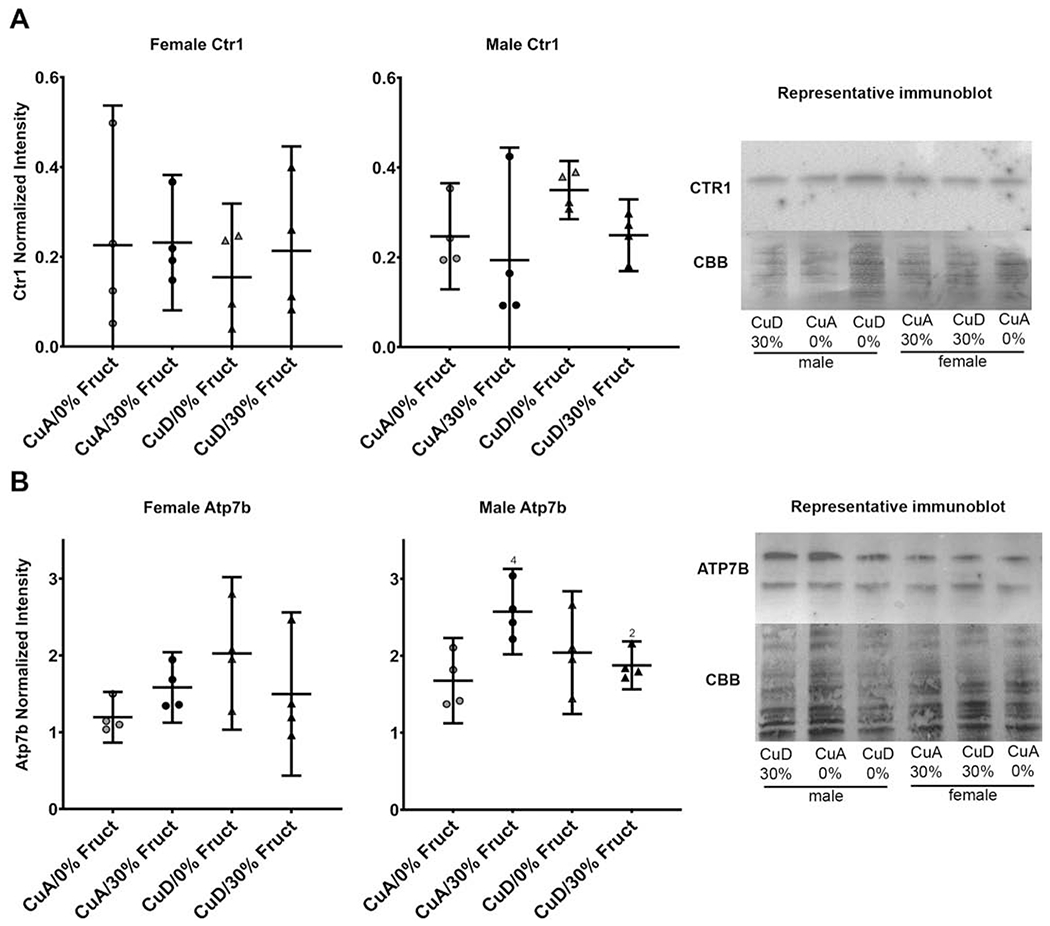
A) CTR1 abundance in male and female models across all dietary treatment conditions (n=4). No difference was seen between any of the dietary groups in males or females. Representative Western blot and immunodetection is shown.
B) Atp7b abundance in all sexes and dietary groups across all dietary treatment conditions (n=4). Male Atp7b quantity was significantly elevated (P<0.05) in the 30% CuA group when compared to the control group. No difference was seen in female Atp7b levels between any dietary groups. Average variance was higher in females CuD groups (StDev 0.646) Atp7b levels when compared to CuA groups (StDev 0.206). Males on average had more Atp7b than females (P<0.01). Representative Western blot and immunodetection is shown (bands include known stable degradation products ~130 and 100 kDa.
3.7. Dietary fructose or Cu result in distinct metabolic phenotypes
Liver tissue samples from 24 animals (i.e., 12 females and 12 males) were used to evaluate the hepatic metabolite profiles and metabolome changes induced by the different diets. The NMR and Chenomx-based metabolite profiling approach resulted in the identification and quantification of ~ 56 metabolites for both female and male animals in each different treatment group (See Supplementary Tables S6 and S7). Diets were used as independent variables in this analysis.
Multivariate statistical analysis and resulting 2D-PCA scores plots of metabolite profiles separated female versus male animals according to the different diet treatment groups (Figure 5). Most notably, the 2D-PCA scores plot for the female animals revealed that only the group of animals fed the CuA/30% Fruct diet separated from the animal groups subject to the control CuA/0% Fruct diet, the CuD/0% Fruct, or the CuD-30% Fruct diet, suggesting that dietary Cu intake alone (i.e., CuA versus CuD diets) does not have a significant impact on the liver metabolomes of the female animals (Figure 5A). In contrast, the 2D-PCA scores plots of resulting metabolite profiles for the male rats separated the four different dietary groups, suggesting that dietary Cu intake has a significance influence on the liver metabolism of the male rats in this animal model of NAFLD (Figure 5B).
Figure 5 – 2D-PCA scores plots and 2D- Partial Least Square-Discriminant Analysis (2D-PLS-DA) scores plots for both female and male rats in their perspective diet groups.
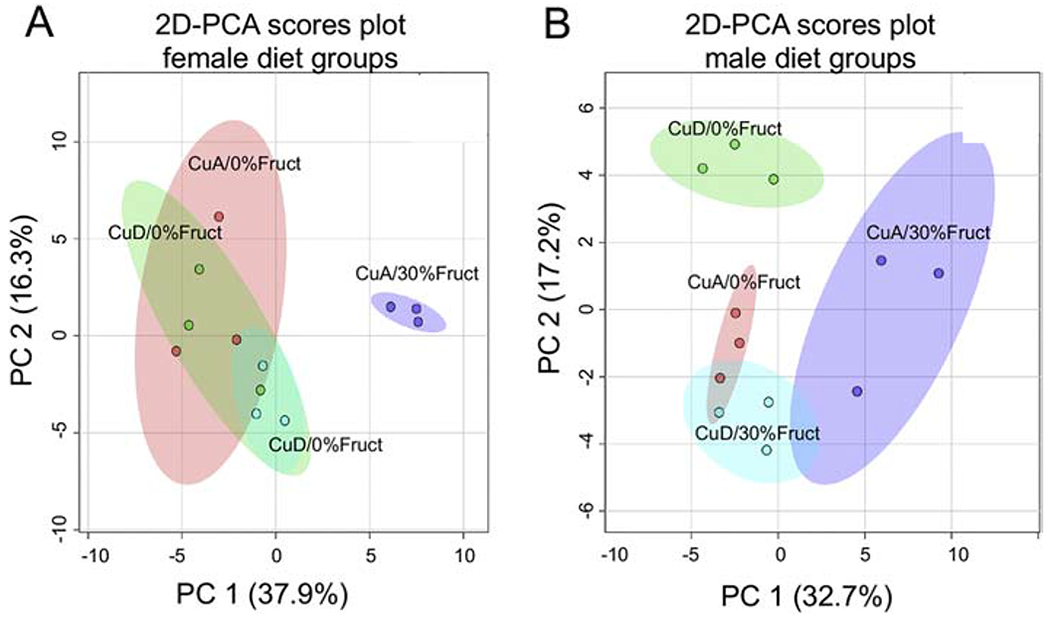
A) 2D-PCA scores plot separating the female diet groups and indicating that only the CuA/30%Fruct dietary group separates from the other female dietary groups, with PC1 and PC2 accounting for ~ 37.9% and ~16.3% of the variance, respectively.
B) 2D-PCA scores plot separating the male diet groups indicating that the four male dietary groups separate from one another according to their distinct metabolic profiles, with PC1 and PC2 accounting for ~ 32.7% and ~17.2% of the variance, respectively.
Hierarchical clustering analysis (HCA) and heatmap representations of liver metabolite profiles also revealed significant diet-induced metabolite changes in both male and female animals (Figure 6). Distinct clusters separating the different animal groups based on relative changes in metabolite levels were clearly visible in the HCA analyses of the male dietary groups. The largest difference was observed for the CuA/30% Fruct versus the CuD/30% Fruct dietary groups, suggesting that the influence of dietary fructose stress on the male liver metabolomes is influenced by differences in dietary Cu intake (Figure 6). HCA analysis and heatmap representations of the distinct metabolite profiles of the females were in contrast less definitive, although a separation was clearly present between the female CuA/30% Fruct and the CuD/0% Fruct dietary groups (Figure 6). The clustering for the female CuD/ 0% Fruct diet group is however imperfect, as this profile overlaps with the metabolite profile of the female CuA/0% Fruct dietary group (Figure 6). Overall, metabolite profile differences between male and female rats, as revealed by the dietary group separations in 2D-PCA, 2D-PLS-DA scores plots and heatmap graphical representations of metabolite level changes, are consistent with the histological results, biometal content, and serum/hepatic Cu levels as presented in the results above.
Figure 6 – Hierarchical clustering analysis and heat map representation of the 25 most significant metabolites whose level changes contribute to the separation between the different dietary groups of the male and female rat animals.
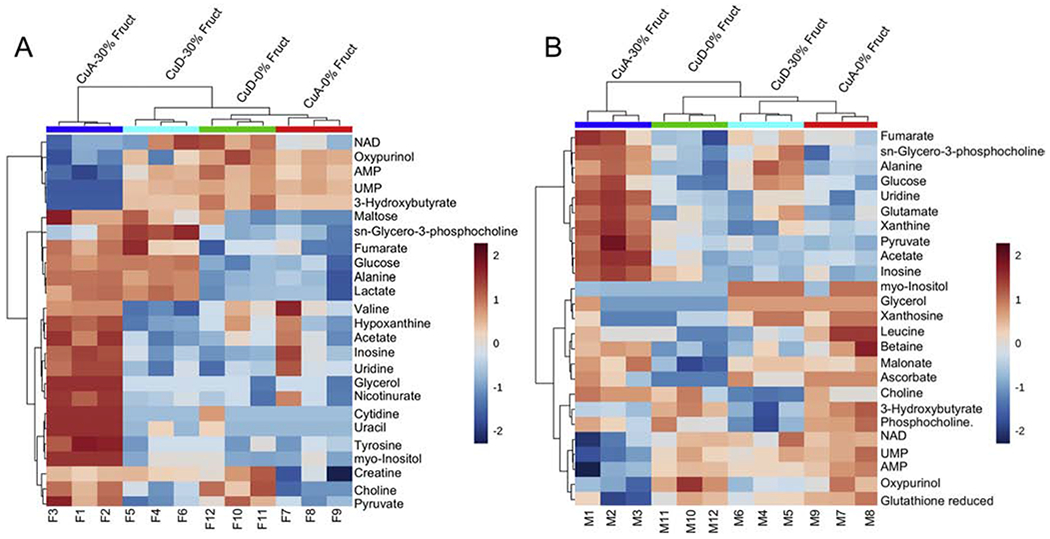
A) Heatmap representation of the top 25 metabolites whose level changes separate the different female dietary groups into different clusters. The hierarchical clustering analysis supports results from the 2D-PCA scores plot (shown in Figure 5 panel A) indicating that the female CuA/30%Fruct dietary group is most distinct metabolically from the other female dietary treatment groups.
B) Heatmap representation of the top 25 metabolites whose level changes differentiate between the different male dietary groups. Relative metabolite abundances are coded red for elevated and blue color denotes lower levels.
When disaggregated by sex, HCA fully separated all of the male dietary groups, as well as the female CuA/30% Fruct group from the other female dietary groups (Figure 6). HCA analysis with both sexes pooled together could almost completely distinguish between all the different dietary groups and sexes, except for female rats fed the CuA/0% Fruct and CuD/0% Fruct diets, indicating that intersex metabolite profile variability is greater than intrasex variability (Supplementary Figure S8).
The HCA analyses demonstrated that the CuA/30% Fruct diets resulted in the most distinct and characteristic metabolic profiles for both male and female rats compared to the other dietary groups. For the female rats, these data are also consistent with 2D-PCA scores plots indicating that fructose supplementation (i.e., CuA/CuD-30% Fruct diets) promotes metabolite profiles that separate to a larger extent in the PC1 and PC2 dimensions of the 2D-PCA scores plot compared to the metabolite profiles of females subject to the CuA or CuD-0% Fruct diets (Figure 5A). In contrast, the CuA/CuD diet regimens had a greater impact on the metabolic profiles of the male rats, compared to metabolite profile differences observed as a result of the 30% fructose versus 0% fructose dietary treatments (Figure 5B). These data suggest that dietary Cu intake has a greater influence on the liver metabolomes of the male rats compared to the females.
ANOVA analysis revealed that 23 metabolites in both female and male groups were significantly altered in the different dietary groups (Supplementary Figures S9, S10). While some metabolite level patterns were common for both male and female rats, including UMP, pyruvate, 3-hydroxybutyrate, alanine, choline, oxypurinol, inosine, AMP, uridine, myo-inositol, glycerol, sn-glycero-3-phosphocholine and glucose, other metabolites exhibited sex-specific concentration changes. For example, for the female rats, ANOVA revealed significant changes in lactate, cytidine, uracil, tyrosine, hypoxanthine, nicotinurate, creatine, acetate, and maltose levels. Significant changes in metabolite levels that were found only in the male groups included acetate, malonate, ascorbate, o-phosphocholine, xanthine, leucine, NAD+, fumarate, betaine, and xanthosine.
Fructose supplementation resulted in increased hepatic levels of pyruvate and acetate in both sexes, potentially due to inhibition of fatty acid catabolism and/or decreased entry of acetyl-CoA into the TCA cycle. Cu restriction appeared to attenuate this effect for both animal groups. Cu restriction alone promoted increased pyruvate levels, more pronounced in female animals, but did not cause an increase in acetate levels. Cu restriction reversed the observed fructose-induced increase in pyruvate and acetate levels in both male and female rats, suggesting that under CuD conditions, TCA cycle intermediates may flow into other metabolic networks or that a shift toward lipid catabolism may take place.
Fructose supplementation resulted in decreased levels of NAD+ and NADP+ in male rats and decreased NADP+ in female rats. These observations are consistent with male rats being more susceptible to NAFLD disease etiology, as lower NAD+ levels have been reported to be a risk factor for NAFLD and are indicative of increased oxidative stress [40]. The CuD/30% Fruct diet, however, did not induce any of these changes for either male or female rat groups.
Together, these results indicate that Cu limitation attenuates some of the metabolic effects resulting from excess fructose consumption, a pattern which is more apparent in male than in female animals, and which is also consistent with the minimal changes observed in hepatic Cu levels in the female rat dietary groups.
4. Discussion
4.1. Dietary Cu modulates sex-specific influence of fructose on liver pathology and metabolism.
Review of published work reveals that the impact of diet on animal models of liver disease has not typically considered sex as a variable in the observed phenotypes. Key findings of our study highlight that relatively short duration (i.e. 5 weeks) feeding of excess dietary fructose triggers features of NAFLD-like pathology in male and female rats, even in the absence of obesity. Moreover, some of the underlying metabolic responses that are impacted by dietary Cu differ between males and females in this rat model of NAFLD. Prior work suggests that low Cu enhances NAFLD severity [11,12], though NAFLD severity in these studies was defined by the extent of steatosis. Our previous rat study indicated that while dietary Cu deficiency promoted steatosis, dietary sugar promoted inflammatory gene expression which was partially attenuated by Cu limitation [10]. Here, we find that Cu modulates fructose-induced metabolic changes in the liver, as detailed below. The fact that low Cu promotes steatosis is not inconsistent with our current observations, as steatosis is observed in our CuD treatment groups. The original studies linking Cu and NAFLD, however, did not profile metabolites and cannot be directly compared to our current findings.
4.2. Bio-metal homeostasis is impacted by dietary Cu and fructose in male rats, and only a limited response in female rats.
Our results indicate that either dietary Cu restriction and/or fructose supplementation significantly influence circulating levels of Cu and Mo, and hepatic levels of Cu, Mn, Mo and Zn, in males but not female rats. Impacts on male hepatic and circulating Cu levels in response to changes in Cu intake are consistent with other studies [5,10,19], although our study also monitored the impact of fructose on bio-metals levels under constant Cu level intake. Analogous observations were reported in mice by Heffern et al., where male animals fed a high fat diet exhibited decreased hepatic Cu and increased hepatic Atp7b abundance, but no change in Ctr1 levels [41], although female mice were not included in the study. This suggests that hepatic Cu import protein levels are tightly regulated, with little influence from systemic Cu availability. It also suggests that hepatic Cu homeostasis is maintained primarily by changes in hepatic Cu export and not Cu import processes. These sex-specific Cu-mediated responses are reinforced by our observation that the abundance of the hepatocyte Cu exporter protein Atp7b is altered by diet in the male rats, but not in the females (Figure 4).
Previous studies found that sucrose or fructose supplementation suppresses male hepatic Cu levels even under CuD conditions [5]. Our data are consistent with this observation, as we have observed that male rats fed a CuD/ 30% Fruct diet had the lowest average levels of circulating Cu, hepatic Cu, and Cp enzyme activity. The fact that these Cu levels are not significantly different from the CuD/ 0% Fruct male dietary group may be due to an asymptotic “floor” effect, whereby minimal Cu levels are maintained during Cu dietary limitation.
4.3. Fructose paired with adequate Cu promotes significant changes in polar liver metabolite levels, while dietary Cu restriction attenuates these metabolic responses.
We took advantage of the fact that NMR metabolomics is highly reproducible and quantitative to simultaneously identify and quantify liver metabolites of male and female rats of an NAFLD animal model that were subjected to the different diets. In our study, the largest shifts in metabolite levels compared to control occurred in the CuA/30% Fruct dietary treatment group, followed by the CuD/30% Fruct dietary group for both males and females. In contrast, the metabolite profiles of animals fed the control diet (i.e., the CuA/0% Fruct groups) were found to be sex dependent.
Metabolomics analysis also revealed significant differences between male and female rats with respect to the type of metabolites that contributed to the separation between the different dietary groups. Large sex-dependent differences were also found in metabolite concentration changes resulting from fructose- and Cu-induced dietary stress. These results suggest that, while pathology may be similar between male and female rats, the biochemical mechanisms underlying liver pathology in this model are influenced by sex.
While previous research has focused primarily on nutrient impacts on NAFLD disease development, little information describing the influence of sex on diet induced NAFLD has been reported. However, several key cellular features including formation of reactive oxygen species and mitigation of free radical-induced cellular damage, are highly sex dependent [21,22,25], and studies suggest that pre-menopausal women may be less susceptible to cellular damage from oxidative catabolism [22]. In addition, clinical outcome data, as well as histological data, suggest that pre-menopausal women diagnosed with NAFLD have significantly lower risk of developing NASH than men [28]. Our research with this rat animal model of NAFLD supports these human findings and suggests that sex differences in response to diet and bio-metal homeostasis may be a source of the sex-based disparities observed in NAFLD. Our study using young adult rats, however, restricts our interpretation to a NAFLD model comparable to what could be observed in young pre-menopausal women. Nonetheless, the metabolic differences we have observed may be important factors to consider in future studies to understand differences in NAFLD diagnosis and outcomes between pre- and post-menopausal women [26–28]. Additional work is nevertheless needed to exactly define the molecular processes underlying sex-dependent responses to liver pathogenesis and NAFLD disease progression and pathology in humans.
4.4. Characteristic metabolite profiles suggest mechanisms for Cu-modulated fructose hepatotoxicity in both male and female rats.
The metabolite profiles observed for male and female rats fed the 30% fructose containing diets suggest that CuD regimen attenuates liver metabolic responses to fructose intake. Specifically, the increased levels of pyruvate and acetate that were observed for animals fed the CuA/30% Fruct diet when compared to the animal groups on the control (CuA/0%Fruct) diet, were not observed in the CuD/30% Fruct dietary group. A possible mechanism contributing to this CuD-modulated phenomenon may be that fructose overloads entry of acetyl-coA into the TCA cycle, leading to pyruvate and acetate accumulation in liver tissue, while low Cu intake may attenuate electron transport chain activity due to decreased cytochrome C oxidase Cu metalation. ATP generation would thus shift to aerobic glycolysis and reduced entry of acetyl-CoA into the TCA to possibly alleviate TCA cycle overload. A comparable response is observed in tumors, where Cu limitation enhances aerobic glycolysis and promotes a shift away from oxidative phosphorylation for ATP generation [42]. Although a consistent decrease in hepatic complex IV activity is not observed in our study, low Cu intake is known to impact cellular energetics by diverse mechanisms, as detailed below.
Cu promotes phosphorylation and activation of adenosine monophosphate-activated protein kinase (AMPK) [43], which leads to a shift from ATP-consuming to ATP-generating metabolic pathway utilization in cells [44]. Furthermore, liver-specific AMPK activation prevents de novo lipogenesis and triglyceride accumulation in hepatocytes [45]. It has also been suggested that fructose interferes with AMPK activity [46], thus disrupting its ability to promote AMPK-mediated ATP-generating pathways. Fructose inhibition of AMPK, together with limited AMP levels and overload of the TCA cycle, would thus result in accumulation of substrates such as pyruvate and acetate. Hepatic AMP levels decreased markedly in both male and female rats that were fed the CuA/30% Fruct diet, while the CuD/30% Fruct-fed animals presented hepatic AMP levels that were consistent with both the CuA or CuD/0% Fruct dietary groups, revealing a potential mechanism to influence metabolite profile changes through the loss of AMPK activity. Further, Cu also inhibits phosphodiesterase 3B (PDE3B), thus promoting cAMP-dependent lipolysis [47]; as such, low Cu intake may favor increased PDE3B activity, less lipolysis and attenuated fatty acid oxidation. We suspect that Cu limitation suppresses lipolysis, which is also consistent with our prior work that reported low Cu promotes steatosis in a sucrose-fed rat model [10], and which might also alleviate some of the electron transport chain and ATP-generating component overloads suspected to take place as a result of high sugar intake. Humans with NAFLD exhibit increased lipolysis and gluconeogenesis, as well as 2-fold higher mitochondrial oxidative metabolism [48], potentially reflecting an AMPK-activated, PDE3B-inhibited metabolic condition. Consistent with these observations, steatosis in NAFLD in the absence of overall metabolic syndrome is inversely correlated with liver Cu level [11].
In this liver injury and metabolic model, inflammation may thus be mediated by AMP conversion to IMP and then inosine, where these first and third steps of purine catabolism (either AMP→IMP→inosine or AMP→adcnosinc→inosine) are observed in our dataset (decreased AMP and increased inosine) in the CuA/30% Fruct group, but not in the CuD/30% Fruct group, providing a metabolite-driven mechanism for fructose-induced inflammation, which appears to be mitigated by Cu limitation. Downstream reactions in purine catabolism lead to uric acid formation, which is implicated in fructose-induced liver injury [49].
5. Conclusion
Clinical data indicate the presence of a sex-based disparity in NAFLD patients’ susceptibility to progress to the more severe NASH form of the disease, although little is known about the molecular processes and cellular pathways underlying this disparity. To better understand the biochemistry underlying sex specific responses to liver pathology and NAFLD disease progression, this study examined the interplay between sex and specific dietary factors (fructose and Cu intake) in liver disease progression in an animal rat model of NAFLD. Specifically, this study found significant sex differences between male and female rats with distinct influence on bio-metal homeostasis, liver metabolome profiles, and degrees of hepatic steatosis and inflammation. Together, these findings demonstrate that fructose-driven hepatotoxicity is impacted by Cu dietary availability in a sex-specific manner, and that fructose-mediated hepatotoxicity is exacerbated by dysbiosis in micronutrient intake such as Cu.
Supplementary Material
Acknowledgements:
Research reported in this publication was supported by an Institutional Development Award (IDeA) from the National Institute of General Medical Sciences of the National Institutes of Health (NIH) under grant number P20GM103395 and 1R15DK114747-01 to JLB. ICP-MS measurements performed at the OHSU Elemental Analysis Core with partial support from the National Institutes of Health grant S10RR025512 to Martina Ralle. Support was also provided by the Montana Research Initiative Grant Program (Grant 51040-MUSRI2015-03) (to VC, BJE, BPT), and the NSF-funded REU program of Montana State University’s Department of Chemistry and Biochemistry (to M.T.). The 1D 1H NMR spectra included in this manuscript were recorded on a Bruker AVANCE III 600 MHz NMR spectrometer housed at Montana State University’s NMR Center. Funding for the instrument and corresponding upgrade were provided by the NIH SIG program (Grant no. 1S10RR13878 and 1S10RR026659). Support for MSU’s NMR Center and new 500 MHz NMR spectrometer was also provided by the National Science Foundation (Grant No. NSF-MRI:DBI-1532078), the Murdock Charitable Trust Foundation (Grant No. 2015066:MNL), and MSU’s Vice President for Research and Economic Development’s office. We thank Edward Dratz for many helpful discussions of this work and Jeff Hittson for assistance and training in histopathology. We thank Kelsey Meacham and Zane Davis for assistance with animal experiments.
The content in this manuscript is solely the responsibility of the authors and does not necessarily reflect the official views of the NIH.
Abbreviations:
- Ab
antibody
- Cp
ceruloplasmin
- D2O
deuterium oxide
- DSS
4,4-dimethyl-4-silapentane-1-sulfonic acid
- EM
exponential multiplication
- HCC
hepatocellular carcinoma
- HRP
horseradish peroxidase
- ICP-MS
inductively-coupled plasma mass spectroscopy
- MetS
metabolic syndrome
- NAFLD
non-alcoholic fatty liver disease
- NASH
non-alcoholic steatohepatitis
- NAS
NAFLD Activity Score
- NMR
nuclear magnetic resonance
- PVDF
Polyvinylidene fluoride
- RIPA
radioimmunoprecipitation assay
- SSAO
semicarbizide-sensitive amine oxidase
- SOD
superoxide dismutase
- TBS-T
Tris-buffered saline-0.1% Tween 20
Footnotes
Publisher's Disclaimer: This is a PDF file of an article that has undergone enhancements after acceptance, such as the addition of a cover page and metadata, and formatting for readability, but it is not yet the definitive version of record. This version will undergo additional copyediting, typesetting and review before it is published in its final form, but we are providing this version to give early visibility of the article. Please note that, during the production process, errors may be discovered which could affect the content, and all legal disclaimers that apply to the journal pertain.
REFERENCES CITED
- [1].NHANES - National Health and Nutrition Examination Survey Homepage n.d. https://www.cdc.gov/nchs/nhanes/ (accessed January 24, 2017).
- [2].Wintergerst ES, Maggini S, Hornig DH. Contribution of selected vitamins and trace elements to immune function. Ann Nutr Metab 2007;51:301–23. 10.1159/000107673. [DOI] [PubMed] [Google Scholar]
- [3].Tang Z, Gasperkova D, Xu J, Baillie R, Lee JH, Clarke SD. Copper deficiency induces hepatic fatty acid synthase gene transcription in rats by increasing the nuclear content of mature sterol regulatory element binding protein 1. J Nutr 2000;130:2915–21. [DOI] [PubMed] [Google Scholar]
- [4].Morrell Austin, Tallino Savannah, Yu Lei, Burkhead Jason L. The role of insufficient copper in lipid synthesis and fatty-liver disease. IUBMB Life 2017;69:263–70. 10.1002/iub.1613. [DOI] [PMC free article] [PubMed] [Google Scholar]
- [5].Song M, Schuschke DA, Zhou Z, Chen T, Pierce WM, Wang R, et al. High Fructose Feeding Induces Copper Deficiency in Sprague-Dawley rats: A Novel Mechanism for Obesity Related Fatty Liver. J Hepatol 2012;56:433–40. 10.1016/j.jhep.2011.05.030. [DOI] [PMC free article] [PubMed] [Google Scholar]
- [6].Vos MB, Kimmons JE, Gillespie C, Welsh J, Blanck HM. Dietary fructose consumption among US children and adults: the Third National Health and Nutrition Examination Survey. Medscape J Med 2008;10:160. [PMC free article] [PubMed] [Google Scholar]
- [7].Yilmaz Y Review article: fructose in non-alcoholic fatty liver disease. Aliment Pharmacol Ther 2012;35:1135–44. 10.1111/j.1365-2036.2012.05080.x. [DOI] [PubMed] [Google Scholar]
- [8].Abdelmalek MF, Suzuki A, Guy C, Unalp-Arida A, Colvin R, Johnson RJ, et al. Increased fructose consumption is associated with fibrosis severity in patients with nonalcoholic fatty liver disease. Hepatol Baltim Md 2010;51:1961–71. 10.1002/hep.23535. [DOI] [PMC free article] [PubMed] [Google Scholar]
- [9].Lim JS, Mietus-Snyder M, Valente A, Schwarz J-M, Lustig RH. The role of fructose in the pathogenesis of NAFLD and the metabolic syndrome. Nat Rev Gastroenterol Hepatol 2010;7:251–64. 10.1038/nrgastro.2010.41. [DOI] [PubMed] [Google Scholar]
- [10].Tallino S, Duffy M, Ralle M, Cortes MP, Latorre M, Burkhead JL. Nutrigenomics analysis reveals that copper deficiency and dietary sucrose up-regulate inflammation, fibrosis and lipogenic pathways in a mature rat model of nonalcoholic fatty liver disease. J Nutr Biochem 2015;26 10.1016/j.jnutbio.2015.04.009. [DOI] [PMC free article] [PubMed] [Google Scholar]
- [11].Aigner E, Strasser M, Haufe H, Sonnweber T, Hohla F, Stadlmayr A, et al. A role for low hepatic copper concentrations in nonalcoholic Fatty liver disease. Am J Gastroenterol 2010;105:1978–85. [DOI] [PubMed] [Google Scholar]
- [12].Stättermayer AF, Traussnigg S, Aigner E, Kienbacher C, Huber-Schönauer U, Steindl-Munda P, et al. Low hepatic copper content and PNPLA3 polymorphism in non-alcoholic fatty liver disease in patients without metabolic syndrome. J Trace Elem Med Biol Organ Soc Miner Trace Elem GMS 2017;39:100–7. 10.1016/j.jtemb.2016.08.006. [DOI] [PubMed] [Google Scholar]
- [13].Younossi Z, Anstee QM, Marietti M, Hardy T, Henry L, Eslam M, et al. Global burden of NAFLD and NASH: trends, predictions, risk factors and prevention. Nat Rev Gastroenterol Hepatol 2018; 15:11–20. 10.1038/nrgastro.2017.109. [DOI] [PubMed] [Google Scholar]
- [14].Hashimoto E, Taniai M, Tokushige K. Characteristics and diagnosis of NAFLD/NASH. J Gastroenterol Hepatol 2013;28 Suppl 4:64–70. 10.1111/jgh.12271. [DOI] [PubMed] [Google Scholar]
- [15].Geisler CE, Renquist BJ. Hepatic lipid accumulation: cause and consequence of dysregulated glucoregulatory hormones. J Endocrinol 2017;234:R1–21. 10.1530/JOE-16-0513. [DOI] [PubMed] [Google Scholar]
- [16].Marchesini G, Petta S, Dalle Grave R. Diet, weight loss, and liver health in nonalcoholic fatty liver disease: Pathophysiology, evidence, and practice. Hepatol Baltim Md 2016;63:2032–43. 10.1002/hep.28392. [DOI] [PubMed] [Google Scholar]
- [17].Shen J, Wong GL-H, Chan HL-Y, Chan RS-M, Chan H-Y, Chu WC-W, et al. PNPLA3 gene polymorphism and response to lifestyle modification in patients with nonalcoholic fatty liver disease. J Gastroenterol Hepatol 2015;30:139–46. 10.1111/jgh.12656. [DOI] [PubMed] [Google Scholar]
- [18].Centre (UK) NG. Risk factors for NAFLD. National Institute for Health and Care Excellence (UK); 2016. [Google Scholar]
- [19].Song M, Schuschke DA, Zhou Z, Chen T, Shi X, Zhang J, et al. Modest fructose beverage intake causes liver injury and fat accumulation in marginal copper deficient rats. Obes Silver Spring Md 2013;21:1669–75. 10.1002/oby.20380. [DOI] [PMC free article] [PubMed] [Google Scholar]
- [20].Song M, Li X, Zhang X, Shi H, Vos MB, Wei X, et al. Dietary copper-fructose interactions alter gut microbial activity in male rats. Am J Physiol Gastrointest Liver Physiol 2018;314:G119–30. 10.1152/ajpgi.00378.2016. [DOI] [PMC free article] [PubMed] [Google Scholar]
- [21].Justo R, Boada J, Frontera M, Oliver J, Bermúdez J, Gianotti M. Gender dimorphism in rat liver mitochondrial oxidative metabolism and biogenesis. Am J Physiol-Cell Physiol 2005;289:C372–8. 10.1152/ajpcell.00035.2005. [DOI] [PubMed] [Google Scholar]
- [22].Kander MC, Cui Y, Liu Z. Gender difference in oxidative stress: a new look at the mechanisms for cardiovascular diseases. J Cell Mol Med 2017;21:1024–32. 10.1111/jcmm.13038. [DOI] [PMC free article] [PubMed] [Google Scholar]
- [23].Knopp RH, Paramsothy P, Retzlaff BM, Fish B, Walden C, Dowdy A, et al. Gender differences in lipoprotein metabolism and dietary response: Basis in hormonal differences and implications for cardiovascular disease. Curr Atheroscler Rep 2005;7:472–9. 10.1007/s11883-005-0065-6. [DOI] [PubMed] [Google Scholar]
- [24].Liu H, Harrell LE, Shenvi S, Hagen T, Liu R-M. Gender differences in glutathione metabolism in Alzheimer’s disease. J Neurosci Res 2005;79:861–7. 10.1002/jnr.20424. [DOI] [PubMed] [Google Scholar]
- [25].Miller AA, Drummond GR, Mast AE, Schmidt HHHW, Sobey CG. Effect of Gender on NADPH-Oxidase Activity, Expression, and Function in the Cerebral Circulation. Stroke 2007. [DOI] [PubMed] [Google Scholar]
- [26].Hashimoto E, Tokushige K. Prevalence, gender, ethnic variations, and prognosis of NASH. J Gastroenterol 2011;46:63–9. 10.1007/s00535-010-0311-8. [DOI] [PubMed] [Google Scholar]
- [27].Pan J-J, Fallon MB. Gender and racial differences in nonalcoholic fatty liver disease. World J Hepatol 2014;6:274–83. 10.4254/wjh.v6.i5.274. [DOI] [PMC free article] [PubMed] [Google Scholar]
- [28].Yang JD, Abdelmalek MF, Guy CD, Gill RM, Lavine JE, Yates K, et al. Patient Sex, Reproductive Status, and Synthetic Hormone Use Associate With Histologic Severity of Nonalcoholic Steatohepatitis. Clin Gastroenterol Hepatol 2017;15:127–131.e2. 10.1016/j.cgh.2016.07.034. [DOI] [PMC free article] [PubMed] [Google Scholar]
- [29].Reeves PG, Nielsen FH, Fahey GC. AIN-93 purified diets for laboratory rodents: final report of the American Institute of Nutrition ad hoc writing committee on the reformulation of the AIN-76A rodent diet. J Nutr 1993;123:1939–51. 10.1093/jn/123.11.1939. [DOI] [PubMed] [Google Scholar]
- [30].Cordain L, Eaton SB, Sebastian A, Mann N, Lindeberg S, Watkins BA, et al. Origins and evolution of the Western diet: health implications for the 21st century. Am J Clin Nutr 2005;81:341–54. 10.1093/ajcn.81.2.341. [DOI] [PubMed] [Google Scholar]
- [31].Walker RW, Dumke KA, Goran MI. Fructose content in popular beverages made with and without high-fructose corn syrup. Nutrition 2014;30:928–35. 10.1016/j.nut.2014.04.003. [DOI] [PubMed] [Google Scholar]
- [32].Kleiner DE, Brunt EM, Natta MV, Behling C, Contos MJ, Cummings OW, et al. Design and validation of a histological scoring system for nonalcoholic fatty liver disease. Hepatology 2005;41:1313–21. 10.1002/hep.20701. [DOI] [PubMed] [Google Scholar]
- [33].Zhou M, Panchuk-Voloshina N. A one-step fluorometric method for the continuous measurement of monoamine oxidase activity. Anal Biochem 1997;253:169–74. 10.1006/abio.1997.2392. [DOI] [PubMed] [Google Scholar]
- [34].Collins TJ. ImageJ for microscopy. BioTechniques 2007;43:25–30. 10.2144/000112517. [DOI] [PubMed] [Google Scholar]
- [35].Eaton SL, Roche SL, Hurtado ML, Oldknow KJ, Farquharson C, Gillingwater TH, et al. Total Protein Analysis as a Reliable Loading Control for Quantitative Fluorescent Western Blotting. PLOS ONE 2013;8:e72457 10.1371/journal.pone.0072457. [DOI] [PMC free article] [PubMed] [Google Scholar]
- [36].Mercier P, Lewis MJ, Chang D, Baker D, Wishart DS. Towards automatic metabolomic profiling of high-resolution one-dimensional proton NMR spectra. J Biomol NMR 2011;49:307–23. 10.1007/s10858-011-9480-x. [DOI] [PubMed] [Google Scholar]
- [37].Hamerly T, Tripet B, Tigges M, Giannone R, Wurch L, Hettich R, et al. Untargeted metabolomics studies employing NMR and LC–MS reveal metabolic coupling between Nanoarcheum equitans and its archaeal host Ignicoccus hospitalis. Metabolomics 2014:1–13. 10.1007/s11306-014-0747-6. [DOI] [PMC free article] [PubMed] [Google Scholar]
- [38].Chong J, Soufan O, Li C, Caraus I, Li S, Bourque G, et al. MetaboAnalyst 4.0: towards more transparent and integrative metabolomics analysis. Nucleic Acids Res 2018;46:W486–94. 10.1093/nar/gky310. [DOI] [PMC free article] [PubMed] [Google Scholar]
- [39].Yang H, Ralle M, Wolfgang MJ, Dhawan N, Burkhead JL, Rodriguez S, et al. Copper-dependent amino oxidase 3 governs selection of metabolic fuels in adipocytes. PLoS Biol 2018;16:e2006519. [DOI] [PMC free article] [PubMed] [Google Scholar]
- [40].Zhou C-C, Yang X, Hua X, Liu J, Fan M-B, Li G-Q, et al. Hepatic NAD(+) deficiency as a therapeutic target for non-alcoholic fatty liver disease in ageing. Br J Pharmacol 2016;173:2352–68. 10.1111/bph.13513. [DOI] [PMC free article] [PubMed] [Google Scholar]
- [41].Heffern MC, Park HM, Au-Yeung HY, Bittner GCV de, Ackerman CM, Stahl A, et al. In vivo bioluminescence imaging reveals copper deficiency in a murine model of nonalcoholic fatty liver disease. Proc Natl Acad Sci 2016;113:14219–24. 10.1073/pnas.1613628113. [DOI] [PMC free article] [PubMed] [Google Scholar]
- [42].Ishida S, Andreux P, Poitry-Yamate C, Auwerx J, Hanahan D. Bioavailable copper modulates oxidative phosphorylation and growth of tumors. Proc Natl Acad Sci U S A 2013;110:19507–12. 10.1073/pnas.1318431110. [DOI] [PMC free article] [PubMed] [Google Scholar]
- [43].Lei L, Xiaoyi S, Fuchang L. Effect of dietary copper addition on lipid metabolism in rabbits. Food Nutr Res 2017;61:1348866 10.1080/16546628.2017.1348866. [DOI] [PMC free article] [PubMed] [Google Scholar]
- [44].Steinberg GR, Kemp BE. AMPK in Health and Disease. Physiol Rev 2009;89:1025–78. 10.1152/physrev.00011.2008. [DOI] [PubMed] [Google Scholar]
- [45].Woods A, Williams JR, Muckett PJ, Mayer FV, Liljevald M, Bohlooly-Y M, et al. Liver-Specific Activation of AMPK Prevents Steatosis on a High-Fructose Diet. Cell Rep 2017;18:3043–51. 10.1016/j.celrep.2017.03.011. [DOI] [PMC free article] [PubMed] [Google Scholar]
- [46].Gugliucci A Fructose surges damage hepatic adenosyl-monophosphate-dependent kinase and lead to increased lipogenesis and hepatic insulin resistance. Med Hypotheses 2016;93:87–92. 10.1016/j.mehy.2016.05.026. [DOI] [PubMed] [Google Scholar]
- [47].Krishnamoorthy L, Cotruvo JA, Chan J, Kaluarachchi H, Muchenditsi A, Pendyala VS, et al. Copper regulates cyclic-AMP-dependent lipolysis. Nat Chem Biol 2016;12:586–92. 10.1038/nchembio.2098. [DOI] [PMC free article] [PubMed] [Google Scholar]
- [48].Sunny NE, Parks EJ, Browning JD, Burgess SC. Excessive hepatic mitochondrial TCA cycle and gluconeogenesis in humans with nonalcoholic fatty liver disease. Cell Metab 2011;14:804–10. 10.1016/j.cmet.2011.11.004. [DOI] [PMC free article] [PubMed] [Google Scholar]
- [49].Lanaspa MA, Sanchez-Lozada LG, Choi Y-J, Cicerchi C, Kanbay M, Roncal-Jimenez CA, et al. Uric acid induces hepatic steatosis by generation of mitochondrial oxidative stress: potential role in fructose-dependent and -independent fatty liver. J Biol Chem 2012;287:40732–44. 10.1074/jbc.M112.399899.. [DOI] [PMC free article] [PubMed] [Google Scholar]
Associated Data
This section collects any data citations, data availability statements, or supplementary materials included in this article.