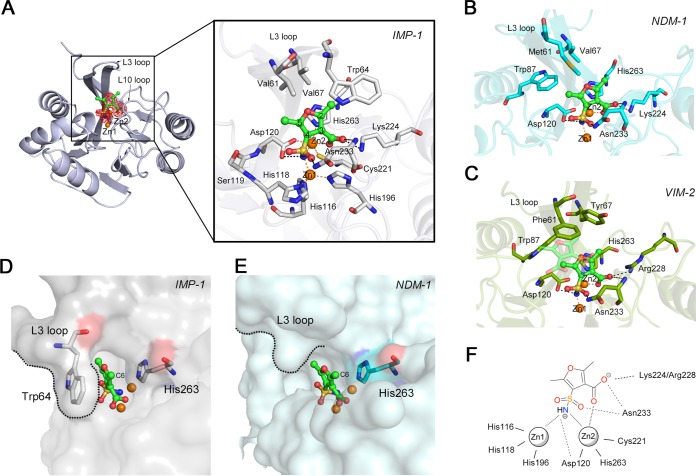
FIG 3.
Mode of MBL inhibition by SFC. (A) Schematic representation of the overall structure of IMP-1 in complex with SFC and interactions between IMP-1 and SFC. The |Fo| − |Fc| omit map of SFC, which was contoured at 3.0σ (red mesh), is shown. SFC is illustrated in green (carbon), ochre (sulfur), red (oxygen), and blue (nitrogen) sticks. The amino acids of IMP-1 are represented by silver sticks. Zinc ions are illustrated as orange spheres. Black and orange dashed lines indicate hydrogen and coordination bonds, respectively. (B) Interactions between NDM-1 and SFC. The amino acids of NDM-1 are represented by cyan sticks. The SFC molecule is shown as described for panel A. (C) Interactions between VIM-2 and SFC. The amino acids of VIM-2 are illustrated using deep-green-colored sticks. The SFC molecule is shown as described for panel A. (D) Surface representation of IMP-1 (shown in transparent gray). The SFC molecule is shown as described for panel A. Trp64 and His263 are represented by silver sticks. (E) Surface representation of NDM-1 (shown in transparent cyan). The SFC molecule is shown as described for panel A. His263 is represented by cyan sticks. (F) Summary of the binding mode between subclass B1 MBLs (IMP-1, NDM-1, and VIM-2) and SFC.

