

Abstract
Aims
To use electronic health record data from real‐world clinical practice to assess demographics, clinical characteristics and disease burden of adults with type 1 diabetes (T1D) in the United States.
Materials and methods
Retrospective observational study of adults with T1D for ≥24 months at their first visit with a T1D diagnosis code (“index date”) between July 2014 and June 2016 in the Optum Humedica database. Demographic characteristics, acute complications (severe hypoglycaemia [SH], diabetic ketoacidosis [DKA]), microvascular complications, cardiovascular (CV) events and health care resource utilization during the 12 months before the index date (“baseline period”) were compared between patients with optimal versus suboptimal glycaemic control (glycated haemoglobin [HbA1c] <7.0% vs. ≥7.0% [53 mmol/mol]) at the closest measurement to the index date.
Results
Of 31 430 adults with T1D, 79.9% had suboptimal glycaemic control (mean HbA1c 8.8% [73 mmol/mol]). These patients were more likely to be younger, African American, uninsured or on Medicaid, obese, smokers, have uncontrolled hypertension and have depression. Despite worse glycaemic control and increased CV risk factors of uncontrolled hypertension, obesity and smoking, rates of coronary heart disease and stroke were not higher in these patients. Patients with suboptimal glycaemic control also experienced more diabetes complications (including SH, DKA and microvascular disease) and utilized more emergency care, with more emergency department visits and inpatient stays.
Conclusion
This real‐world study of >30 000 adults with T1D showed that individuals with suboptimal versus optimal glycaemic control differed significantly in terms of health care coverage, comorbidities, diabetes‐related complications, health care utilization and CV risk factors. However, suboptimal control was not associated with increased risk of CV outcomes.
Keywords: type 1 diabetes; observational study; diabetes complications, database research, cardiovascular disease
1. INTRODUCTION
In the United States, it has been estimated that 1.3 million adults had type 1 diabetes (T1D) in 2016.1 Furthermore, the prevalence of T1D has been reported to be increasing by 2%–5% per year.2 Patients with T1D may experience acute complications such as diabetic ketoacidosis (DKA) or severe hypoglycaemia (SH), complications that often require emergency care with hospitalization and that can be life‐threatening. It has been estimated that up to 5% of adults with T1D will have an episode of DKA and 7%–9% will have an SH event in the course of a year.3, 4 After a 30‐year duration of T1D with disease management by conventional treatment, an estimated 50% of patients will develop retinopathy, 25% nephropathy and 14% cardiovascular (CV) disease.5 In patients receiving intensive treatment, the cumulative incidence of these complications is substantially lower.5
Large‐scale observational studies of glycaemic control and, more generally, health status in adults and children with T1D have sourced data from diabetes‐focused clinics (e.g. the T1D Exchange studies), and may therefore have limited external validity because of in‐clinic recruitment and patient self‐selection. The current study—Adult Type 1 Diabetes Patient Characteristics, Disease Burden, and Clinical Outcome in a US electronic health record (EHR) Database (T1PCO)—sought to perform a real‐world assessment of the overall health status of adults with T1D in the US general population by leveraging a large EHR database with national coverage.
This analysis descriptively compared baseline patient characteristics and disease burden in patients with optimal versus suboptimal glycaemic control.
2. MATERIALS AND METHODS
2.1. Data source
The T1PCO study was conducted using data from the Optum Humedica EHR database.6 The Optum data consist of EHRs collected from >140 000 physicians at >700 hospitals and 7000 clinics in >80 integrated delivery networks (IDNs) in the United States. The data were from inpatient, outpatient and ambulatory patient visits, and included details of demographic and socio‐economic categories, coded diagnoses and procedures, prescribed medications, laboratory results and clinical administrative data. Data were available from >80 million patients from all census regions in the United States, with at least 7 million patients from each region.
2.2. Study design and study population
The T1PCO study was a retrospective cohort study of adults with T1D. Patients were identified between July 1, 2014, and June 30, 2016. The index date was the date of the first visit with a T1D diagnosis code (International Classification of Diseases [ICD]‐9 code 250.x1 or 250.x3; ICD‐10 code E10.x) or unspecified diabetes diagnosis code (ICD‐9 code 250.x, with no fifth digit; ICD‐10 code E13.X) during the identification period. Patients included in the study met the following criteria: they were classified as having T1D according to an adaptation of a validated algorithm published by Klompas et al.7 (Table S1; see Supporting Information); they had at least a 24‐month history of T1D at the index date; they were aged ≥18 years at the index date and were of known sex; and they had received ≥1 insulin prescription and had ≥1 valid glycated haemoglobin (HbA1c) measurement during the baseline period. Patients were excluded if they were classified (based on the adapted Klompas algorithm) as having type 2 diabetes or had been pregnant at any time during the 12‐month baseline period. The current analysis used data from the 12 months preceding the index date (baseline period) to assess the health status of adults with T1D.
Based on recommendations from the American Diabetes Association (ADA) that HbA1c <7.0% (<53 mmol/mol) is a “reasonable goal for many nonpregnant adults”,8 patients with baseline HbA1c <7.0% (<53 mmol/mol) were placed in the “optimal glycaemic control” group (CONTROL), and patients with baseline HbA1c ≥7.0% (≥53 mmol/mol) were placed in the “suboptimal glycaemic control” group (S‐CONTROL).
2.3. Baseline patient characteristics, complications and health care use
Baseline patient characteristics included both sociodemographic (age, sex, race, insurance status, geographic region) and clinical characteristics (HbA1c, body mass index [BMI], systolic blood pressure [SBP], estimated glomerular filtration rate [eGFR], comorbidities, Charlson Comorbidity Index [CCI]9 and medication use). The HbA1c measurement closest to the index date during the baseline period was reported as the baseline measurement.
CV events (ischaemic and haemorrhagic stroke, peripheral arterial disease and congestive heart failure) were identified by an ICD‐9 or ICD‐10 diagnosis code in the primary or discharge position in the inpatient setting.
Complications (incidence of hypoglycaemia, SH and DKA, prevalence of microvascular complications and incidence of acute CV events) and incidences of health care resource utilization during the 12‐month baseline period were also analysed. Any hypoglycaemia and SH were identified by ICD‐9 codes (based on a validated algorithm from Ginde et al.10), ICD‐10 codes for hypoglycaemia or plasma glucose <70 mg/dL (<3.9 mmol/L); for SH, these had to occur with an inpatient admission or emergency department visit on the same date (Table S2; see Supporting Information). DKA was defined by a diagnosis code of 250.1X or E1X.1 in any position in an inpatient setting.10, 11 Microvascular complications (neuropathy, nephropathy and retinopathy) were identified by a diagnosis code in any care setting.
Health care utilization outcomes during the 12‐month baseline period were reported in a subgroup of patients whose data were obtained from IDNs to ensure that complete inpatient and outpatient records were captured. Health care utilization was identified in the following settings: inpatient, emergency department, outpatient and specialist encounters (endocrinologist, ophthalmologist, podiatrist). Detailed definitions of outcomes are included in Table S2 (see Supporting Information).
2.4. Statistical analyses
Sociodemographic and clinical characteristics were summarized by patient counts and percentages for categorical variables, and by means with standard deviations (SDs) and medians with interquartile ranges for continuous variables. These descriptive measures were used to summarize the number of patients with ≥1 SH or DKA event, the number of patients with microvascular complications or ≥ 1 CV event during baseline, and the number of patients with ≥1 inpatient, emergency department or endocrinologist encounter. Differences between glycaemic‐control subgroups were assessed using χ2‐tests for categorical variables and Kruskal‐Wallis tests for continuous variables. Fisher exact tests were used for categorical variables where appropriate (1 or more cells with <5 counts).
3. RESULTS
3.1. Patient selection and overall cohort
During the identification period, 430 335 patients with a T1D or unspecified diabetes diagnosis were identified and selected for potential inclusion in the T1PCO study. Of those, 31 430 had T1D (as described in Section 2.2) and met the eligibility criteria. Sample attrition is reported in detail in Figure S1 (see Supporting Information). Data from IDNs were available for 26 678 patients, and this subgroup was used for the analysis of health care resource utilization during the baseline period.
At baseline, the study population of T1D adults had a mean age of 46 years; 49% were female, 88% Caucasian, 7% African American and 58% commercially insured (Table 1). Patients were mostly in the East North Central US census division (35%), followed by the South Atlantic/West South Central (26%) and West North Central (17%) divisions (Figure 1). The mean BMI was 28 kg/m2, with 66% of patients being overweight or obese (BMI ≥25 kg/m2). In addition, 34% of patients had SBP ≥130 mmHg and 13% had eGFR <60 mL/min/1.73 m2. Comorbidities were common: 45% of patients had diagnosed hypertension and 52% hyperlipidaemia (Table 1). Mean baseline HbA1c was 8.3% (67 mmol/mol).
Table 1.
Baseline characteristics of patients with T1D in the CONTROL and S‐CONTROL groups
| Patient characteristics |
All patients N = 31 430 |
CONTROL HbA1c <7.0% n = 6331 |
S‐CONTROL HbA1c ≥7.0% n = 25 099 |
P valuea |
|---|---|---|---|---|
| Age (years), mean ± SD | 45.9 (17.0) | 50.1 (16.8) | 44.9 (16.9) | <0.001 |
| Age group (years), % | <0.001 | |||
| 18–25 | 15.6 | 9.2 | 17.3 | |
| 26–49 | 40.5 | 38.0 | 41.1 | |
| 50–64 | 28.8 | 30.8 | 28.2 | |
| ≥65 | 15.1 | 22.0 | 13.4 | |
| Female, % | 48.9 | 46.2 | 49.6 | <0.001 |
| Race, % | <0.001 | |||
| African American | 7.0 | 5.4 | 7.5 | |
| Asian | 0.7 | 0.8 | 0.7 | |
| Caucasian | 88.1 | 90.3 | 87.6 | |
| Other or unknown | 4.1 | 3.5 | 4.3 | |
| Insurance type, % | <0.001 | |||
| Commercial | 57.5 | 57.7 | 57.4 | |
| Medicare | 15.7 | 20.1 | 14.6 | |
| Medicaid | 7.6 | 4.4 | 8.4 | |
| Other payer type | 2.5 | 2.3 | 2.6 | |
| Uninsured | 2.1 | 1.7 | 2.3 | |
| Unknown | 14.7 | 14.3 | 14.8 | |
| Smoking status, % | <0.001 | |||
| Current | 14.1 | 9.6 | 15.3 | |
| Former | 25.4 | 26.3 | 25.1 | |
| Never | 50.4 | 54.2 | 49.4 | |
| Missing or unknown | 10.2 | 9.9 | 10.2 | |
| Alcohol use, % | <0.001 | |||
| Yes | 24.0 | 24.4 | 23.9 | |
| No | 18.7 | 16.8 | 19.1 | |
| Unknown | 57.4 | 58.8 | 57.0 | |
| BMI (kg/m2),b mean ± SD | 28.3 ± 6.5 | 28.1 ± 6.5 | 28.4 ± 6.5 | <0.001 |
| BMI (kg/m2) category, % | <0.001 | |||
| Normal: <25 | 31.9 | 33.6 | 31.5 | |
| Overweight: 25 to <30 | 33.8 | 35.2 | 33.4 | |
| Obese: ≥30 | 31.8 | 28.9 | 32.5 | |
| SBP (mmHg),b mean ± SD | 124.7 ± 17.0 | 123.7 ± 16.8 | 124.9 ± 17.0 | <0.001 |
| SBP (mmHg) category, % | <0.001 | |||
| <120 | 37.6 | 39.6 | 37.0 | |
| 120–129 | 26.8 | 27.4 | 26.7 | |
| 130–139 | 17.3 | 16.6 | 17.5 | |
| ≥140 | 16.4 | 14.6 | 16.8 | |
| eGFR (mL/min/1.73m2),b , c mean ± SD | 88.8 ± 28.5 | 83.2 ± 28.4 | 90.2 ± 28.4 | <0.001 |
| eGFR (mL/min/1.73m2) stage, % | <0.001 | |||
| G1 ≥ 90 | 45.8 | 39.4 | 47.4 | |
| G2 60–89 | 26.9 | 30.2 | 26.1 | |
| G3a 45–59 | 6.3 | 7.2 | 6.1 | |
| G3b 30–44 | 4.0 | 4.7 | 3.8 | |
| G4 15–29 | 1.8 | 2.5 | 1.6 | |
| G5 <15 | 1.4 | 2.3 | 1.2 | |
| Charlson Comorbidity Index,d mean ± SD | 0.5 ± 1.2 | 0.6 ± 1.4 | 0.5 ± 1.1 | <0.001 |
| Comorbidity, % | ||||
| Chronic pulmonary disease | 8.7 | 8.3 | 8.8 | 0.216 |
| Mild liver disease | 2.9 | 2.9 | 2.9 | 0.879 |
| Moderate or severe liver disease | 0.3 | 0.6 | 0.2 | <0.001 |
| Renal disease | 11.9 | 13.8 | 11.4 | <0.001 |
| Hypertension | 45.1 | 47.0 | 44.6 | 0.001 |
| Hyperlipidaemia | 52.1 | 52.7 | 51.9 | 0.274 |
| Depression | 17.7 | 13.6 | 18.8 | <0.001 |
Abbreviations: BMI, body mass index; CKD, chronic kidney disease; CONTROL, optimal glycaemic control; DBP, diastolic blood pressure; eGFR, estimated glomerular filtration rate; SBP, systolic blood pressure; SD, standard deviation; S‐CONTROL, suboptimal glycaemic control; T1D, type 1 diabetes.
Kruskal‐Wallis test for continuous variables and χ2 test for categorical variables.
Some patients had missing data. Summary statistics were calculated using patients with valid measurements only. BMI: n = 30 644 (97.5%); SBP: n = 30 815 (98.0%); eGFR: n = 27 088 (86.2%).
Average eGFR calculated from the serum creatinine laboratory values during baseline period by using the 2009 CKD‐EPI creatinine equation.
Charlson Comorbidity Index is a validated measure of morbidity.9
Figure 1.
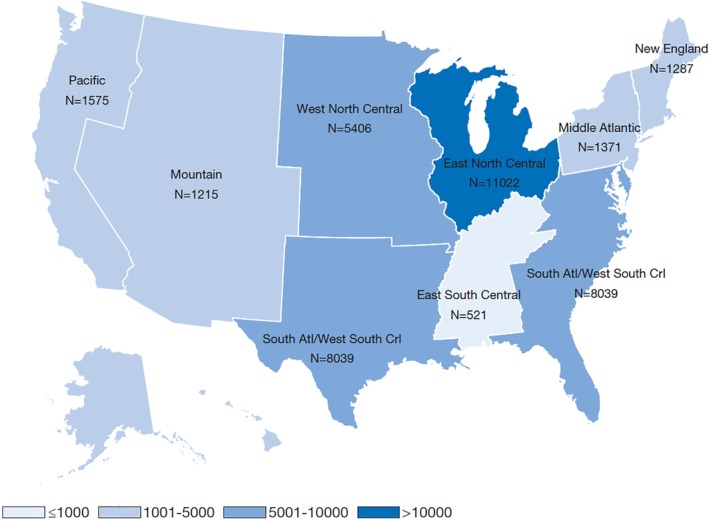
Baseline geographic distribution (by census division) of the T1PCO population. Pacific: Alaska, California, Hawaii, Oregon, and Washington; Mountain: Arizona, Colorado, Idaho, Montana, Nevada, New Mexico, Utah, and Wyoming; West North Central: Iowa, Kansas, Minnesota, Missouri, Nebraska, North Dakota, and South Dakota; South Atlantic: Delaware, Florida, Georgia, Maryland, North Carolina, South Carolina, Virginia, District of Columbia, and West Virginia; West South Central: Arkansas, Louisiana, Oklahoma, and Texas; East North Central: Illinois, Indiana, Michigan, Ohio, and Wisconsin; East South Central: Alabama, Kentucky, Mississippi, and Tennessee; Middle Atlantic: New Jersey, New York, and Pennsylvania; New England: Connecticut, Maine, Massachusetts, New Hampshire, Rhode Island and Vermont
3.2. Comparisons between patients with optimal and suboptimal glycaemic control
At baseline, 20% (n = 6331) of the study population with optimal glycaemic control (HbA1c <7.0% [<53 mmol/mol]) formed the CONTROL group. The S‐CONTROL group comprised the 80% (n = 25 099) of patients who had HbA1c ≥7.0% (≥53 mmol/mol). Patients in the CONTROL group had a mean ± SD HbA1c of 6.4% ± 0.5% (46 ± 5.5 mmol/mol), and patients in the S‐CONTROL group a mean ± SD HbA1c of 8.8% ± 1.6% (73 ± 17.5 mmol/mol) at baseline. Patients in the S‐CONTROL group versus the CONTROL group were younger (mean age 45 vs. 50 years, P < 0.001; percentage of patients aged ≥50 years, 42% vs. 53%) and probably female (50% vs. 46%, P < 0.001) or African American (8% vs. 5%) (Table 1). A higher proportion of patients in the S‐CONTROL group were insured by Medicaid (8% vs. 4%). Patients in the S‐CONTROL group were more likely to have a diagnosis of depression (19% vs. 14%, P < 0.001; Table 1) and to use antidepressant or antianxiety medications (26% vs. 21%, P < 0.001). Compared with patients in the CONTROL group, those in the S‐CONTROL group had a lower mean CCI score (0.5 vs. 0.6, P < 0.001).
A comparison of CV risk factors between the groups is shown in Figure 2(A). Patients in the S‐CONTROL group versus the CONTROL group were younger and less likely to have renal dysfunction, but were more likely to have uncontrolled hypertension (SBP ≥140 mmHg: 16.8% vs. 14.6%), be obese (BMI ≥30 kg/m2: 32.5% vs. 28.9%), and be current smokers (15.3% vs. 19.6%). Incidences of CV events (related to hospitalization) were mostly comparable in the S‐CONTROL and CONTROL groups, but peripheral arterial disease (0.5% vs. 0.7%, P = 0.018) and congestive heart failure (0.4% vs. 0.6%, P = 0.018) were more common in the CONTROL group (Figure 2B).
Figure 2.
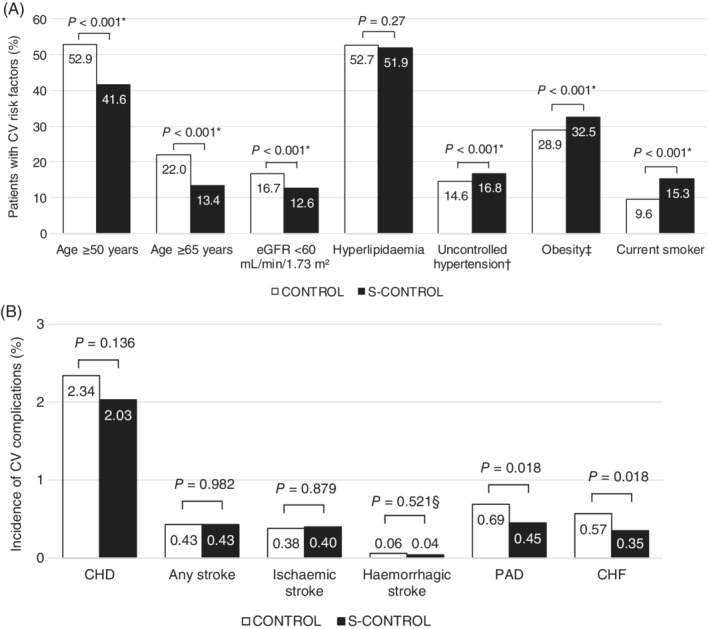
Percentages of patients with CV risk factors and complications in the CONTROL and S‐CONTROL groups. A, Prevalence of CV risk factors. B, Incidence of CV complications. Abbreviations: BMI, body mass index; CHD, coronary heart disease; CHF, congestive heart failure; CONTROL, optimal glycaemic control; CV, cardiovascular; eGFR, estimated glomerular filtration rate; PAD, peripheral arterial disease; SBP, systolic blood pressure; S‐CONTROL, suboptimal glycaemic control. *P values are for category distributions rather than the comparisons shown. †Uncontrolled hypertension was defined as SBP ≥140 mmHg. ‡Obesity was defined as BMI ≥30 kg/m2. §Fisher exact test for categorical variables with one or more cells with <5 counts
Compared with the CONTROL group, the S‐CONTROL group contained a higher proportion of patients who experienced SH (6% vs. 4%, P < 0.001) or DKA (7% vs. 1%, P < 0.001) during the baseline period (Figure 3A). Microvascular complications of diabetes were more common in the S‐CONTROL group, which had a higher prevalence of neuropathy (10% vs. 9%, P < 0.001), nephropathy (10% vs. 9%, P = 0.024) and retinopathy (18% vs. 17%, P = 0.016) than the CONTROL group (Figure 3B).
Figure 3.
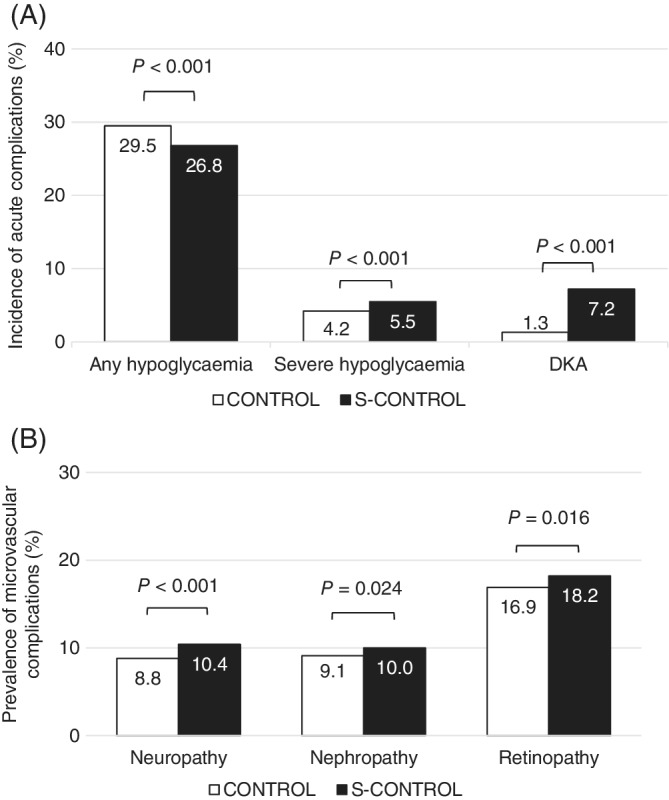
Percentages of patients with complications in the CONTROL and S‐CONTROL groups. (A) Incidence of acute complications and (B) prevalence of microvascular complications. Abbreviations: CONTROL, optimal glycaemic control; DKA, diabetic ketoacidosis; S‐CONTROL, suboptimal glycaemic control
The S‐CONTROL group (vs. the CONTROL group) had a higher proportion of patients who experienced hospitalization (18% vs. 13%, P < 0.001) (Figure 4), but for those with ≥1 hospitalization, a shorter mean length of stay (11 vs. 14 days, P = 0.001). Emergency department visits were more frequent in the S‐CONTROL group versus the CONTROL group (24% vs. 17%, P < 0.001). However, in the 12‐month baseline period, a lower proportion of patients visited an ophthalmologist in the S‐CONTROL group (15% vs. 18%, P < 0.001).
Figure 4.
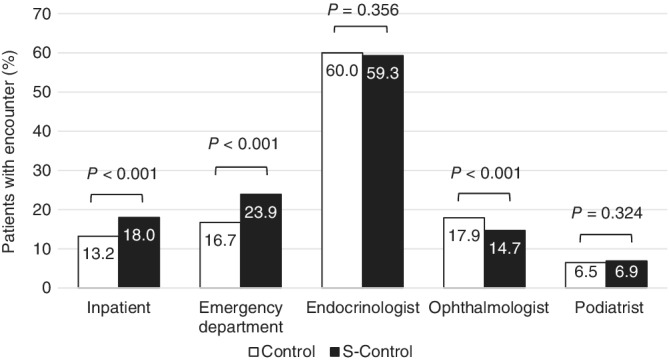
Percentages of patients with ≥1 inpatient, emergency department or endocrinologist encounter during the 12‐month baseline period in the optimal glycaemic control and suboptimal glycaemic control groups
4. DISCUSSION
The T1PCO study used EHR data to illustrate the sociodemographic and clinical features of adults with T1D in the United States treated in a real‐world clinical setting. With >30 000 patients in the final sample, this is, to our knowledge, the largest real‐world study to date of adults with T1D. As EHR data reflect everyday clinical care of patients treated in health care systems, and are more accessible for research than other data sources, we designed the T1PCO study to demonstrate that EHR data can be a valid and robust data source to study patients with T1D. Complementing the results from previous T1D Exchange database studies, the T1PCO study provides a “reality check” on average adults with T1D, and the current analysis shows how patients with optimal and suboptimal glycaemic control differ, including acute and chronic micro‐ and macrovascular disease, comorbidities, ethnicity and health care resource utilization.
Only 20% of our study population met the glycaemic goal of ADA for HbA1c <7.0% (<53 mmol/mol).8 This is similar to, but slightly worse than, the 22% of adults in the T1D Exchange Registry.12 Unlike the T1D Exchange Registry, in which every patient was seen by an endocrinologist, only three of five patients in our cohort saw a diabetes specialist. This ratio is more reflective of diabetes care in the United States, and thus may paint a greater real‐world picture.
We found that patients with suboptimal versus optimal glycaemic control were younger, more obese, more likely to experience T1D complications, and more likely to incur hospitalization and/or emergency department visits. These findings confirm and strengthen those from previous studies.12, 13, 14, 15
We also found that a higher proportion of patients with suboptimal control had depression, although the conditions may have a reciprocal relationship. Previous studies among adolescents and young adults16, 17 have postulated that depression can result in suboptimal glycaemic control. Meanwhile, suboptimal glycaemic control could be mediated, at least in part, by decreased self‐care behaviour in patients with a more depressive mood.18
In the current study, patients with suboptimal glycaemic control were more likely to have certain CV risk factors (uncontrolled hypertension, obesity and smoking) but were younger and less likely to have renal insufficiency than those with optimal glycaemic control. These opposing sets of CV risk factors may account for the comparable rates of coronary heart disease and stroke among patients with optimal and suboptimal glycaemic control. However, there is a long‐standing debate about the role of glycaemic control in CV disease for patients with T1D. The EDIC study demonstrated that intensive antihyperglycaemic treatment reduces the risk of CV events in patients with T1D5; however, our study found that the optimal and suboptimal control groups had a similar risk of CV events. This finding may echo the commonly held belief18 that glycaemic control affects microvascular complications much more than macrovascular events. CV disease remains the number one cause of mortality in T1D, but the risk is not completely explained by hyperglycaemia.19 Patients with T1D with ideal glycaemic control (HbA1c <7% [53 mmol/mol]) still have an approximately twofold increased risk of CV disease compared with people without diabetes.20 Therefore, factors beyond glycaemic control may be playing a role. This is particularly important given the emphasis that health care providers place on glycaemic control for patients. It may act as a reminder that blood pressure control and lipid management can more profoundly affect CV events. Limitations of our findings are the relatively young ages of the patients and the low number of CV events. Further research using multivariate methods to examine the interplay between glycaemic control and risk of these CV events is warranted.
In discussing SH, DKA and microvascular complications, the ADA recommends less strict glycaemic control in certain populations to avoid hypoglycaemia.8 However, individuals with higher HbA1c values were not protected from SH but were, in fact, at greater risk of SH. In other words, no HbA1c level is “safe” from SH, so health care providers should not be reassured by an HbA1c value when assessing hypoglycaemia risk. Additionally, DKA events were more common in patients with suboptimal versus optimal glycaemic control. This is generally in line with previous findings, such as those from the T1D Exchange Registry12, 13 and the DPV Registry.21 Increased DKA incidence with poorer glycaemic control has also been reported in a recent systematic literature review that examined DKA among adults with T1D,3 and moreover in an international comparison of paediatric patients with T1D.22
Corroborating previous findings, we found suboptimal glycaemic control to be associated with a significantly higher prevalence of nephropathy and retinopathy.5 As microvascular complications are expected to increase with disease duration (and age), any association between glycaemic control and microvascular events may have been diminished by the fact that our optimal control group was older than the suboptimal control group.5 The prevalence of microvascular complications by age group and glycaemic control has been previously reported.23
Health care resource utilization is an important factor, as patients with suboptimal glycaemic control were more likely to be uninsured or “underinsured” (on Medicaid) than those with optimal glycaemic control. A key question is to what degree does this difference in insurance coverage play a causative role in patients having poorer glycaemic control? Interestingly, despite being underinsured, no difference in endocrinologist visits was observed between the two groups. Thus, it appears that despite differences in insurance coverage, both groups had access to specialist diabetes care. However, although patients with suboptimal control had more eye complications, this group was less likely to be seen by an ophthalmologist. It is unclear whether this was the result of access issues, patients being less likely to be referred, or other causes. It seems reasonable to state that the differences in overall health and glycaemic control cannot be explained simply by differences in insurance coverage or access to health care.
Patients with suboptimal glycaemic control had more acute care visits, e.g. emergency department encounters and inpatient hospitalizations, but a shorter total length of stay among those with hospitalization. Patients with suboptimal control also had a higher risk of short‐ and long‐term complications resulting in emergency department and inpatient visits, but were younger with less comorbid conditions, which could explain why total length of stay was shorter than for patients with optimal glycaemic control.
There are some limitations to note. The ADA‐recommended HbA1c cut‐off of 7.0% (53 mmol/mol),8 which was used to classify optimal and suboptimal glycaemic control, was applied to all patients, regardless of their individual goals. As the study population was identified using ICD‐9/10 codes (Table S2; see Supporting Information), there is potential for errors in coding or record‐keeping. We could not validate patient charts, so there may have been diagnosis misclassifications. However, we used the adapted Klompas and Ginde algorithms to reduce the risk of misclassification of T1D and acute complications, respectively.7, 10 Hypoglycaemia is typically under‐reported in claims and EHR data, particularly non‐SH.24 Its true incidence could therefore be much higher than was captured by ICD codes and plasma glucose. Furthermore, some hypoglycaemia events identified by laboratory testing could have been secondary to treatment. Microvascular complications were identified using ICD codes, which could lead to an underestimation, particularly for retinopathy, as many ophthalmology practices do not integrate their EHR data. Duration of T1D is an important factor for the development of micro‐ and macrovascular diabetes complications.25 However, this was not robustly captured in the EHR data, although age can be used as a proxy. Data on administrative and drug costs were not available, and out‐of‐network encounters were not captured. In addition, some regions were under‐ or over‐represented in the sample (Figure 1) due to the geographic distribution and size of the various IDNs. Insulin pump use and continuous glucose‐monitoring data were not robustly captured in the EHR data; further analyses are warranted to explore these factors. Lastly, the current study was a descriptive analysis of EHRs of adults with T1D in the United States. To the best of our knowledge, this is the first step in positioning EHRs as a valid data source to study a broader, more “real‐world” T1D population. Future studies using a multivariate approach, a large sample size and ample clinical information will be valuable for the study of risk factors for acute and chronic complications in patients with T1D.
5. CONCLUSIONS
The present analysis used EHR data from a large sample of real‐world clinical practices to demonstrate that adults with T1D and suboptimal glycaemic control (HbA1c >7% [53 mmol/mol]) were more likely to be African American, uninsured or under‐insured, have other comorbidities (uncontrolled hypertension, obesity and depression) and be smokers. They would probably also have acute and chronic complications of diabetes, including SH, DKA and microvascular disease. Patients with suboptimal control also used more acute health care resources (inpatient and emergency department visits). However, despite worse glycaemic control and increases in some CV risk factors (uncontrolled hypertension and smoking), no increase in CV disease was seen in the suboptimal control group. This study includes the largest cohort of adults with T1D in the United States to date and paints a “real‐world” picture of factors associated with poor glycaemic control in such patients.
CONFLICT OF INTEREST
J.H.P. is a consultant for Diasome, Insulet, Lexicon, Lilly, MannKind, Novo Nordisk, Sanofi and Senseonics. F.L.Z., R.P. and S.P. are employees and stockholders of Sanofi. L.S. and K.M. are employees of Evidera, under contract with Sanofi. P.H. was an employee of Evidera during the time the study was conducted, under contract with Sanofi. K.M.M. has no potential conflicts of interest to declare. S.V.E. is a medical advisor for AstraZeneca, BrightSight, InPen, Lexicon, Lilly USA LLC, MannKind, Merck, Novo Nordisk and Sanofi; is a speaker for AstraZeneca, Lilly USA LLC, MannKind, Merck and Sanofi; and is an advisory board member for Senseonics and TeamType1.
AUTHOR CONTRIBUTIONS
F.L.Z. and K.M. designed the study. L.S. and P.H. acquired and analysed the data. All authors contributed to the data interpretation, drafting, critical review, and revision of the manuscript.
Supporting information
Appendix S1: Supporting information
ACKNOWLEDGMENTS
This study was funded by Sanofi. The authors received writing/editorial support from Yunyu Huang, PhD, of Excerpta Medica, funded by Sanofi.
Pettus JH, Zhou FL, Shepherd L, et al. Differences between patients with type 1 diabetes with optimal and suboptimal glycaemic control: A real‐world study of more than 30 000 patients in a US electronic health record database. Diabetes Obes Metab. 2020;22:622–630. 10.1111/dom.13937
Parts of this analysis were presented in abstract and poster form at the Academy of Managed Care Pharmacy (AMCP) Nexus 2018 meeting, 22‐25 October 2018 in Orlando, Florida.
Peer Review The peer review history for this article is available at https://publons.com/publon/10.1111/dom.13937.
Funding information Sanofi
REFERENCES
- 1. Bullard KM, Cowie CC, Lessem SE, et al. Prevalence of diagnosed diabetes in adults by diabetes type—United States, 2016. MMWR Morb Mortal Wkly Rep. 2018;67:359‐361. [DOI] [PMC free article] [PubMed] [Google Scholar]
- 2. Dhaliwal R, Weinstock RS. Management of type 1 diabetes in older adults. Diabetes Spectr. 2014;27:9‐20. [DOI] [PMC free article] [PubMed] [Google Scholar]
- 3. Fazeli Farsani S, Brodovicz K, Soleymanlou N, Marquard J, Wissinger E, Maiese BA. Incidence and prevalence of diabetic ketoacidosis (DKA) among adults with type 1 diabetes mellitus (T1D): a systematic literature review. BMJ Open. 2017;7:e016587. [DOI] [PMC free article] [PubMed] [Google Scholar]
- 4. Gubitosi‐Klug RA, Braffett BH, White NH, et al. Diabetes Control and Complications Trial (DCCT)/Epidemiology of Diabetes Interventions and Complications (EDIC) Research Group. Risk of severe hypoglycemia in type 1 diabetes over 30 years of follow‐up in the DCCT/EDIC study. Diabetes Care. 2017;40:1010‐1016. [DOI] [PMC free article] [PubMed] [Google Scholar]
- 5. Nathan DM, Zinman B, Cleary PA, et al. Diabetes Control and Complications Trial/Epidemiology of Diabetes Interventions and Complications (DCCT/EDIC) Research Group. Modern‐day clinical course of type 1 diabetes mellitus after 30 years’ duration: the diabetes control and complications trial/epidemiology of diabetes interventions and complications and Pittsburgh epidemiology of diabetes complications experience (1983‐2005). Arch Intern Med. 2009;169:1307‐1316. [DOI] [PMC free article] [PubMed] [Google Scholar]
- 6. Wallace PJ, Shah ND, Dennen T, Bleicher PA, Crown WH. Optum Labs: building a novel node in the learning health care system. Health Aff. 2014;33:1187‐1194. [DOI] [PubMed] [Google Scholar]
- 7. Klompas M, Eggleston E, McVetta J, Lazarus R, Li L, Platt R. Automated detection and classification of type 1 versus type 2 diabetes using electronic health record data. Diabetes Care. 2013;36:914‐921. [DOI] [PMC free article] [PubMed] [Google Scholar]
- 8. American Diabetes Association . 6. Glycemic Targets: Standards of Medical Care in Diabetes—2019. Diabetes Care. 2019;42(Suppl 1):S61‐S70. [DOI] [PubMed] [Google Scholar]
- 9. Charlson ME, Pompei P, Ales KL, MacKenzie CR. A new method of classifying prognostic comorbidity in longitudinal studies: development and validation. J Chronic Dis. 1987;40:373‐383. [DOI] [PubMed] [Google Scholar]
- 10. Ginde AA, Blanc PG, Lieberman RM, Camargo CA Jr. Validation of ICD‐9‐CM coding algorithm for improved identification of hypoglycemia visits. BMC Endocr Disord. 2008;8:4. [DOI] [PMC free article] [PubMed] [Google Scholar]
- 11. Bobo WV, Cooper WO, Epstein RA Jr, Arbogast PG, Mounsey J, Ray WA. Positive predictive value of automated database records for diabetic ketoacidosis (DKA) in children and youth exposed to antipsychotic drugs or control medications: a Tennessee Medicaid study. BMC Med Res Methodol. 2011;11:157. [DOI] [PMC free article] [PubMed] [Google Scholar]
- 12. Foster NC, Beck RW, Miller KM, et al. State of type 1 diabetes management and outcomes from the T1D Exchange in 2016‐2018. Diabetes Technol Ther. 2019;21:66‐72. [DOI] [PMC free article] [PubMed] [Google Scholar]
- 13. Simmons JH, Chen V, Miller KM, et al. T1D Exchange Clinic Network. Differences in the management of type 1 diabetes among adults under excellent control compared with those under poor control in the T1D Exchange Clinic Registry. Diabetes Care. 2013;36:3573‐3577. [DOI] [PMC free article] [PubMed] [Google Scholar]
- 14. Miller KM, Foster NC, Beck RW, et al. T1D Exchange Clinic Network. Current state of type 1 diabetes treatment in the U.S.: updated data from the T1D Exchange Clinic Registry. Diabetes Care. 2015;38:971‐978. [DOI] [PubMed] [Google Scholar]
- 15. Hofer SE, Miller K, Hermann JM, et al. DPV Initiative and the T1D Exchange Clinic Network. Response to comment on Hofer et al. International comparison of smoking and metabolic control in patients with type 1 diabetes. Diabetes Care. 2016;39:e177‐e178. [DOI] [PubMed] [Google Scholar]
- 16. Santos FR, Bernardo V, Gabbay MA, Dib SA, Sigulem D. The impact of knowledge about diabetes, resilience and depression on glycemic control: a cross‐sectional study among adolescents and young adults with type 1 diabetes. Diabetol Metab Syndr. 2013;5:55. [DOI] [PMC free article] [PubMed] [Google Scholar]
- 17. Baucom KJW, Turner SL, Tracy EL, Berg CA, Wiebe DJ. Depressive symptoms and diabetes management from late adolescence to emerging adulthood. Health Psychol. 2018;37:716‐724. [DOI] [PMC free article] [PubMed] [Google Scholar]
- 18. Schmitt A, Reimer A, Hermanns N, et al. Depression is linked to hyperglycaemia via suboptimal diabetes self‐management: A cross‐sectional mediation analysis. J Psychosom Res. 2017;94:17‐23. [DOI] [PubMed] [Google Scholar]
- 19. Lind M, Svensson AM, Kosiborod M, et al. Glycemic control and excess mortality in type 1 diabetes. N Engl J Med. 2014;371:1972‐1982. [DOI] [PubMed] [Google Scholar]
- 20. Rawshani A, Sattar N, Franzén S, et al. Excess mortality and cardiovascular disease in young adults with type 1 diabetes in relation to age at onset: a nationwide, register‐based cohort study. Lancet. 2018;392:477‐486. [DOI] [PMC free article] [PubMed] [Google Scholar]
- 21. Kalscheuer H, Seufert J, Lanzinger S, et al. DPV Initiative. Event rates and risk factors for the development of diabetic ketoacidosis in adult patients with type 1 diabetes: analysis from the DPV registry based on 46,966 patients. Diabetes Care. 2019;42:e34‐e36. [DOI] [PubMed] [Google Scholar]
- 22. Maahs DM, Hermann JM, Holman N, et al. National Paediatric Diabetes Audit and the Royal College of Paediatrics and Child Health, the DPV Initiative, and the T1D Exchange Clinic Network. Rates of diabetic ketoacidosis: international comparison with 49,859 pediatric patients with type 1 diabetes from England, Wales, the U.S., Austria, and Germany. Diabetes Care. 2015;38:1876‐1882. [DOI] [PubMed] [Google Scholar]
- 23. Pettus JH, Zhou FL, Shepherd L, et al. Incidences of severe hypoglycemia and diabetic ketoacidosis and prevalence of microvascular complications stratified by age and glycemic control in U.S. adult patients with type 1 diabetes: A real‐world study. Diabetes Care. 2019;42:2220‐2227. [DOI] [PubMed] [Google Scholar]
- 24. Unger J. Uncovering undetected hypoglycemic events. Diabetes Metab Syndr Obes. 2012;5:57‐74. [DOI] [PMC free article] [PubMed] [Google Scholar]
- 25. Tonnies T, Stahl‐Pehe A, Baechle C, et al. Risk of microvascular complications and macrovascular risk factors in early‐onset type 1 diabetes after at least 10 years duration: an analysis of three population‐based cross‐sectional surveys in Germany between 2009 and 2016. Int J Endocrinol. 2018;2018:7806980. [DOI] [PMC free article] [PubMed] [Google Scholar]
Associated Data
This section collects any data citations, data availability statements, or supplementary materials included in this article.
Supplementary Materials
Appendix S1: Supporting information