

Abstract
Scope
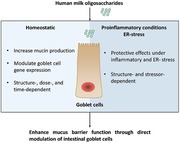
Human milk oligosaccharides (hMOs) have beneficial effects on intestinal barrier function, but the mechanisms of action are not well understood. Here, the effects of hMOs on goblet cells, which indicate that some hMOs may enhance mucus barrier function through direct modulation of goblet cell function, are studied.
Methods and results
The modulatory effects of 2′‐fucosyllactose (2′‐FL), 3‐fucosyllactose (3‐FL), lacto‐N‐triaose II (LNT2), and galacto‐oligosaccharides (GOS) on the expression of goblet cell secretory related genes MUC2, TFF3, and RETNLB, and the Golgi‐sulfotransferase genes CHST5 and GAL3ST2 of LS174T are determined by real‐time quantitative RT‐PCR. 3‐FL, LNT2, and GOS‐modulated LS174T gene expression profiles in a dose‐ and time‐dependent manner. In addition, the upregulation of MUC2 is confirmed by immunofluorescence staining. Effects of 2′‐FL, 3‐FL, LNT2, and GOS on gene transcription of LS174T are also assessed during exposure to TNF‐α, IL‐13, or tunicamycin. During TNF‐α challenge, 3‐FL and LNT2 enhance MUC2 and TFF3 gene expression. After IL‐13 exposure, 2′‐FL, 3‐FL, and LNT2 all show upregulating effects on MUC2; 3‐FL and LNT2 also enhance TFF3 expression. LNT2 significantly reverses Tm‐induced downregulation of TFF3, RETNLB, and CHST5.
Conclusion
The findings indicate that hMOs may enhance mucus barrier function through direct modulation of intestinal goblet cells. Effects are structure‐ and stressor‐dependent.
Keywords: ER‐stress, goblet cells, human milk oligosaccharides, inflammatory condition, mucus barrier
Human milk oligosaccharides (hMOs) are considered to enhance gut barrier function, but the mechanisms of action are not well understood. The effects of 2′‐fucosyllactose, 3‐fucosyllactose, and lacto‐N‐triaose II are tested on goblet cells under different conditions. The results indicate that hMOs enhance mucus barrier function through direct modulation of intestinal goblet cells in a structure‐ and inflammatory‐condition‐dependent manner.
1. Introduction
Breastfeeding is the gold standard for infant nutrition. The World Health Organization (WHO) recommends that infants should be exclusively breastfed for the first 6 months of life.1, 2 It has been shown, for example, that breastfed infants have a lower risk of infection and inflammation than formula‐fed babies.3, 4 Although breastfeeding is highly recommended, breastfeeding is not always possible. About 70% of the infants cannot be solely fed with breastfeeding for a variety of reasons.5 These infants receive cow's milk derived infant formulas, which attempts to mimic the nutritional composition of breast milk as closely as possible.6, 7 Important mother milk components for neonatal gastrointestinal development are human milk oligosaccharides (hMOs).8 The high concentration and structural diversity of hMOs are unique to human, and >200 hMOs have been identified up to now.9 Currently nondigestible fibers such as galacto‐oligosaccharides (GOS) and inulins are being used to substitute for hMO in infant feeding,10 but some hMOs are now also being produced in sufficiently high amounts allowing application in infant formula.11
Several studies show that hMOs provide a variety of health‐promoting effects.9, 12, 13 These health effects vary from promoting gut microbiota development,14 reducing pathogenic infections by acting as anti‐adhesive molecules,15 supporting immune development,16, 17 supporting brain development and cognition,18, 19 and enhancing gut barrier function.13 The latter, gut barrier function, is provided by tightly connected epithelial cells and mucus. hMOs are known to enhance epithelial barrier,20, 21 but the relative effects of individual oligosaccharides on stimulate mucus function have not been studied yet. HMOs are also subject to modifications during passage through the gastrointestinal tract. It has been shown that hMOs are slightly hydrolyzed at low pH during transit through the gastrointestinal tract.22 This may lead to the production of lacto‐N‐triose II(LNT2), which is the acid hydrolysate of the tetra and higher hMOs such as lacto‐N‐tetraose (LNT) and lacto‐N‐neotetraose (LNnT).22, 23, 24 How these acid hydrolysates impact mucus is also not known.
Mucus is produced by goblet cells that are columnar epithelial cells found on the villus and mainly responsible for the secretion of gel forming mucins, the principal barrier between the lumen and the underlying epithelial cells.25, 26 Mucin 2 (MUC2) is the major component of mucus that is produced and secreted by intestinal goblet cells.27 In addition to mucin production, goblet cells also produce two other important proteins: intestinal trefoil factor (TFF) and resistin‐like molecules (RELMs), which stabilize the mucin polymer and regulate mucin secretion.28 TFF3 has an important role in protecting the intestinal mucosa and has been shown to be essential for restitution.29 RELMβ is an intestine‐specific protein encoded by the gene RETNLB, expressed in the small and large intestine, within epithelial cells and, in particular, in goblet cells.30 RELMβ also regulates innate colonic functions such as barrier integrity and inflammation susceptibility.31 As a late step in mucus biosynthesis, mucin sulfation occurs within the trans‐Golgi apparatus.32 Carbohydrate sulfotransferase 5 (CHST5) and galactose‐3‐O‐sulfotransferase 2 (GAL3ST2), which are expressed in goblet cells, are involved in intestinal mucin sulfation.33, 34
Mucin synthesis and secretion, in goblet cell function, are influenced by a number of inflammatory events.35 The proinflammatory cytokine TNF‐α, which is involved in the pathogenesis of inflammatory bowel diseases (IBD), impacts gene expression and goblet cell function.35 The Th2 cytokine IL‐13 is also associated with mucus function as it prevents intestinal helminth infection by enhancing the mucus barrier via stimulating the mucus production in goblet cells.36 Besides immune mediators, endoplasmic reticulum (ER) stress has been considered as a major contributor to the pathogenesis of IBD.37 The N‐glycosylation inhibitor, tunicamycin (Tm), which disrupts mucin glycosylation and induce ER stress in goblet cells, has been shown to induce abnormal mucus synthesis in goblet cells.38, 39 All these stressors have been applied to test the rescuing effects of the most abundant hMOs in mother milk, i.e., 2′‐FL, 3‐FL, and the hMOs acid hydrolysate LNT2 on goblet cell function.
Effects of hMOSs were compared to effects of GOS, which is currently being applied in infant formula as a substitute for hMOs and known to enhance intestinal barrier function through the modulation of goblet cells.40 We examined gene expression alterations of the goblet cell secretory related genes MUC2, TFF3, and RETNLB, and the Golgi‐sulfotransferase genes CHST5 and GAL3ST2 in the human goblet cell line LS174T.35, 38, 40 In order to further explore the modulatory effects of 2′‐FL, 3‐FL, LNT2, and GOS on goblet cell functions under challenged physiological conditions, we also examined the effects of 2′‐FL, 3‐FL, LNT2, and GOS on gene expression when goblet cells were exposed to cytokines (TNF‐α or IL‐13) as well as to the ER‐stressor and mucus damaging agent Tm.
2. Experimental Section
Experimental procedures are described in detail in the Supporting Information.
2.1. Components
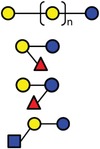
In the present study, GOS, 2′‐FL (provided by FrieslandCampina Domo, Amersfoort, the Netherlands), 3‐FL, and LNT2 (provided by Glycosyn LLC, Woburn, MA, USA) were tested. An overview of the structure and components of GOS, two hMOs (2′‐FL and 3‐FL), and one hMO acid hydrolysis (LNT2) is shown in Table 1.
Table 1.
Overview of the structure of selected samples
| Name (abbreviated) | Structure | Schematic diagram |
|---|---|---|
| GOS | Gal‐(Gal)n‐Glc |
|
| 2’‐FL | Fucα1‐2Galβ1‐4Glc | |
| 3‐FL |
Galβ1‐4Glc Fucα1‐3/ |
|
| LNT2 | GlcNAcβ1‐3Galβ1‐4Glc |


2.2. Cell Culture and Reagents
The human colorectal cancer cell line LS174T was obtained from American Type Culture Collection and maintained in MEM eagle medium (Lonza, Verviers, Belgium) supplemented with 10% heat‐inactivated fetal bovine serum (Sigma–Aldrich, St. Louis, MO), 2 mm l‐glutamine (Lonza, Verviers, Belgium), and 60 μg mL–1 gentamicin sulfate (Lonza, Verviers, Belgium). Cells were cultured at 37 °C in 5% CO2 as recommended by the manufacturer. Recombinant human TNF‐α and IL‐13 were obtained from PeproTech (Rocky Hill, NJ, USA). Tm was supplied by Sigma–Aldrich.
2.3. Cells Treatment and Dosage Information
LS174T cells were resuspended in fresh culture medium at 3 × 10⁵ cells mL–1, after which 1 mL of cell suspension was seeded per well in 24‐well plates (Corning, NY, USA). Cells were then cultured until reaching 70–80% confluence. Prior to treatment, cells were washed twice with 1× PBS (Lonza, Verviers, Belgium), after which culture medium was replaced by 1 mL of fresh medium containing one of the ingredients. For optimizing dosing, LS174T cells were incubated with 1, 5, 10, and 15 mg mL–1 of 2′‐FL, 3‐FL, LNT2, and GOS for 72 h, and 10 mg mL–1 was used for all subsequent experiments. LS174T cells were treated with 10 mg mL–1 GOS, 2′‐FL, 3‐FL, and LNT2 in the absence or presence of cytokines or Tm. Cell culture medium containing TNF‐α (10 ng mL–1), IL‐13 (5 ng mL–1), or Tm (1 μg mL–1) were used the challenge. Cells were incubated with different stimuli for the time periods indicated in the figure captions.
2.4. RNA Isolation and Reverse Transcription
At the end of the stimulation, LS174T cells were homogenized with TRIzol reagent (Life Technologies, Carlsbad, CA, USA). Total RNA was isolated following the manufacturer's instructions, and was reverse transcribed using SuperScript II Reverse Transcriptase (Invitrogen, Carlsbad, CA, USA). cDNA synthesized was used for performing quantitative PCR.
2.5. Gene Expression
The real‐time quantitative RT‐PCR was performed with primer and probe sets (TaqMan Gene Expression Assays) for different genes (MUC2 (Hs00159374_m1), TFF3 (Hs00173625_m1), RELMB (Hs00395669_m1), CHST5 (Hs00375495_m1), GAL3ST2 (Hs00223271_m1), and GUSB (Hs99999908_m1)) provided by Applied Biosystems (Foster City, USA) as previously described38, 40 and qPCR Mastermix Plus (Eurogentec, Seraing, Belgium). Reactions were carried out in 384‐well PCR plates (Thermo Scientific, UK) using ViiA7 Real‐Time PCR System (Applied Biosystems), and threshold cycle values were calculated by ViiA7 software. Expression levels of target genes were normalized to the housekeeping gene GUS‐β, and fold induction was calculated over untreated controls using the 2−ΔΔCt methods.
2.6. Statistical Analysis
The results were analyzed using GraphPad Prism. Normal distribution of the data was confirmed using the Kolmogorov–Smirnov test. Parametric values are expressed as mean ± SD, nonparametric values are presented as median ± range. Statistical comparisons of parametric distributed data were performed using one‐way ANOVA with Dunnett multiple comparison tests. Nonparametric distributed data were assessed using the Kruskal–Wallis test followed by the Dunn's test. p < 0.05 was considered as statistically significant (#, * p < 0.05; ##,** p < 0.01; ###,*** p < 0.001; ####,**** p < 0.0001).
3. Results
3.1. hMOs and hMO's Acid Hydrolysis Products Differently Modulated Goblet Cell Genes Expression in a Dose‐ and Time‐Dependent Way
To investigate whether hMOs 2′‐FL, 3‐FL, and the hMO acid hydrolysis product LNT2 can modulate goblet cell function, mRNA expression levels of mucus synthesis related genes (MUC2, TFF3, RETNLB, CHST5, and GAL3ST2) were analyzed in LS174T cells. Results were compared to GOS challenged LS174T cells as GOS is known to impact mucus related genes in goblet cells.40
For optimizing dosing, LS174T cells were incubated with 1, 5, 10, and 15 mg mL–1 of 2′‐FL, 3‐FL, LNT2, and GOS for 72 h. Gene expression was differently impacted by 2′‐FL, 3‐FL, LNT2, and GOS. As shown in Figure 1, 2′‐FL was not able to alter the mRNA levels of mucus synthesis‐related genes expression at any of the concentrations tested. With 3‐FL, 1 and 5 mg mL–1 of 3‐FL also did not show effects on gene expression, but at 10 mg mL–1, 3‐FL significantly enhanced the expression of MUC2 (1.6‐fold, p < 0.05, Figure 1A), TFF3 (1.7‐fold, p < 0.05, Figure 1B), and RETNLB (1.6‐fold, P < 0.01, Figure 1C). At 15 mg mL–1 3‐FL also upregulated TFF3 expression (1.9‐fold, p < 0.001, Figure 1B). LNT2 showed different modulation effects. MUC2 was upregulated at 5 mg mL–1 only by LNT2 (1.5‐fold, p < 0.01, Figure 1A) but not by higher concentrations. LNT2 at 5, 10, and 15 mg mL–1 significantly downregulated CHST5 expression to 0.8‐fold (p < 0.05), 0.6‐fold (p < 0.001), and 0.8‐fold (p < 0.05), respectively, compared to the control. Also, expression of GAL3ST2 was downregulated by incubating with 10 mg mL–1 (0.8‐fold, p < 0.05) and 15 mg/mL (0.8‐fold, p < 0.01) LNT2 for 72 h (Figure 1E). GOS upregulated the expression of MUC2 and TFF3 at 10 and 15 mg mL–1 (Figure 1A,B), MUC2 was upregulated by 10 mg mL–1 (1.6‐fold, p < 0.05) and 15 mg/mL (1.5‐fold, p < 0.01) GOS, and TFF3 was upregulated by 10 mg/mL (1.4‐fold, p < 0.05) and 15 mg mL–1 (1.5‐fold, p < 0.01) GOS. The cell viability of LS174T was quantified after treatment with 1, 5, 10, and 15 mg mL–1 of 2′‐FL, 3‐FL, and LNT2 for 72 h (Figure S1, Supporting Information). As mucus synthesis‐related genes' expression was most altered by 10 and 15 mg mL–1 3‐FL, LNT2, and GOS, 10 mg mL–1 was used for all subsequent experiments unless stated otherwise.
Figure 1.
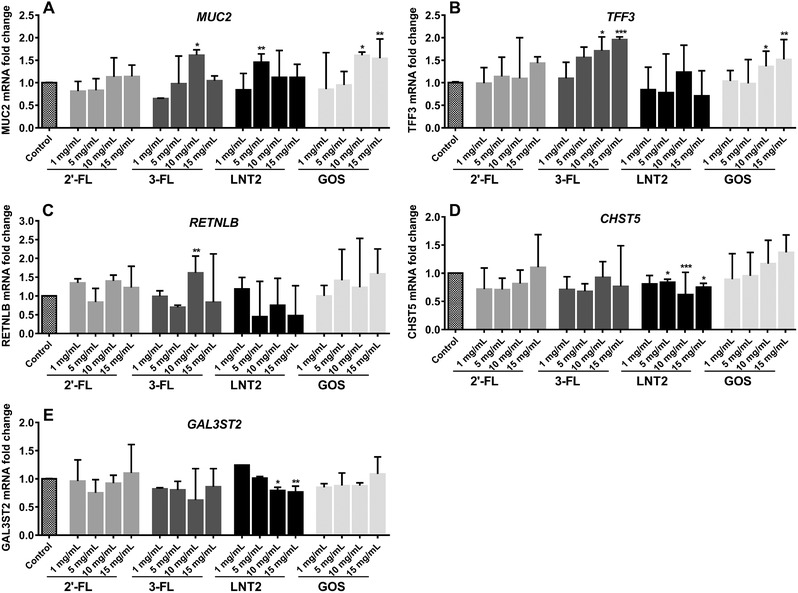
Dose‐response for 2′‐FL, 3‐FL, LNT2, and GOS and the effects on expression of goblet cell secretory and Golgi‐sulfotransferase genes. LS174T cells were treated with various doses of 2′‐FL, 3‐FL, LNT2, and GOS for 72 h, and mRNA expression of goblet cell secretory and Golgi‐sulfotransferase genes was measured by real‐time RT‐PCR. Results are presented as fold change against a negative control. Data are presented as median ± range (n = 4). Significant differences compared to the negative control were determined by using Kruskal–Wallis test followed by the Dunn's test and indicated by * p < 0.05; ** p < 0.01; *** p < 0.001; or by **** p < 0.0001.
Next, to determine possible time‐dependent effects of hMOs on goblet cell modulation, expression of the mucus synthesis associated genes was tested at 6, 12, 24, 48, and 72 h after incubating with 2′‐FL, 3‐FL, LNT2, and GOS. As shown in Figure 2, the different hMOs and LNT2 induced differential modulatory effects in goblet cell genes, and these effects are time‐dependent. As shown in Figure 2, 2′‐FL did not alter mucus synthesis‐related genes expression at any of the time points. 3‐FL induced at 12, 24, and 48 h of exposure, enhanced MUC2 gene expression that was 1.6, 1.5, and 1.6‐fold (p < 0.05) enhanced. LNT2 also significantly enhance the MUC2 expression at 48 h (1.7‐fold, p < 0.05, Figure 2A). Upregulation was similar as induced by GOS that enhanced MUC2 gene expression 1.5‐fold (p < 0.01), but only after 72 h incubation. TFF3 gene expression was significantly increased after 48 h by 3‐FL (1.8‐fold, p < 0.01), and it increased to 2.6‐fold after 72 h of 3‐FL (p < 0.0001) treatment (Figure 2B). LNT2 could also enhance the expression of TFF3 at 48 h (1.4‐fold, p < 0.05). GOS upregulated the TFF3 gene expression at 48 h (1.6‐fold, p < 0.05) and 72 h (1.9‐fold, p < 0.001). The effects of 3‐FL were more pronounced than with GOS. 3‐FL could enhance RETNLB expression at 72 h (1.6‐fold, p < 0.05) while LNT2 was not able to modulate RETNLB. GOS showed a stronger upregulating effect on RETNLB at 48 h (2.3‐fold, p < 0.0001). Only LNT2 could modulate CHST5 expression, it was observed that gene expression of CHST5 was downregulated by incubating 6, 24, 48, and 72 h with LNT2 (6 and 24 h: 0.7‐fold, p < 0.01; 48 and 72 h: 0.6‐fold, p < 0.001; Figure 2D), 12 h incubation also showed a trend of downregulation (0.8‐fold, p = 0.06). Moreover, 2′‐FL, 3‐FL, LNT2, and GOS did not effectively alter the expression of GAL3ST2 at different time points (Figure 2E).
Figure 2.
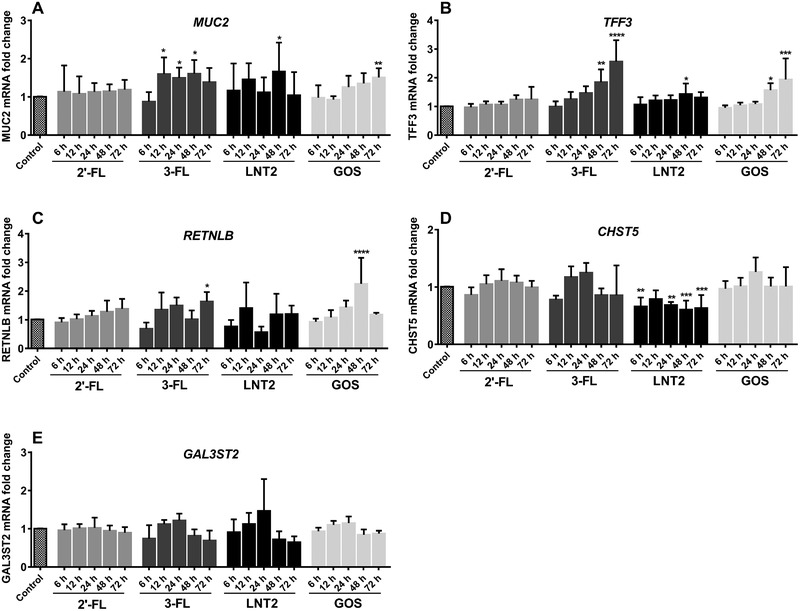
Time‐dependent modulation of goblet cell secretory and Golgi‐sulfotransferase genes in LS174T cells induced by 2′‐FL, 3‐FL, LNT2, and GOS. Expression of MUC2, TFF3, RETNLB, CHST5, and GAL3ST2 was quantified by assessing the mRNA expression with real‐time RT‐PCR at 6, 12, 24, 48, and 72 h. Results are presented as fold change against untreated control cells under the same stimulation time period. Data are presented as mean ± SD (n = 6). Significant differences compared to the negative control were determined by using one‐way analysis of variance with Dunnett multiple comparison tests and indicated by * p < 0.05; ** p < 0.01; *** p < 0.001; or by **** p < 0.0001.
3.2. 3‐FL, LNT, and GOS Enhance MUC2 Protein Expression
As 3‐FL, LNT2, and GOS differently modulated MUC2 genes expression, and MUC2 is the major component of mucus produced and secreted by intestinal goblet cells,27 we tested whether 3‐FL, LNT2, and GOS, also impacted MUC2 protein expression. 3‐FL, LNT2, and GOS were incubated with LS174T cells at a concentration of 10 mg mL–1. After 72 h, the cells were stained and analyzed for the average thickness of the MUC2 layer. Immunofluorescent staining, 3‐FL, LNT2, and GOS all significantly increased the average thickness of the MUC2 to 1.2‐fold compared to the control (p < 0.05, Figure 3).
Figure 3.
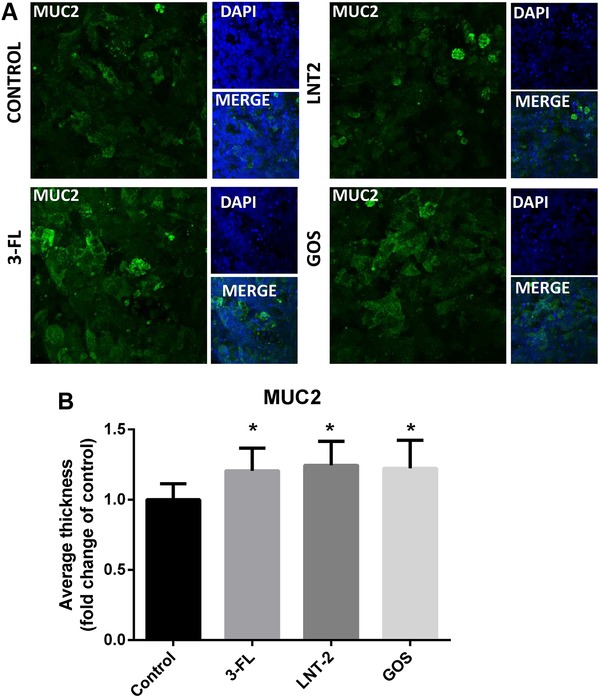
Immunofluorescent staining for MUC2 is increased with 72 h treatment of LS174T cells with GOS, 3‐FL, and LNT2, culture medium served as negative control. A) Control, GOS, 3‐FL, and LNT2‐treated LS174T cells were stained with anti‐MUC2 antibody and FITC‐conjugated secondary antibody. Cells were counterstained with DAPI. Stained sections were visualized by Leica SP8 confocal laser microscope (63× magnification). B) The average thickness of MUC2 was quantified using Image J software of the 3D images. Results are presented as fold change against negative control. Data are presented as mean ± SD (n = 6). Statistical significance was measured using one‐way analysis of variance with Dunnett multiple comparisons test and indicated by * p < 0.05; ** p < 0.01; *** p < 0.001; or by **** p < 0.0001.
3.3. hMOs Differentially Modulate the Transcription of Mucus Synthesis Genes During TNF‐α or IL‐13 Challenge
In order to further explore the modulatory potentials of hMOs on goblet cell functions, we investigated the effects of hMOs on mucus‐associated genes in goblet cells exposed to the cytokines TNF‐α or IL‐13. TNF‐α and IL‐13 are known to influence gene expression and goblet cell function.35 We selected 72 h of exposure as it was found that impact of 2′‐FL, 3‐FL, LNT2, and GOS was most pronounced at this timepoint (Figure 2). As shown in Figure 4, MUC2, TFF3, and GAL3ST2 were not significantly affected by TNF‐α stimulation, TNF‐α significantly inhibited the gene expression of RETNLB (0.7‐fold vs control, p < 0.05) and CHST5 (0.8‐fold vs control, p < 0.01) compared to the untreated control. 2′‐FL, 3‐FL, and LNT2 did not effectively upregulate the expression of RETNLB and CHST5 in the presence of TNF‐α, while GOS was found to induce an increased RETNLB and CHST5 expression in the presence of TNF‐α (p < 0.001, Figure 4C,D). However, for the two genes MUC2 and TFF3, whose transcription was not significantly altered by TNF‐α, still effects were observed with hMOs during TNF‐α stimulation. MUC2 could even in the presence of TNF‐α be induced by 3‐FL (p < 0.01) and LNT2 (p < 0.05) but not by 2′‐FL (Figure 4A). These effects were similar to that of GOS that also induced the expression of MUC2 during TNF‐α stimulation (p < 0.01). The inducing effects of GOS (2.0‐fold vs control, p < 0.01) were the same as for 3‐FL (2.0‐fold vs control, p < 0.01) and more pronounced than induced by LNT2 (1.8‐fold vs control, p < 0.05, Figure 4A). Also, 3‐FL enhanced TFF3 during TNF‐α stimulation (1.8‐fold vs control, p < 0.001), while 2′‐FL and LNT2 did not significantly change the gene expression of TFF3 (Figure 4B). GOS also could enhance the expression of TFF3 (2.2‐fold vs control, p < 0.0001). Its effect was stronger than that of 3‐FL (1.8‐fold change vs control, p < 0.001). Furthermore, 2′‐FL, 3‐FL, LNT2, and GOS did not effectively change the expression of GAL3ST2 in the presence of TNF‐α (Figure 4E).
Figure 4.
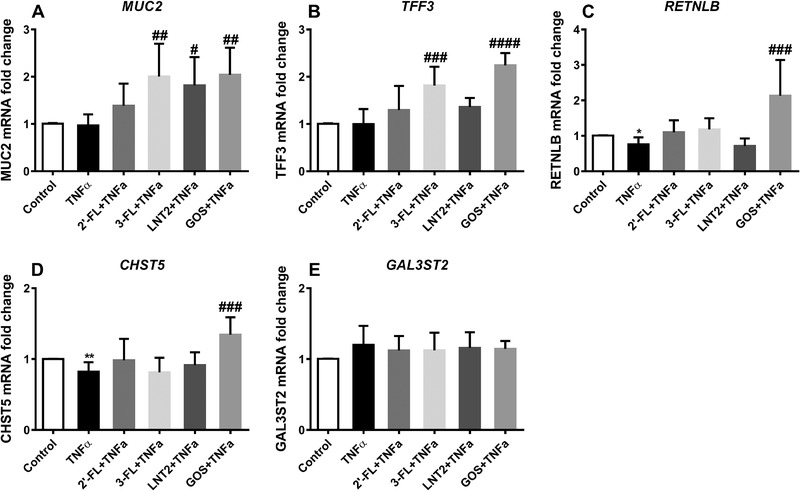
2′‐FL, 3‐FL, LNT2, and GOS elicited differential gene expression change in LS174T cells during TNF‐α challenge. MUC2, TFF3, RETNLB, CHST5, and GAL3ST2 gene expression in LS174T cells was measured by real‐time RT‐PCR following simultaneous stimulation with 10 mg mL–1 of 2′‐FL, 3‐FL, LNT2, and GOS with TNF‐α (10 ng mL–1) for 72 h. Results are presented as fold change against negative control. Data are presented as mean ± SD (n = 6). Statistical significance was measured using one‐way analysis of variance with Dunnett multiple comparisons test (* vs control; # vs TNF‐α group; #,* p < 0.05; ##,** p < 0.01; ###,*** p < 0.001; ####,**** p < 0.0001).
IL‐13 has different effects on goblet cells than TNF‐α. Figure 5 shows that IL‐13 treatment significantly inhibited the gene expression of MUC2 (0.8‐fold vs control, p < 0.05) and strongly increases the expression of RETNLB (8.4‐fold vs control, p < 0.001) and CHST5 (4.0‐fold vs control, p < 0.01). 2′‐FL (1.3‐fold vs control, p < 0.05), 3′‐FL (1.7‐fold vs control, p < 0.0001), and LNT2 (1.8‐fold vs control, p < 0.0001, Figure 5A) significantly upregulated MUC2 during IL‐13 stimulation. This enhancement was similar as with GOS that enhanced the expression of MUC2 1.7‐fold in the presence of IL‐13 (p < 0.0001). 2′‐FL, 3‐FL, and LNT2 did not effectively alter the expression of RETNLB and CHST5 in the presence of IL‐13, while GOS induced an increased RETNLB (15.5‐fold vs control, p < 0.001) and CHST5 expression (8.2‐fold vs control, p < 0.001, Figure 5C,D). For the two genes TFF3 and GAL3ST2, which transcription was not significantly altered by IL‐13, upregulating effects were observed for hMOs during IL‐13 stimulation. 3‐FL and LNT2 induced significant increase in TFF3 expression during IL‐13 stimulation (2.6‐fold vs control and 2.7‐fold vs control, respectively, p < 0.01), while 2′‐FL and GOS had no effects on TFF3 (Figure 5B). Only LNT2 could elicit the expression of GAL3ST2 (1.6‐fold vs control, p < 0.05), with 2′‐FL, 3‐FL, nor GOS altered expression of GAL3ST2 during IL‐13 stimulation was observed (Figure 5E).
Figure 5.
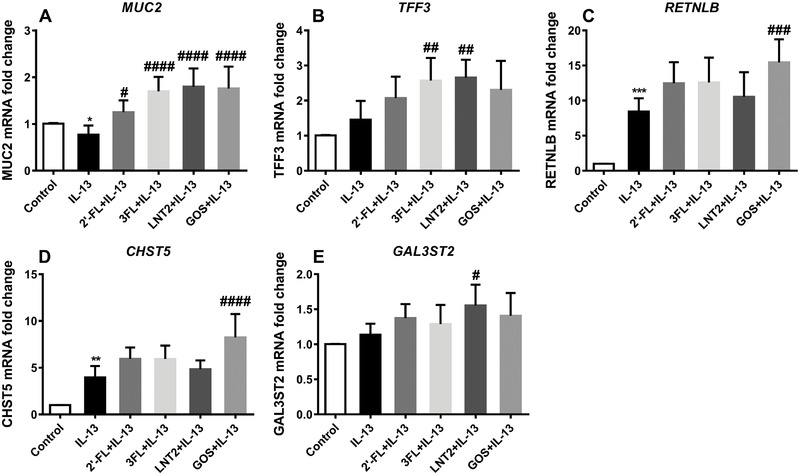
2′‐FL, 3‐FL, LNT2, and GOS elicited differential gene expression change in LS174T cells during IL‐13 challenge. MUC2, TFF3, RETNLB, CHST5, and GAL3ST2 gene expression in LS174T cells was measured by real‐time RT‐PCR following simultaneous stimulation with 10 mg mL–1 of 2′‐FL, 3‐FL, LNT2, and GOS with IL‐13 (5 ng mL–1) for 72 h. Results are presented as fold change against negative control. Data are presented as mean ± SD (n = 6). Statistical significance was measured using one‐way analysis of variance with Dunnett multiple comparisons test (* vs control; # vs IL‐13 group; #,* p < 0.05; ##,** p < 0.01; ###,*** p < 0.001; ####,**** p < 0.0001).
Overall, 2′‐FL, 3‐FL, LNT2, and GOS could differentially modulate different mucus synthesis genes during TNF‐α or IL‐13 challenge.
3.4. hMO's Acid Hydrolysis LNT2 but not 2′‐FL and 3‐FL Restored Tm‐Induced Declined Gene Expression of Mucus Synthesis Genes
Tm is an N‐glycosylation inhibitor known to disrupt mucus synthesis in goblet cells.41 To examine the protective properties of hMOs on Tm‐induced disruption of goblet cell function, LS174T cells were stimulated with Tm for 24 h after 24 h of pre‐incubation with different hMOs. This setup of pre‐exposure to hMOs was chosen based on previous reports demonstrating that pretreatment showed the most effective protection against Tm‐induced ER stress in goblet cells.38, 42 As shown in Figure 6, compared to the control, Tm treatment significantly suppressed the expression of MUC2 (0.4‐fold vs control, p < 0.0001), TFF3 (0.7‐fold vs control, p < 0.0001), RETNLB (0.5‐fold vs control, p < 0.0001), and CHST5 (0.6‐fold vs control, p < 0.0001). 2′‐FL, 3‐FL, LNT2, and GOS could not stop the suppression of MUC2 induced by Tm (Figure 6A). Pretreatment with 2′‐FL and 3‐FL could also not prevent Tm induced dampened expression of TFF3, RETNLB, and CHST5. However, LNT2 could efficiently restore TFF3 expression to the normal levels in the presence of Tm (1.2‐fold vs control, p < 0.0001). GOS also significantly upregulated TFF3 during Tm stimulation (0.9‐fold vs control, p < 0.01), but the rescuing effects of LNT2 were more pronounced than with GOS (Figure 6B). Only LNT2 could enhance the expression of RETNLB (0.8‐fold vs control, p < 0.01) and CHST5 (0.9‐fold vs control, p < 0.01) suppressed by Tm stimulation; 2′‐FL, 3‐FL, and GOS could not prevent downregulation of RETNLB and CHST5 caused by Tm treatment (Figure 6C,D). Moreover, significantly diminished GAL3ST2 expression was not found with Tm treatment, and 2′‐FL, 3‐FL, and LNT2 also could not modulate its expression. Only GOS could elicit the expression of GAL3ST2 in the presence of Tm (1.2‐fold vs control, p < 0.05, Figure 6E).
Figure 6.
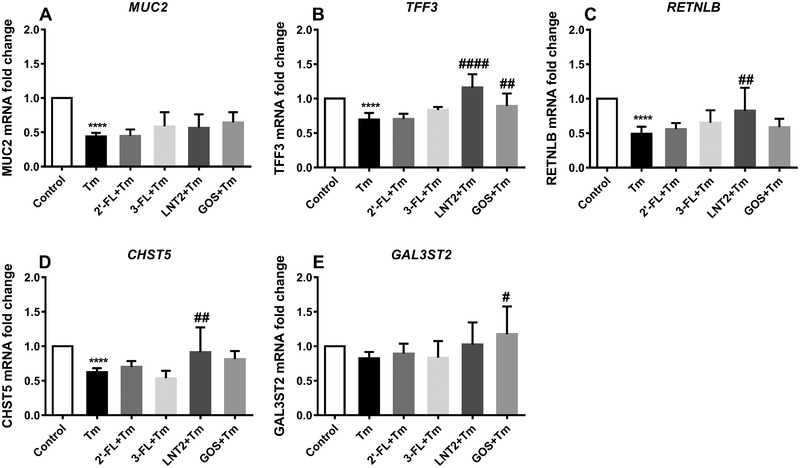
2′‐FL, 3‐FL, LNT2, and GOS elicited differential gene expression change in LS174T cells during Tm challenge. LS174T cells were first pretreated with 10 mg mL–1 GOS, 2′‐FL, 3‐FL, and LNT2 for 24 h, after which cells were exposed to Tm for another 24 h. MUC2, TFF3, RETNLB, CHST5, and GAL3ST2 gene expression in LS174T cells was measured by real‐time RT‐PCR following Tm stimulation. Results are presented as fold change against negative control. Data are presented as mean ± SD (n = 6). Statistical significance was measured using one‐way analysis of variance with Dunnett multiple comparisons test (* vs control; # vs Tm group; #,* p < 0.05; ##,** p < 0.01; ###,*** p < 0.001; ####,**** p < 0.0001).
The above results suggest that hMO's acid hydrolysis LNT2 rather than the hMOs 2’‐FL and 3‐FL was able to suppress Tm‐elicited impaired expression of mucus synthesis genes in goblet cells.
4. Discussion
Previous studies have shown that hMOs can enhance intestinal barrier function13; however, their ability to do this via enforcing the mucosa by directly impacting intestinal goblet cells has not yet been studied. In the present study, we examined the effects of two hMOs (2′‐FL, 3‐FL) and the hMO's acid hydrolysis product LNT2 on the gene expression of goblet cell secretory products and Golgi‐sulfotransferases in different conditions. We also compared their effects to GOS, which is known to enhance intestinal barrier function through the modulation of goblet cells.40 To the best of our knowledge, this is the first study addressing direct modulating effects of hMOs on goblet‐cells, which demonstrated a structure‐dependent effect on goblet cell function under homeostatic conditions, during exposure to inflammatory cytokines, and after challenge with a mucus synthesis disruptors. Under homeostatic conditions, we observed that effects on mucus synthesis related genes were highly dose‐ and structure‐dependent. 3‐FL, LNT2, and GOS treatment resulted in a significant increase in MUC2 synthesis and MUC2 protein secretion. The effects of hMOs and hMO's acid hydrolysis on goblet cells challenged with inflammatory cytokines or a mucus‐disrupting agent not only showed hMOs structure‐dependent effects on mucus synthesis related genes, but different effects were also observed during the different challenges. The differential effects of hMOs and hMO's acid hydrolysis on the different studied mucus pathways in goblet cells are shown in Figure 7.
Figure 7.
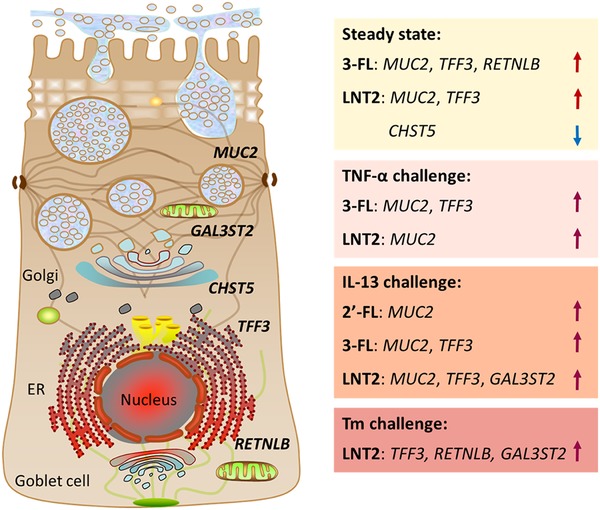
Schematic illustrating modulatory effects of 2′‐FL, 3‐FL, and LNT2 on goblet cells. Goblet cells secretory and Golgi‐sulfotransferase genes expression induced by 2′‐FL, 3‐FL, and LNT2 in LS174T goblet cell line under steady state, TNF‐α, IL‐13, and Tm challenge.  : upregulated;
  : downregulated.
Pooled mixtures of hMOs isolated from mother milk have been reported to support the intestine barrier function by increasing mucin expression.20 Here, we studied the modulatory effects of individual commonly present hMOs in mother milk, i.e., 2′‐FL, 3‐FL, and its acid hydrolysis product LNT2 on expression of goblet cell secretory related genes MUC2, TFF3, and RETNLB, and the Golgi‐sulfotransferase genes CHST5 and GAL3ST2 in goblet cells. The reason for choosing this cell type and not other commonly used epithelial cell lines such as Caco2 is that LS174T cells are highly secretory and exhibit more of a clear intestinal mucus secreting goblet‐cell phenotype. For that reason it is widely used in goblet cell function studies.38, 40, 43 Non‐transformed mucin‐producing intestine epithelial cells could be a better choice but are to the best of our knowledge not available yet. LS174T is also favored because it expresses all the tested genes under homeostatic condition, proinflammatory condition, and ER‐stress,38 which allows studying of the effects of individual hMOs under pro‐inflammatory or other diseased conditions.
The effects of 2′‐FL, 3‐FL, and LNT2 on goblet cell function were first assessed under homeostatic conditions and effects on mucus synthesis related genes were demonstrated to be time and structure dependent. 3‐FL and LNT2 enhanced gene expression of MUC2 as well as MUC2 protein expression. MUC2 is the fundamental structural constituent of intestinal secreted mucus,44 which indicates both 3‐FL and LNT2 increase mucus barrier function by direct interacting with goblet cells. 3‐FL could enhance MUC2 expression as early as after 12 h incubation while LNT2 and GOS needed 48 h to enhance MUC2 gene expression in the goblet cells. 3‐FL, LNT2, and GOS all increased TFF3 expression, but 3‐FL had the strongest impact on TFF3. TFF3 is involved in protecting the intestinal mucosa and supporting mucus healing.29 3‐FL, LNT2, and GOS thus have the ability to promote the intestinal mucus restitution and healing. 3‐FL also upregulated RELMB gene expression. As RELMβ regulates innate colonic functions such as barrier integrity and susceptibility for inflammation,31 3‐FL might also have anti‐inflammation properties. Only LNT2 could modulate CHST5 gene expression, CHST5 was significantly downregulated by LNT2 at multiple time points. CHST5 is involved in intestinal mucin sulfation.33
Regulatory effects of 2′‐FL, 3‐FL, and LNT2 were also evaluated in the presence of the inflammatory cytokine TNF‐α and the Th2 cytokine IL‐13. TNF‐α is a major inflammatory cytokine in the pathogenesis of IBD and known to influence gene expression and goblet cell function.35 During TNF‐α challenge, structure‐dependent effects of hMOs and the hMO's acid hydrolysis product LNT2 were observed. 3‐FL and LNT2 significantly potentiated the expression of MUC2, and 3‐FL also upregulated TFF3 gene expression. IL‐13 is a key Th2 cytokine that prevents intestinal helminth infection by enhancing the mucosal barrier via stimulating mucus production in goblet cells.25, 36 During IL‐13 exposure, 2′‐FL, 3‐FL, and LNT2 all significantly augmented MUC2 expression; 3‐FL and LNT2 also significantly potentiated the expression of TFF3. Under homeostatic conditions 2′‐FL did not enhance MUC2, but when the cells were exposed to IL‐13, 2′‐FL did induce MUC2. LNT2 also had no effects on GAL3ST2 under homeostatic conditions but during exposure to IL‐13, it upregulated GAL3ST2. The results indicate that 2’‐FL and LNT2 stimulate mucus production specifically during IL13 exposure and not under homeostatic conditions.
Mucin biosynthesis involves C‐terminal dimerization and N‐glycosylation in the ER, followed by O‐glycosylation in the Golgi and N‐terminal oligomerization. Tm‐induced ER‐stress affects N‐glycosylation and disrupts mucus synthesis in goblet cells.45 We observed that LNT2 rather than 2′‐FL and 3‐FL impact mucus function‐related gene expression. LNT2 significantly rescued the expression of TFF3, RETNLB, and CHST5, which indicates that LNT2 might protect the mucus barrier during ER‐stress. It is possible that the unique N‐acetylglucosamine (GlcNAc) end of LNT2 is responsible for this protective effect. The process of N‐glycosylation starts with the synthesis of precursor oligosaccharides and formation of a dolichol‐linked GlcNAc sugar.46, 47 The GlcNAc end of LNT2 might serve as a substrate for the N‐glycosylation and therefore prevent Tm‐induced decline of mucus synthesis genes.
Nowadays, many cow milk‐derived infant formulas are supplemented with nonhuman oligosaccharides, such as GOS and inulins.10 A previous study showed that GOS enhances intestinal barrier function through the modulation of goblet cells,40 and therefore served as reference in our study. We observed gene upregulation by GOS in homeostatic conditions and during IL‐13 challenge, with similar results as Bhatia et al.40 Bhatia et al. found that in both homeostatic conditions and IL‐13 challenge, following treatment with 8 mg mL–1 GOS for 72 h, the expression of MUC2, TFF3, CHST5, and RETNLB of LS174T was significantly upregulated, to a similar extend as reported here. The effects of GOS on goblet cells under TNF‐α and Tm challenge were not studied before. GOS enhanced MUC2, TFF3, RETNLB, and CHST5 gene expression during TNF‐α challenge as well as upregulated TFF3 and GAL3ST2 expression during Tm challenge, which indicate the protective effects of GOS during inflammatory and ER stress. During TNF‐α stimulation, GOS showed stronger effects than 3‐FL and LNT2 that might be explained by its structures. GOS is composed of galactose units with one glucose unit at the reducing end. The length of the chains range from 2 to 10 units with variations in branching and glycosyl‐linkage, which include β1‐3, β1‐4, and β1‐6.48
In conclusion, we demonstrate regulatory effects of hMOs and hMO's acid hydrolysis on goblet cell function via modulation of mucus barrier function related genes. Our data indicate that the modulatory effects of hMOs on goblet cells are highly structure dependent and different during inflammation and under ER stress. Understanding how and which hMOs or hMOs mixtures modulate goblet cell function in different inflammatory states contributes to the future design of hMO containing products with predictable beneficial effects in specific target groups. Human breast milk contains more than 200 different oligosaccharides,9 which have different effects and probably influence each other. It remains to be determined whether synthetic, single molecules will have similar effects than hMOs in mother milk. Follow‐up studies are needed to identify the specific structure that regulated goblet cells in different conditions as well as the receptors that mediate these effects, as well as whether synthetic molecules act similarly as natural occurring hMOs, which might provide a new way of promoting intestinal health with nutritional supply.
Conflict of Interest
The authors declare no conflict of interest.
Author Contributions
L.C. and P.d.V conceived and designed the experiments. L.C. and C.K. performed the experiments. L.C., M.T.C.W. ,and C.K. analyzed data. L.C., M.M.F., M.T.C.W., and P.d.V. wrote the paper.
Supporting information
Supporting Information
Acknowledgements
The project was financially supported by the China Scholarship Council (CSC). Andre Groeneveld and Arjen Nauta are acknowledged for supplying the hMOs. This research was performed within the framework of the Sino‐Dutch Doctoral Program on Sustainable Dairy coordinated by the Carbohydrate Competence Center (CCC, http://www.cccresearch.nl).
Cheng L., Kong C., Walvoort M. T. C., Faas M. M., de P. Vos, Human Milk Oligosaccharides Differently Modulate Goblet Cells Under Homeostatic, Proinflammatory Conditions and ER Stress. Mol. Nutr. Food Res. 2020, 64, 1900976 10.1002/mnfr.201900976
References
- 1. Walker A., J. Pediatr. 2010, 156, S3. [DOI] [PubMed] [Google Scholar]
- 2. WHO (World Health Organization) , Fifty Fifth World Heal. Assem. 2002, 53, 1. [Google Scholar]
- 3. Klement E., Cohen R. V, Boxman J., Joseph A., Reif S., Am. J. Clin. Nutr. 2004, 80, 1342. [DOI] [PubMed] [Google Scholar]
- 4. Ladomenou F., Moschandreas J., Kafatos A., Tselentis Y., Galanakis E., Arch. Dis. Child. 2010, 95, 1004. [DOI] [PubMed] [Google Scholar]
- 5. Heymann J., Raub A., Earle A., Bull W. H O. 2013, 91, 398. [DOI] [PMC free article] [PubMed] [Google Scholar]
- 6. Coulet M., Phothirath P., Allais L., Schilter B., Regul. Toxicol. Pharmacol. 2014, 68, 59. [DOI] [PubMed] [Google Scholar]
- 7. Piemontese P., Giannì M. L., Braegger C. P., Chirico G., Grüber C., Riedler J., Arslanoglu S., van Stuijvenberg M., Boehm G., Jelinek J., Roggero P., PLoS One 2011, 6, e28010. [DOI] [PMC free article] [PubMed] [Google Scholar]
- 8. Andreas N. J., Kampmann B., Mehring Le‐Doare K., Early Hum. Dev. 2015, 91, 629. [DOI] [PubMed] [Google Scholar]
- 9. Bode L., Glycobiology 2012, 22, 1147. [DOI] [PMC free article] [PubMed] [Google Scholar]
- 10. Akkerman R., Faas M. M., de Vos P., Crit. Rev. Food Sci. Nutr. 2018, 0, 1. [DOI] [PubMed] [Google Scholar]
- 11. Vandenplas Y., Berger B., Carnielli V. P., Ksiazyk J., Lagström H., Luna M. S., Migacheva N., Mosselmans J. M., Picaud J. C., Possner M., Singhal A., Wabitsch M., Nutrients 2018, 10, 1161. [DOI] [PMC free article] [PubMed] [Google Scholar]
- 12. Kunz C., Rudloff S., Baier W., Klein N., Strobel S., Annu. Rev. Nutr. 2000, 20, 699. [DOI] [PubMed] [Google Scholar]
- 13. Smilowitz J. T., Lebrilla C. B., Mills D. A., German J. B., Freeman S. L., Annu. Rev. Nutr. 2014, 34, 143. [DOI] [PMC free article] [PubMed] [Google Scholar]
- 14. Asakuma S., Hatakeyama E., Urashima T., Yoshida E., Katayama T., Yamamoto K., Kumagai H., Ashida H., Hirose J., Kitaoka M., J. Biol. Chem. 2011, 286, 34583. [DOI] [PMC free article] [PubMed] [Google Scholar]
- 15. Morrow A. L., Ruiz‐Palacios G. M., Altaye M., Jiang X., Lourdes Guerrero M., Meinzen‐Derr J. K., Farkas T., Chaturvedi P., Pickering L. K., Newburg D. S., J. Pediatr. 2004, 145, 297. [DOI] [PubMed] [Google Scholar]
- 16. Ayechu‐Muruzabal V., van Stigt A. H., Mank M., Willemsen L. E. M., Stahl B., Garssen J., van't Land B., Front. Pediatr. 2018, 6, 239. [DOI] [PMC free article] [PubMed] [Google Scholar]
- 17. He Y., Liu S., Leone S., Newburg D. S., Mucosal Immunol. 2014, 7, 1326. [DOI] [PMC free article] [PubMed] [Google Scholar]
- 18. Belfort M. B., Breastfeed. Med. 2018, 13, 34. [DOI] [PMC free article] [PubMed] [Google Scholar]
- 19. Wang B., Annu. Rev. Nutr. 2009, 29, 177. [DOI] [PubMed] [Google Scholar]
- 20. Wu R. Y., Li B., Koike Y., Määttänen P., Miyake H., Cadete M., Johnson‐Henry K. C., Botts S. R., Lee C., Abrahamsson T. R., Landberg E., Pierro A., Sherman P. M., Mol. Nutr. Food Res. 2019, 63, 1. [DOI] [PubMed] [Google Scholar]
- 21. Figueroa‐Lozano S., de Vos P., Compr. Rev. Food Sci. Food Saf. 2019, 18, 121. [DOI] [PubMed] [Google Scholar]
- 22. Gnoth M. J., Kunz C., Kinne‐Saffran E., Rudloff S., J. Nutr. 2000, 130, 3014. [DOI] [PubMed] [Google Scholar]
- 23. Bidart G. N., Rodríguez‐Díaz J., Yebra M. J., Appl. Environ. Microbiol. 2016, 82, 570. [DOI] [PMC free article] [PubMed] [Google Scholar]
- 24. Deo V. K., Park E. Y., Biotechnol. Appl. Biochem. 2006, 43, 129. [DOI] [PubMed] [Google Scholar]
- 25. Kim Y. S., Ho S. B., Curr. Gastroenterol. Rep. 2010, 12, 319. [DOI] [PMC free article] [PubMed] [Google Scholar]
- 26. Birchenough G. M. H., Johansson M. E., Gustafsson J. K., Bergström J. H., Hansson G. C., Mucosal Immunol. 2015, 8, 712. [DOI] [PMC free article] [PubMed] [Google Scholar]
- 27. Tytgat K. M. A. J., Büller H. A., Opdam F. J. M., Kim Y. S., Einerhand A. W. C., Dekker J., Gastroenterology 1994, 107, 1352. [DOI] [PubMed] [Google Scholar]
- 28. Dharmani P., Srivastava V., Kissoon‐Singh V., Chadee K., J. Innate Immun. 2009, 1, 123. [DOI] [PMC free article] [PubMed] [Google Scholar]
- 29. Taupin D., Podolsky D. K., Nat. Rev. Mol. Cell Biol. 2003, 4, 721. [DOI] [PubMed] [Google Scholar]
- 30. He W., Wang M. L., Jiang H. Q., Steppan C. M., Shin M. E., Thurnheer M. C., Cebra J. J., Lazar M. A., Wu G. D., Gastroenterology 2003, 125, 1388. [DOI] [PubMed] [Google Scholar]
- 31. Blanchard C., Murphy A. J., Seidu L., Mishra A., Artis D., Valenzuela D. M., Groschwitz K., Karow M. L., Ahrens R., Hogan S. P., J. Allergy Clin. Immunol. 2006, 118, 1054. [DOI] [PMC free article] [PubMed] [Google Scholar]
- 32. Brockhausen I., Biochim. Biophys. Acta, Gen. Subj. 1999, 1473, 67. [DOI] [PubMed] [Google Scholar]
- 33. Nishimura M., Naito S., Biol. Pharm. Bull. 2007, 30, 821. [DOI] [PubMed] [Google Scholar]
- 34. Seko A., Nagata K., Yonezawa S., Yamashita K., Jpn. J. Cancer Res. 2002, 93, 507. [DOI] [PMC free article] [PubMed] [Google Scholar]
- 35. Croix J. A., Bhatia S., Gaskins H. R., Exp. Biol. Med. 2011, 236, 1402. [DOI] [PubMed] [Google Scholar]
- 36. Iwashita J., Sato Y., Sugaya H., Takahashi N., Sasaki H., Abe T., Immunol. Cell Biol. 2003, 81, 275. [DOI] [PubMed] [Google Scholar]
- 37. Kaser A., Blumberg R. S., Mucosal Immunol. 2010, 3, 11. [DOI] [PMC free article] [PubMed] [Google Scholar]
- 38. Ren C., Dokter‐Fokkens J., Figueroa Lozano S., Zhang Q., de Haan B. J., Zhang H., Faas M. M., de Vos P., Mol. Nutr. Food Res. 2018, 62, 1700572. [DOI] [PMC free article] [PubMed] [Google Scholar]
- 39. Balzola F., Cullen G., Ho G. T., Russell R. K., Inflamm. Bowel Dis. Monit. 2013, 14, 29. [Google Scholar]
- 40. Bhatia S., Prabhu P. N., Benefiel A. C., Miller M. J., Chow J., Davis S. R., Gaskins H. R., Mol. Nutr. Food Res. 2015, 59, 566. [DOI] [PubMed] [Google Scholar]
- 41. Hasnain S. Z., Tauro S., Das I., Tong H., Chen A. H., Jeffery P. L., McDonald V., Florin T. H., McGuckin M. A., Gastroenterology 2013, 144, 357. [DOI] [PubMed] [Google Scholar]
- 42. Das I., Png C. W., Oancea I., Hasnain S. Z., Lourie R., Proctor M., Eri R. D., Sheng Y., Crane D. I., Florin T. H., McGuckin M. A., J. Exp. Med. 2013, 210, 1201. [DOI] [PMC free article] [PubMed] [Google Scholar]
- 43. Ren C., Dokter‐Fokkens J., Figueroa Lozano S., Zhang Q., Haan B. J., Zhang H., Faas M. M., Vos P., Mol. Nutr. Food Res. 2019, 63, 1801427. [DOI] [PMC free article] [PubMed] [Google Scholar]
- 44. Johansson M. E. V., Ambort D., Pelaseyed T., Schütte A., Gustafsson J. K., Ermund A., Subramani D. B., Holmén‐Larsson J. M., Thomsson K. A., Bergström J. H., Van Der Post S., Rodriguez‐Piñeiro A. M., Sjövall H., Bäckström M., Hansson G. C., Cell. Mol. Life Sci. 2011, 68, 3635. [DOI] [PMC free article] [PubMed] [Google Scholar]
- 45. Gundamaraju R., Vemuri R., Chong W. C., Bulmer A. C., Eri R., Int. J. Med. Sci. 2019, 16, 135. [DOI] [PMC free article] [PubMed] [Google Scholar]
- 46. Aebi M., Biochim. Biophys. Acta, Mol. Cell Res. 2013, 1833, 2430. [DOI] [PubMed] [Google Scholar]
- 47. Welti M., Glycoconjugate J. 2013, 30, 51. [DOI] [PubMed] [Google Scholar]
- 48. Akbari P., Fink‐Gremmels J., Willems R. H. A. M., Difilippo E., Schols H. A., Schoterman M. H. C., Garssen J., Braber S., Eur. J. Nutr. 2017, 56, 1919. [DOI] [PMC free article] [PubMed] [Google Scholar]
Associated Data
This section collects any data citations, data availability statements, or supplementary materials included in this article.
Supplementary Materials
Supporting Information