Abstract
Musashi‐2 (MSI2) belongs to Musashi family of RNA binding proteins (RBP). Like Musashi‐1 (MSI1), it is overexpressed in a variety of cancers and is a promising therapeutic target. Both MSI proteins contain two N‐terminal RNA recognition motifs and play roles in posttranscriptional regulation of target mRNAs. Previously, we have identified several inhibitors of MSI1, all of which bind to MSI2 as well. In order to design MSI2‐specific inhibitors and compare the differences of binding mode of the inhibitors, we set out to solve the structure of MSI2‐RRM1, the key motif that is responsible for the binding. Here, we report the crystal structure and the first NMR solution structure of MSI2‐RRM1, and compare these to the structures of MSI1‐RBD1 and other RBPs. A high degree of structural similarity was observed between the crystal and solution NMR structures. MSI2‐RRM1 shows a highly similar overall folding topology to MSI1‐RBD1 and other RBPs. The structural information of MSI2‐RRM1 will be helpful for understanding MSI2‐RNA interaction and for guiding rational drug design of MSI2‐specific inhibitors.
Keywords: RNA‐binding protein, RNA‐binding pocket, nuclear magnetic resonance, crystallography, Musashi
1. INTRODUCTION
The RNA‐binding protein (RBP) Musashi‐2 (MSI2) is overexpressed in many cancers, including colorectal adenocarcinomas,1, 2, 3 breast,4, 5 hematologic malignancies,6, 7, 8, 9, 10, 11, 12 lung,13 glioblastoma,14 and pancreatic cancers.15, 16, 17 As such, it mediates mRNA stability and translation of proteins involved in oncogenic pathways.18, 19, 20 Overexpression and knockdown studies indicate that MSI2 is a promising therapeutic target for cancer.3, 13, 16, 21, 22
Human MSI2 is a 328 amino acid protein that contains two RNA recognition motifs (RRMs) spanning G21‐K111 (RRM1) and K110‐P187 (RRM2). A BLAST23 search revealed that MSI2 (residues 1‐328) shares a high degree of similarity to the Musashi family proteins. Overall, MSI2 (residues 1‐328) is 69% identical to human Musashi‐1 (MSI1; residues 1‐362) and mouse MSI1 (residues 1‐362). The highest degree of similarity was observed for the N‐terminal RRMs of human MSI2 (residues 21‐187) which are 87% and 86% identical to the RNA‐binding domains (RBDs) (residues 20‐186) of human MSI1 and mouse MSI1, respectively. A multiple sequence alignment of human MSI2, human MSI1, and mouse MSI1 using Clustal Omega24 is shown in Figure 1. The C‐terminal region of MSI2 has no known motifs or specific function, while the N‐terminal RRMs mediate the binding to mRNAs,25 including those involved in the proliferation of certain cancers. As such, targeting these interactions using structure‐based drug design methods may provide a route for inhibitor development. To this end, we determined the crystal and solution NMR structures of MSI2‐RRM1 using a construct that was found to bind RNA. A high degree of structural similarity was observed between the crystal and solution NMR structures, suggesting that an orthogonal approach using both crystallographic and solution NMR methods could potentially be utilized for subsequent ligand binding studies.
Figure 1.
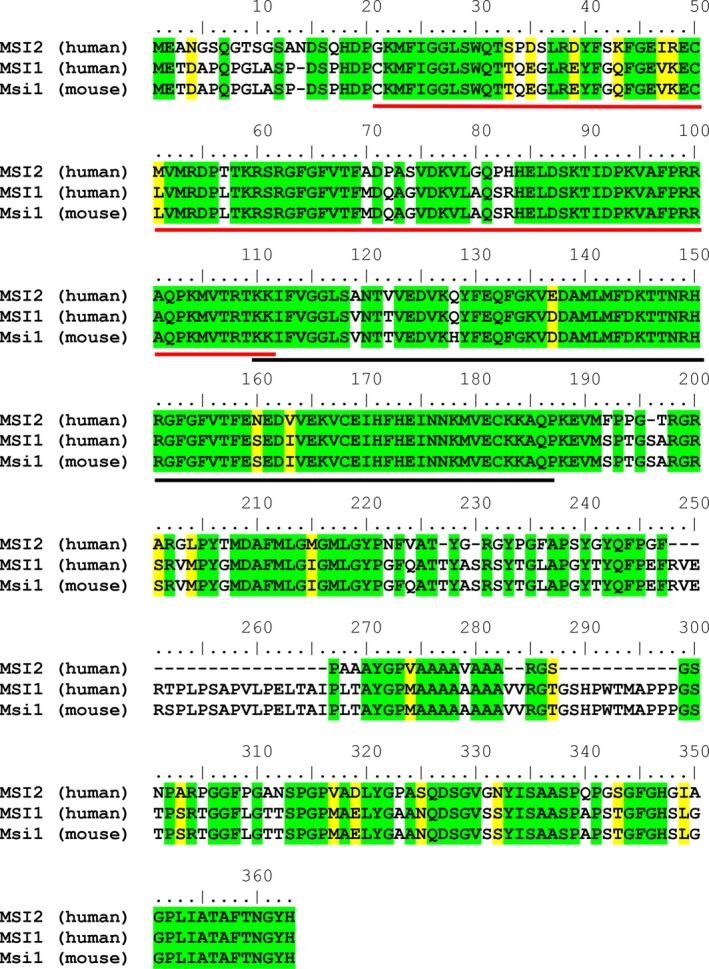
Clustal multiple sequence alignment of human MSI2, human MSI1, and mouse MSI1. Identical residues are highlighted in green, and similar residues are highlighted in yellow. The human MSI2 RRM1 and RRM2 domains are indicated by the red and black lines, respectively
2. MATERIALS AND METHODS
2.1. Fluorescence polarization assay
Fluorescence polarization (FP) assays and calculation for the Kd were carried out using our previously described methods.26 Three 3′ FAM‐labelled Numb RNAs that contain the Musashi recognition motif r(UAG) were used which included 15 nt Numb RNA (Numb15: 5′UAGGUAGUAGUUUUA), 8 nt Numb RNA (Numb8: 5′GUAGUAGU), and 5 nt Numb RNA (Numb5: 5′GUAGU); one 3′ FAM‐labelled 15 nt RNA with scrambled sequence was used as the control (control15). All RNAs were used at 2 nM. Fluorescence measurements were taken at room temperature using a BioTek Synergy H4 plate reader (Biotek, Winooski, VT).
2.2. Protein expression and purification
MSI2‐RRM1 protein used in NMR study was purified as previously described.27 MSI2‐RRM1 purification for crystallization was the same as the NMR except the last step of the protein was purified in the buffer of 20 mM HEPES (pH 7.5), 100 mM NaCl. To remove the His‐tag of purified MSI2‐RRM1 for crystallization, determination of the digestion efficiency of the purified proteins by TEV protease was carried out in a total volume of 50 μL containing 100 μg of protein in assay buffer (50 mM Tris‐Cl, pH 8.0, 0.5 mM EDTA, and 10 mM β‐mercaptoethanol), and various amount of TEV protease (1‐50 μg). Experiments were performed at room temperature or at 4 °C for 1 to 12 hours. The reaction was quenched by mixing with 4 × SDS‐PAGE sample buffer (40% glycerol, 564 mM Tris base, 424 mM Tris‐HCl, 8% SDS, 0.4% bromophenol blue). The degree of TEV digestion was detected by SDS‐PAGE. The quantity of the digested products was measured qualitatively by visualization on the stained gel and compared with the control experiment that was carried out without TEV in the reaction. For large‐scale reactions, purified proteins were mixed with TEV at the predetermined ratio, then dialyzed extensively against reaction buffer (50 mM Tris‐HCl, pH 8.0, 10 mM β‐mercaptoethanol, 0.5 M NaCl) and then passed through Ni column.
2.3. Crystallization and data collection
Purified MSI2‐RRM1 (G21‐K111) with the His‐tag removed was concentrated to 10.2 mg/mL (0.96 mM) in 150 mM NaCl, 20 mM MES pH 6.0. All crystallization experiments were setup using an NT8 drop setting robot (Formulatrix Inc.) and UVXPO MRC (Molecular Dimensions) sitting drop vapor diffusion plates at 18°C. 100 nL of protein and 100 nL crystallization solution were dispensed and equilibrated against 50 uL of the latter. Needle clusters (Figure S1) formed after 2 days and grew to their maximum size in 3 weeks from the Salt Rx screen (Hampton Research) condition E4 (2.4 M [NH4]2HPO4, 100 mM Tris pH 8.5). A cryoprotectant containing 80% crystallant and 20% (v/v) glycerol was layered onto the drop (2 uL), crystals were harvested and stored in liquid nitrogen. X‐ray diffraction data were collected at the Advanced Photon Source beamline 17‐ID using a Dectris Pilatus 6 M pixel array detector.
2.4. Crystal structure solution and refinement
Intensities were integrated using XDS28, 29 via XDSAPP30 and the Laue class analysis and data scaling were performed with Aimless31 which suggested that the highest probability Laue class was 2/m and space group P2 or P21. The Matthews coefficient32 indicated that the asymmetric unit most likely contained a single molecule with (Vm = 3.3 Å3/Da, 62% solvent). Structure solution was conducted by molecular replacement with Phaser33 using a single chain from the solution NMR structure of MSI2‐RRM1 (PDB 6C8U) as the search model. The search model included G21‐V95 as the N‐ and C‐termini regions were highly flexible. Initial molecular replacement searches for a single molecule in the asymmetric unit yielded a log likelihood gain (LLG) of 18 and translation function Z‐score (TFZ) of 3 suggesting that a solution was not obtained. Although the Matthews coefficient indicated that the crystals most likely contained a single molecule in the asymmetric unit, the possibility of two molecules was also probable (2%) with Vm = 1.6 and 25% solvent. Molecular replacement search for two molecules yielded an LLG and TFZ of 42 and 5.6, respectively, indicating that an improved solution was obtained but was still weak. However, the resulting electron density maps following refinement of this solution were interpretable. The model was subjected to iterative rounds of manual model building and refinement, which further improved the electron density maps. A single subunit was then used for molecular replacement with Phaser and yielded a solution (LLG = 680, TFZ = 16) with two molecules in the asymmetric unit in the space group P21. Further refinement and manual model building were conducted with Phenix34 and Coot,35 respectively. Disordered side chains were truncated to the point for which electron density could be observed. Structure validation was conducted with Molprobity,36 and figures were prepared using the CCP4MG package.37 Polder38 omit maps (Fo‐Fc) were calculated with Phenix, and structure superposition was carried out using GESAMT.39 Crystallographic data for MSI2‐RRM1 are provided in Table 1. Coordinates and structure factors were deposited to the Worldwide Protein Databank (wwPDB) with the accession code 6NTY.
Table 1.
Crystallographic data for MSI2‐RRM1
| MSI2‐RRM1 | |
|---|---|
| Data collection | |
| Unit‐cell parameters (Å, o) |
a = 30.80, b = 57.37, c = 41.31, β = 101.3 |
| Space group | P21 |
| Resolution (Å)a | 40.51‐2.10 (2.16‐2.10) |
| Wavelength (Å) | 1.0000 |
| Temperature (K) | 100 |
| Observed reflections | 27 686 |
| Unique reflections | 8271 |
| <I/σ(I) >a | 6.5 (1.8) |
| Completeness (%)a | 99.4 (99.3) |
| Multiplicitya | 3.3 (3.2) |
| R merge (%)a , b | 11.2 (80.1) |
| R meas (%)a , d | 14.4 (92.3) |
| R pim (%)a , d | 7.2 (53.3) |
| CC1/2 a , e | 0.993 (0.559) |
| Refinement | |
| Resolution (Å)a | 33.09‐2.10 |
| Reflections (working/test)a | 7814/440 |
| R factor/R free (%)a , c | 20.5/28.0 |
| No. of atoms (protein/water) | 1201/37 |
| Model quality | |
| RMSD | |
| Bond lengths (Å) | 0.008 |
| Bond angles (o) | 0.926 |
| Mean B‐factor (Å2) | |
| All atoms | 36.9 |
| Protein | 36.7 |
| Water | 37.5 |
| Coordinate error (maximum likelihood) (Å) | 0.23 |
| Ramachandran plot | |
| Most favored (%) | 98.1 |
| Additionally allowed (%) | 1.9 |
| PDB code | 6NTY |
Values in parenthesis are for the highest resolution shell.
R merge = ∑hkl∑i |I i(hkl)‐ < I(hkl) > |/∑hkl∑i I i(hkl), where I i(hkl) is the intensity measured for the ith reflection and < I(hkl) > is the average intensity of all reflections with indices hkl.
R factor = ∑hkl ||F obs (hkl)|‐|F calc (hkl)||/∑hkl|F obs(hkl)|; R free is calculated in an identical manner using 5% of randomly selected reflections that were not included in the refinement.
2.5. NMR spectroscopy and structure calculation
All NMR spectra for structure calculation were recorded at 25°C on a Bruker AVANCE 800 MHz NMR spectrometer equipped with a triple resonance cryoprobe. The NMR samples contained 400 μM‐1 mM of 13C and 15N labeled MSI2‐RRM1 in 20 mM MES (pH 6.0), 150 mM NaCl. Backbone resonance assignments of MSI2‐RRM1 were reported previously under BMRB code 27111.27 Side chain assignments were made by analyzing HCCH‐COSY40 and HCCH‐TOCSY41 (10.9 ms mixing time) spectra. Distance restraints were obtained using 3D 15N edited NOESY‐HSQC42 (120 ms mixing time) and 13C edited NOESY‐HSQC42 (120 ms mixing time) spectra. Spectra were processed by NMRPipe43 and analyzed by NMRViewJ.44 The15N{1H} heteronuclear nuclear Overhauser effect (HetNOE) spectrum was collected at 25°C on a Bruker AVIII 600 MHz NMR spectrometer equipped with a room temperature triple resonance inverse probe. The NMR sample contained 132 μM of 15N labeled MSI2‐RRM1 in 20 mM MES (pH 6.0), 150 mM NaCl. Data were processed using nmrPipe and visualized using nmrDraw and CCPN Analysis45 on the NMRBox46 platform. The reference and NOE experiments were collected in an interleaved manner. Each 2D was collected with 1024 × 128 complex data points with 64 scans. The interscan delay is set to 8 seconds for the reference experiment and 5 seconds for the NOE experiment. The NOE experiment used a train of 120° hard pulses with 18 ms delays for a total saturation time of 3 seconds.
Structure calculation was performed using Crystallography and NMR system (CNS)47 version 1.3. The CNS calculation used default parameters with modifications in the high temperature annealing stage (15 000 K), the second Cartesian cooling stage (10 000 K, 12 000 steps), the NOE energy term scale factor (200), the dihedral angle energy term scale factor (250), and time step (0.0028). A total of 100 structures were calculated, and the 10 structures with lowest energy were selected and superimposed. The qualities of the 10 structures were assessed by CNS and the Protein Data Bank (PDB) validation server. The ensemble of the 10 lowest energy structures and experimental restraints in CNS format were deposited to the PDB (PDB accession code 6C8U), and the complete resonance assignments of MSI2‐RRM1 were deposited to the Biological Magnetic Resonance Data Bank (BMRB accession code 30398).
3. RESULTS AND DISCUSSION
3.1. MSI2‐RRM1 binds to Numb RNA
The N‐terminal RRMs (RNA‐recognition Motifs) of MSI2 mediate the binding to their target mRNAs' recognition motifs located at 3′‐UTR and one of the motifs, r(UAG), is shared between MSI1 and MSI2.48, 49 FP experiments demonstrated that all three Numb RNAs containing the Musashi recognition motif r(UAG) bind to MSI2‐RRM1, as indicated by the increased FP value, and MSI2‐RRM1 has a higher affinity towards Numb 15 compared to Numb 8 or Numb 5, as indicated by the lower Kd value (Figure 2). Importantly, compared to Numb 15, the 15 nt control RNA (Control 15) containing a scrambled sequence displayed nonspecific binding at high protein concentration (Figure 2). Importantly, these results indicate that the MSI2‐RRM1 construct adopts a functional RNA‐binding conformation in solution.
Figure 2.
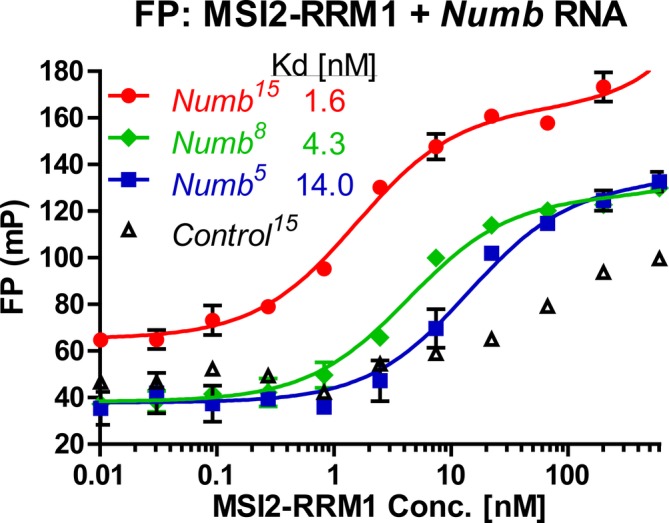
MSI2‐RRM1 binds to Numb RNA. Binding between RNA recognition Motif 1 (aa 21‐111) of MSI2 (MSI2‐RRM1) to three Numb RNAs (2 nM), but not to a Control RNA (2 nM) in FP assay [Color figure can be viewed at http://wileyonlinelibrary.com]
3.2. Crystal structure of MSI2‐RRM1
The crystal structure of MSI2‐RRM1 was modeled from residues G21 to R100 and consists of an antiparallel β‐strand core that is flanked by two α‐helices (Figure 3). The two subunits in the asymmetric unit form a noncrystallographic dimer in which the longest β‐stands (1, 2, 3, and 6) are positioned towards the center of the dimer (Figure 4A). The only hydrogen bond interactions between dimer subunits occurs between residues F97/R99 in the C‐terminal β7 strand of subunit A and residues V52, M53, and R54 in β2 of subunit B (Figure 4B). The structures of subunits A and B are quite similar with a root‐mean‐square‐deviation (RMSD) of 0.81 Å (80 residues aligned) between Cα‐atoms. A small difference between the subunits was in the loop that bridges β2 and β3 (Figure 4C). It should be noted, however, that the crystals are tightly packed as indicated by the Matthew's coefficient (Vm = 1.7 Å3/Da, 25% solvent). As such, it is possible that crystal packing could affect the conformation of the β2/β3 loop in each subunit differently. Notably, R60 in subunit A forms a contact with Q81 of a symmetry‐related molecule. However, no crystal contacts are observed with residues in the β2/β3 loop of subunit B and residues T57 and T58 were disordered.
Figure 3.
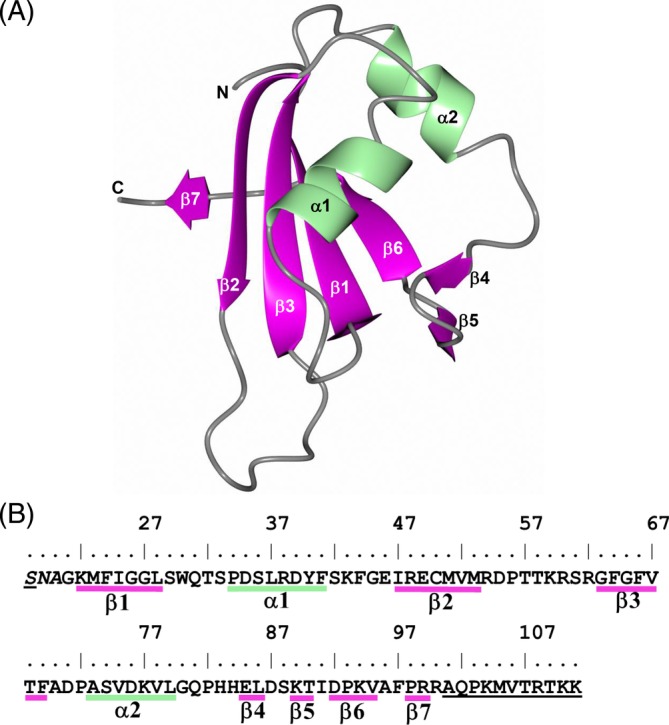
Crystal structure of the MSI2‐RRM1 subunit. A, Secondary structure elements for subunit A. B, Annotation of the secondary structure elements relative to the amino acid sequence. Residues in italics at the N‐terminus are cloning artifacts, and underlined residues were not modeled due to disorder
Figure 4.
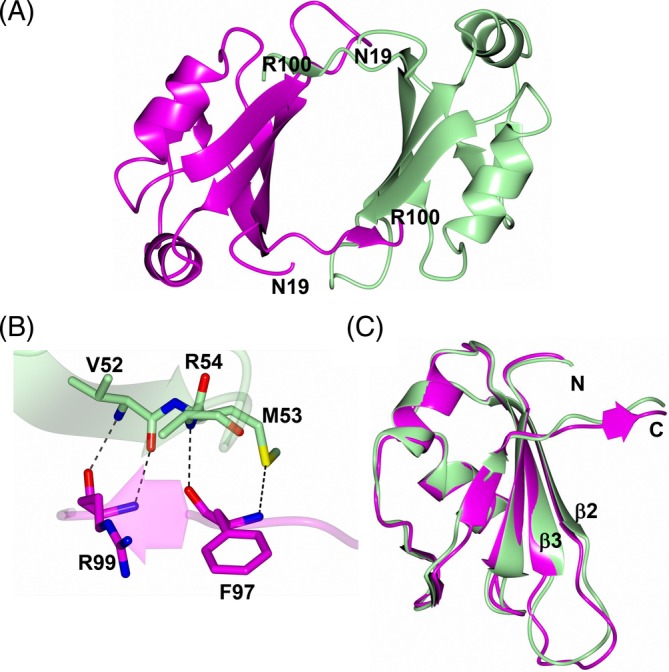
Crystal structure of MSI2‐RRM1. A) Noncrystallographic dimer with subunits A and B colored magenta and green, respectively. B) Hydrogen bond interactions (dashed lines) between the noncrystallographic dimers in the asymmetric unit. C) Superposition of subunit B (green) onto subunit A (magenta)
During the review of this manuscript, a crystal structure of a MSI2‐RRM150 construct spanning K22‐K104 was released. The structure is similar overall to the structure reported here and superposition of the new release and our structure yielded an RMSD of 1.11 Å between Cα atoms (78 residues). The main differences were observed in the extreme C‐terminus along with slight conformational differences in the β2/β3 loop (Figure S2).
3.3. NMR structure of MSI2‐RRM1
A total of 100 structures of MSI2‐RRM1 were calculated using 1183 NOE distance restraints, 148 torsion angle restraints, 108 carbon chemical shift restraints, 100 nonglycine Hα chemical shift restraints, and 38 hydrogen bond restraints (Table 2). The superposition of the backbone atoms for the 10 lowest energy structures of MSI2‐RRM1 and ribbon diagram representation of the lowest energy structure of MSI2‐RRM1 are shown in Figure 5A,B and the statistical results of the 10 lowest energy structures are provided in Table 2. The hexahistidine tag and TEV protease cleavage site (residues M‐3‐A20) and the C‐terminus (residues P98‐K111) are not shown as they are unstructured. The well‐defined regions include residues G21‐F97, and the ill‐defined regions include residues M‐3‐A20 at the N‐terminus and residues P98‐K111 at the C‐terminus due to the lack of inter‐residue NOE's. The RMSD of the backbone atoms is 0.333 ± 0.064 Å, and the RMSD of the heavy atoms is 0.712 ± 0.086 Å. Based on Ramachandran analysis of the structural model, 98.0% of the backbone torsion angles are in the most favored conformational region, 2.0% are in the allowed region, and 0% are in disallowed regions. Similar to the crystal structure of MSI2‐RRM1, the solution NMR structure of MSI2‐RRM1 exhibits a typical ribonucleoprotein (RNP)‐type fold consisting of antiparallel β‐sheets (β1‐β6) packed against two α‐helices (α1 and α2).
Table 2.
Statistics for the 10 lowest‐energy structures of MSI2‐RRM1
| Experimental restraints | |
|---|---|
| NOE's total | 1183 |
| NOE's intra‐residue | 503 |
| NOE's sequential (|i‐j| = 1) | 319 |
|
NOE's medium rang (2 ≤ |i‐j| ≤ 5) |
178 |
| NOE's long range (|i‐j|˃5) | 183 |
| Dihedral angle restraints | 148 |
| Carbon shift restraints | 108 |
| Nonglycine Hα shifts restraints | 100 |
| Hydrogen bond restraints | 38 |
| Structure results | |
| No. of NOE violations >0.5 Å | 0 |
| NOE violation RMSD | 0.069 ± 0.000 Å |
| No. of phi or psi violations >5° | 0 |
| phi or psi violation RMSD | 0.44 ± 0.02° |
| Hɑ shifts violation RMSDa | 0.31 ± 0.01 ppm |
| Cɑ shifts violation RMSDa | 1.24 ± 0.03 ppm |
| Cβ shifts violation RMSDa | 0.90 ± 0.04 ppm |
| Bond lengths RMSDb | 0.0077 ± 0.0001 Å |
| Bond angles RMSDb | 0.77 ± 0.01° |
| Improper angles RMSDb | 0.53 ± 0.01° |
| CNS total energy | 2532 ± 7 kcal |
| CNS NOE energy | 433 ± 5 kcal |
| CNS phi/psi energy | 3.6 ± 0.3 kcal |
| wwPDB validation Ramachandran analysis | |
| Most favored | 98.0% |
| Allowed | 2.0% |
| Disallowed | 0% |
| Backbone atoms RMSDc | 0.333 ± 0.064 Å |
| Heavy atoms RMSDc | 0.712 ± 0.086 Å |
| PDB code | 6C8U |
Deviations from the standard chemical shifts ranges in the CNS databases.
Deviations from the standard geometry used in CNS.
Ill‐defined regions at residues ‐3‐20 and 97‐111 are excluded.
Figure 5.
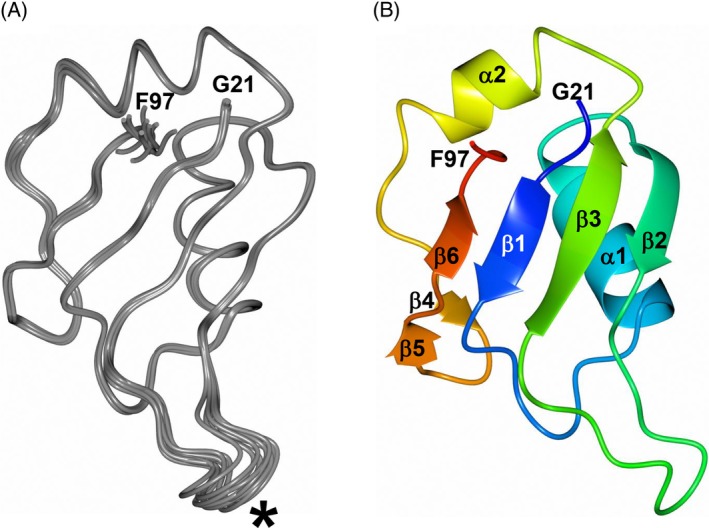
NMR solution structure of MSI2‐RRM1 with residues ‐3‐20 and 98‐111 excluded. A, Superposition of the backbone atoms for the 10 lowest energy structures of MSI2‐RRM1. The flexible loop between β2‐β3 is indicated by the asterisk. B, Ribbon diagram representation of the lowest energy structure of MSI2‐RRM1
3.4. 15N{1H} HetNOE measurement
The 15N{1H} HetNOE measured at 600 MHz for MSI2‐RRM1 is reported in Figure 6. The average HetNOE value for the folded core of MSI2‐RRM1 (residues K22‐R100) equals 0.68. HetNOE values that are one SD below the average, indicative of protein regions with fast motion on the ps‐ns timescale, were detected mostly for the N‐terminus, residue S33 at β1‐α1 loop, K59, R60, S61 at β2‐β3 loop, G63 at the beginning of β3, A70 at β3‐α2 loop, D92 at the beginning of β6, and the C‐terminal end. Overall, the HetNOE data demonstrate that the loop between β2 and β3 has greater flexibility than the rest of the protein (excluding the N‐ and C‐terminal tails) and that the loop connecting β1 and α1 is also flexible.
Figure 6.
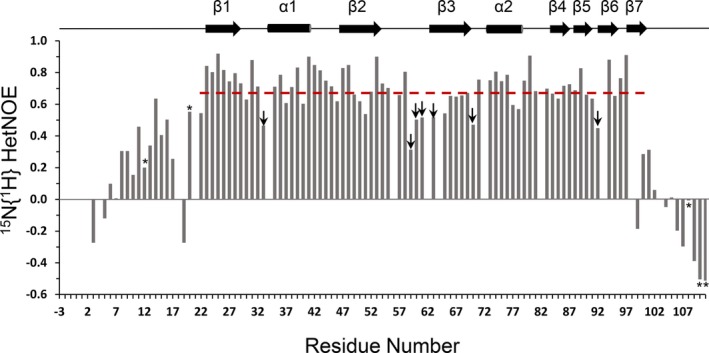
15N{1H} HetNOE values versus residue number of MSI2‐RRM1. Values marked with an asterisk are not reliable due to issues with volume measurement in either the reference or NOE spectrum. Red dashed line indicates the average HetNOE value (0.68) for residues K22‐R100. Values marked with an arrow are greater than or equal to one SD smaller than the average value for the folded core. These residues have greater flexibility than the rest of the protein, neglecting the N‐ and C‐terminal tails [Color figure can be viewed at http://wileyonlinelibrary.com]
3.5. MSI2‐RRM1 crystal and NMR structure comparison
The crystal structure shares a high degree of similarity with the solution NMR structure of MSI2‐RRM1. Superposition of the NMR structure (model 1) onto subunit A yielded an RMSD of 1.35 Å (68 residues aligned) between Cα‐atoms (Figure 7A). Apart from the C‐terminal “tail” spanning residues A101‐K111, which could not be modeled in the crystal structure, the main difference was observed in the loop that spans β2 and β3 (Figure 7B) which is shifted approximately 8.8 Å. Additionally, the backbone HetNOE data (Figure 6) show that the β2‐β3 loop has greater flexibility than the rest of the protein, excluding the N‐ and C‐terminal tails. As noted above, the crystals of MSI2‐RRM1 are tightly packed. As such, it is possible that the symmetry‐related molecules near the β2/β3 loop could prevent this region from adopting the conformation observed in the NMR structure.
Figure 7.
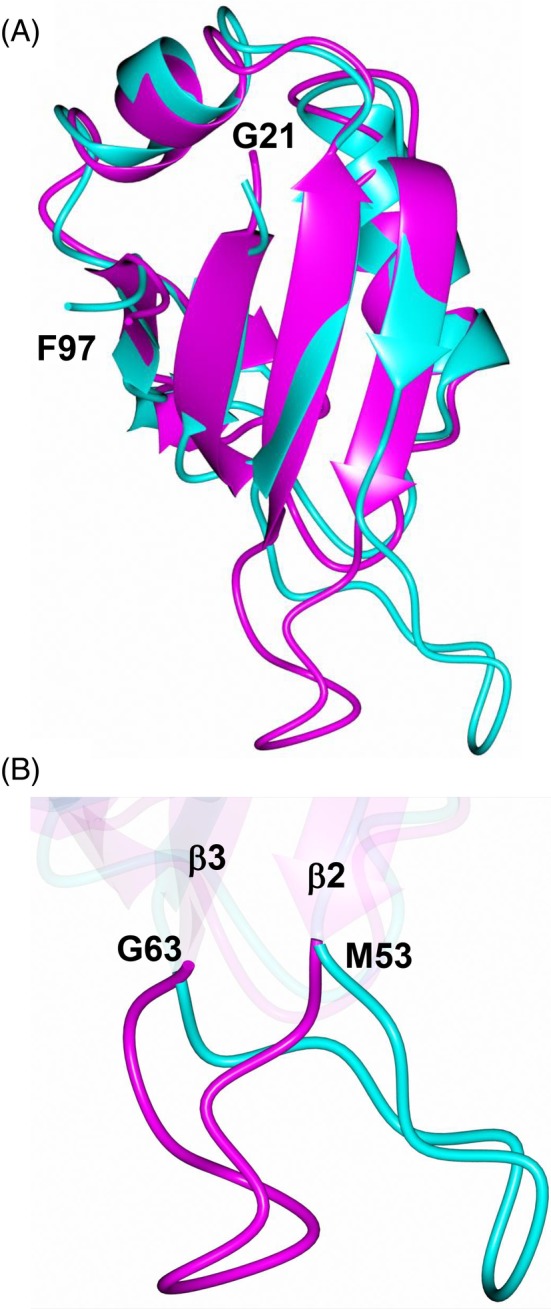
Comparison of the MSI2‐RRM1 crystal (magenta) and solution NMR (cyan) structures. A, Superposition of the NMR structure onto subunit A of the crystal structure. B, Zoomed‐in view of the conformational differences in the loop spanning β2‐β3
3.6. MSI2‐RRM1 comparison with MSI1‐RBD1 and other RBPs
The crystal structure was compared with solution NMR structures of the apo and RNA bound forms of the MSI1‐RBD1 homolog from M. musculus. Superposition of apo (1UAW) and RNA bound (2RS2) MSI1‐RBD1 onto chain A of the MSI2‐RRM1 crystal structure yielded RMSD of 2.17 Å (73 residues) and 0.82 Å (71 residues), respectively (Figure S3). Although the apo MSI1‐RBD1 structure displayed a higher RMSD, the overall structure is quite similar. The main differences arise in the loops connecting the helical and sheet secondary structure elements.
Evidence presented above suggests that the loop connected β2 and β3 displays a high degree of flexibility. Comparing this region of the MSI2‐RRM1 crystal structure with the lowest energy conformation of the RNA bound form of MSI1‐RBD1, revealed that this loop clashes with RNA and would need to undergo a conformational change to accommodate binding (Figure 8A). Interestingly, the MSI2‐RRM1 solution NMR structure appears to adopt a conformation similar to the RNA bound form in this region (Figure 8B). This is further supported by comparison with the lowest energy conformation of the apo structure of MSI1‐RBD1. As shown in Figure 8C,D, the β2/β3 loop in crystal structure of MSI2‐RRM1 adopts a similar conformation observed for the apo MSI1‐RBD1 structure.
Figure 8.
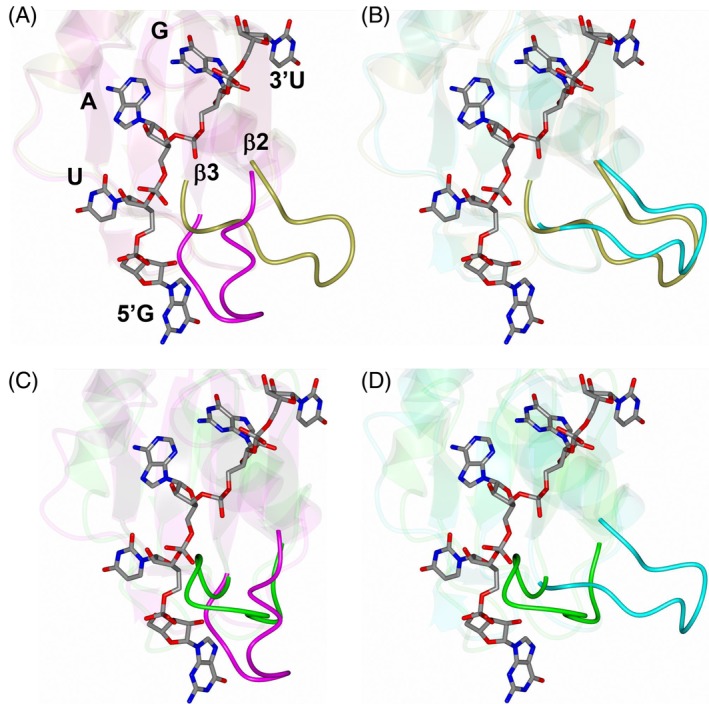
Comparison of the MSI2‐RRM1 crystal (magenta) and solution NMR (cyan) structures with RNA bound MSI1‐RBD1 (2RS2, gold) and apo MSI1‐RBD1 (1UAW, green). The RNA from 2RS2 is rendered as cylinders. The loop connecting β2‐β3 is highlighted in each panel. A, MSI2‐RRM1 crystal structure with 2RS2. B, MSI2‐RRM1 NMR structure with 2RS2. C, MSI2‐RRM1 crystal structure with 1UAW. D, MSI2‐RRM1 NMR structure with 1UAW
The MSI2‐RRM1 solution NMR structure ensembles were also compared with the MSI1‐RBD1 ensembles. Superposition of apo (1UAW) and RNA bound (2RS2) MSI1‐RBD1 onto chain A of the MSI2‐RRM1 solution NMR structure yielded RMSD of 1.77 Å (69 residues) and 1.26 Å (77 residues), respectively. Interestingly, the NMR model ensembles for MSI2‐RRM1 and RNA bound MSI1‐RBD1 show only minor conformational differences (Figure S4A). However, the superimposed ensembles of apo MSI1‐RBD1 displayed a high degree of difference in the β2/β3 loop (Figure S4B). The apo MSI1‐RBD1 structure adopts a wide conformational range in this loop spanning approximately 14 Å. In the RNA bound MSI1‐RBD1 structure, Arg 61 was shown to form an electrostatic interaction with an RNA phosphate group which likely serves to stabilize the β2/β3 loop. This corresponding residue in MSI2‐RRM1 (Arg 62) adopts a similar conformation in the solution NMR structure but occupies the RNA binding cleft in the crystal structure (Figure 9A).
Figure 9.
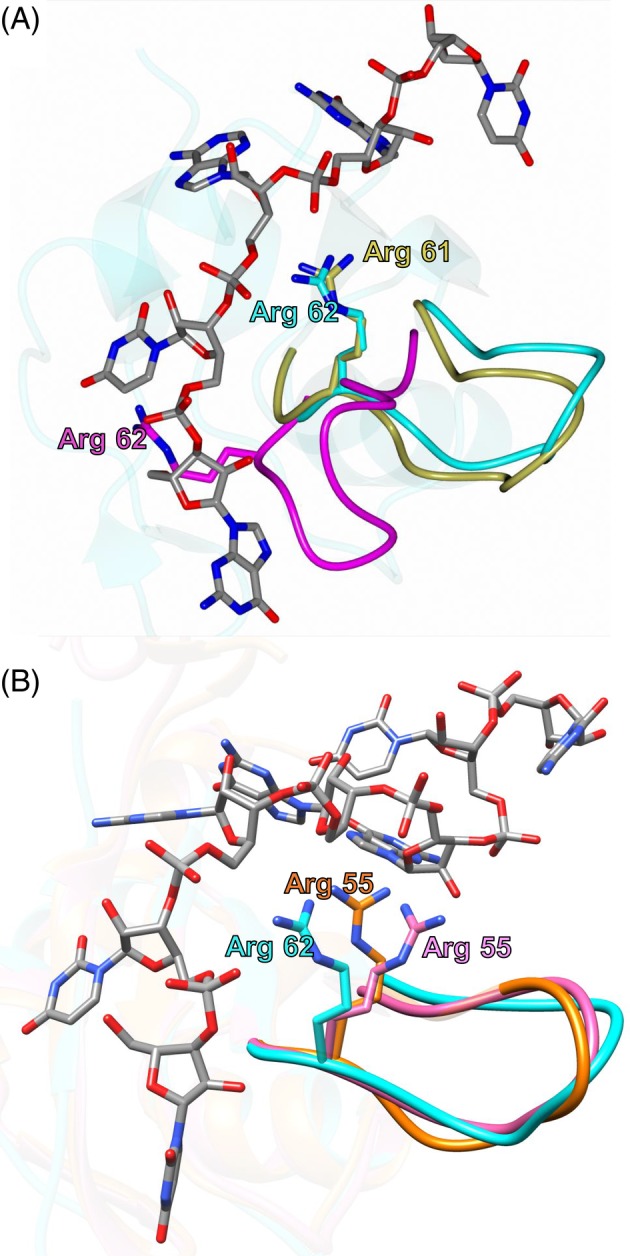
A, Comparison of the Arg 62 conformation in the MSI2‐RRM1 crystal (magenta), solution NMR (cyan) structures with Arg 61 of RNA bound MSI1‐RBD1 (2RS2, gold). B, Comparison of the Arg 62 conformation in the MSI2‐RRM1 solution NMR (cyan) structure with Arg 55 of apo HNRNP A1‐RRM1 (2LYV, orange) and RNA bound HNRNP A1‐RRM1 (5MPG, pink)
Although it is unclear why the β2/β3 loop adopts the RNA bound conformation in the solution NMR structure of MSI2‐RRM1, this feature is not unique to MSI2‐RRM1. The NMR structure of MSI2‐RRM1 displayed a high degree of similarity in the β2/β3 loop to many other apo RRMs. For example, the NMR structure of HNRNP A1 RRM1 (PDB ID: 2LYV51; RMSD for 70 Cα‐atoms: 1.16 Å), the crystal structure of HNRNP A1 RRM1(PDB ID: 1UP152; RMSD for 73 Cα‐atoms: 1.11 Å), the NMR structure of CYP33 RRM (PDB ID: 2KYX53; RMSD for 61 Cα‐atoms: 1.16 Å), the NMR structure of Hu antigen C RBD1 (PDB ID: 1D8Z54; RMSD for 61 Cα‐atoms: 1.47 Å), the crystal structure of hnRNP A18 RRM (PDB ID: 5TBX55; RMSD for 66 Cα‐atoms: 1.39 Å), and the NMR structure of drosophila sex‐lethal RBD1 (PDB ID: 2SXL56; RMSD for 61 Cα‐atoms: 1.61 Å). Interestingly, the NMR structures of both apo and RNA bound form of HNRNP A1 RRM1 (PDB ID 2LYV and 5MPG57) are similar to the NMR structure of MSI2‐RRM1 in that the β2/β3 loop and Arg 55 (corresponding to Arg 62 in MSI2‐RRM1) of the apo HNRNP A1 RRM1 adopts the RNA bound conformation (Figure 9B).
The NMR and crystal structures of MSI2‐RRM1 are similar to other RBPs as they all adopt a canonical RNP type folding: a β1α1β2β3α2β4 topology that forms a four‐stranded β‐sheet packed against two α‐helices and utilize two highly conserved regions, RNP1 and RNP2, to bind to RNA. RNP1 is located on β3 and is defined as Lys/Arg‐Gly‐Phe/Tyr‐Gly/Ala‐Phe/Tyr‐Val/Ile/Leu‐X‐Phe/Tyr, where X can be any amino acid.58, 59 RNP2 is located on β1 and is defined as (Ile/Val/Leu)‐(Phe/Tyr)‐(Ile/Val/Leu)‐X‐Asn‐Leu.60 The aromatic base stacking interaction between the aromatic residues in RNP1 and RNP2 and the RNA bases are a common feature in RBP/RNA complexes. Based on our previously published RNA titration work, in MSI2‐RRM1, F64 and F66 in RNP1 and F24 in RNP2 are likely to be responsible for the canonical aromatic base stacking interaction with RNA. Compared with other RBPs, MSI2‐RRM1 has a potentially unique feature in that a tryptophan in the β1‐ɑ1 loop (W30) and a phenylalanine in the C‐terminus (F97) may form noncanonical base‐stacking interactions with RNA.27 So far, we find that this feature is likely limited to the Musashi family proteins.
4. CONCLUSION
Here, we obtained the crystal and NMR structures of MSI2‐RRM1 and compared the structures to that of MSI1‐RBD1 and other RBPs. We showed that MSI2‐RRM1 adopts a canonical RNP type folding that is similar to other RBPs. The chemical shift assignments and structural information of MSI2‐RRM1 will be helpful for understanding MSI2‐RNA interaction and guiding rational drug design of MSI2‐specific inhibitors because MSI2‐RRM1 is the key motif that is responsible for the binding of MSI2 to its target mRNAs.
Abbreviations
- MSI
Musashi
- RRMs
RNA‐recognition motifs
- RBDs
RNA‐binding domains
- NMR
nuclear magnetic resonance
- RBPs
RNA‐binding proteins
- hnRNPs
heterogeneous nuclear ribonucleoproteins
- RNP
ribonucleoprotien
- FP
florescence polarization
- PDB
protein data bank
- RMSD
root‐mean‐square‐deviation
- BMRB
Biological Magnetic Resonance Data Bank
- CNS
Crystallography & NMR system
CONFLICT OF INTEREST
The authors declare no competing interest.
Supporting information
Appendix S1: Supporting Information
ACKNOWLEDGMENTS
This study was supported in part by National Institutes of Health grants R01 CA178831 and CA191785, NIH COBRE‐PSF at KU (P30 GM110761) Pilot Project, Department of Defense Breast Cancer Research Program Breakthrough Level II grant BC151845, and Kansas Bioscience Authority Rising Star Award (to LX). Use of the University of Kansas Protein Structure, BioNMR, and Protein Production Laboratories was supported by a grant from the National Institute of General Medical Sciences (P30 GM110761) at the National Institutes of Health. Use of the IMCA‐CAT beamline 17‐ID at the Advanced Photon Source was supported by the companies of the Industrial Macromolecular Crystallography Association through a contract with Hauptman‐Woodward Medical Research Institute. Use of the Advanced Photon Source was supported by the U.S. Department of Energy, Office of Science, Office of Basic Energy Sciences, under Contract No. DE‐AC02‐06CH11357. This study made use of NMRbox: National Center for Biomolecular NMR Data Processing and Analysis, a Biomedical Technology Research Resource (BTRR), which is supported by NIH grant P41GM111135 (NIGMS).
Lan L, Xing M, Kashipathy M, et al. Crystal and solution structures of human oncoprotein Musashi‐2 N‐terminal RNA recognition motif 1. Proteins. 2020;88:573–583. 10.1002/prot.25836
Lan Lan and Minli Xing contributed equally to this study.
Peer Review The peer review history for this article is available at https://publons.com/publon/10.1002/prot.25836.
Funding information Industrial Macromolecular Crystallography Association; Kansas Bioscience Authority, Grant/Award Number: Rising Star Award; National Institutes of Health, Grant/Award Numbers: P30 GM110761, R01 CA178831, R01 CA191785, p41 GM111135; U.S. Department of Defense, Grant/Award Number: BC151845; U.S. Department of Energy, Grant/Award Number: DE‐AC02‐06CH11357
REFERENCES
- 1. Wang S, Li N, Yousefi M, et al. Transformation of the intestinal epithelium by the MSI2 RNA‐binding protein. Nat. Commun. 2015;6 10.1038/ncomms7517. [DOI] [PMC free article] [PubMed] [Google Scholar]
- 2. Li N, Yousefi M, Nakauka‐Ddamba A, et al. The Msi family of RNA‐binding proteins function redundantly as intestinal oncoproteins. Cell Rep. 2015;13:2440‐2455. 10.1016/j.celrep.2015.11.022. [DOI] [PMC free article] [PubMed] [Google Scholar]
- 3. Zong Z, Zhou T, Rao L, et al. Musashi2 as a novel predictive biomarker for liver metastasis and poor prognosis in colorectal cancer. Cancer Med. 2016;5:623‐630. 10.1002/cam4.624. [DOI] [PMC free article] [PubMed] [Google Scholar]
- 4. Katz Y, Li F, Lambert NJ, et al. Musashi proteins are post‐transcriptional regulators of the epithelial‐luminal cell state. Elife. 2014;3:e03915 10.7554/eLife.03915. [DOI] [PMC free article] [PubMed] [Google Scholar]
- 5. Kang MH, Jeong KJ, Kim WY, et al. Musashi RNA‐binding protein 2 regulates estrogen receptor 1 function in breast cancer. Oncogene. 2017;36:1745‐1752. 10.1038/onc.2016.327. [DOI] [PubMed] [Google Scholar]
- 6. Kharas MG, Lengner CJ, Al‐Shahrour F, et al. Musashi‐2 regulates normal hematopoiesis and promotes aggressive myeloid leukemia. Nat Med. 2010;16:903‐908. 10.1038/nm.2187. [DOI] [PMC free article] [PubMed] [Google Scholar]
- 7. Ito T, Kwon HY, Zimdahl B, et al. Regulation of myeloid leukaemia by the cell‐fate determinant Musashi. Nature. 2010;466:765‐768. 10.1038/nature09171. [DOI] [PMC free article] [PubMed] [Google Scholar]
- 8. Griner LN, Reuther GW. Aggressive myeloid leukemia formation is directed by the Musashi 2/Numb pathway. Cancer Biol Ther. 2010;10:979‐982. [DOI] [PubMed] [Google Scholar]
- 9. Aly RM, Ghazy HF. Prognostic significance of MSI2 predicts unfavorable outcome in adult B‐acute lymphoblastic leukemia. Int J Lab Hematol. 2015;37:272‐278. 10.1111/ijlh.12284. [DOI] [PubMed] [Google Scholar]
- 10. Kaeda J, Ringel F, Oberender C, et al. Up‐regulated MSI2 is associated with more aggressive chronic myeloid leukemia. Leuk Lymphoma. 2015;56:2105‐2113. 10.3109/10428194.2014.981175. [DOI] [PubMed] [Google Scholar]
- 11. Thol F, Winschel C, Sonntag AK, et al. Prognostic significance of expression levels of stem cell regulators MSI2 and NUMB in acute myeloid leukemia. Ann Hematol. 2013;92:315‐323. 10.1007/s00277-012-1637-5. [DOI] [PubMed] [Google Scholar]
- 12. Byers RJ, Currie T, Tholouli E, Rodig SJ, Kutok JL. MSI2 protein expression predicts unfavorable outcome in acute myeloid leukemia. Blood. 2011;118:2857‐2867. 10.1182/blood-2011-04-346767. [DOI] [PubMed] [Google Scholar]
- 13. Kudinov AE, Deneka A, Nikonova AS, et al. Musashi‐2 (MSI2) supports TGF‐beta signaling and inhibits claudins to promote non‐small cell lung cancer (NSCLC) metastasis. Proc Natl Acad Sci U S A. 2016;113:6955‐6960. 10.1073/pnas.1513616113. [DOI] [PMC free article] [PubMed] [Google Scholar]
- 14. Cox JL, Wilder PJ, Gilmore JM, Wuebben EL, Washburn MP, Rizzino A. The SOX2‐interactome in brain cancer cells identifies the requirement of MSI2 and USP9X for the growth of brain tumor cells. PLoS One. 2013;8:e62857 10.1371/journal.pone.0062857. [DOI] [PMC free article] [PubMed] [Google Scholar]
- 15. Sheng W, Dong M, Chen C, et al. Cooperation of Musashi‐2, Numb, MDM2, and P53 in drug resistance and malignant biology of pancreatic cancer. FASEB J. 2017;31:2429‐2438. 10.1096/fj.201601240R. [DOI] [PubMed] [Google Scholar]
- 16. Guo K, Cui J, Quan M, et al. The novel KLF4/MSI2 signaling pathway regulates growth and metastasis of pancreatic cancer. Clin Cancer Res. 2017;23:687‐696. 10.1158/1078-0432.CCR-16-1064. [DOI] [PMC free article] [PubMed] [Google Scholar]
- 17. Fox RG, Lytle NK, Jaquish DV, et al. Image‐based detection and targeting of therapy resistance in pancreatic adenocarcinoma. Nature. 2016;534:407‐411. 10.1038/nature17988. [DOI] [PMC free article] [PubMed] [Google Scholar]
- 18. Kudinov AE, Karanicolas J, Golemis EA, Boumber Y. Musashi RNA‐binding proteins as cancer drivers and novel therapeutic targets. Clin Cancer Res. 2017;23:2143‐2153. 10.1158/1078-0432.CCR-16-2728. [DOI] [PMC free article] [PubMed] [Google Scholar]
- 19. Fox RG, Park FD, Koechlein CS, Kritzik M, Reya T. Musashi signaling in stem cells and cancer. Annu Rev Cell Dev Biol. 2015;31:249‐267. 10.1146/annurev-cellbio-100814-125446. [DOI] [PubMed] [Google Scholar]
- 20. Kharas MG, Lengner CJ. Stem Cells, Cancer, and MUSASHI in Blood and Guts. Trends Cancer. 2017;3:347‐356. 10.1016/j.trecan.2017.03.007. [DOI] [PMC free article] [PubMed] [Google Scholar]
- 21. Han Y, Ye A, Zhang Y, et al. Musashi‐2 silencing exerts potent activity against acute myeloid leukemia and enhances chemosensitivity to daunorubicin. PLoS One. 2015;10:e0136484 10.1371/journal.pone.0136484. [DOI] [PMC free article] [PubMed] [Google Scholar]
- 22. Lee J, An S, Choi YM, et al. Musashi‐2 is a novel regulator of paclitaxel sensitivity in ovarian cancer cells. Int J Oncol. 2016;49:1945‐1952. 10.3892/ijo.2016.3683. [DOI] [PubMed] [Google Scholar]
- 23. Altschul SF, Madden TL, Schäffer AA, et al. Gapped BLAST and PSI‐BLAST: a new generation of protein database search programs. Nucleic Acids Res. 1997;25:3389‐3402. [DOI] [PMC free article] [PubMed] [Google Scholar]
- 24. Chojnacki S, Cowley A, Lee J, Foix A, Lopez R. Programmatic access to bioinformatics tools from EMBL‐EBI update: 2017. Nucleic Acids Res. 2017;45:W550‐W553. 10.1093/nar/gkx273. [DOI] [PMC free article] [PubMed] [Google Scholar]
- 25. Sakakibara S, Nakamura Y, Satoh H, Okano H. Rna‐binding protein Musashi2: developmentally regulated expression in neural precursor cells and subpopulations of neurons in mammalian CNS. J Neurosci. 2001;21:8091‐8107. [DOI] [PMC free article] [PubMed] [Google Scholar]
- 26. Lan L, Appelman C, Smith AR, et al. Natural product (−)‐gossypol inhibits colon cancer cell growth by targeting RNA‐binding protein Musashi‐1. Mol Oncol. 2015;9:1406‐1420. 10.1016/j.molonc.2015.03.014. [DOI] [PMC free article] [PubMed] [Google Scholar]
- 27. Lan L, Xing M, Douglas JT, Gao P, Hanzlik RP, Xu L. Human oncoprotein Musashi‐2 N‐terminal RNA recognition motif backbone assignment and identification of RNA‐binding pocket. Oncotarget. 2017;8:106587‐106597. 10.18632/oncotarget.22540. [DOI] [PMC free article] [PubMed] [Google Scholar]
- 28. Kabsch W. Automatic indexing of rotation diffraction patterns. J Appl Crystallogr. 1988;21:67‐72. [Google Scholar]
- 29. Kabsch W. XDS. Acta Crystallogr, Sect D: Biol Crystallogr. 2010;66:125‐132. 10.1107/S0907444909047337. [DOI] [PMC free article] [PubMed] [Google Scholar]
- 30. Krug M, Weiss MS, Heinemann U, Mueller U. XDSAPP: a graphical user interface for the convenient processing of diffraction data using XDS. J Appl Crystallogr. 2012;45:568‐572. 10.1107/S0021889812011715. [DOI] [Google Scholar]
- 31. Evans PR. An introduction to data reduction: space‐group determination, scaling and intensity statistics. Acta Crystallogr D Biol Crystallogr. 2011;67:282‐292. 10.1107/S090744491003982X. [DOI] [PMC free article] [PubMed] [Google Scholar]
- 32. Matthews BW. Solvent content of protein crystals. J Mol Biol. 1968;33:491‐497. 10.1016/0022-2836(68)90205-2. [DOI] [PubMed] [Google Scholar]
- 33. McCoy AJ, Grosse‐Kunstleve RW, Adams PD, Winn MD, Storoni LC, Read RJ. Phaser crystallographic software. J Appl Cryst. 2007;40:658‐674. [DOI] [PMC free article] [PubMed] [Google Scholar]
- 34. Adams PD, Afonine PV, Bunkóczi G, et al. PHENIX: a comprehensive Python‐based system for macromolecular structure solution. Acta Crystallogr D Biol Crystallogr. 2010;66:213‐221. [DOI] [PMC free article] [PubMed] [Google Scholar]
- 35. Emsley P, Lohkamp B, Scott WG, Cowtan K. Features and development of Coot. Acta Crystallogr D Biol Crystallogr. 2010;66:486‐501. [DOI] [PMC free article] [PubMed] [Google Scholar]
- 36. Chen VB, Arendall WB 3rd, Headd JJ, et al. MolProbity: all‐atom structure validation for macromolecular crystallography. Acta Crystallogr D Biol Crystallogr. 2010;66:12‐21. [DOI] [PMC free article] [PubMed] [Google Scholar]
- 37. Potterton L, McNicholas S, Krissinel E, et al. Developments in the CCP4 molecular‐graphics project. Acta Crystallogr D Biol Crystallogr. 2004;60:2288‐2294. [DOI] [PubMed] [Google Scholar]
- 38. Liebschner D, Afonine PV, Moriarty NW, et al. Polder maps: improving OMIT maps by excluding bulk solvent. Acta Crystallogr D Struct Biol. 2017;73:148‐157. 10.1107/S2059798316018210. [DOI] [PMC free article] [PubMed] [Google Scholar]
- 39. Krissinel E. Enhanced fold recognition using efficient short fragment clustering. Journal of Molecular Biochemistry. 2012;1:76‐85. [PMC free article] [PubMed] [Google Scholar]
- 40. Kay LE, Ikura M, Bax A. Proton Proton Correlation Via Carbon Carbon Couplings ‐ a 3‐Dimensional Nmr Approach for the Assignment of Aliphatic Resonances in Proteins Labeled with C‐13. J Am Chem Soc. 1990;112:888‐889. 10.1021/ja00158a070. [DOI] [Google Scholar]
- 41. Kay LE, Xu GY, Singer AU, Muhandiram DR, Formankay JD. A Gradient‐Enhanced Hcch Tocsy Experiment for Recording Side‐Chain H‐1 and C‐13 Correlations in H2o Samples of Proteins. J Magn Reson Ser B. 1993;101:333‐337. 10.1006/jmrb.1993.1053. [DOI] [Google Scholar]
- 42. Marion D, Kay LE, Sparks SW, Torchia DA, Bax A. 3‐Dimensional Heteronuclear Nmr of N‐15‐Labeled Proteins. J Am Chem Soc. 1989;111:1515‐1517. 10.1021/ja00186a066. [DOI] [Google Scholar]
- 43. Delaglio F, Grzesiek S, Vuister GW, Zhu G, Pfeifer J, Bax A. NMRPipe: a multidimensional spectral processing system based on UNIX pipes. J Biomol NMR. 1995;6:277‐293 [DOI] [PubMed] [Google Scholar]
- 44. Johnson BA, Blevins RA. NMR View: A computer program for the visualization and analysis of NMR data. J Biomol NMR. 1994;4:603‐614. 10.1007/BF00404272. [DOI] [PubMed] [Google Scholar]
- 45. Vranken WF, Boucher W, Stevens TJ, et al. The CCPN data model for NMR spectroscopy: Development of a software pipeline. Proteins. 2005;59:687‐696. 10.1002/prot.20449. [DOI] [PubMed] [Google Scholar]
- 46. Maciejewski MW, Schuyler AD, Gryk MR, et al. NMRbox: A resource for biomolecular NMR computation. Biophys J. 2017;112:1529‐1534. 10.1016/j.bpj.2017.03.011. [DOI] [PMC free article] [PubMed] [Google Scholar]
- 47. Brunger AT, Adams PD, Clore GM, et al. Crystallography & NMR system: A new software suite for macromolecular structure determination. Acta Crystallogr D. 1998;54:905‐921. 10.1107/S0907444998003254. [DOI] [PubMed] [Google Scholar]
- 48. Zearfoss NR, Deveau LM, Clingman CC, et al. A conserved three‐nucleotide core motif defines Musashi RNA binding specificity. J Biol Chem. 2014;289:35530‐35541. 10.1074/jbc.M114.597112. [DOI] [PMC free article] [PubMed] [Google Scholar]
- 49. Ohyama T, Nagata T, Tsuda K, et al. Structure of Musashi1 in a complex with target RNA: the role of aromatic stacking interactions. Nucleic Acids Res. 2012;40:3218‐3231. 10.1093/nar/gkr1139. [DOI] [PMC free article] [PubMed] [Google Scholar]
- 50. Minuesa G, Albanese SK, Xie W, et al. Small‐molecule targeting of MUSASHI RNA‐binding activity in acute myeloid leukemia. Nat Commun 10, ARTN 2691, 2019. 10.1038/s41467-019-10523-3. [DOI] [PMC free article] [PubMed] [Google Scholar]
- 51. Barraud P, Allain FHT. Solution structure of the two RNA recognition motifs of hnRNP A1 using segmental isotope labeling: how the relative orientation between RRMs influences the nucleic acid binding topology. J Biomol Nmr. 2013;55:119‐138. 10.1007/s10858-012-9696-4. [DOI] [PubMed] [Google Scholar]
- 52. Xu RM, Jokhan L, Cheng XD, Mayeda A, Krainer AR. Crystal structure of human UP1, the domain of hnRNP A1 that contains two RNA‐recognition motifs. Structure. 1997;5:559‐570. 10.1016/S0969-2126(97)00211-6. [DOI] [PubMed] [Google Scholar]
- 53. Park S et al. The PHD3 Domain of MLL Acts as a CYP33‐Regulated Switch between MLL‐Mediated Activation and Repression. Biochemistry‐Us. 2010;49:6576‐6586. 10.1021/bi1009387. [DOI] [PMC free article] [PubMed] [Google Scholar]
- 54. Inoue M, Muto Y, Sakamoto H, Yokoyama S. NMR studies on functional structures of the AU‐rich element‐binding domains of Hu antigen C. Nucleic Acids Res. 2000;28:1743‐1750. 10.1093/nar/28.8.1743. [DOI] [PMC free article] [PubMed] [Google Scholar]
- 55. Coburn K, Melville Z, Aligholizadeh E, et al. Crystal structure of the human heterogeneous ribonucleoprotein A18 RNA‐recognition motif. Acta Crystallogr F. 2017;73:209‐214. 10.1107/S2053230x17003454. [DOI] [PMC free article] [PubMed] [Google Scholar]
- 56. Inoue M, Muto Y, Sakamoto H, et al. A characteristic arrangement of aromatic amino acid residues in the solution structure of the amino‐terminal RNA‐binding domain of drosophila sex‐lethal. J Mol Biol. 1997;272:82‐94. 10.1006/jmbi.1997.1213. [DOI] [PubMed] [Google Scholar]
- 57. Beusch, I. , Barraud, P. , Moursy, A. , Clery, A. & Allain, F. H. T. Tandem hnRNP A1 RNA recognition motifs act in concert to repress the splicing of survival motor neuron exon 7. Elife 6, doi:ARTN e25736 10.7554/eLife.25736 (2017). [DOI] [PMC free article] [PubMed] [Google Scholar]
- 58. Swanson MS, Nakagawa TY, LeVan K, Dreyfuss G. Primary structure of human nuclear ribonucleoprotein particle C proteins: conservation of sequence and domain structures in heterogeneous nuclear RNA, mRNA, and pre‐rRNA‐binding proteins. Mol Cell Biol. 1987;7:1731‐1739. [DOI] [PMC free article] [PubMed] [Google Scholar]
- 59. Adam SA, Nakagawa T, Swanson MS, Woodruff TK, Dreyfuss G. mRNA polyadenylate‐binding protein: gene isolation and sequencing and identification of a ribonucleoprotein consensus sequence. Mol Cell Biol. 1986;6:2932‐2943. [DOI] [PMC free article] [PubMed] [Google Scholar]
- 60. Dreyfuss G, Swanson MS, Pinol‐Roma S. Heterogeneous nuclear ribonucleoprotein particles and the pathway of mRNA formation. Trends Biochem Sci. 1988;13:86‐91. [DOI] [PubMed] [Google Scholar]
- 61. Evans P. Scaling and assessment of data quality. Acta crystallographica. Section D . Biol Crystallogr. 2006;62:72‐82. [DOI] [PubMed] [Google Scholar]
- 62. Diederichs K, Karplus PA. Improved R‐factors for diffraction data analysis in macromolecular crystallography. Nat Struct Biol. 1997;4:269‐275. [DOI] [PubMed] [Google Scholar]
- 63. Weiss MS. Global indicators of X‐ray data quality. J Appl Crystallogr. 2001;34:130‐135. [Google Scholar]
- 64. Karplus PA, Diederichs K. Linking crystallographic model and data quality. Science. 2012;336:1030‐1033. 10.1126/science.1218231. [DOI] [PMC free article] [PubMed] [Google Scholar]
- 65. Evans P. Biochemistry. Resolving some old problems in protein crystallography. Science. 2012;336:986‐987. 10.1126/science.1222162. [DOI] [PubMed] [Google Scholar]
Associated Data
This section collects any data citations, data availability statements, or supplementary materials included in this article.
Supplementary Materials
Appendix S1: Supporting Information


