

Abstract
Blastic plasmacytoid dendritic cell neoplasm (BPDCN) is a rare and highly aggressive hematological malignancy with a poorly understood pathobiology and no effective therapeutic options. Despite a few recurrent genetic defects (eg, single nucleotide changes, indels, large chromosomal aberrations) have been identified in BPDCN, none are disease‐specific, and more importantly, none explain its genesis or clinical behavior. In this study, we performed the first high resolution whole‐genome analysis of BPDCN with a special focus on structural genomic alterations by using whole‐genome sequencing and RNA sequencing. Our study, the first to characterize the landscape of genomic rearrangements and copy number alterations of BPDCN at nucleotide‐level resolution, revealed that IKZF1, a gene encoding a transcription factor required for the differentiation of plasmacytoid dendritic cell precursors, is focally inactivated through recurrent structural alterations in this neoplasm. In concordance with the genomic data, transcriptome analysis revealed that conserved IKZF1 target genes display a loss‐of‐IKZF1 expression pattern. Furthermore, up‐regulation of cellular processes responsible for cell‐cell and cell‐ECM interactions, which is a hallmark of IKZF1 deficiency, was prominent in BPDCN. Our findings suggest that IKZF1 inactivation plays a central role in the pathobiology of the disease, and consequently, therapeutic approaches directed at reestablishing the function of this gene might be beneficial for patients.
Keywords: BPDCN, blastic plasmacytoid dendritic cell neoplasm, cell adhesion, cutaneous lymphoma, Ikaros, IKZF1, RNA sequencing, whole‐genome sequencing
1. INTRODUCTION
Blastic plasmacytoid dendritic cell neoplasm (BPDCN) is a rare and highly aggressive hematological malignancy derived from neoplastic plasmacytoid dendritic cell (pDC) precursors. Patients with BPDCN have infiltration of malignant cells characterized by the expression of CD4, CD56, CD123, and CD303 in the skin, bone marrow, lymph nodes, and peripheral blood. The median overall survival of patients with BPDCN ranges from 12 to 14 months as the disease typically relapses after initial response to chemotherapy.1, 2
The pathogenetic basis of BPDCN has been investigated using DNA and RNA array‐based methods, and more recently, next generation sequencing (NGS) approaches limited to the exome (whole‐exome sequencing) or a panel of genes (targeted sequencing). Recurrent copy number alterations (CNAs) in BPDCN include broad deletions within chromosomes 7, 9, 12, 13, and 15, particularly the regions containing tumor suppressors CDKN2A/B, CDKN1B, and RB1.3, 4, 5, 6 Overexpressed genes with pathogenic relevance include BCL2 and CCND1.7 Single nucleotide variants (SNVs) and indels presumed as pathogenic have been observed predominantly in genes involved in cell cycle control (eg, ATM, TP53), chromatin regulation (eg, ASXL1, IDH2, NPM1, TET2), signal transduction (eg, KRAS, NRAS), splicing (eg, ZRSR2) and transcriptional regulation (eg, IKZF1/2/3, ZEB2).8, 9, 10, 11 Additionally, cytogenetic studies, most of them performed in the context of case reports, have revealed chromosomal rearrangements involving ALK, ETV6, EWSR1, KMT2A (MLL), MYB, MYC, and SUPT3H in a handful of cases.12, 13, 14, 15, 16, 17, 18
Even though these studies have uncovered a variety of genetic abnormalities in BPDCN, none of the reported alterations has provided a clear biological rationale behind neither the genesis of the disease nor its clinical behavior. Furthermore, as yet no study has characterized the landscape of genomic rearrangements and CNAs of BPDCN using high resolution NGS.
Here, we present the first whole‐genome analysis of BPDCN with a special emphasis on structural anomalies by using whole‐genome sequencing (WGS) and RNA sequencing (RNA‐seq). We report recurrent IKZF1 inactivation by focal structural alterations, a loss‐of‐IKZF1 expression pattern and overexpression of adhesion signatures in BPDCN. Our findings on genome and transcriptome level not only support IKZF1 inactivation as a putative driver event in the development of BPDCN, but also provide a conceptual basis for the pathobiology of the disease.
2. MATERIALS AND METHODS
2.1. Patient material
Frozen tumor biopsies from 10 patients with BPDCN (Table S1) were subjected to WGS. Four samples of this cohort (ie, BDN1, BDN4, BDN5, and BDN6) were additionally subjected to RNA‐seq. Diagnosis was performed by an expert panel of dermatologist and pathologists according to the criteria of the WHO‐EORTC classification for primary cutaneous lymphomas.2, 19, 20 Frozen tumor biopsies from 15 additional patients were used for validation purposes (extension cohort) (Table S1). Patient material was approved by the institutional review boards of Fondazione IRCCS Ca' Granda Ospedale Maggiore Policlinico, Leiden University Medical Center and University of Pavia. Informed consent was obtained from patients in accordance with the declaration of Helsinki.
2.2. Nucleic acid isolation
Genomic DNA was isolated using Genomic‐tip 20/G kit (Qiagen). DNA purity was evaluated with a Nanodrop One system (Nanodrop Technologies, Wilmington, California) and DNA integrity was verified by gel electrophoresis (0.7% agarose, ethidium bromide). Total RNA was isolated using RNeasy mini kit (Qiagen). RNA integrity was verified with an Agilent 2100 Bioanalyzer.
2.3. Sequencing and data processing
Sequencing was performed by the Beijing Genomics Institute (BGI) and data was processed at Leiden University Medical Center (LUMC). DNA libraries were subjected to paired‐end sequencing (2 × 150 bp) on the Illumina HiSeq X‐Ten platform while RNA libraries derived from rRNA‐depleted total RNA were subjected to paired‐end sequencing (2 × 100 bp) on the Illumina HiSeq 4000 platform. Raw reads (WGS, RNA‐seq) were processed using in‐house pipelines and clean reads were aligned to human reference genome Hg38 (Table S2). WGS and RNA‐seq data have been deposited in the European Genome‐Phenome Archive (EGA) under study number EGAS00001003660.
2.4. Detection of genomic rearrangements and fusion transcripts
Detection of structural genomic variants (SV) was performed using an in‐house pipeline that included three structural variant callers (Breakdancer‐max v1.4.4, CleverSV v2.0rc3 and Delly v0.6.7) (Table S3). SV calls were manually verified and curated using the Integrative Genomic Viewer (IGV, v2.3.78). The expression of fusion transcripts was investigated in four BPDCN samples with available RNA‐seq data using an in‐house pipeline that included two fusion transcript callers (FusionCatcher v0.99.6a and Star Fusion v0.8.0) (Table S4). Fusion transcript calls were contrasted with genomic SV data and visually verified on DNA level using IGV. Rearranged genes implicated in cancer were identified using the Network of Cancer Genes 6.0 (NCG 6.0)21 and literature search.
2.5. Detection of CNAs
Control‐FREEC was used to identify CNAs using a 50 Kb window. The output was subjected to a Wilcoxon rank test and a Kolmogorov‐Smirnov test to generate a list of genomic regions with statistically supported CNAs, and the latter were intersected to define recurrent events. As a complement, GISTIC2.0 analysis was performed with segment files derived from Control‐FREEC (Figure S1, Table S5). Recurrent CNAs derived from both analyses were visually verified and curated using IGV (Table S6). Only CNAs confirmed after inspection are reported.
2.6. Detection of SNVs and indels
SNVs and indels were detected using GATK (v3.5). Variants filtered out of the output included SNVs present in dbSNP, SNVs with >5% minor allele frequency in the Exome aggregation consortium (ExAC) database, and SNVs present in an in‐house cohort formed by 11 healthy volunteers. We searched for deleterious SNVs in 1271 genes taking part in signal transduction pathways, the cell cycle, hematopoietic cell differentiation, and cellular processes previously identified as mutated in BPDCN.8, 9, 10 Gene lists were retrieved from the PathCards database (http://pathcards.genecards.org/). Only SNVs predicted to produce highly deleterious amino acid substitutions by both SIFT and PolyPhen‐2 were further investigated on ClinVar, COSMIC, Varsome, and literature.
2.7. Differential expression analysis
TMM normalization was applied to raw count data using EdgeR and differential expression analysis was performed using Limma‐Voom. BPDCN samples were compared to a control group formed by resting pDCs. RNA‐seq data of pDC controls were generated by Alculumbre et al and downloaded from GEO (https://www.ncbi.nlm.nih.gov/geo/; GSE84204).22 Genes with a FDR < 0.01 were considered differentially expressed (DE).
2.8. Gene ontology annotation and transcriptome analysis
Gene ontology annotation of rearranged genes and pathway analysis with DE genes were performed using DAVID (v6.8) using default settings.23 Gene set enrichment analysis (GSEA, v2.2.4) was run as a pre‐ranked analysis with 1000 permutations using gene set KEEG from the Molecular Signatures Database (MSigDB).24 Normalized enrichment scores (NES) were calculated to determine expression signatures. FDR q values were obtained. Additional functional characterization of the transcriptome (ie, ENCODE and CORUM databases) was performed using Enrichr.25
2.9. Validation of structural genomic alterations and small‐scale mutations
Select genomic rearrangements, interstitial deletions, indels, and SNVs were validated by Sanger sequencing. Briefly, target sequences were amplified by PCR, run on a 1% agarose gel, column‐purified and sequenced on the Applied Biosystems ABI3730xl platform. Validation of select CNAs was performed using Bio‐Rad QX200 droplet digital PCR (ddPCR) system. ddPCR experiments were carried out following the manufacturer's guidelines. Briefly, 20 to 40 ng of genomic DNA was mixed with a frequent‐cutting restriction enzyme, ddPCR supermix, probes against the gene of interest (FAM‐labeled) and probes against the reference gene (HEX‐labeled). The reaction mix was then partitioned into 20.000 nanodroplets, and subsequently, subjected to the following cycling program: 95°C for 10 minutes, 39 cycles of 94°C for 30 seconds, and 60°C for 1 minute, and 98°C for 10 minutes. Copy number values were determined using Bio‐Rad Quantasoft software v1.7.4. Copy number reported for IKZF1 (at exons 1, 5, and 8) in samples from the validation cohort are the average of 3 independent measurements using different reference genes.
3. RESULTS
3.1. Landscape of genomic rearrangements
BPDCN displayed a heterogenous landscape of rearrangements. We detected a total of 86 rearrangements in 10 BPDCN genomes (Figure 1). The number of events per patient ranged from 1 to 18 (mean/patient ± SD, 9 ± 5) (Figures 2A and S2). Intrachromosomal events constituted 66% of all rearrangements (range/patient, 0%‐100%) (Figure 2B). We observed events joining either two annotated genes (32% of events), a gene with a nongenic region (36%), two nongenic regions (27%), or rearranging sequences within a single gene (5%) (Figure 2C).
Figure 1.
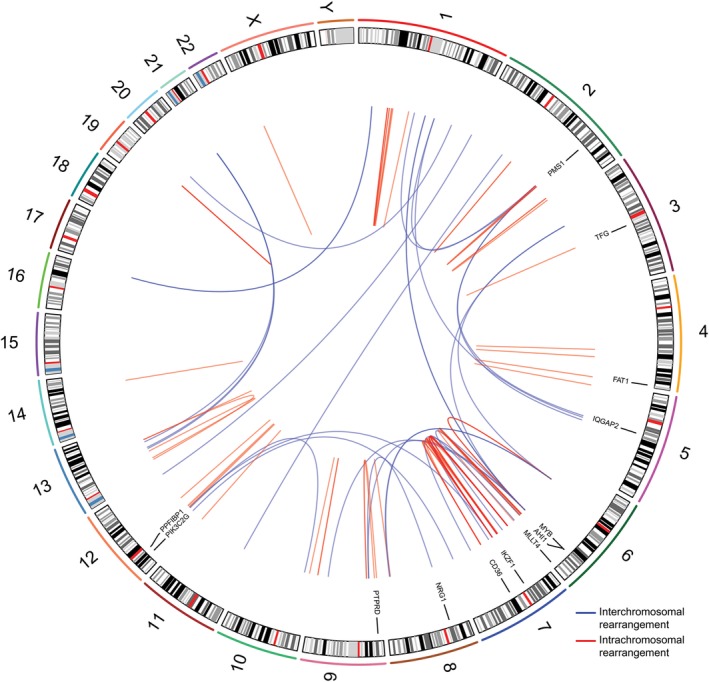
Landscape of genomic rearrangements in BPDCN. Circos plot showing 86 genomic rearrangements detected in 10 BPDCN genomes by WGS. The outer ring is formed by human chromosome ideograms arranged circularly end to end. The area at the center of the plot contains arcs representing interchromosomal (blue) and intrachromosomal (red) events. The ring between the chromosome ideograms and the arcs contains rearranged genes with established roles in cancer. BPDCN, blastic plasmacytoid dendritic cell neoplasm; WGS, whole‐genome sequencing [Color figure can be viewed at http://wileyonlinelibrary.com]
Figure 2.
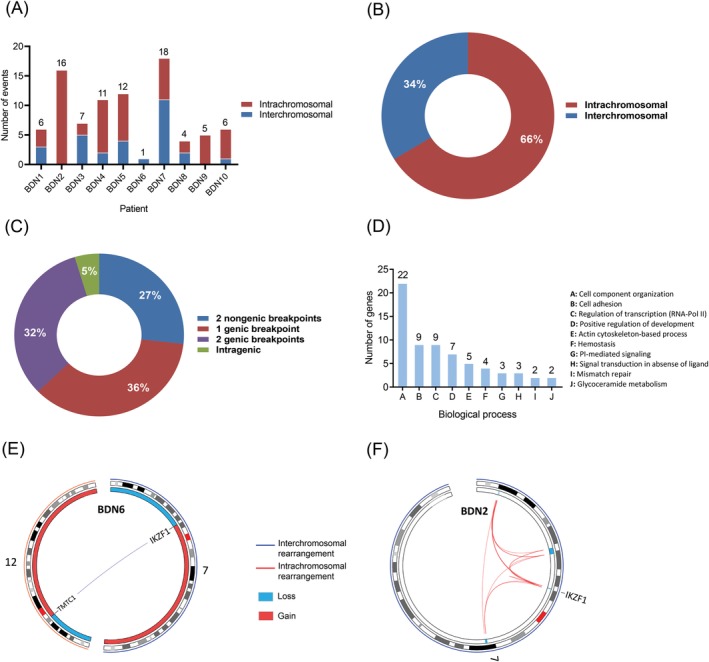
Distribution of genomic rearrangements and gene ontology annotation of rearranged genes in BPDCN. A, Number of genomic rearrangements per patient. The distribution of inter‐ and intrachromosomal rearrangements per patient is shown too; B, Distribution of inter‐ and intrachromosomal rearrangements (cohort); C, Distribution of genomic rearrangements based on the type of DNA sequences (genic, nongenic) involved in the event (cohort); D, Distribution of rearranged genes according to the biological process their encoded protein participates in; E, Circos plot showing interchromosomal rearrangement t(7;12)(p12;p11) in patient BDN6 which fuses TMTC1 with IKZF1, causing the inactivation of the latter. F, Circos plot displaying a chromothripsis‐like event in patient BDN2 which mediated the loss of several focal regions in chromosome 7, including a narrow area (450 Kb) containing IKZF1. BPDCN, blastic plasmacytoid dendritic cell neoplasm [Color figure can be viewed at http://wileyonlinelibrary.com]
Genomic rearrangements disrupted a total of 54 genes across 10 patients (Table S7). Out of 54 rearranged genes, 13 are implicated in cancer at present (Figure 1, Table S8). The latter group included genes implicated in hematological malignancies (ie, AHI1, CD36, IKZF1, MLLT4, MYB, TFG) and other neoplasms (ie, FAT1, IQGAP2, NRG1, PIK3C2G, PMS1, PPFIBP1, PTPRD). Gene ontology analysis showed that rearranged genes primarily encode proteins that participate in cellular component organization (esp. cytoskeleton‐related processes), cell adhesion and transcriptional regulation (Figure 2D, Table S9).
We observed two recurrently rearranged genes, MYB and TMTC1, both of them in 2 of 10 patients. The type of MYB rearrangements found in our patients (BDN3 and BDN10) have been previously described in BPDCN and result in a gain‐of‐function effect due to the loss of the 3′‐end of the gene which contains conserved target sites for inhibitory microRNAs (miRNAs).16 In contrast, the observed TMTC1 rearrangements do not seem to have analogous functional consequences (ie, dissimilar breakpoint positions, loss vs gain of DNA, genic vs nongenic partner sequences). We detected additional rearrangements reported in cancer before. An oncogenic rearrangement involving SUPT3H, found in patient BDN1, has been previously described in BPDCN.18 Also, fusion gene NAV2‐TCF7L1, found in patient BDN7, is recurrent in colorectal cancer.26
Notably, we identified rearrangements leading to IKZF1 inactivation. Fusion gene TMTC1‐IKZF1, found in patient BDN6, had a truncated coding sequence (CDS) encoding a peptide constituted only by the first 77‐AA of TMTC1 due to the formation of a premature stop codon; thus, preventing the synthesis of a functional IKZF1 protein (Figures 2E and 5C). Another patient, BDN2, underwent a chromothripsis‐like event in chromosome 7 that resulted in the deletion of several focal areas within 7p and 7q, including a narrow region (450 Kb) containing IKZF1 (Figure 2F).
3.2. Landscape of CNAs
BPDCN exhibited a predominance of large‐scale chromosomal imbalances. Broad numerical aberrations (˃3 Mb) included monosomy 9 (four patients), as well as deletions within 3p (two patients), 6q (five patients), 7p (three patients), 9p (two patients), 9q (three patients), 12p (three patients), 13q (six patients), 15q (two patients), and Y (two patients). Also, broad gains within 1q (three patients), 7q (two patients) and 12q (two patients) (Figures 3 and 4).
Figure 3.
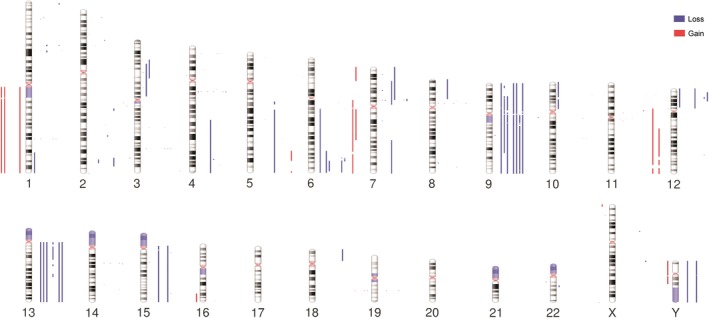
Landscape of CNAs in BPDCN. Human chromosome ideograms displaying regions of gain and loss detected through WGS in 10 BPDCN genomes. Blue bars to the right of the chromosomes depict regions of loss whereas red bars to the left of the chromosomes depict regions of gain. BPDCN, blastic plasmacytoid dendritic cell neoplasm; CNAs, copy number alterations; WGS, whole‐genome sequencing [Color figure can be viewed at http://wileyonlinelibrary.com]
Figure 4.
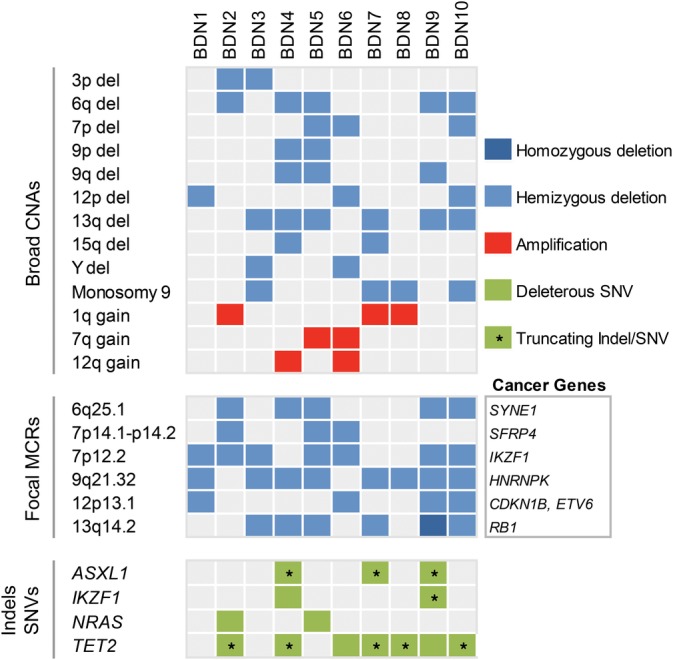
Distribution of recurrent CNAs and deleterious indels/SNVs in BPDCN. Upper panel: large CNAs (˃3 Mb). Middle panel: focal MCRs (≤3 Mb) between CNAs; reputable tumor suppressors enclosed within focal MCRs are specified. Bottom panel: Indels and SNVs either leading to protein truncations, reported as pathogenic in literature or predicted as deleterious (SIFT and PolyPhen‐2) are shown. Only genes mutated in more than one patient are indicated. BPDCN, blastic plasmacytoid dendritic cell neoplasm; CNAs, copy number alterations; MCRs, minimal common regions; SNVs, single nucleotide variants [Color figure can be viewed at http://wileyonlinelibrary.com]
We detected seven focal (≤3 Mb) minimal common regions (MCRs) between CNAs affecting our sequenced patients (Table S6). Out of seven focal MCRs, six contained either bona fide or candidate cancer genes. These focal MCRs were deletions at 9q21.32, 7p12.2, 13q14.2, 6q25.1, 12p13.1, and 7p14.1‐p14.2 observed in eight, seven, six, five, four, and three out of 10 sequenced patients, respectively (Figure 4). Cancer genes residing within these regions are mainly involved in hematopoiesis and cell cycle regulation.
The most common focal MCRs were deletions at 9q21.32 and 7p12.2 which contained, respectively, tumor suppressors HNRNPK and IKZF1. HNRNPK encodes a nuclear ribonucleoprotein that influences multiple cellular functions (eg, cell cycle, chromatin remodeling, RNA synthesis, and processing) in hematopoietic cells.27 IKZF1, on the other hand, encodes a transcription factor with critical roles in the development of various hematopoietic lineages, including pDCs.28, 29, 30, 31 Remarkably, deletions at 7p12.2 were considerably narrow (<500 Kb) in four of seven affected patients, ranging from loss of IKZF1 and a few neighboring genes, to loss of the IKZF1 locus exclusively, to loss of IKZF1's exon 8 only (Figure 5A,B). Patients where deletions did not involve the whole locus, but part of it, enclosed exons encoding IKZF1's functional domains (Figure 5B). For instance, the loss of exon 8 in patient BDN1 generated a CDS encoding an IKZF1 protein that lacked its C‐terminal dimerization domain, which is essential for its functionality (Figure 5D).
Figure 5.
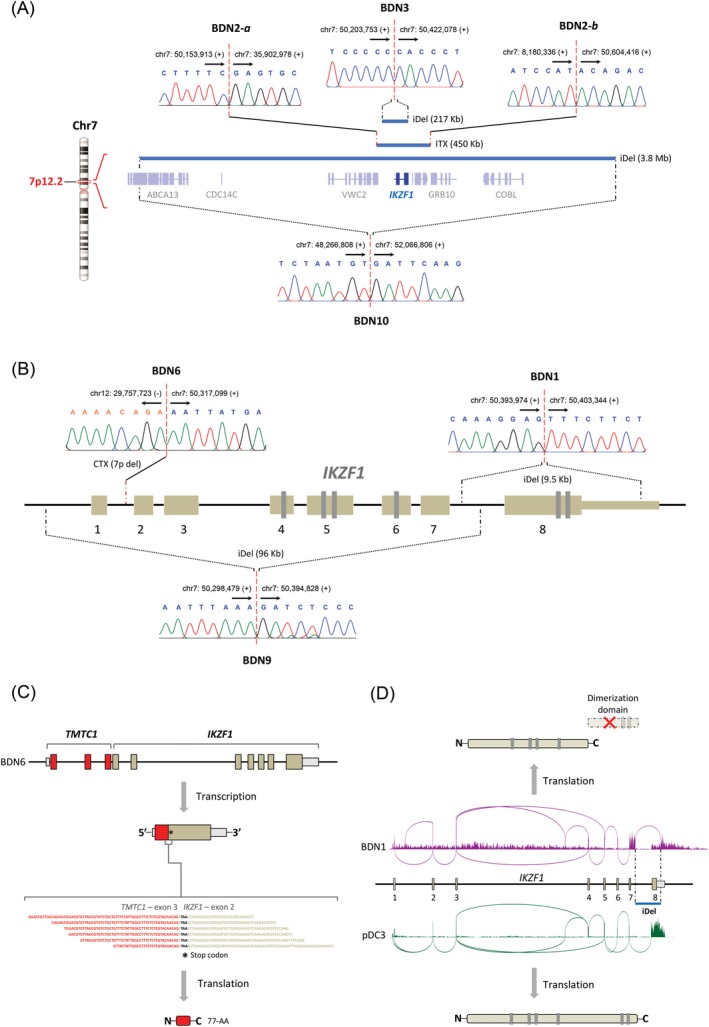
Interstitial deletions and rearrangements inactivate IKZF1 in BPDCN. A, Diagram representing the hemizygous loss of IKZF1 (217 Kb‐3.8 Mb) in BPDCN tumors. Blue bars depict deleted areas at 7p12.2 in tumors from three patients with BPDCN. Monoallelic IKZF1 deletion occurred through narrow interstitial deletions in patients BDN3 and BDN10, and through a complex intrachromosomal rearrangement in patient BDN2 (see also Figure 2F); B, Diagram showing inactivating structural changes at the IKZF1 locus in BPDCN tumors. These events included narrow interstitial deletions (BDN1/9) and an unbalanced interchromosomal rearrangement (BDN6). The breakpoints of all IKZF1‐inactivating structural alterations were validated by Sanger sequencing. Genomic coordinates of breakpoints according to reference genome Hg38. Arrows indicate the direction toward which genomic coordinate numbers increase. Plus (+) and minus (−) signs specify strand polarity; C, The fusion between TMTC1 and IKZF1 in patient BDN6 generated a truncated coding sequence (77‐AA) due to the formation of a premature stop codon (shown in RNA‐seq reads), rendering IKZF1 inactive on protein level. D, Sashimi plots showing RNA expression at IKZF1 in patient BDN1 (purple) and control sample pDC3 (green). Due to a focal interstitial deletion (blue bar), the transcript of IKZF1 in patient BDN1 lacks exon 8, and instead includes a readthrough sequence starting from exon 7 toward the remaining part of the 3′‐UTR and beyond. The resulting transcript encodes a functionally defective IKZF1 protein that lacks its dimerization domain. BPDCN, blastic plasmacytoid dendritic cell neoplasm; CTX, interchromosomal rearrangement; iDel, interstitial deletion; ITX, intrachromosomal rearrangement [Color figure can be viewed at http://wileyonlinelibrary.com]
Deletions at 13q14.2 and 6q25.1 encompassed, respectively, RB1 and SYNE1. RB1 encodes an established negative regulator of the cell cycle whereas candidate tumor suppressor SYNE1, which is often silenced by hypermethylation in lung cancer,32 encodes a cytoskeleton‐associated protein that helps maintain subcellular spatial organization.
Deletion at 12p13.1 included tumor suppressors CDKN1B, DUSP16, and ETV6 which play roles in the cell cycle, signal transduction and hematopoiesis, respectively. Finally, deletion at 7p14.1‐p14.2 enclosed tumor suppressor SFRP4, a negative regulator of WNT signaling.
3.3. Small‐scale mutations
We looked for small‐scale mutations (ie, indels, SNVs) with potential pathogenic relevance in exonic sequences of genes involved in the cell cycle, hematopoietic cell differentiation, signal transduction (ie, JAK‐STAT, MAPK, NF‐κB, and PI‐3‐K/Akt signaling pathways) and genes that have been previously found to be mutated in BPDCN (Table S10).
Two gain‐of‐function SNVs, BRAF (p.G464V33) and NRAS (p.E63K34), were observed in patient BDN5. NRAS (p.G12A35), a SNV associated with melanoma and lung cancer, was found in patient BDN2. Truncating frameshift mutations in ASXL1 (p.E635Rfs*15, p.V624Gfs*8) were observed in BDN4/9 and BDN7, respectively. Also, seven patients carried indels and SNVs leading either to premature stop codons or amino acid substitutions predicted as deleterious in TET2. (Figures 4, S3, and S4). Of note, we found mutations in IKZF1 (ie, BDN9: p.H421Afs*68, BDN4: p.H480Y) that impacted the dimerization domain of this gene. The former mutation generates an IKZF1 protein with a truncated dimerization domain while the latter leads to an amino acid substitution predicted as deleterious (Figures S3 and S4).
Finally, we found 24 additional patient‐specific SNVs of unknown significance in cancer‐associated genes, including genes previously implicated in BPDCN (ie, ARID1A, ASH1L, ASXL3, ATR, CBLC, CHD8, EP400, ETV6, PHC2, RAD52, SMARCD1, SRSF2, and ZRSR2) (Table S11).
3.4. DE genes
Prior research using array‐based gene expression profiling showed that BPDCN cells appear to originate from pDC precursors that are phenotypically close to resting pDCs.7 Therefore, to determine DE genes in the disease, we compared gene expression in BPDCN with gene expression in resting pDCs. The analysis uncovered 1827 DE genes (1191 up‐regulated, 636 down‐regulated, FDR < 0.01) (Figure 6A, Table S12), 272 of which are currently associated with cancer (213 up‐regulated, 64 down‐regulated) (Table S13). Up‐regulated genes included (proto‐) oncogenes with roles in apoptosis (ie, BCL2, TERT), cell cycle regulation (ie, FOXM1), hematopoietic cell development (ie, AFF3, MYB), and signal transduction (ie, BCL9, FGFR1, MET, PDGFRA, PDGFRB, PLCG1, RRAS2) (Figure 6B). Prominent down‐regulated genes included cell cycle inhibitors (ie, BTG2, IFIT3, TSPYL2, TXNIP) and tumor suppressors implicated in hematological malignancies (ie, PTPRO, SAMD9L) (Figure 6B).
Figure 6.
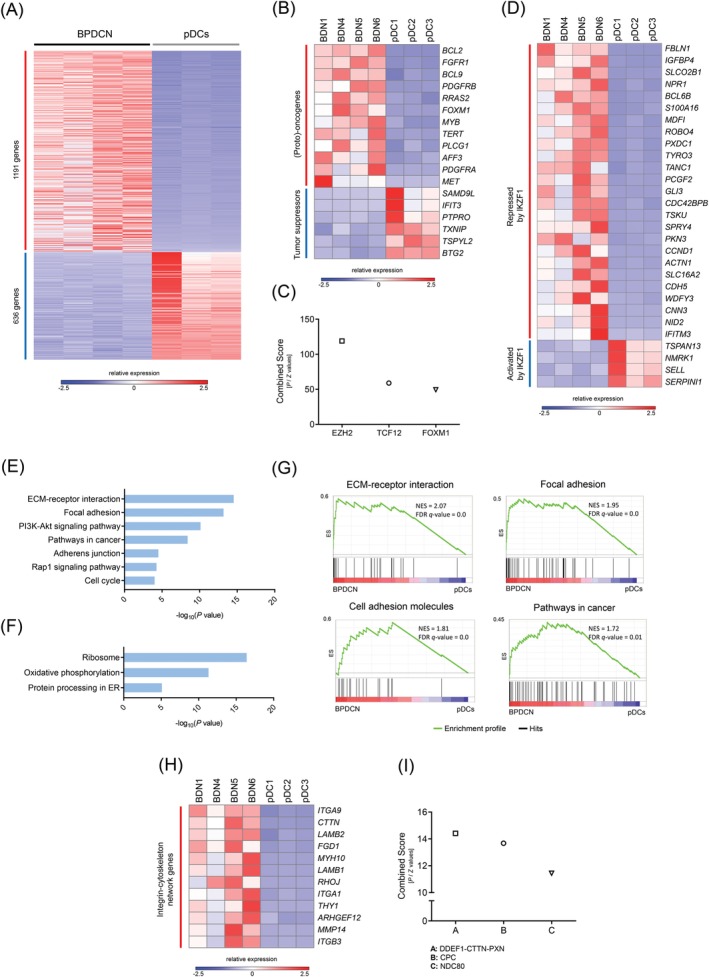
RNA‐seq supports a loss‐of‐IKZF1 phenotype in BPDCN and uncovers aberrant cell adhesion in the disease. A, Heat map showing 1827 differentially expressed genes (1191 up‐regulated, 636 down‐regulated, FDR < 0.01) in BPDCN when compared to resting pDCs. B, (Proto)‐oncogenes and tumor suppressors involved in cell cycle regulation, hematopoietic cell differentiation and signal transduction are differentially expressed in BPDCN. C, Genes regulated by EZH2, TCF12, and FOXM1 are the most overrepresented in the group of up‐regulated genes. D, Conserved IKZF1 target genes follow a loss‐of‐IKZF1 expression pattern in BPDCN; that is, genes repressed by IKZF1 are up‐regulated while genes activated by IKZF1 are down‐regulated. E, F, Pathway analysis using DAVID uncovered up‐regulation of cellular processes responsible for cell‐cell and cell‐ECM interactions, the PI‐3‐K/Akt pathway, the Rap1 pathway and the cell cycle. Down‐regulated profiles included ribosome, oxidative phosphorylation and protein processing in the endoplasmic reticulum (ER) (See Table S16 for a complete list of enriched terms/processes). G, Gene set enrichment analysis (GSEA) confirmed that BPDCN is characterized by the up‐regulation of adhesion signatures. NES, normalized enrichment score; FDR q‐value, false discovery rate q‐value. (See Table S17 for a complete list of GSEA signatures). H, Genes encoding components of the integrin‐cytoskeleton network, which have been shown to undergo up‐regulation due to IKZF1 deficiency in BCR‐ABL1+ pre‐B ALL, are up‐regulated in BPDCN as well. I, Protein complex DDEF1‐CTTN‐PXN is predicted to exist in BPDCN cells based on transcriptome data. This complex has only been found in neoplastic cells with an invasive phenotype. BPDCN, blastic plasmacytoid dendritic cell neoplasm; CPC, chromosomal passenger complex; NDC80, NDC80 kinetochore complex [Color figure can be viewed at http://wileyonlinelibrary.com]
Transcriptome analysis with Enrichr using ChIP‐seq data from ENCODE revealed that genes regulated by EZH2, TCF12, and FOXM1 are greatly overrepresented in the group of up‐regulated genes (Figure 6C, Table S14). EZH2 is part of polycomb repressive complex 2 (PRC2), a gene silencing protein complex that influences various cellular processes, including hematopoietic cell differentiation.36 Transcription factor TCF12, on the other hand, participates in T‐cell differentiation and is typically lowly expressed in mature pDCs.37 Finally, transcription factor FOXM1, which is overexpressed in numerous cancers, takes part in multiple biological processes (eg, apoptosis, cell cycle, DNA damage response).38
Since IKZF1 deletion was the most focal recurrent CNA in our sequenced cohort, we next looked at the expression of a group of evolutionarily conserved IKZF1 target genes that are associated with the development of BCR‐ABL1+ pre‐B acute lymphoblastic leukemia (pre‐B ALL)39, 40 (Table S15), an aggressive hematological cancer characterized by IKZF1 inactivation. We detected 29 DE cancer‐associated IKZF1 target genes (25 up‐regulated, 4 down‐regulated) in BPDCN (Figure 6D). The expression of all IKZF1 target genes matched perfectly the expected consequence of IKZF1 deficiency; that is, genes repressed by IKZF1 were up‐regulated while genes activated by IKZF1 were down‐regulated. Genes of interest in the group of up‐regulated IKZF1 targets included among others, CCND1, CDC42BPB, and IFITM3. Cyclin D1 (encoded by CCND1) promotes G1/S transition in the cell cycle and has been previously found to be overexpressed in BPDCN.7 CDC42BPB encodes a serine/threonine kinase with roles in cytoskeletal reorganization and cell migration.41 Interestingly, overexpression of this kinase has been shown to facilitate cancer cell invasion.42 Finally, IFITM3 encodes an antiviral membrane protein that has been shown to trigger CD19‐mediated PI‐3‐K/Akt signaling in pre‐B ALL.43
3.5. Deregulated processes/pathways
We performed pathway analysis with DAVID to identify deregulated cellular processes/pathways in BPDCN. The analysis uncovered up‐regulation of several adhesion profiles: ECM‐receptor interaction (P = 2.51 × 10⁻¹⁵), focal adhesion (P = 5.61 × 10⁻¹⁴), adherens junction (P = 2.64 × 10⁻⁵), and Rap1 signaling (P = 4.58 × 10⁻⁵). BPDCN also displayed up‐regulation of PI‐3‐K/Akt signaling (P = 6.46 × 10⁻¹¹) and the cell cycle (P = 8.22 × 10⁻⁵) (Figure 6E, Table S16). Down‐regulated cellular processes included ribosome synthesis (P = 3.34 × 10⁻¹⁷), oxidative phosphorylation (P = 4.11 × 10⁻¹²) and protein processing in the endoplasmic reticulum (ER) (P = 6.98 × 10⁻⁶) (Figure 6F, Table S16). To complement DAVID analysis, we performed GSEA using gene set KEEG from MSigDB. GSEA confirmed that BPDCN is characterized by the up‐regulation of adhesion signatures (Figure 6G, Table S17). Importantly, these deregulated profiles support an IKZF1‐deficient phenotype of BPDCN cells, as previous studies performed by others have established that a hallmark of IKZF1 deficiency in immune cells (ie, pDCs, pre‐B cells) is the overexpression of proteins responsible for cell‐cell and cell‐ECM interactions.29, 44
Additionally, we identified a group of up‐regulated genes encoding components of the integrin‐cytoskeleton network that have been proven to undergo up‐regulation as a result of IKZF1 deficiency in murine models of pre‐B ALL (Figure 6H).44 One of these genes, THY1 (CD90), encodes a membrane glycoprotein involved in integrin signaling and adhesion. Notably, THY1 is one of the key surface molecules underlying the highly adhesive phenotype of IKZF1‐deficient malignant cells in BCR‐ABL1+ pre‐B ALL.45, 46 Another gene, CTTN, encodes cortactin, a cytoplasmic protein that participates in the formation of podosomes in motile cells. Cortactin overexpression occurs in a number of aggressive cancers and promotes the formation of invadopodia (hyperactive podosomes) which make malignant cells highly invasive and migratory.47 Interestingly, transcriptome analysis with Enrichr using CORUM database predicted the existence of protein complex DDEF1‐CTTN‐PXN in BPDCN cells (Figure 6I, Table S18). This cytoskeleton‐associated protein complex has been found exclusively in malignant cells with highly invasive behavior (breast cancer), and not in their noninvasive or normal counterparts.48
3.6. Structural alterations involving IKZF1 are recurrent in BPDCN
Since the findings derived from our genome and transcriptome analyses strongly pointed at IKZF1 as a central player in the pathogenesis of BPDCN, we next used ddPCR to assess the copy number of IKZF1 in tumors from 15 additional patients. Because our genomic data showed that IKZF1‐disrupting unbalanced rearrangements and deletions did not affect the entire locus in all patients, but deleted only the 5′‐end or the 3′‐end of IKZF1 in some of them (Figures 5B and 7A), we evaluated copy number at three different exons (ie, 1, 5, and 8). Exons 1, 5, and 8 encode, respectively, the leader sequence (5′‐UTR), two of the four Zn fingers forming the DNA‐binding domain, and the dimerization domain of IKZF1.
Figure 7.
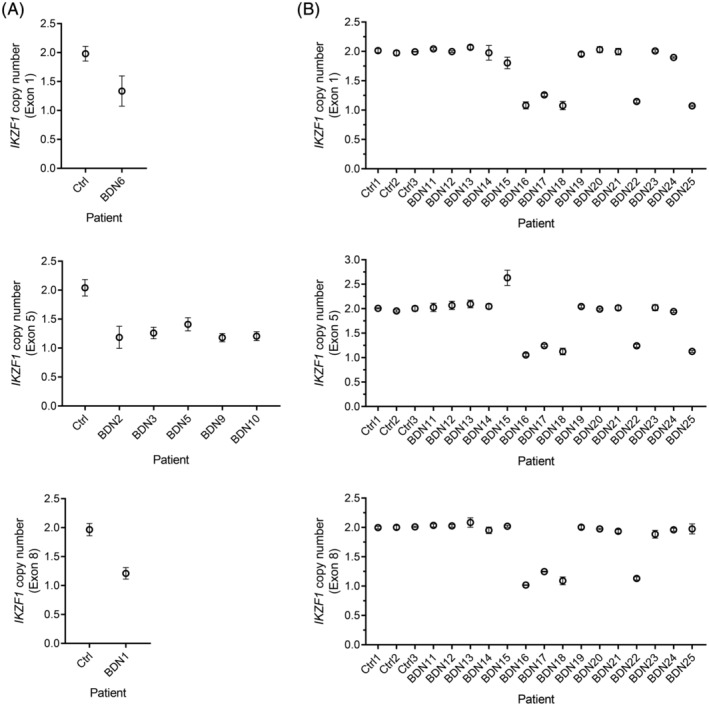
Evaluation of an extension cohort confirms recurrent structural alterations at IKZF1 in BPDCN. A, IKZF1‐deleting events detected by WGS in BPDCN tumors were validated using ddPCR. Copy number was evaluated at exon 1, 5, or 8 according to the region of IKZF1 found to be deleted by WGS in each affected patient (ie, exon 1:5′‐end; exon 5: whole locus; exon 8:3′‐end). B, The existence of recurrent structural alterations at IKZF1 was confirmed in an extension cohort by ddPCR. Copy number was evaluated at three different exons in all samples to account for CNAs affecting only the 5′‐end (exon 1), the middle section (exon 5) or the 3′‐end (exon 8) of IKZF1. Exons 5 and 8 encode two of the four Zn fingers forming the DNA‐binding domain and the dimerization domain of IKZF1, respectively, being both critical for its functionality. Ctrl, normal T cells. BPDCN, blastic plasmacytoid dendritic cell neoplasm; CNAs, copy number alterations; WGS, whole‐genome sequencing
CNAs involving IKZF1 were detected in 6 of 15 (40%) patients from the extension cohort, 5 of which had deletions (Figure 7B). Interestingly, one patient (BDN15) displayed normal copy number at exon 1 and 8, but a gain at exon 5, suggesting a focal duplication of one or more exons within the IKZF1 locus (Figure 7B). Of note, focal exon duplications in tumor suppressors can generate inactivating frameshifts, as documented in BRCA1.49 Overall, combining the sequenced and extension cohorts, 13 of 25 patients (52%) had structural alterations involving IKZF1.
4. DISCUSSION
In this study we describe the first high resolution whole‐genome analysis of BPDCN using WGS. Our analysis, which focused on structural genomic alterations, identified 54 genes disrupted by rearrangements which are predominantly involved in cytoskeleton‐associated processes, adhesion and transcriptional regulation. Out of 54 rearranged genes, 13 are involved in malignancies at present, being IKZF1 and MYB the only cancer genes recurrently impacted by rearrangements in our sequenced cohort. We identified 6 recurrently deleted genomic regions enclosing recognized tumor suppressors (ie, CDKN1B, ETV6, HNRNPK, IKZF1, RB1, and SFRP4) with important roles in hematopoiesis and cell cycle regulation. In addition, deleterious indels and SNVs in ASXL1, IKZF1, NRAS, and TET2 were recurrent in our patients.
IKZF1 inactivation, which mainly occurred through narrow interstitial deletions (9.5 Kb‐3.8 Mb) and unbalanced rearrangements, was the most prominent alteration in BPDCN due to its focality, recurrence, and likely adverse effects during early development of pDCs. The latter is supported by the fact that IKZF1 deficiency keeps pDC precursors stuck at an early differentiation stage whereas function‐impairing changes in both IKZF1 alleles lead to absence of pDCs in murine models.29, 31 Using an independent cohort, we confirmed by ddPCR that structural alterations at the IKZF1 locus are recurrent in BPDCN. Although the incidence of CNAs involving IKZF1 was lower in the extension cohort compared to the sequenced cohort (difference not statistically significant, P > .05, Fisher's exact test), patients with normal IKZF1 copy number might still carry inactivating balanced rearrangements, indels or SNVs which do not entail numerical changes. In agreement with the recurrent IKZF1 inactivation observed in BPDCN, transcriptome analysis revealed that conserved IKZF1 target genes show a clear loss‐of‐IKZF1 expression pattern.
Even though the roles of IKZF1 in hematopoiesis and leukemogenesis are only starting to be understood, it is currently well‐established that insufficiency of functional IKZF1 proteins leads to overexpression of adhesion molecules, surface receptors and ECM proteins in immune cells, as demonstrated in murine pDC precursors carrying hypomorphic Ikzf1 alleles (eg, Igll1, Mmp14, Ncam1 [Cd56], Thy1, etc.),29 murine B cell precursors engineered to produce Ikzf1 proteins lacking DNA‐binding ability (eg, Itga9, Itgb3, Lamb1, Mmp14, etc.)44 and malignant cells derived from murine models of BCR‐ABL1+ pre‐B ALL carrying loss‐of‐function mutations in Ikzf1 (eg, Cd28, Itga5, Thy1, etc.).45, 46 Our data, in full concordance with this evidence, suggest that IKZF1 inactivation lies behind the up‐regulation of adhesion profiles in BPDCN.
BPDCN displayed up‐regulation of the PI‐3‐K/Akt pathway and the Rap1 pathway. The PI‐3‐K/Akt pathway, often overactivated in human cancers, promotes cancer cell proliferation. Notably, IKZF1 has been shown to transcriptionally repress components of the PI‐3‐K/Akt pathway (eg, PIK3CD, PIK3C2B, PIP4K2B, etc.),50 and concordantly, IKZF1‐deficient malignant cells from murine models of pre‐B ALL show overactivation of PI‐3‐K/Akt signaling.44 Hence, IKZF1 deficiency in BPDCN might underlie or contribute to the observed overactivation of the PI‐3‐K/Akt pathway. In contrast, the Rap1 pathway regulates cell motility and integrin‐mediated adhesion in leukocytes, lymphocytes and dendritic cells, both of which are processes hijacked by neoplastic cells to disseminate to other body sites.51 In fact, activation of Rap1 signaling has been shown to trigger migration of T‐acute lymphoblastic leukemia and B‐cell lymphoma cells, in vitro and in vivo, respectively.52, 53
We found that genes silenced by PRC2 (EZH2) were the most overrepresented in the group of up‐regulated genes in BPDCN. This agrees with a previous report of a loss‐of‐EZH2 expression signature in tumor cells from patients with highly aggressive BPDCN.54 Remarkably, it has been established that IKZF1, which predominantly acts as a transcriptional repressor, silences genes in erythroid and T‐cell precursors by recruiting PRC2 to target sites.55, 56 Thus, up‐regulation of genes silenced by PRC2 in BPDCN might result from shortage of functional IKZF1 molecules, which in turn, would hinder PRC2 recruitment to target sites.
Interestingly, analysis of DE genes in BPDCN not only confirmed up‐regulation of BCL2 and MYB as described in previous studies,7, 16 but also uncovered additional up‐regulated (proto‐) oncogenes of interest. AFF3, for instance, encodes a transcriptional activator expressed in early lymphoid development which appears to be leukemogenic in patients with pre‐B ALL carrying MLL‐AFF3 fusions.57 FOXM1, on the other hand, promotes cell proliferation and dissemination in a plethora of neoplasms by inducing cell cycle progression (esp. at G2/M) and the acquisition of an invasive phenotype.38 RRAS2, which encodes a small GTPase involved in PI‐3‐K/Akt signaling, has been found to be overexpressed in a number of lymphoid malignancies, including cutaneous T cell lymphoma (CTCL).58 Other prominent up‐regulated oncogenes encode receptors (ie, FGFR1, MET, and PDGFRA/B) that signal through the PI‐3‐K/Akt pathway.
In addition, we identified in BPDCN a group of down‐regulated genes encoding cell proliferation inhibitors. BTG2, a member of the BTG/Tob family, stops the cell cycle at G1/S by down‐regulating cyclin D1, or at G2/M by preventing binding between cyclin B1 and CDK1.59 IFIT3 and TXNIP, which increase expression of p21/p27 and p27, respectively, promote cell cycle arrest at G0/G1.60, 61 TSPYL2 triggers the inhibition of several cell cycle kinases (ie, CDK1, 2, 4, 6), halting the cell cycle at multiple phases (G1 to M).62
It has not escaped our notice the apparent parallelism between BPDCN and BCR‐ABL1+ pre‐B ALL in terms of deregulated genes and cellular processes. We hypothesize that these similarities are rooted in the recurrent inactivation of IKZF1 occurring in both neoplasms. This may also explain the positive effects of ALL‐like therapy for the treatment of patients with BPDCN.
In summary, our data strongly supports IKZF1 inactivation as a key event in the development of BPDCN. First, IKZF1 was found to be inactivated by structural alterations in 7 of 10 patients from our sequenced cohort, and recurrent IKZF1 inactivation was confirmed in an extension cohort. Secondly, expression of conserved IKZF1 target genes in BPDCN was fully consistent with a loss‐of‐IKZF1 phenotype. Thirdly, expression signatures in BPDCN matched known physiological consequences of IKZF1 deficiency (ie, aberrant adhesion, activation of the PI‐3‐K/Akt pathway) in immune cells. Finally, since IKZF1 is critical for pDC differentiation, its abrogation can be expected to derail normal development of pDC precursors, conceivably leading to their malignization.
Based on our findings, we suggest that counteracting the pathogenic loss‐of‐IKZF1 phenotype of malignant cells in BPDCN through pharmacological induction of the wild‐type IKZF1 allele (eg, by using retinoids)45 might have beneficial therapeutic effects on patients with BPDCN.
CONFLICT OF INTEREST
The authors declare no conflicts of interest.
AUTHOR CONTRIBUTIONS
A.N.B.T., D.F., E.B., and C.P.T. designed the project. A.N.B.T. and C.P.T wrote the manuscript. A.N.B.T., D.C., and H.M. performed the bioinformatic analyses. A.N.B.T. interpreted the data, performed the experiments and produced figures and tables. D.F., J.G., L.C., M.P., M.V., R.W., and E.B. provided valuable biological specimens. A.N.B.T, D.C., H.M., D.F., J.G., L.C., M.P., M.V., R.W., E.B., and C.P.T revised and approved the final manuscript.
Supporting information
Appendix S1. Figures.
Appendix S2. Tables.
ACKNOWLEDGMENTS
This study was funded by the Dutch Cancer Society (grant UL2013‐6104).
Bastidas Torres AN, Cats D, Mei H, et al. Whole‐genome analysis uncovers recurrent IKZF1 inactivation and aberrant cell adhesion in blastic plasmacytoid dendritic cell neoplasm. Genes Chromosomes Cancer. 2020;59:295–308. 10.1002/gcc.22831
Funding information KWF Kankerbestrijding, Grant/Award Number: UL2013‐6104
DATA AVAILABILITY STATEMENT
The data that support the findings of this study are openly available in the European Genome‐Phenome Archive (EGA) at https://www.ebi.ac.uk/ega/home, reference number [EGAS00001003660].
REFERENCES
- 1. Pagano L, Valentini CG, Grammatico S, Pulsoni A. Blastic plasmacytoid dendritic cell neoplasm: diagnostic criteria and therapeutical approaches. Br J Haematol. 2016;174(2):188‐202. [DOI] [PubMed] [Google Scholar]
- 2. Willemze R, Jaffe ES, Burg G, et al. WHO‐EORTC classification for cutaneous lymphomas. Blood. 2005;105(10):3768‐3785. [DOI] [PubMed] [Google Scholar]
- 3. Lucioni M, Novara F, Fiandrino G, et al. Twenty‐one cases of blastic plasmacytoid dendritic cell neoplasm: focus on biallelic locus 9p21.3 deletion. Blood. 2011;118(17):4591‐4594. [DOI] [PubMed] [Google Scholar]
- 4. Wiesner T, Obenauf AC, Cota C, Fried I, Speicher MR, Cerroni L. Alterations of the cell‐cycle inhibitors p27(KIP1) and p16(INK4a) are frequent in blastic plasmacytoid dendritic cell neoplasms. J Invest Dermatol. 2010;130(4):1152‐1157. [DOI] [PubMed] [Google Scholar]
- 5. Jardin F, Callanan M, Penther D, et al. Recurrent genomic aberrations combined with deletions of various tumour suppressor genes may deregulate the G1/S transition in CD4+CD56+ haematodermic neoplasms and contribute to the aggressiveness of the disease. Leukemia. 2009;23(4):698‐707. [DOI] [PubMed] [Google Scholar]
- 6. Dijkman R, van Doorn R, Szuhai K, Willemze R, Vermeer MH, Tensen CP. Gene‐expression profiling and array‐based CGH classify CD4+CD56+ hematodermic neoplasm and cutaneous myelomonocytic leukemia as distinct disease entities. Blood. 2007;109(4):1720‐1727. [DOI] [PubMed] [Google Scholar]
- 7. Sapienza MR, Fuligni F, Agostinelli C, et al. Molecular profiling of blastic plasmacytoid dendritic cell neoplasm reveals a unique pattern and suggests selective sensitivity to NF‐kB pathway inhibition. Leukemia. 2014;28(8):1606‐1616. [DOI] [PMC free article] [PubMed] [Google Scholar]
- 8. Stenzinger A, Endris V, Pfarr N, et al. Targeted ultra‐deep sequencing reveals recurrent and mutually exclusive mutations of cancer genes in blastic plasmacytoid dendritic cell neoplasm. Oncotarget. 2014;5(15):6404‐6413. [DOI] [PMC free article] [PubMed] [Google Scholar]
- 9. Menezes J, Acquadro F, Wiseman M, et al. Exome sequencing reveals novel and recurrent mutations with clinical impact in blastic plasmacytoid dendritic cell neoplasm. Leukemia. 2014;28(4):823‐829. [DOI] [PubMed] [Google Scholar]
- 10. Sapienza MR, Abate F, Melle F, et al. Blastic plasmacytoid dendritic cell neoplasm: genomics mark epigenetic dysregulation as a primary therapeutic target. Haematologica. 2019;104(4):729‐737. [DOI] [PMC free article] [PubMed] [Google Scholar]
- 11. Alayed K, Patel KP, Konoplev S, et al. TET2 mutations, myelodysplastic features, and a distinct immunoprofile characterize blastic plasmacytoid dendritic cell neoplasm in the bone marrow. Am J Hematol. 2013;88(12):1055‐1061. [DOI] [PubMed] [Google Scholar]
- 12. Tokuda K, Eguchi‐Ishimae M, Yagi C, et al. CLTC‐ALK fusion as a primary event in congenital blastic plasmacytoid dendritic cell neoplasm. Genes Chromosomes Cancer. 2014;53(1):78‐89. [DOI] [PubMed] [Google Scholar]
- 13. Gao NA, Wang XX, Sun JR, Yu WZ, Guo NJ. Blastic plasmacytoid dendritic cell neoplasm with leukemic manifestation and ETV6 gene rearrangement: a case report. Exp Ther Med. 2015;9(4):1109‐1112. [DOI] [PMC free article] [PubMed] [Google Scholar]
- 14. Cao Q, Liu F, Niu G, Xue L, Han A. Blastic plasmacytoid dendritic cell neoplasm with EWSR1 gene rearrangement. J Clin Pathol. 2014;67(1):90‐92. [DOI] [PubMed] [Google Scholar]
- 15. Toya T, Nishimoto N, Koya J, et al. The first case of blastic plasmacytoid dendritic cell neoplasm with MLL‐ENL rearrangement. Leuk Res. 2012;36(1):117‐118. [DOI] [PubMed] [Google Scholar]
- 16. Suzuki K, Suzuki Y, Hama A, et al. Recurrent MYB rearrangement in blastic plasmacytoid dendritic cell neoplasm. Leukemia. 2017;31(7):1629‐1633. [DOI] [PubMed] [Google Scholar]
- 17. Boddu PC, Wang SA, Pemmaraju N, et al. 8q24/MYC rearrangement is a recurrent cytogenetic abnormality in blastic plasmacytoid dendritic cell neoplasms. Leuk Res. 2018;66:73‐78. [DOI] [PubMed] [Google Scholar]
- 18. Nakamura Y, Kayano H, Kakegawa E, et al. Identification of SUPT3H as a novel 8q24/MYC partner in blastic plasmacytoid dendritic cell neoplasm with t(6;8)(p21;q24) translocation. Blood Cancer J. 2015;5:e301. [DOI] [PMC free article] [PubMed] [Google Scholar]
- 19. Petrella T, Pileri SA. Blastic plasmacytoid dendritic cell neoplasm In: Swerdlow SH, Harris NL, Jaffe ES, Pileri SA, Stein H, Thiele J, eds. WHO Classification of Tumours of Haematopoietic and Lymphoid Tissues. 4th ed. Lyon, France: IARC; 2017. [Google Scholar]
- 20. Petrella T, Pileri SA. Blastic plasmacytoid dendritic cell neoplasm In: Elder DE, Scolyer RA, Willemze R, eds. WHO Classification of Skin Tumours. 4th ed. Lyon, France: IARC; 2018. [Google Scholar]
- 21. Repana D, Nulsen J, Dressler L, et al. The network of cancer genes (NCG): a comprehensive catalogue of known and candidate cancer genes from cancer sequencing screens. Genome Biol. 2019;20(1):1. [DOI] [PMC free article] [PubMed] [Google Scholar]
- 22. Alculumbre SG, Saint‐Andre V, Di Domizio J, et al. Diversification of human plasmacytoid predendritic cells in response to a single stimulus. Nat Immunol. 2018;19(1):63‐75. [DOI] [PubMed] [Google Scholar]
- 23. da Huang W, Sherman BT, Lempicki RA. Systematic and integrative analysis of large gene lists using DAVID bioinformatics resources. Nat Protoc. 2009;4(1):44‐57. [DOI] [PubMed] [Google Scholar]
- 24. Subramanian A, Tamayo P, Mootha VK, et al. Gene set enrichment analysis: a knowledge‐based approach for interpreting genome‐wide expression profiles. Proc Natl Acad Sci USA. 2005;102(43):15545‐15550. [DOI] [PMC free article] [PubMed] [Google Scholar]
- 25. Kuleshov MV, Jones MR, Rouillard AD, et al. Enrichr: a comprehensive gene set enrichment analysis web server 2016 update. Nucleic Acids Res. 2016;44(W1):W90‐W97. [DOI] [PMC free article] [PubMed] [Google Scholar]
- 26. Cancer Genome Atlas N . Comprehensive molecular characterization of human colon and rectal cancer. Nature. 2012;487(7407):330‐337. [DOI] [PMC free article] [PubMed] [Google Scholar]
- 27. Gallardo M, Lee HJ, Zhang X, et al. hnRNP K is a Haploinsufficient tumor suppressor that regulates proliferation and differentiation programs in hematologic malignancies. Cancer Cell. 2015;28(4):486‐499. [DOI] [PMC free article] [PubMed] [Google Scholar]
- 28. Yoshida T, Georgopoulos K. Ikaros fingers on lymphocyte differentiation. Int J Hematol. 2014;100(3):220‐229. [DOI] [PMC free article] [PubMed] [Google Scholar]
- 29. Allman D, Dalod M, Asselin‐Paturel C, et al. Ikaros is required for plasmacytoid dendritic cell differentiation. Blood. 2006;108(13):4025‐4034. [DOI] [PMC free article] [PubMed] [Google Scholar]
- 30. Cytlak U, Resteu A, Bogaert D, et al. Ikaros family zinc finger 1 regulates dendritic cell development and function in humans. Nat Commun. 2018;9(1):1239. [DOI] [PMC free article] [PubMed] [Google Scholar]
- 31. Schjerven H, McLaughlin J, Arenzana TL, et al. Selective regulation of lymphopoiesis and leukemogenesis by individual zinc fingers of Ikaros. Nat Immunol. 2013;14(10):1073‐1083. [DOI] [PMC free article] [PubMed] [Google Scholar]
- 32. Tessema M, Willink R, Do K, et al. Promoter methylation of genes in and around the candidate lung cancer susceptibility locus 6q23‐25. Cancer Res. 2008;68(6):1707‐1714. [DOI] [PubMed] [Google Scholar]
- 33. Haling JR, Sudhamsu J, Yen I, et al. Structure of the BRAF‐MEK complex reveals a kinase activity independent role for BRAF in MAPK signaling. Cancer Cell. 2014;26(3):402‐413. [DOI] [PubMed] [Google Scholar]
- 34. Eberlein CA, Stetson D, Markovets AA, et al. Acquired resistance to the mutant‐selective EGFR inhibitor AZD9291 is associated with increased dependence on RAS Signaling in preclinical models. Cancer Res. 2015;75(12):2489‐2500. [DOI] [PMC free article] [PubMed] [Google Scholar]
- 35. Chraybi M, Abd Alsamad I, Copie‐Bergman C, et al. Oncogene abnormalities in a series of primary melanomas of the sinonasal tract: NRAS mutations and cyclin D1 amplification are more frequent than KIT or BRAF mutations. Hum Pathol. 2013;44(9):1902‐1911. [DOI] [PMC free article] [PubMed] [Google Scholar]
- 36. Di Carlo V, Mocavini I, Di Croce L. Polycomb complexes in normal and malignant hematopoiesis. J Cell Biol. 2019;218(1):55‐69. [DOI] [PMC free article] [PubMed] [Google Scholar]
- 37. Nagasawa M, Schmidlin H, Hazekamp MG, Schotte R, Blom B. Development of human plasmacytoid dendritic cells depends on the combined action of the basic helix‐loop‐helix factor E2‐2 and the Ets factor Spi‐B. Eur J Immunol. 2008;38(9):2389‐2400. [DOI] [PubMed] [Google Scholar]
- 38. Koo CY, Muir KW, Lam EW. FOXM1: from cancer initiation to progression and treatment. Biochim Biophys Acta. 2012;1819(1):28‐37. [DOI] [PubMed] [Google Scholar]
- 39. Schjerven H, Ayongaba EF, Aghajanirefah A, et al. Genetic analysis of Ikaros target genes and tumor suppressor function in BCR‐ABL1(+) pre‐B ALL. J Exp Med. 2017;214(3):793‐814. [DOI] [PMC free article] [PubMed] [Google Scholar]
- 40. Witkowski MT, Hu Y, Roberts KG, et al. Conserved IKAROS‐regulated genes associated with B‐progenitor acute lymphoblastic leukemia outcome. J Exp Med. 2017;214(3):773‐791. [DOI] [PMC free article] [PubMed] [Google Scholar]
- 41. Unbekandt M, Olson MF. The Actin‐myosin regulatory MRCK kinases: regulation, biological functions and associations with human cancer. J Mol Med (Berl). 2014;92(3):217‐225. [DOI] [PMC free article] [PubMed] [Google Scholar]
- 42. Rafn B, Nielsen CF, Andersen SH, et al. ErbB2‐driven breast cancer cell invasion depends on a complex signaling network activating myeloid zinc finger‐1‐dependent cathepsin B expression. Mol Cell. 2012;45(6):764‐776. [DOI] [PubMed] [Google Scholar]
- 43. Lee J‐W, Geng H, Chen Z, et al. IFITM3 (CD225) links the B cell antigen CD19 to PI3K‐AKT Signaling in human ALL cells. Blood. 2015;126(23):1325. [Google Scholar]
- 44. Joshi I, Yoshida T, Jena N, et al. Loss of Ikaros DNA‐binding function confers integrin‐dependent survival on pre‐B cells and progression to acute lymphoblastic leukemia. Nat Immunol. 2014;15(3):294‐304. [DOI] [PMC free article] [PubMed] [Google Scholar]
- 45. Churchman ML, Low J, Qu C, et al. Efficacy of Retinoids in IKZF1‐mutated BCR‐ABL1 acute lymphoblastic Leukemia. Cancer Cell. 2015;28(3):343‐356. [DOI] [PMC free article] [PubMed] [Google Scholar]
- 46. Churchman ML, Qian M, te Kronnie G, et al. Germline genetic IKZF1 variation and predisposition to childhood acute lymphoblastic Leukemia. Cancer Cell. 2018;33(5):937‐948.e938. [DOI] [PMC free article] [PubMed] [Google Scholar]
- 47. MacGrath SM, Koleske AJ. Cortactin in cell migration and cancer at a glance. J Cell Sci. 2012;125(Pt 7):1621‐1626. [DOI] [PMC free article] [PubMed] [Google Scholar]
- 48. Onodera Y, Hashimoto S, Hashimoto A, et al. Expression of AMAP1, an ArfGAP, provides novel targets to inhibit breast cancer invasive activities. EMBO J. 2005;24(5):963‐973. [DOI] [PMC free article] [PubMed] [Google Scholar]
- 49. Puget N, Sinilnikova OM, Stoppa‐Lyonnet D, et al. An Alu‐mediated 6‐kb duplication in the BRCA1 gene: a new founder mutation? Am J Hum Genet. 1999;64(1):300‐302. [DOI] [PMC free article] [PubMed] [Google Scholar]
- 50. Song C, Gowda C, Pan X, et al. Targeting casein kinase II restores Ikaros tumor suppressor activity and demonstrates therapeutic efficacy in high‐risk leukemia. Blood. 2015;126(15):1813‐1822. [DOI] [PMC free article] [PubMed] [Google Scholar]
- 51. Shah S, Brock EJ, Ji K, Mattingly RR. Ras and Rap1: a tale of two GTPases. Semin Cancer Biol. 2019;54:29‐39. [DOI] [PMC free article] [PubMed] [Google Scholar]
- 52. Infante E, Heasman SJ, Ridley AJ. Statins inhibit T‐acute lymphoblastic leukemia cell adhesion and migration through Rap1b. J Leukoc Biol. 2011;89(4):577‐586. [DOI] [PubMed] [Google Scholar]
- 53. Lin KB, Tan P, Freeman SA, Lam M, McNagny KM, Gold MR. The rap GTPases regulate the migration, invasiveness and in vivo dissemination of B‐cell lymphomas. Oncogene. 2010;29(4):608‐615. [DOI] [PubMed] [Google Scholar]
- 54. Emadali A, Hoghoughi N, Duley S, et al. Haploinsufficiency for NR3C1, the gene encoding the glucocorticoid receptor, in blastic plasmacytoid dendritic cell neoplasms. Blood. 2016;127(24):3040‐3053. [DOI] [PMC free article] [PubMed] [Google Scholar]
- 55. Ross J, Mavoungou L, Bresnick EH, Milot E. GATA‐1 utilizes Ikaros and polycomb repressive complex 2 to suppress Hes1 and to promote erythropoiesis. Mol Cell Biol. 2012;32(18):3624‐3638. [DOI] [PMC free article] [PubMed] [Google Scholar]
- 56. Oravecz A, Apostolov A, Polak K, et al. Ikaros mediates gene silencing in T cells through Polycomb repressive complex 2. Nat Commun. 2015;6:8823. [DOI] [PMC free article] [PubMed] [Google Scholar]
- 57. Isnard P, Core N, Naquet P, Djabali M. Altered lymphoid development in mice deficient for the mAF4 proto‐oncogene. Blood. 2000;96(2):705‐710. [PubMed] [Google Scholar]
- 58. Delgado P, Cubelos B, Calleja E, et al. Essential function for the GTPase TC21 in homeostatic antigen receptor signaling. Nat Immunol. 2009;10(8):880‐888. [DOI] [PubMed] [Google Scholar]
- 59. Boiko AD, Porteous S, Razorenova OV, Krivokrysenko VI, Williams BR, Gudkov AV. A systematic search for downstream mediators of tumor suppressor function of p53 reveals a major role of BTG2 in suppression of Ras‐induced transformation. Genes Dev. 2006;20(2):236‐252. [DOI] [PMC free article] [PubMed] [Google Scholar]
- 60. Xiao S, Li D, Zhu HQ, et al. RIG‐G as a key mediator of the antiproliferative activity of interferon‐related pathways through enhancing p21 and p27 proteins. Proc Natl Acad Sci USA. 2006;103(44):16448‐16453. [DOI] [PMC free article] [PubMed] [Google Scholar]
- 61. Jeon JH, Lee KN, Hwang CY, Kwon KS, You KH, Choi I. Tumor suppressor VDUP1 increases p27(kip1) stability by inhibiting JAB1. Cancer Res. 2005;65(11):4485‐4489. [DOI] [PubMed] [Google Scholar]
- 62. Tu Y, Wu W, Wu T, et al. Antiproliferative autoantigen CDA1 transcriptionally up‐regulates p21(Waf1/Cip1) by activating p53 and MEK/ERK1/2 MAPK pathways. J Biol Chem. 2007;282(16):11722‐11731. [DOI] [PubMed] [Google Scholar]
Associated Data
This section collects any data citations, data availability statements, or supplementary materials included in this article.
Supplementary Materials
Appendix S1. Figures.
Appendix S2. Tables.
Data Availability Statement
The data that support the findings of this study are openly available in the European Genome‐Phenome Archive (EGA) at https://www.ebi.ac.uk/ega/home, reference number [EGAS00001003660].