

Abstract
Infection preventionist (IP) staffing in nursing homes (NHs) is now required as part of new federal regulations. In this study, we examined IP staffing changes from 2014 to 2018 and found relatively few changes over time. IP staffing in NHs remains low but does vary between for profit and non-profit facilities.
Introduction
An estimated 765,000 to 2.8 million infections occur annually in the approximately 16,000 nursing homes (NH) across the country.1 Effectively preventing infections in NHs is difficult because for most residents the NH is home, hence, the environment is social with shared spaces.2 An aging population and high use of antibiotics, medical devices and comorbidities also complicate infection control and management. Therefore, it is not surprising that 40% of Medicare-certified NHs receive deficiency citations for inadequate infection control.3 Furthermore, antibiotic stewardship in NHs has been sub-optimal.3,4
Due to these challenges, the role of the infection preventionist (IP) in NHs has become increasingly important. Recently, the Centers for Medicaid and Medicare implemented new Code of Federal Regulations (Section §483.80) that expanded the description of infection prevention control programs (IPCP) in NHs to include an antibiotic stewardship program and a designated individual to serve as an IP, overseeing the IPCP and participating on the quality assessment and assurance committees.5 However, the IP is only required to work “part-time” and there is no regulation or recommendation on minimum staffing ratios. While is it stated that the IP must be trained in infection control, no specific guidelines are provided.
Previous researchers have found that NHs are inadequately staffed, with as much as four-fold fewer IPs than hospitals, and high staff turnover.3,6 In the 2015 Association of Professionals in Infection Control (APIC)’s MegaSurvey, the reported number of IPs in NHs was 1.1 IP ± 0.6 per facility and NHs lacked. resources for IPCP including support for secretarial functions, data management and electronic medical records.7 The survey found that IPs in NHs fulfill several functions, dedicate less than half of their job to IPCP, and are less likely to be certified in infection control than hospital IPs. We aimed to examine the changes in IP staffing in NHs between 2014 and 2018.
Methods
Using a repeated cross-sectional design, we analyzed data from two national surveys, one conducted in 2013–2014 and the other in 2017–2018.3,8 Both surveys included questions regarding IP demographics and hours worked (overall and in IPCP). Survey data were merged with available concurrent Certification and Survey Provider Enhanced Reports (CASPER) and Nursing Home Compare Five-Star Quality Rating System data. From these sources we obtained the following NH characteristics including: bed size; occupancy level; staffing levels for registered nurses (RNs), licensed practical nurses (LPNs) and certified nursing assistants (CNAs) each standardized by hours per resident day (HRD); ownership (for profit vs nonprofit/government); payer mix (percentage of patients on Medicare, Medicaid, or Other); part of a multi-facility organization; NH region; and urbanicity. Nursing home quality was measured through the five-star overall quality rating.
The IP staffing level, or IP full-time equivalents (FTE), was calculated as the dedicated hours the IP spent on IPCP activities per week divided by 40. Descriptive statistics were used to assess IP FTE by NH bed size and ownership by year. Multivariable generalized estimating equation (GEE) regression models were used to assess the impact of NH characteristics on the IP FTE, stratified by ownership. An indicator for survey (1 = 2013–2014 and 2 = 2017–2018) was included to assess the effect of time period. Analyses were performed using SAS, version 9.4.
Results
There were 433 NHs that had complete data in both surveys and were included in this analysis. NHs were mostly located in metropolitan areas (68%) in the Midwest (36.3%), Northeast (24.9%), and South (27.7%). The facilities, on average, had 116.7 beds (SD 71.3), 81.1% occupancy rate (SD 16.1), and were of average quality (mean 3.3, SD 1.3). The majority of NHs were nonprofit (63.1%) and part of a multi-facility organization (54%). NHs did not differ in overall quality over time. LPN staffing decreased (mean HRD 2.52 to 2.44) and CNA staffing (mean HRD 0.81 to 0.82) increased slightly over time.
In 2013, average IP FTE was 0.29 (SD 0.22, range 0.006–1.50) which increased to 0.32 (SD 0.24, range 0.03–1.00) in 2018 (not statistically different). In for profit NHs, IP FTE was higher than in nonprofit NH (mean FTE 0.32 vs 0.30, p = 0.007). But, as illustrated in Figure 1, this difference was only observed in larger NHs. When we examined IP FTE by time, we found that IP staffing increased with NH size in 2018 monotonically but not in 2014.
Figure 1.
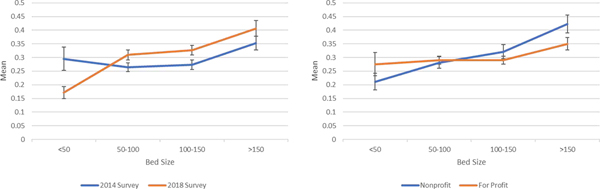
Association of IP FTE with NH bed size, by survey year and ownership.
Abbreviations: FTE = full-time equivalent; IP = infection preventionist; NH = nursing home
In multivariable models, NH bed size and occupancy level were positively associated with IP FTE in both for profit and nonprofit facilities (Table 1). In for profit facilities, higher FTE was associated with the 2014 survey time, higher percentage of Medicaid patients, and increased RN staffing. We did not find these associated in nonprofit NHs. The CMS 5-star rating was not independently associated with staffing in either model.
Table 1.
Multivariable GEE Models predicting IP FTE by NH characteristics (n = 433 NHs)
| For Profit NHs | Nonprofit NHs | |||||
|---|---|---|---|---|---|---|
| Parameter | Estimate | Standard Error | p Value | Estimate | Standard Error | p Value |
| Survey | −0.1255 | 0.0558 | 0.0245 | 0.044 | 0.0618 | 0.477 |
| Number of beds | 0.0005 | 0.0002 | 0.0209 | 0.0009 | 0.0003 | 0.0024 |
| Percent occupancy | 0.0016 | 0.0007 | 0.0149 | 0.0028 | 0.0009 | 0.0013 |
| Payer Mix | ||||||
| Percent Medicare | 0.0021 | 0.0017 | 0.2023 | −0.0018 | 0.0016 | 0.242 |
| Percent Medicaid | 0.0021 | 0.0007 | 0.0019 | 0.0005 | 0.0009 | 0.576 |
| Percent Other | Ref | Ref | ||||
| Staffing Levels | ||||||
| CNA HRD | 0.0274 | 0.0155 | 0.0775 | 0.0014 | 0.0179 | 0.9377 |
| LPN HRD | 0.0171 | 0.0214 | 0.4234 | 0.0123 | 0.0365 | 0.7362 |
| RN HRD | 0.1237 | 0.0403 | 0.0021 | −0.0061 | 0.0459 | 0.8937 |
| Multi-facility organization | −0.0239 | 0.0215 | 0.2645 | 0.0109 | 0.0277 | 0.6931 |
| Region | ||||||
| Midwest | 0.0136 | 0.0311 | 0.6613 | −0.0688 | 0.0576 | 0.232 |
| Northeast | 0.0573 | 0.0349 | 0.1009 | −0.0173 | 0.0607 | 0.7751 |
| South | 0.0378 | 0.0333 | 0.2562 | 0.0037 | 0.0654 | 0.9554 |
| West | Ref | Ref | ||||
| Setting | ||||||
| Metropolitan | 0.0061 | 0.0262 | 0.8161 | −0.0401 | 0.0467 | 0.3902 |
| Rural Remote | 0.0034 | 0.0297 | 0.9091 | −0.0211 | 0.0484 | 0.6631 |
| Rural Adjacent | Ref | Ref | ||||
| CMS Five Star Overall Quality Rating | 0.0046 | 0.0076 | 0.5447 | −0.0043 | 0.0127 | 0.7364 |
Abbreviations: CMS = Centers of Medicare & Medicaid Services; CNA = certified nursing assistant; FTE = full-time equivalent; IP = infection preventionist; LPN = licensed practical nurse;NH = nursing home; RN = registered nurse.
Discussion
This is the first national study to invesigate changes in NH IP staffing. We found wide variation in IP staffing across the nation and round that IP staffing in NHs is related to bed size and ownership type (that is nonprofits versus for-profits). It is not surprising that staffing is related to the size of the NH and that IPCP staffing varies by ownership. Economies of scale in staffing IPCP has also been found in acute care settings.9 For profit facilities decreased their IP staffing from 2014 to 2018. There have been many investigations into the complex relationship between ownership of NHs and outcomes, and generally it has been found that for-profit NHs provide lower quality care than not-for-profits.10 While we did not find an independent association between quality, as measured by the CMS 5-star rating, and IP staffing, this may be due to the 5-star rating not measuring IPCP processes and outcomes. Further research into staffing and quality processes and outcomes is needed.
This study has both strengths and weaknesses. All data were self-reported and it is possible that respondents over-reported the amount of time spent on infection control, given the federal regulations. There may have been responder bias as survey response rates were 39% in 2014 and 49% in 2018However, response bias analyses showed that NH quality ratings did not differ.3,8 Given the lack of evidence on effective IPCP staffing in NHs, it is difficult to determine what IP staffing will be effective at reducing infections in NHs. Nursing homes may also participate in quality improvement initiatives which may impact staffing levels. Further research should investigate the impact of these initiatives on IPCP staffing. Nevertheless, these results provide a baseline assessment for the state of IP staffing in NHs.
Acknowledgements:
We would like to thank nursing home directors of nursing and staff who participated in our surveys as well as our recruiting team (Nida Ali, Ashley Chastain, Richard Dorritie, Hector Perez, Stephen Powers, Aluem Tark, and Asia Taylor).
Funding: This work was funded by the National Institute of Nursing Research of the National Institutes of Health [R01NR013687]. All content is solely the responsibility of the authors and does not necessarily represent the official views of the National Institutes of Health.
Footnotes
Conflicts of Interest: Nothing to disclose
There are no conflicts of interest for any author.
Publisher's Disclaimer: This is a PDF file of an unedited manuscript that has been accepted for publication. As a service to our customers we are providing this early version of the manuscript. The manuscript will undergo copyediting, typesetting, and review of the resulting proof before it is published in its final form. Please note that during the production process errors may be discovered which could affect the content, and all legal disclaimers that apply to the journal pertain.
References
- 1.Herzig CTA, Dick AW, Sorbero M, et al. Infection Trends in US Nursing Homes, 2006–2013. J Am Med Dir Assoc. 2017;18(7):635 e639–635 e620. [DOI] [PMC free article] [PubMed] [Google Scholar]
- 2.Mody L, Bradley SF, Huang SS. Keeping the “home” in nursing home: implications for infection prevention. JAMA Intern Med. 2013;173(10):853–854. [DOI] [PMC free article] [PubMed] [Google Scholar]
- 3.Herzig CT, Stone PW, Castle N, Pogorzelska-Maziarz M, Larson EL, Dick AW . Infection Prevention and Control Programs in US Nursing Homes: Results of a National Survey. J Am Med Dir Assoc. 2016;17(1):85–88. [DOI] [PMC free article] [PubMed] [Google Scholar]
- 4.Pogorzelska-Maziarz M, Herzig CT, Cohen CC, Larson E, Stone PW. Infection Control Practices Related to Multi-drug Resistant Organisms and C. difficile in a National Sample of Nursing Homes IDWeek; 2015; San Diego, CA;. [Google Scholar]
- 5.Centers for Medicare & Medicaid Services. Medicare and Medicaid Programs; Reform of Requirements for Long-Term Care Facilities. Final rule. Federal Register. 2016;81(192):68688. [PubMed] [Google Scholar]
- 6.Roup BJ, Roche JC, Pass M. Infection control program disparities between acute and long-term care facilities in Maryland. Am J Infect Control. 2006;34(3):122–127. [DOI] [PubMed] [Google Scholar]
- 7.Pogorzelska-Maziarz M, Kalp EL. Infection prevention outside of the acute care setting: Results from the MegaSurvey of infection preventionists. Am J Infect Control. 2017;45(6):597–602. [DOI] [PubMed] [Google Scholar]
- 8.Stone PW, Agarwal M, Ye F, Sorbero M, Miller SC, Dick AW. Integration of Palliative Care and Infection Management at the End of Life in U.S. Nursing Homes. J Pain Symptom Manage. 2019;58(3):408–416 e401. [DOI] [PMC free article] [PubMed] [Google Scholar]
- 9.Stone PW, Dick A, Pogorzelska M, Horan TC, Furuya EY, Larson E. Staffing and structure of infection prevention and control programs. Am J Infect Control. 2009;37(5):351–357. [DOI] [PMC free article] [PubMed] [Google Scholar]
- 10.Grabowski DC, Feng Z, Hirth R, Rahman M, Mor V. Effect of nursing home ownership on the qualiy of post-acute care: an instrumental variables approach. J Health Econ. 2013;32(1):12–21. [DOI] [PMC free article] [PubMed] [Google Scholar]