

Abstract
Mass spectrometry-based proteomics by bottom-up approaches enables the unbiased and sensitive profiling of cellular proteomes and extracellular environments. Recent technological and bioinformatic advances permit identifying of dual biological systems in a single experiment, supporting investigation of infection from the perspective of both a host and pathogen. At the ocular surface, P. aeruginosa are commonly associated with biofilm formation and inflammation of the ocular tissues, causing damage to the eye. The interaction between P. aeruginosa and the immune system at the site of infection describes limitations in clearance of infection and enhanced pathogenesis. Here, we profile the extracellular environment (eye wash) of murine ocular surfaces infected with a clinical isolate of P. aeruginosa and detect neutrophil marker proteins, indicating neutrophil recruitment to the site of infection. We also identify the first potential diagnostic markers of P. aeruginosa-associated keratitis. In addition, we define the deepest murine corneal proteome to date and detect proteins, categories, and networks critical to the host response to infection. Moreover, we provide the first identification of bacteria-specific proteins in response to the host during bacterial biofilm formation of the eye. We validate our findings through in silico comparisons and enzymatic profiling. Overall, our work provides comprehensive profiling of the host-pathogen interface and uncovers differences between general and site-specific host responses to infection.
Keywords: mass spectrometry, label-free quantitative proteomics, immune response, eye wash, ocular proteome, bacterial infection, Pseudomonas aeruginosa, neutrophils, diagnostic proteins
1. Introduction
Bottom-up proteomics by mass spectrometry is a powerful tool that provides unbiased, robust, and sensitive measurements to define comprehensive cellular proteomes and secretomes, as well as communication patterns among cells, particularly during health and disease1,2. Proteomic profiling of infection is often performed from the perspective of either the host or pathogen, but less commonly, in consideration of the interplay between both systems in a single experiment. This dual perspective approach can provide novel insight into the molecular mechanisms of infection and therefore, is of significant interest for understanding the complexities of host defense response and pathogenesis.
At the ocular surface, infection with the bacterial pathogen, Pseudomonas aeruginosa, the organism most common cause of contact lens-associated corneal ulcers can lead to vision loss and blindness3,4. P. aeruginosa is a ubiquitous, Gram-negative, opportunistic pathogen with pathogenesis related to the production of many secreted and cell-associated virulence factors., including secreted toxins, which promote bacterial evasion of the host immune responses, and enzymes, which degrade complement proteins, immunoglobulins, and fibrinogen5–7. In addition, the formation of biofilms by P. aeruginosa provides a protective extracellular polymeric substance matrix consisting of polysaccharides, polymers, and extracellular DNA8–10. These biofilms are associated with bacterial cell attachment and architecture, protection against phagocytic cells, and resistance to antibiotic penetration11–15. We previously demonstrated the ability of P. aeruginosa to form biofilms at the ocular surface of mice and defined a novel enzymatic mechanisms of biofilm decomposition activated in neutrophils during infection16.
The ocular surface, including the cornea, a transparent, avascular, and highly specialized connective tissue essential for light refraction, protection against noxious agents, biomechanical stability, and structural resiliency, as well as filtering damaging UV radiation, and the surrounding mucosal sites and extracellular environment, are highly susceptible to infection17. During chronic infection, formation of P. aeruginosa biofilms at the ocular surface promotes the recruitment and activation of neutrophils16,18. However, neutrophils fail to breach the bacterial structures due to inhibition of complement activation and phagocytosis, resulting in a limited host response11,19,20. Notably, the formation of neutrophil extracellular traps at the interface of the ocular surface and P. aeruginosa during planktonic cellular growth, limits biofilm formation and prevents dissemination of the bacteria to other organs21.
Recently, profiling of the ocular surface has demonstrated an important connection between eye health and the microbiota22–26. The majority of these studies focused on phenotypic and transcriptional analyses; however, using label-free quantitative proteomics of eye wash samples, we demonstrated a ‘gut-eye axis’27. Earlier reports also used mass spectrometry-based proteomics to profile the ocular surface. In particular, the Human Eye Proteome Project aims to characterize all sub-proteomes of the healthy eye and profile the tear proteome28–34. Additional studies, have also profiled ocular protein level differences following chemical exposure and during macular degeneration35,36. Despite these advances in understanding ocular health from a proteomics perspective, analysis of ocular responses to bacterial infection at the protein level have been limited37,38.
Here, we use state-of-the-art mass spectrometry-based label-free quantitative proteomics (LC-MS/MS) to profile the ocular proteome and extracellular environment (eye wash) following P. aeruginosa biofilm formation in a murine model. Our data achieves the deepest proteome to date of the murine cornea and provides the first in vivo identification of bacteria-specific responses to the host during bacterial biofilm formation of the eye. We also identify seven potential diagnostic markers of P. aeruginosa infection of the ocular surface, including biofilm- and vesicle-associated proteins. With this information, we can distinguish between general and site-specific host immune responses to P. aeruginosa biofilm at the ocular surface and propose important interactions between the host and pathogen relevant for infection. In silico comparison of our data sets to previous reports highlights our ability to detect immune-associated proteins in the samples, as well as neutrophil ‘marker’ proteins, and bacterial proteins critical to biofilm formation. We propose that our findings uncover novel mechanisms of interplay between the host and pathogen during ocular infection. Our work supports the development of optimized protein extraction protocols for eye wash and cornea for comprehensive profiling of the interplay between host and pathogen from a dual perspective in a single experiment.
2. Materials and Methods
Ethics statement
All animal experiments were performed following National Institutes of Health guidelines for housing and care of laboratory animals and performed in accordance with institutional regulations after protocol review and approval by Brigham and Women’s Hospital Institutional animal care and use committee and were consistent with the Association for Research in Vision and Ophthalmology guidelines for studies in animals (protocol 311).
Mice
Mice were housed at the Animal Care Facility, Brigham and Women’s Hospital, Boston. C57BL/6N mice were purchased from Taconic Farms (Rensselaer, NY). Seven- to nine-week old mice were used throughout the experiments. We have not observed significant differences in the bacterial clearance of male and female mice to ocular P. aeruginosa-induced infection.
Bacterial strains and inoculum
Invasive P. aeruginosa clinical isolate 6294 (human keratitis isolate used in animal models) was used for the experiments39–48. The bacterial strain was grown overnight at 37°C in Tryptic Soy Broth (TSB) (Cardinal Health, Dublin, OH) agar plates supplemented with 5% sheep blood. Bacterial suspensions were prepared in saline solution and used for subsequent infection experiments.
Murine infection model
Infections were carried out as previously described16,49. Briefly, eight age- and sex-matched mice were anesthetized with intraperitoneal ketamine and xylazine injections. Scratches (3 x 5 mm) were made on the cornea with a 25G needle tip and an inoculum of 1 x 10⁵ colony forming units (CFU) of P. aeruginosa was delivered in 5 µl onto the eye. Control mice were scratched, but not infected. Mice were sacrificed 24 h or 48 h after infection; eyes were washed with 15 µl of phosphate buffered saline (PBS), enucleated, and the corneas were dissected from the ocular surface. Infected, control, and counter lateral (eye opposite the infection) eyes were collected. We previously demonstrated consistent proliferation of P. aeruginosa at the corneal surface with colony forming units counts and we confirmed the formation of P. aeruginosa biofilms16,21,46,50.
Sample preparation for LC-MS/MS analysis
Eye wash samples were processed in quadruplicate per treatment and subjected to an in-solution digestion as previously described16,51. Briefly, 5 µl of 8 M Urea containing 40 mM HEPES was added to the eye wash samples, followed by sonication in a water bath at 4°C for 15 min (30 s on/30 s off). Samples were reduced with 10 mM dithiothreitol (DTT), alkylated with 55 mM iodoacetamide (IAA), followed by enzymatic digestion with a mixture of LysC and trypsin (Promega, protein:enzyme ratio, 50:1) overnight at room temperature. Digestion was stopped with 10% v/v trifluoroacetic acid (TFA) and all of the acidified peptides were loaded onto STop And Go Extraction (STAGE) tips (consisting of three layers of C18) to desalt and purify according to the standard protocol52.
Corneal samples were processed in quadruplicate per treatment and subjected to a total proteome extraction protocol as previously described with modifications53. Briefly, samples were washed twice with 50 µl PBS, and resuspended in 300 µl of ice cold 100 mM Tris-HCl (pH 8.5) containing a proteinase inhibitor cocktail tablet. Using a probe sonicator, samples were lysed in an ice bath for 3 cycles (30% power, 30 s on/3 s off), 2% sodium dodecyl sulphate (SDS) and 10 mM DTT was added and the samples incubated at 95°C for 10 min with shaking at 800 rpm. The samples were cooled, 55 mM IAA was added, incubated at room temperature for 20 min in the dark and then 100% ice cold acetone (final concentration of 80%) was added prior to storage at −20°C overnight. Samples were collected by centrifugation at 13,500 rpm at 4°C for 10 min, washed twice with 80% acetone, and air dried. Pellets were resolubilized in 8M Urea/40 mM HEPES, diluted in 50 mM ammonium bicarbonate, and digested overnight with LysC/trypsin enzyme mix mentioned above. Samples were purified on STAGE-tips and prepared for LC-MS/MS.
LC-MS/MS
Samples were eluted from STAGE-tips with 50 µl buffer B (80% acetonitrile (ACN) and 0.5% acetic acid), concentrated and dried for 40 min, and resuspended in 12 µl buffer A (0.1% TFA). Six µl of each sample was analyzed by nanoflow liquid chromatography on an Ultimate 3000 LC system (ThermoFisher Scientific) online coupled to a Fusion Lumos Tribrid mass spectrometer (ThermoFisher Scientific) through a nanoelectrospray flex-ion source (ThermoFisher Scientific). Samples were loaded onto a 5 mm µ-precolumn (ThermoFisher Scientific) with 300 µm inner diameter filled with 5 µm C18 PepMap100 beads. Peptides were separated on a 15 cm column with 75 µm inner diameter for the chromatography with 2 µm reverse-phase silica beads. Peptides were separated and directly electrosprayed into the mass spectrometer using a linear gradient from 4% to 30% ACN in 0.1% formic acid over 45 min at a constant flow of 300 nl/min. The linear gradient was followed by a washout with up to 95% ACN to clean the column followed by an equilibration stage to prepare the column for the next run. The Fusion Lumos was operated in data-dependent mode, switching automatically between one fill scan and subsequent MS/MS scans of most abundance peaks with a cycle time of 3 s. Full scan MS1s were acquired in the Orbitrap analyzer with a resolution of 120,000, scan range of 400–1600 m/z. The maximum injection time was set to 50 ms with an automatic gain control target of 4e5. Radio frequency lens was set to 30. The fragment ion scan was also done in the Orbitrap using a Quadrupole isolation window of 1.6 m/z and HCD fragmentation energy of 30. Orbitrap resolution was set to 30,000, with a maximum ion injection time of 50 and an automatic gain control target set to 5e4.
Raw data processing
Raw files were analyzed together using MaxQuant software (version 1.6.0.26.)54. The derived peak list was searched with the built-in Andromeda search engine against the reference Mus musculus proteome (March 2019; 54,185 sequences) and Pseudomonas aeruginosa PAO1 proteome (May 21, 2019; 5,564 sequences) from Uniprot (http://www.uniprot.org)55. The parameters were as follows: strict trypsin specificity, allowing up to two missed cleavages, minimum peptide length was seven amino acids, carbamidomethylation of cysteine was a fixed modification, N-acetylation of proteins and oxidation of methionine were set as variable modifications. A minimum of two peptides required for protein identification and peptide spectral matches and protein identifications were filtered using a target-decoy approach at a false discovery rate (FDR) of 1%. ‘Match between runs’ was enabled with a match time window of 0.7 min and an alignment time window of 20 min56. Relative, label-free quantification (LFQ) of proteins used the MaxLFQ algorithm integrated into MaxQuant using a minimum ratio count of two56. ‘Split between taxonomy’ was enabled to search both proteome files57. The mass spectrometry proteomics data have been deposited in the PRIDE partner repository for the ProteomeXchange Consortium with identifier: PXD015362
Bioinformatics
Further analysis of the MaxQuant-processed data (‘proteingroups.txt’ file) was performed using Perseus (version 1.6.2.2)58. Hits to the reverse database, contaminants, and proteins only identified with modified peptides were eliminated. LFQ intensities were converted to a log scale (log2), and only those proteins present in triplicate within at least one sample set were used for further statistical processing (valid-value filter of 3 in at least one group). Missing values were imputed from a normal distribution (downshift of 1.8 standard deviations and a width of 0.3 standard deviations). A Student’s t-test identified proteins with significant changes in abundance (p-value ≤0.05) with multiple hypothesis testing correction using the Benjamini-Hochberg FDR cutoff at 0.05. A principal component analysis was performed, as well as a Pearson correlation with hierarchical clustering by Euclidean distance to determine replicate reproducibility. For 1D annotation enrichment, Student’s t-test (permutation-based FDR = 0.05; S0 = 1) was performed followed by 1D annotation enrichment function in Perseus using the Student’s t-test difference values with an FDR threshold of 0.05 using the Benjamini-Hochberg method59. This analysis generates a numerical ‘score’ value, which represents the direction in which the protein LFQ intensities within a given category tend to deviate from the overall distribution of all proteins. Visualization of enrichment by gene ontology and keywords within the RStudio platform (http://www.R-project.org/)60. The STRING: functional protein association networks provided visualization of protein networks (https://string-db.org)61. For pathway mapping analyses, KEGG mapper (https://www.genome.jp/kegg/mapper.html) and Reactome (https://reactome.org) tools were used62,63.
Myeloperoxidase activity assay
For validation of mass spectrometry data, a myeloperoxidase activity assay was performed as previously described64. Briefly, peroxidase activity with 3,3’,5,5’-Tetramethyylbenzidine (TMB, Sigma) was measured with 10 µl of sample (cornea resuspended in 10 µl PBS and sonicated in a 4°C water bath as described above) combined with 190 µl TMB substrate solution (1 mg TMB in 1 ml DMSO, added to 9 ml of 0.05 M Phosphate-Citrate buffer (25.7 ml of 0.2 M dibasic sodium phosphate and 24.3 ml of 0.1 M citric acid to 100 ml with dH2O, pH 5.0)) and incubate the plate at 37°C for 5 min. The reaction was stopped by adding 50 µl 2 M H2SO4 (Sigma), and absorption was measured at 450 nm to estimate myeloperoxidase activity. This experiment was performed in triplicate. Samples included: PBS as a negative control, 10 µl of bone marrow-derived neutrophils purified and isolated from C57BL/6N mice and flash frozen as a positive control, and cornea from infected and control mice resuspended in 10 µl PBS, sonicated in a water bath at 4°C for 15 cycles (30 s on/30 s off)51.
3. Results
The goal of this study was to profile changes in protein abundance in the eye wash of mice infected with P. aeruginosa following biofilm formation at 24 hpi and to define the ocular proteome at the site of infection. A general workflow of infection, isolation, extraction, purification, and detection is provided (Fig. 1) In addition, our approach enabled distinction between general host immune response to infection (comparing infected vs. control samples), and response to infection directly at the site of the host-bacteria interface (comparing infected vs. counter lateral samples). Moreover, we define the most comprehensive proteome of the murine cornea to date and we provide the first in vivo identification of bacteria-specific response to the host during biofilm formation at the ocular surface. Temporal proteome profiling of eye wash samples also revealed potential diagnostic markers associated with P. aeruginosa infection at the ocular surface. Our results highlight the significance of myeloperoxidase during P. aeruginosa infection of the eye and suggest novel insight into the mechanisms involved from both the host and pathogen perspectives during infection.
Figure 1: Overview of bottom-up proteomics workflow for profiling murine eye wash and corneal samples.

C57BL/6N mice were infected with P. aeruginosa 6294 at the ocular surface (or treated with control) for 24 h. Proteins are extracted from eye wash and corneal samples, followed by enzymatic digestion and purification on C18 resin tips51,52. The purified peptides are measured in the first MS scan and peptide fragmentation patterns are observed in the second MS scan (MS/MS). The data is processed and analyzed using the publicly available MaxQuant and Perseus platforms54,58. Figure generated with Biorender.com.
Proteome profiling of eye wash samples identifies distinct differences in host response during infection
To identify proteins in the extracellular environment of the ocular surface, we collected eye wash from P. aeruginosa 6294-infected, control, and counter lateral samples. The samples were processed using an in-solution digestion protocol and measured by LC-MS/MS (Fig. 1)51. In total, 305 host proteins were identified from quadruplicate samples. Biological replicate reproducibility was 86.1% to 88.7% (Supp. Fig. 1A). A principal component analysis (PCA) demonstrated clear clustering of the replicates and distinct patterns of protein response among the samples (Fig. 2A). Notably, the largest component of distinction is between infected vs. uninfected samples (component 1, 77.3%) and a distinction between counter lateral vs. control samples was also evident (component 2, 5.5%). This illustrates clear differences in the proteome profiles of infected vs. uninfected samples.
Figure 2: Profiling of eye wash during P. aeruginosa infection.

A) Principal component analysis. B) Volcano plot depicting all proteins identified in eye wash samples, highlighting proteins with significant increase or decrease in abundance during infection (red) vs. control (black). Statistical analysis: Student’s t-test, p-value < 0.05; FDR = 0.05, S0 = 1. C) Volcano plot depicting all proteins identified in eye wash samples, highlighting proteins with significant increase or decrease in abundance during infection (red) vs. counter lateral (dark grey). Statistical analysis: Student’s t-test, p-value < 0.05; FDR = 0.05, S0 = 1. D) Venn diagram comparing significantly different proteins identified between counter lateral (dark grey) and control (black) analyses. E) 1D annotation enrichment based on Gene Ontology Biological Processes (GOBP) (FDR = 0.05). Score represents the direction (>0, <0.6) which the proteins tend to deviate from the overall distribution of all proteins (i.e., a positive or negative enrichment of the protein category). F) 1D annotation enrichment based on Gene Ontology Cellular Compartment (FDR = 0.05). Score represents the direction (>0, <0.6) which the proteins tend to deviate from the overall distribution of all proteins (i.e., a positive or negative enrichment of the protein category). G) STRING network analysis of significantly different proteins with an increase in abundance during infection vs. control.
To identify host proteins significantly different in abundance during treatment in the eye wash samples, we performed statistical analyses and generated volcano plots. Upon comparison of infected vs. control samples, 104 proteins showed significant changes in protein abundance with 85 increased in abundance and 19 decreased in abundance during infection (Fig. 2B; Supp. Table 1). Three proteins showed >10-fold changes in protein abundance during infection, including hemopoxin (heme binding and transportation), protein S100-A8 (calcium- and zinc-binding associated with immune response and inflammation), and a neutrophilic granule protein (cathepsin inhibitor). Notably S100-A9, which forms a complex with S100-A8 was also identified with a significant increase in abundance of >8-fold fold. These proteins represent the general host defense response to infection (i.e., infected vs. uninfected).
A comparison of infected vs. counter lateral samples identified 103 significantly different proteins with 78 showing an increase in abundance and 25 showing a decrease in abundance during infection (Fig. 2C; Supp. Table 2). Here, five proteins showed a >10-fold increase in abundance during infection, including the hemopoxin, protein S100-A8, and neutrophilic granule protein listed above, as well as serum albumin (zinc transporter in plasma) and protein S100-A9 (calcium- and zinc-binding associated with immune response and inflammation). These proteins represent the host defense response directly at the site of infection. Next, we considered the proteomic impact on the eye wash samples not directly exposed to the P. aeruginosa (i.e., counter lateral and control). Our analysis demonstrated that protein abundance from the counter lateral and control samples were similar; no significant differences in protein abundance were measured (Suppl. Fig. 1B).
To distinguish proteins associated with the general host response (control) from a site-specific response (counter lateral), we analyzed all of the significantly different proteins between the infected vs. control and infected vs. counter lateral eye wash samples. This comparison identified 10 general responses-associated proteins and nine site-specific response proteins (Fig. 2D). An in-depth analysis of the 10 proteins unique to the comparisons with the control samples, which represent proteins associated with general host response, include proteins with diverse roles in response to stimulus (e.g., odorant-binding protein), biosynthetic and catabolic processes (e.g., transketolase and alcohol dehydrogenase), as well as antigen processing and immune response (e.g., proteasome activator and secretoglobin) (Supp. Table 3). Conversely, the nine proteins unique to the counter lateral samples, which represent proteins associated with a site-specific response against the invading bacterium, include proteins with functions in immune response (e.g., immunoglobulin), transport (e.g., heat shock protein), homeostasis (e.g., nucleobindin-2), and biosynthetic processes (e.g., alcohol dehydrogenase) (Supp. Table 4). Cumulatively, these comparisons highlight the differences in a general host response (infected vs. uninfected) and the site-specific response (infected vs. counter lateral).
To evaluate enrichment of categories in our dataset, we performed a 1D annotation enrichment based on Gene Ontology Biological Processes (GOBP) and Gene Ontology Cellular Compartments (GOCC). A 1D annotation enrichment tests for every annotation term (e.g., GOBP category) if the corresponding numerical values (e.g., LFQ intensity) of the proteins within that category have a preference to be systematically larger or smaller than the global distribution of the values for all proteins. The 1D annotation score represents the direction in which the proteins within a given category tend to deviate from the overall distribution of all proteins (i.e., positive or negative enrichment of the GOBP category). Using this approach, we observed an enrichment of all categories represented in the infected samples when compared to the control samples, including regulation of biological, metabolic, catalytic, and cellular processes, as well as a significant enrichment in defense response proteins, supporting a diverse cellular response to infection (Fig. 2E). Infected vs. counter lateral samples showed the same enrichment of defense response and regulation of metabolic processes; however, a negative enrichment of proteins associated with biological, metabolic, catalytic, and cellular processes was observed, suggesting specific and targeted production of proteins in response to infection. Comparison of the counter lateral to the control samples showed a negative enrichment of all nine categories, suggesting a diminished, but specific host response in the counter lateral eye wash samples. These results highlight the enrichment of defense response-associated proteins during infection.
Given our focus on proteins present within murine eye wash, we also used 1D annotation to evaluate an enrichment of extracellular-associated proteins in our sample set. Here, the majority of categories demonstrating a significant enrichment of proteins in the infected samples were associated with extracellular and membrane-bound organelles and vesicles (Fig. 2F). Notably, an enrichment of vesicular proteins (e.g., calmodulin-like protein, glycoprotein) was observed during the comparison of infected vs. counter lateral samples, but not evident in comparison of the control; again, suggesting a targeted defense response to infection. We also observed an enrichment of cytoplasmic proteins (e.g., glutathione S-transferase, alcohol dehydrogenase) in the control samples, which were not enriched in the counter lateral samples, supporting production of a broad range of proteins in response to infection. These results support our ability to capture extracellular-associated, secreted, or vesicle-associated proteins in our eye wash analysis.
Lastly, we aimed to define networks of proteins altered during infection. For this analysis, we used the STRING database to analyze proteins showing a significant increase in abundance during infection vs. control and we identified three distinct clusters of protein networks: enzymes (e.g., alpha-enolase, peptidyl-prolyl cis-trans isomerase), structure (e.g., moesin, actin-binding protein), and homeostasis (e.g., anti-trypsin, apolipoprotein) (Fig. 2G). This analysis demonstrates the diverse roles of proteins in the eye wash play during a general response to bacterial infection and highlight the interconnectivity among host defense responses. Notably, very few interactions were defined with proteins showing a significantly decrease in abundance and no distinct clusters were evident.
Profiling of the corneal proteome reveals enrichment of specific immune response during infection
To identify and quantify proteins (both host and pathogen) present at the ocular surface during P. aeruginosa 6294 biofilm formation in a murine model of infection, we developed a protocol to extract proteins from the cornea of infected, control, or counter lateral samples (Fig. 1). In total, we identified 2,569 mouse proteins and upon valid value filtering (protein must be identified in 3 out of 4 replicates, in at least one group), we pursued further analysis of 1,278 host proteins. Biological replicate reproducibility was 88.8% to 90.7% (Supp. Fig. 2A). A PCA plot showed clear clustering between infected vs. uninfected (control and counter lateral) samples as the largest component of distinction (component 1, 62.5%) and a second component displaying minor variation amongst replicates (component 2, 12.6%) (Fig. 3A). These findings were comparable to our observations in the eye wash samples. Notably, we did not observe distinct clustering of control vs. counter lateral samples as observed in the eye wash profiles, suggesting a greater emphasis on the presence or absence of bacteria, compared to the general immune response.
Figure 3: Profiling of corneal proteome during P. aeruginosa infection.

A) Principal component analysis. B) Volcano plot depicting all proteins identified in cornea samples, highlighting proteins with significant increase or decrease in abundance during infection (red) vs. control (black). Statistical analysis: Student’s t-test, p-value < 0.05; FDR = 0.05, S0 = 1. C) Volcano plot depicting all proteins identified in corneal samples, highlighting proteins with significant increase or decrease in abundance during infection (red) vs. counter lateral (dark grey). Statistical analysis: Student’s t-test, p-value < 0.05; FDR = 0.05, S0 = 1. D) Venn diagram comparing significantly different proteins identified between counter lateral (dark grey) and control (black) analyses. E) 1D annotation enrichment based on Gene Ontology Biological Processes (GOBP) (FDR = 0.001) (Inf = infected; Cont = control; Lat = counter lateral). Score represents the direction (>−0.6, <0.6) which the proteins tend to deviate from the overall distribution of all proteins (i.e., a positive or negative enrichment of the protein category). F) STRING network analysis of significantly different proteins with a decrease in abundance during infection vs. control. G) STRING network analysis of significantly different proteins with an increase in abundance during infection vs. control. H) LFQ intensity plot of proteins common to the murine corneal proteome profiling during P. aeruginosa infection in vivo compared to P. aeruginosa infection of human endothelial cells in vitro. Average LFQ intensity (log2) plotted; error bars = standard deviation.
Given the distinction between infected and uninfected samples, we performed statistical analyses on the data set and generated volcano plots to define significantly different proteins. Upon comparison of the infected vs. control corneal samples, 503 proteins were significantly different, including 312 proteins increased in abundance and 192 proteins decreased in abundance during infection (Fig. 3B; Supp. Table 5). The protein with the highest increase in abundance was myeloperoxidase (Mpo), a well-characterized neutrophil-associated protein produced during infection (>10-fold change in abundance, log2 scale). Mpo is highlighted in the volcano plot and validated through an enzymatic assay below. This data represents proteins associated with the general host defense response to infection.
Next, a comparison of infected vs. counter lateral samples identified 697 proteins significantly different, including 324 with increased abundance and 369 with decreased abundance during infection (Fig. 3C; Supp. Table 6). In this comparison, lactotransferrin (Ltf), a major iron-binding and multifunctional protein showed the highest change in abundance (>10-fold change in abundance, log2 scale), followed by Mpo (>10-fold change in abundance, log2 scale). Both proteins are highlighted in the volcano plot. This data set represents proteins associated with the host defense response directly related to response at the site of infection. Notably, one protein (a prolactin-inducible protein homologue) showed a significant increase in abundance in the control compared to the counter lateral samples (Supp. Fig. 2B).
To distinguish proteins associated with the general host response (control) from a site-specific response (counter lateral), we analyzed all of the significantly different proteins between the infected vs. control and infected vs. counter lateral corneal samples. This analysis identified 44 proteins unique to the control samples and 232 proteins unique to the counter lateral samples; 457 proteins were shared between the two conditions (Fig. 3D). In both cases, the unique proteins cover a diverse range of protein functions, including cell adhesion (e.g., desmoglein), immune response (e.g., glyceraldehyde-3-phosphate dehydrogenase), and endocytosis (e.g., V-type proton ATP) in the control samples (Supp. Table 7) and complement activation (e.g., complement C5), apoptotic signaling pathway (e.g., Annexin A6), and immune response (e.g., integrin α) in the counter lateral samples (Supp. Table 8). This comparison highlights the differences in a general host response (infected vs. uninfected) and the site-specific response (infected vs. counter lateral) and the proteins identified in each of these categories are highlighted below in a 1D annotation enrichment analyses.
Based on the large number of significantly different proteins identified in the comparisons above, we performed a 1D annotation enrichment to highlight categories of proteins enriched in the datasets. Here, a focus on GOBP showed enrichment of 38 biological categories with 18 positively enriched categories associated with immune and stress response in the infected samples, as well as biological, metabolic, and biosynthesis processes when compared to the control and counter lateral samples (Fig. 3E). A difference in enriched categories between control and counter-lateral relative to infected samples, included a greater emphasis of regulation of the immune system, vesicle transport, and metabolic processes in the counter lateral analysis and a greater emphasis on general immune response, effector process, transport, and protein localization in the controls. This data highlights distinctions between the general and site-specific host response at the cellular level and emphasizes our ability to detect a diverse array of immune-associated proteins. Three muscle-associated categories were negatively enriched between infected and the counter lateral samples. Between the counter lateral and control samples, 12 categories were positively enriched, including categories associated with metabolic, catabolic, systems, and oxidation-reduction processes, demonstrating a role in the site-specific host response; whereas five categories were negatively enriched including, translation, and metabolic and biosynthetic processes, indicative of a general biological response. These results emphasize our ability to profile the impact of immune response during infection and proteins associated with host defense response from the ocular surface.
We next aimed to define protein interactions altered during infection by using the STRING database to highlight networks of significantly different proteins. When analyzing proteins with a significant decrease in abundance during infection vs. control corneal samples, we observed four network clusters (Fig. 3F). These included proteins associated with enzymatic reactions (e.g., alcohol dehydrogenase), muscle (e.g., myosin), structure (e.g., keratin), and the largest network of collagen (e.g., collagen alpha-chain). Analysis of proteins showing a significant increase in abundance included three clusters with the majority of proteins connected to immune response (e.g., neutrophil factors, CD14, CD44), homeostasis (e.g., voltage-gated potassium channel), enzymes (e.g., glutathione peroxidase), and structure (e.g., actin-related protein), as well as immunoglobulins (e.g., lipocalin) and histones (e.g., histone H1) (Fig. 3G). By visualizing the protein interactions and changes in networks in response to infection and protein abundance, we uncover novel connectivity patterns between clusters during a general response and again, emphasize our ability to detect immune-associated responses to infection at the interface of P. aeruginosa biofilm formation and cornea.
To the best of our knowledge, this is the first proteome profile of P. aeruginosa-infected murine corneas describing the host response to infection and identifying bacterial proteins in a single analysis. To extend our findings and explore the translational aspect of our study, we compared our analysis to a seminal study using protein array characterization of bioactive proteins secreted by immortalized human corneal epithelium in response to P. aeruginosa constituents65. Our comparison identified five proteins common amongst the data sets and reported similar trends in protein abundance in response to infection between the studies. Specifically, we confirmed an increase in abundance of angiostatin (Plg), matrix metalloproteinase (MMP-9), and interleukin-1ß (IL-1ß) in the presence of bacteria and little or no change in protein abundance of transforming growth factor 1ß (TGF-ß1) and endostatin (Col18a) (Fig. 3H). Taken together, these results support a common immune response to P. aeruginosa infection of corneal cells in both human and murine models.
To define biological processes and pathways directly influenced by the host immune response, we mapped proteins identified during P. aeruginosa infection at the ocular surface to known pathways. Of the 520 significantly different proteins identified in the proteome comparison between control (mock infected) and P. aeruginosa-infected cornea, 112 proteins had defined GOBP categories associated with immune response. KEGG mapping analysis identified 187 pathways impacted by infection. Pathways with the highest number of detected proteins, including proteins with increases and decreases in abundance, were the complement and coagulation cascades (mmu04610; 13 proteins), leukocyte transendothelial migration (mmu04670; 13 proteins), and phagosome (mmu04145; 12 proteins) pathways (Fig. 4A–C). We observe consistent increased abundance of proteins associated with phagocytosis and activation of NADPH oxidase. Conversely, we observe a decrease in abundance of proteins associated with leukocyte tail retraction, regulation of actin cytoskeleton, and transendothelial migration.
Figure 4: Biological processes and pathways influenced by the host immune response to P. aeruginosa infection.

A) KEGG mapping of immune response-associated proteins by Uniprot ID for Mus musculus of complement and coagulation cascades. B) KEGG mapping of immune response-associated proteins by Uniprot ID for Mus musculus of leukocyte transendothelial migration. C) KEGG mapping of immune response-associated proteins by Uniprot ID for Mus musculus of phagosome. Figures generated with KEGG mapper. Proteins with increased abundance (red) and decreased abundance (blue) during P. aeruginosa infection of murine cornea relative to control (mock infected). D) Mapping of murine immune response-associated proteins identified in the corneal proteome to human proteins and biological process pathway. Represented categories with proteins demonstrating an increase in abundance during P. aeruginosa infection of murine cornea relative to control (mock infected) (dark grey). Figure generated with Reactome.org.
Finally, we mapped the immune-associated mouse proteins to human proteins to visualize pathway coverage. Here, we observe the diverse biological processes of proteins influenced by bacterial infection of the cornea involved in immune response (Fig. 4D). The majority of proteins are associated with the innate immune system, including neutrophil degranulation (28 proteins), cytokine and interleukin signaling (37 proteins), and antimicrobial peptides (12 proteins). We also observe proteins influencing signal transduction (e.g., NADPH oxidase, 6 proteins), and homeostasis (e.g., platelet activation, 22 proteins). Taken together, these results emphasize the diverse biological processes involved during host defense response and the interconnectivity of this regulation.
Profiling of the eye wash and corneal proteome discovers potential diagnostic markers and bacteria-specific responses to infection
Given our ability to profile proteome changes to infection from both the host and pathogen perspectives, we expand our analysis to focus on bacterial proteins. In the eye wash samples at 24 hpi we did not identify any bacterial proteins; however, at 48 hpi, we identified seven bacterial proteins. These include proteins associated with host cell adhesion (e.g., OprF), putative membrane-binding (e.g., P4A739), metabolic and biosynthetic processes (e.g., Azu, GroL, AtpA), cellular organization (e.g., HupB), and protein biosynthesis (e.g., TufA) (Table 1). Given the identification of these proteins from eye wash samples of infected murine cornea, they represent potential diagnostic markers of P. aeruginosa-associated keratitis.
Table 1:
P. aeruginosa proteins identified in eye wash at 48 hpi.
| Uniprot | Gene | Protein name | PseudoCAP Function |
|---|---|---|---|
| P00282 | azu | Azurin | Energy metabolism |
| P05384 | hupB | DNA-binding protein HU-beta | DNA replication, recombination, modification, and repair |
| P09591 | tufA | Elongation factor Tu | Translation, post-translational modification, degradation |
| P13794 | oprF | Outer membrane porin F | Membrane protein; transport of small molecules |
| P30718 | groL | 60 kDa chaperonin | Protein folding |
| Q9HT18 | atpA | ATP synthase subunit alpha | Energy metabolism |
| Q9HV60 | PA4739 | BON-domain-containing | Putative membrane-binding domain |
We also reported the presence of P. aeruginosa proteins at the corneal surface. Our analysis represents the first proteome profiling of bacteria-specific responses to infection at the ocular surface. We identified 86 P. aeruginosa proteins in the cornea total proteome; 23 were quantified upon filtering (Table 2). Based on the PseudoCAP functional assignment, these include proteins associated with energy metabolism (five proteins), translation (five proteins), transport of small molecules (five proteins), DNA replication and repair (two proteins), amino acid biosynthesis (two proteins), adaptation (two proteins), protein folding (one protein), and secreted factors (one protein). Several of these proteins have roles in iron response and acquisition (e.g., fptA and fumC1), as well as pathogenesis (e.g., pal, ahpC, pvdA, PA0423), supporting our ability to detect bacterial proteins critical for P. aeruginosa survival and virulence. Notably, six of the bacterial proteins identified in the eye wash were also detected from the corneal samples, excluding a BON (bacterial OsmY and nodulation)-domain-containing protein, P4A739.
Table 2:
P. aeruginosa proteins identified at the ocular surface.
| Uniprot | Gene | Protein name | PseudoCAP Function |
|---|---|---|---|
| P00282 | azu | Azurin | Energy metabolism |
| P05384 | hupB | DNA-binding protein HU-beta | DNA replication, recombination, modification, and repair |
| P08308 | arcB | Ornithine carbamoyltransferase | Amino acid biosynthesis and metabolism |
| P09591 | tufA | Elongation factor Tu | Translation, post-translational modification, degradation |
| P13794 | oprF | Outer membrane porin F | Membrane protein; transport of small molecules |
| P13981 | arcA | Arginine deiminase | Amino acid biosynthesis and metabolism |
| P30718 | groL | 60 kDa chaperonin | Protein folding |
| P32722 | oprD | Porin D | Transport of small molecules |
| P42512 | fptA | Fe(3+)-pyochelin receptor | Transport of small molecules |
| P53593 | sucC | Succinyl-CoA ligase [ADP-forming] subunit beta | Energy metabolism |
| Q51404 | fumC1 | Fumarate hydratase class II 1 | Energy metabolism |
| Q51548 | pvdA | L-ornithine N(5)-monooxygenase | Adaptation, protection |
| Q59636 | ndk | Nucleoside diphosphate kinase | Nucleotide biosynthesis and metabolism |
| Q9HT18 | atpA | ATP synthase subunit alpha | Energy metabolism |
| Q9HW32 | icmP | Insulin-cleaving metalloproteinase outer membrane protein | Membrane protein |
| Q9HWC6 | rplA | 50S ribosomal protein L1 | Translation, post-translational modification, degradation |
| Q9HWC8 | rplL | 50S ribosomal protein L7/L12 | Translation, post-translational modification, degradation |
| Q9HWD2 | fusA | Elongation factor G 1 | Translation, post-translational modification, degradation |
| Q9HZ71 | rpsA | 30S ribosomal protein S1 | Translation, post-translational modification, degradation |
| Q9I3D2 | sucB | Dihydrolipoyllysine-residue succinyltransferase | Energy metabolism |
| Q9I4Z4 | pal | Peptidoglycan-associated lipoprotein | Transport of small molecules; membrane proteins |
| Q9I690 | PA0423 | UPF0312 protein PA0423 | Secreted factors (toxins, enzymes, alginate) |
| Q9I6Z3 | ahpC | Alkyl hydroperoxide reductase C | Adaptation, protection |
To support our identification of P. aeruginosa proteins produced in response to the host-pathogen interaction, we compared our detection of bacterial proteins in vivo (eye wash and corneal proteome) to a previous report of biofilm-associated P. aeruginosa proteins in vitro66. Between the datasets, we observed two proteins (present in both the eye wash and corneal samples) associated with biofilms (i.e., HupB and AtpA) (Fig. 5A). We also compared our dataset to previous proteomic profiling of P. aeruginosa vesicles to support our observation of P. aeruginosa proteins produced in response to the host-pathogen interaction67. Here, we observed an overlap of eight proteins from our list of 24 bacterial proteins previously identified in outer membrane vesicles (Fig. 5B). Moreover, classification of the bacterial proteins based on PseudoCAP function highlighted the diverse array of cellular processes detected in this dataset (Fig. 5C). Overall, our eye wash analysis of P. aeruginosa-infected murine models, identified seven potential biomarkers of bacterial infection, including one protein unique to the extracellular environment. Furthermore, comparison to previous proteomic profiling of P. aeruginosa confirms our detection of biofilm- and vesicle-associated proteins produced during infection.
Figure 5: Detection of P. aeruginosa proteins in eye wash and corneal proteome.
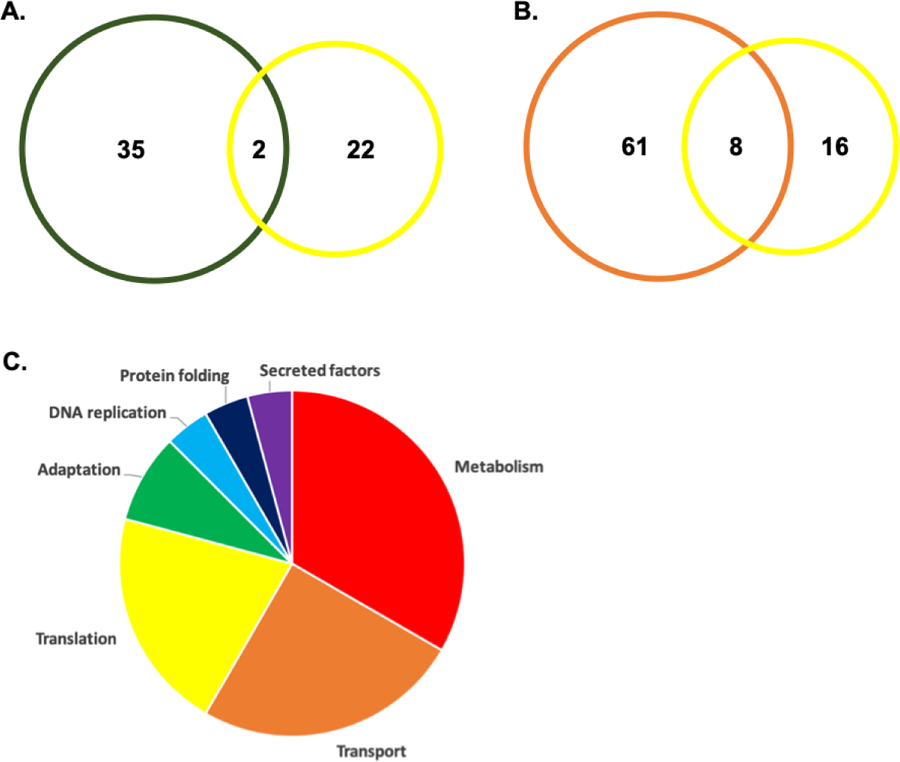
A) Venn diagram comparing P. aeruginosa proteins identified in this study to P. aeruginosa biofilm-associated proteins in vitro. B) Venn diagram illustrating common and unique P. aeruginosa proteins from this study and previous proteome profiling of bacterial vesicles. C) Pie chart based on PseudoCAP functions for P. aeruginosa proteins detected in both eye wash and corneal proteome.
Validation of proteomic datasets confirms protein-level responses to bacterial infection at the ocular surface
Based on our profiling of the extracellular environment of P. aeruginosa infection at the ocular surface, we evaluated our ability to detect neutrophil-associated proteins in the eye wash samples. This was achieved by comparing the 305 eye wash proteins to our recent profiling of bone-marrow derived circulating neutrophils following P. aeruginosa infection of the eye16. This comparison confirmed the presence of 233 neutrophil-associated proteins (proteins previously reported to be associated with neutrophils) in our eye wash samples, including ‘neutrophil marker’ proteins such as enzymes (e.g., Mpo, Chil3), cathepsin (e.g., Ctsg), and complement (e.g., Cfb) (Fig. 6A; Supp. Table 9). The detection of these marker proteins highlights our ability to quantify proteins associated with neutrophils recruited to the site of infection.
Figure 6: Validation of eye wash and corneal proteome profiles.
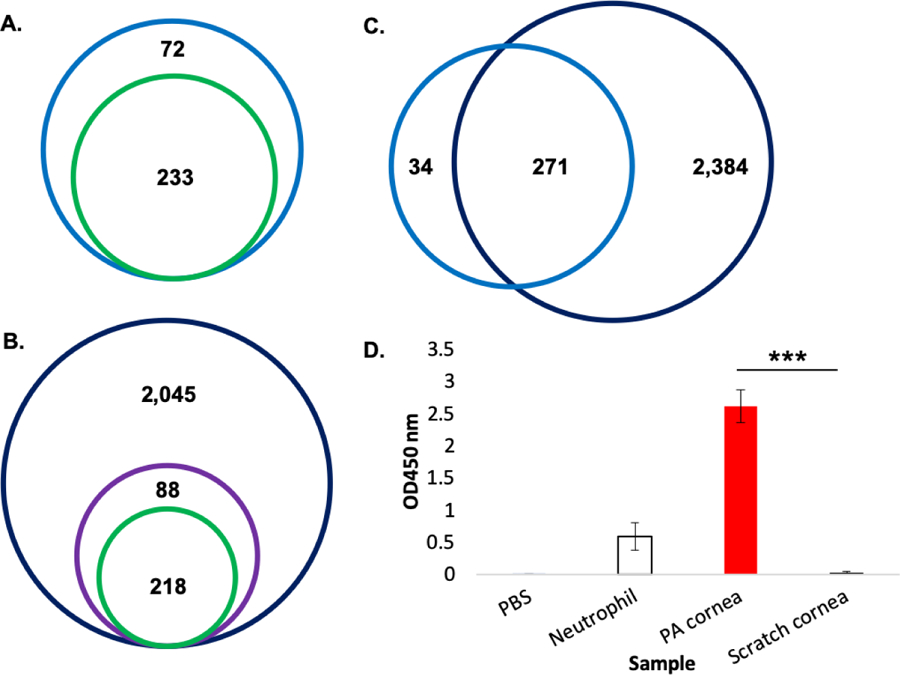
A) Venn diagram illustrating proteins identified in extracellular environment (eye wash) compared to bone marrow-derived neutrophil proteomic profiling identifies 233 ‘neutrophil marker’ (green) proteins of the 305 total proteins (blue). B) Venn diagram illustrating proteins identified in the corneal samples with 88 immune- and inflammation-associated proteins (GOBP; purple) highlighted and comparison of this protein subset to bone marrow-derived neutrophil proteomic profiling identifies 218 ‘neutrophil marker’ proteins (green) of the 2,569 total proteins (dark blue). C) Venn diagram comparing total proteomes for eye wash (blue) and corneal samples (dark blue). D) Myeloperoxidase activity enzyme assay. Samples include: PBS negative control, neutrophil positive control, P. aeruginosa-infected cornea, control (scratched) cornea. Error bars = standard deviation; ***p-value < 0.0001.
We also report the deepest corneal proteome to data with 2,569 murine proteins identified and demonstrate our detection of immune-associated proteins (Fig. 6B). Within this proteome, we identified 308 immune- and inflammation-specific proteins (based on GOBP classifications), which, upon comparison to our previous profiling of bone marrow-derived circulating neutrophils, confirm detection of 218 neutrophil-associated proteins, including enzymes (e.g., Mpo), lipocalin (e.g., Lcn2), and neutrophil elastase (e.g., Elane) in the cornea (Supp. Table 10). These results suggest a heightened immune response during infection and our ability to comprehensively profile this immune response at the ocular surface. We also compared the proteome profiles of our eye wash samples to the cornea samples based on all proteins detected and we found 271 common to the sample sets with 2,384 proteins unique to the corneal proteome and 34 unique to the eye wash (Fig. 6C). Notably, 56% (19/34) of the eye wash-specific proteins are associated with secretion or extracellular location, including proteins with a signal peptide, supporting their presence in the extracellular environment through secretion (Supp. Table 11).
The heightened immune response demonstrated a significant increase in abundance in myeloperoxidase (Mpo) during infection in comparison to the control or counter-lateral samples (>10 fold increase in abundance, log2 scale). Here, we validated our label-free quantitative proteomics experiments using a well-established enzymatic assay to measure Mpo activity in the infected vs. control cornea (Fig. 6D). The results show a significant increase in production of Mpo in the infected murine corneas compared to the control (p-value < 0.00006), confirming our observations in the proteomics data.
4. Discussion
Proteomics provides an ideal platform for profiling the interaction between host and pathogen during infection and advances in sensitivity, robustness, and bioinformatic pipelines enables dual perspective (host and pathogen) analyses in a single experiment. In this study, we use state-of-the-art mass spectrometry-based label-free quantitative proteomics to profile the ocular proteome and extracellular environment (eye wash) following P. aeruginosa biofilm formation in a murine model. Our data reveals the deepest proteome to date of the murine cornea and provides the first in vivo identification of bacteria-specific responses to the host during bacterial biofilm formation of the eye. We also identify potential diagnostic markers of P. aeruginosa-associated keratitis. With this information, we can distinguish between general and site-specific host immune responses to P. aeruginosa biofilm at the ocular surface and propose important interactions between the host and pathogen relevant for infection.
Previous murine corneal proteomes focus on ocular homeostasis during disease and analyze changes in genetically-deficient models to identify approximately 900 to 2,100 proteins68–70. When investigating the interaction between host and pathogen during bacterial infection of the ocular surface, previous reports on protein changes relied on 2D gel electrophoresis, ELISA, and western blotting to define host responses to Staphylococcus aureus and Streptococcus pneumoniae infection, protein arrays to report secreted products during P. aeruginosa infection, and LC-MS/MS to compare the proteomes of a clinical isolate of P. aeruginosa from an active corneal ulcer with a non-pathogenic laboratory strain. Each of these studies contributes to our understanding of ocular health during bacterial infection, but is limited on scale (number of proteins identified) or perspective (either host or bacterial proteins detected)38,65,71,72. To overcome these limitations, we report a proteomic pipeline, which enables comprehensive profiling of the murine cornea for identification of over 2,600 proteins and the ability to detect bacterial proteins among the highly-abundant host proteins. Our pipeline has the potential for application in other ocular tissues to define layers of host response to infection.
During acute and chronic infections, clearance of P. aeruginosa relies on multiple host cell types, including epithelial cells, as well as both resident and recruited phagocytic cells (e.g., lymphocytes, macrophages, and neutrophils). A hallmark of the inflammatory response to P. aeruginosa infection is the recruitment of neutrophils, which phagocytose and kill bacteria using highly-effective antimicrobial molecules. These include reactive oxygen species for peroxidation or proteins and lipids, α-defensins for pore formation and membrane permeabilization of pathogens, enzymes for degradation (as demonstrated by the high abundance of Mpo during infection), and neutrophil extracellular traps (NETs) to contain infection16,18,19,21. Through in silico comparison to our previous proteomic profiling of bone marrow-derived neutrophils, we demonstrate detection of recruited neutrophils directly at the site of infection and highlight a diversity of neutrophil-associated proteins (e.g., Mpo) with significant increases in abundance during infection16. In addition, pathway mapping of immune-associated proteins confirmed a reliance on phagocytosis and NADPH oxidase activation, processes commonly affiliated with neutrophil defenses during infection.
Our comparison of infected, control, and counter lateral eye wash and corneal samples from P. aeruginosa-infected mice, clearly distinguishes proteins and biological processes unique to the general and the site-specific host response. For example, we observe a targeted defense response in the counter lateral samples, compared to the additional enrichment of categories associated with transport, localization, and a variety of biological, metabolic, and catabolic processes during a general host response. This comparative analysis also supports our investigation into the neuronal connection between the counter lateral and infected eye. Given the counterlateral eye proteome is not significantly different from the non-infected proteome, we conclude that neuronal circuits will cause changes in the counterlateral status only upon more substantial injury, supporting our description of both general host response and site-specific responses.
Our proteomic data also emphasizes the importance of iron response through binding, transport, and utilization from both the host and pathogen perspectives. Iron is an essential nutrient for almost all organisms and its availability is implicated in many cellular processes, including DNA replication, metabolic, and the response to oxidative stress; however, the levels of available iron are tightly regulated to ensure cellular function while limiting the production of damaging free radicals in a process defined as nutritional immunity73–77. In our data set, we detect a Fe(3+)-pyochelin receptor protein with a known role as an outer membrane receptor required for transport of iron, and a fumarate hydratase class II protein associated with response to iron starvation in P. aeruginosa. Conversely, we observe a significant increase in abundance of Lipocalin, Lcn2 (8-fold, log2 scale), an innate immune protein, which sequesters catecholate-type siderophores and impedes bacterial growth in the host. Moreover, the interplay between host and bacteria for the production of siderophores or competitive antagonists to bind Lcn2 is an important and expanding field of research75,78. Our results support the recent findings of competition between P. aeruginosa and the host at the ocular surface and implicate the bioavailability of iron as a stimulator of host defense response and pathogenesis. Notably, the comparison between uninfected samples (both eye wash and corneal) revealed very few changes in abundance in absence of a comparison to infection. These results support a reproducibility in our data set to consistently profile the corneal proteome without interference from non-infection associated proteins.
Detection of P. aeruginosa proteins in the eye wash of murine cornea at 48 hpi revealed potential diagnostic markers of infection connected to the temporal profile of infection. Notably, our ability to confidently detect bacterial proteins at 48 hpi vs. 24 hpi, suggests a critical time point for testing in the clinic and underscores an opportunity for new diagnostic tests to confirm bacterial infection and the causative species. In addition, as quantitative proteomics moves closer to clinical applications, these findings support the use of targeted proteomics assays to detect, define, and treat bacterial keratitis patients in personalized manner79,80. Of the seven bacterial proteins identified in the eye wash at 48 hpi, six were also detected at the corneal surface and one protein, a BON-domain-containing protein, uniquely identified in the extracellular environment. The BON-domain is classified as a putative membrane-binding domain with connections to bacterial osmotic-shock resistance and nodulation with potential interactions with phospholipid membranes81. BON-domain-containing proteins have been identified Neisseria meningitidis, Escherichia coli, and Mycobacterium tuberculosis with putative functions in osmotic shock protection, secretion, and potential hemolysins; however, the precise function of the BON domain remains elusive81–83. In this study, identification of a BON-domain-containing protein in the extracellular environment of P. aeruginosa infection at the ocular surface promotes future exploration of its potential role in mediating host response and ability to diagnose bacterial keratitis within the clinic.
Our detection of P. aeruginosa proteins at the ocular surface suggests their importance in pathogenesis. For example, we identified several proteins associated with acquisition of nutrients, including transporters of small molecules, proteins associated with adaptation and protection, as well as secreted factors. We identified the outer porin membrane proteins OprD and OprF in our data set, these represent known virulence factors of interest in vaccine design and therapeutic antibodies84–86. Detection of these proteins demonstrates our ability to profile P. aeruginosa in a pathogenic state and highlights an opportunity for our identified bacterial proteins for follow-up experiments exploring their potential role in drug discovery and development.
Using our P. aeruginosa data set we also performed an in silico comparison to previous temporal proteomic profiling of P. aeruginosa during the transition between planktonic cells and biofilm formation66. This study demonstrated a greater representation of proteins related to metabolism, DNA stability, and molecular activity in planktonically grown P. aeruginosa PAO1 compared to the biofilms, which demonstrated increased levels of adhesion, biosynthesis, and antibiotic resistance proteins. Amongst our identified P. aeruginosa proteins at the ocular surface, four were identified in both data sets and three had confirmed associations with biofilm formation, including an ATP synthase subunit alpha (function in energy metabolism), lipotoxin F (a toxin with function in the transport of small molecules), and isocitrate lysae (a putative enzyme). Notably, we also identified a DNA-binding protein (hupB; function in DNA replication and repair) shown to be more abundant in planktonic cells during in vitro growth of PAO1; however, it’s detection at the ocular surface 24 hpi suggests our ability to capture the transition between planktonic and biofilm formation or the altered role of this protein in a clinical isolate during biofilm formation in vivo. This comparison supports our ability to detect proteins crucial for the transition from planktonic to biofilm and its proliferation during the host immune response.
In conclusion, using state-of-the-art mass spectrometry-based label-free quantitative proteomics and advanced bioinformatic platforms, we report the deepest proteome of murine cornea to date and provide the first in vivo identification of the bacteria-specific response to the host during P. aeruginosa infection at the ocular surface. We also detect potential biomarkers of P. aeruginosa infection with potential to distinguish causative agents of keratitis in the clinic. We highlight an emphasis of neutrophil response to infection and distinguish between general- and site-specific host response to infection. We validate our findings with in silico characterization of host and bacterial proteins and we confirm the significant increase in abundance of an immune-associated neutrophilic enzyme, Mpo, during P. aeruginosa infection. Overall, our analysis provides a comprehensive profile of the interplay between host and P. aeruginosa directly at the site of biofilm formation and uncovers novel strategies of host defense response and pathogenesis. Furthermore, we describe a universal proteomics platform with potential for unbiased profiling of additional bacterial and fungal infections at the ocular surface, which may uncover pathogen-specific host signatures in response to infection.
Supplementary Material
Supplemental Table 1: Significantly different proteins in comparison of infected vs. control eye wash samples.
Supplemental Table 2: Significantly different proteins in comparison of infected vs. counter lateral eye wash samples.
Supplemental Table 3: General host response proteins identified in eye wash samples.
Supplemental Table 4: Site-specific host response proteins identified in eye wash samples.
Supplemental Table 5: Significantly different proteins in comparison of infected vs. control cornea samples.
Supplemental Table 7: General host response proteins identified in cornea samples.
Supplemental Table 6: Significantly different proteins in comparison of infected vs. counter lateral cornea samples.
Supplemental Table 8: Site-specific host response proteins identified in cornea samples.
Supplemental Table 9: Neutrophil associated proteins in eye wash.
Supplemental Table 10: Neutrophil associated proteins in cornea.
Supplemental Table 11: Eye wash unique proteins upon comparison to cornea total proteome.
Statement of significance.
Quantitative proteomic profiling of the interaction between host and pathogen at the ocular surface has been limited. Moreover, the discovery of proteins is often performed in vivo from the host’s perspective due to the presence of high abundant proteins compared to in vitro from the pathogen’s perspective comparing lab-associated and clinical strains. The ability to detect and quantify proteins from both the host and pathogen in a single experiment significantly advances our ability to define host-pathogen interactions and uncover novel mechanisms of host defense response and microbial pathogenesis. In the present study, we use label-free quantitative proteomics to profile the extracellular environment of the ocular surface following biofilm formation by a clinical isolate of P. aeruginosa. Moreover, our proteome pipeline reports the deepest murine corneal proteome to date and provides the first in vivo identification of the bacteria-specific protein response, including potential diagnostic markers, to the host during ocular infection.
Acknowledgements
The authors wish to thank Dr. Jonathan Krieger of Bioinformatics Solutions Inc. for operating the mass spectrometer and for helpful discussions pertaining to optimal measuring conditions. This work was supported, in part, by the University of Guelph and the Canadian Foundation of Innovation for J.G.M. and by the NIH/NEI EY022054 for M.G.
Abbreviations:
- LC-MS/MS
liquid chromatography tandem mass spectrometry
- TSB
tryptic soy broth
- CFU
colony forming units
- PBS
phosphate buffered saline
- DTT
dithiothreitol
- IAA
iodoacetamide
- TFA
trifluoroacetic acid
- STAGE
STop And Go Extraction
- SDS
sodium dodecyl sulphate
- ACN
acetonitrile
- HCD
higher-energy C-trap dissociation
- LFQ
label free quantification
- FDR
false discovery rate
- TMB
3,3’,5,5’-Tetramethyylbenzidine
- PCA
principal component analysis
- GOBP
Gene Ontology Biological Processes
- GOCC
Gene Ontology Cellular Compartments
Footnotes
Associated data
The mass spectrometry proteomics data have been deposited in the PRIDE partner repository for the ProteomeXchange Consortium with identifier: PXD015362
Conflict of interest statement
The authors declare no conflict of interest.
References
- 1.Aebersold R & Mann M Mass-spectrometric exploration of proteome structure and function. Nature 537, 347–355 (2016). [DOI] [PubMed] [Google Scholar]
- 2.Meissner F & Mann M Quantitative shotgun proteomics: Considerations for a high-quality workflow in immunology. Nature Immunology (2014). doi: 10.1038/ni.2781 [DOI] [PubMed] [Google Scholar]
- 3.Robertson DM, Petroll WM, Jester JV & Cavanagh HD The role of contact lens type, oxygen transmission, and care-related solutions in mediating epithelial homeostasis and Pseudomonas binding to corneal cells: An overview. Eye and Contact Lens (2007). doi: 10.1097/ICL.0b013e318157e609 [DOI] [PubMed] [Google Scholar]
- 4.Robertson DM, Petroll WM, Jester JV & Cavanagh HD Current concepts: Contact lens related Pseudomonas keratitis. Contact Lens and Anterior Eye (2007). doi: 10.1016/j.clae.2006.10.001 [DOI] [PubMed] [Google Scholar]
- 5.Gellatly SL & Hancock REW. Pseudomonas aeruginosa: New insights into pathogenesis and host defenses. Pathog. Dis (2013). doi: 10.1111/2049-632X.12033 [DOI] [PubMed] [Google Scholar]
- 6.Filloux A Protein secretion systems in Pseudomonas aeruginosa: An essay on diversity, evolution, and function. Frontiers in Microbiology (2011). doi: 10.3389/fmicb.2011.00155 [DOI] [PMC free article] [PubMed] [Google Scholar]
- 7.Lin HH et al. Presence of the exoU gene of Pseudomonas aeruginosa is correlated with cytotoxicity in MDCK cells but not with colonization in BALB/c mice. J. Clin. Microbiol (2006). doi: 10.1128/JCM.01531-06 [DOI] [PMC free article] [PubMed] [Google Scholar]
- 8.Colvin KM et al. The Pel and Psl polysaccharides provide Pseudomonas aeruginosa structural redundancy within the biofilm matrix. Environ. Microbiol (2012). doi: 10.1111/j.1462-2920.2011.02657.x [DOI] [PMC free article] [PubMed] [Google Scholar]
- 9.Overhage J, Schemionek M, Webb JS & Rehm BHA Expression of the psl operon in Pseudomonas aeruginosa PAO1 biofilms: PslA performs an essential function in biofilm formation. Appl. Environ. Microbiol (2005). doi: 10.1128/AEM.71.8.4407-4413.2005 [DOI] [PMC free article] [PubMed] [Google Scholar]
- 10.Zhao K et al. Psl trails guide exploration and microcolony formation in Pseudomonas aeruginosa biofilms. Nature (2013). doi: 10.1038/nature12155 [DOI] [PMC free article] [PubMed] [Google Scholar]
- 11.Mishra M et al. Pseudomonas aeruginosa Psl polysaccharide reduces neutrophil phagocytosis and the oxidative response by limiting complement-mediated opsonization. Cell. Microbiol (2012). doi: 10.1111/j.1462-5822.2011.01704.x [DOI] [PMC free article] [PubMed] [Google Scholar]
- 12.Jennings LK et al. Pel is a cationic exopolysaccharide that cross-links extracellular DNA in the Pseudomonas aeruginosa biofilm matrix. Proc. Natl. Acad. Sci (2015). doi: 10.1073/pnas.1503058112 [DOI] [PMC free article] [PubMed] [Google Scholar]
- 13.Hay ID, Rehman ZU, Moradali MF, Wang Y & Rehm BHA Microbial alginate production, modification and its applications. Microbial Biotechnology (2013). doi: 10.1111/1751-7915.12076 [DOI] [PMC free article] [PubMed] [Google Scholar]
- 14.Hentzer M et al. Alginate overproduction affects Pseudomonas aeruginosa biofilm structure and function. J. Bacteriol (2001). doi: 10.1128/JB.183.18.5395-5401.2001 [DOI] [PMC free article] [PubMed] [Google Scholar]
- 15.Wilton M, Charron-Mazenod L, Moore R & Lewenza S Extracellular DNA acidifies biofilms and induces aminoglycoside resistance in Pseudomonas aeruginosa. Antimicrob. Agents Chemother (2016). doi: 10.1128/AAC.01650-15 [DOI] [PMC free article] [PubMed] [Google Scholar]
- 16.Kugadas A et al. Employing enzymatic treatment options for management of ocular biofilm-based infections. J. Leukoc. Biol https://do, (2019). [DOI] [PMC free article] [PubMed] [Google Scholar]
- 17.Kolozsvári L, Nógrádi A, Hopp B & Bor Z UV absorbance of the human cornea in the 240- to 400-nm range. Investig. Ophthalmol. Vis. Sci (2002). [PubMed]
- 18.Mayadas TN, Cullere X & Lowell CA The Multifaceted Functions of Neutrophils. Annu. Rev. Pathol. Mech. Dis (2014). doi: 10.1146/annurev-pathol-020712-164023 [DOI] [PMC free article] [PubMed] [Google Scholar]
- 19.Kragh KN et al. Polymorphonuclear leukocytes restrict growth of Pseudomonas aeruginosa in the lungs of cystic fibrosis patients. Infect. Immun (2014). doi: 10.1128/IAI.01969-14 [DOI] [PMC free article] [PubMed] [Google Scholar]
- 20.Tseng BS et al. A biofilm matrix-associated protease inhibitor protects Pseudomonas aeruginosa from proteolytic attack. MBio (2018). doi: 10.1128/mBio.00543-18 [DOI] [PMC free article] [PubMed] [Google Scholar]
- 21.Thanabalasuriar A et al. Neutrophil Extracellular Traps Confine Pseudomonas aeruginosa Ocular Biofilms and Restrict Brain Invasion. Cell Host Microbe (2019). doi: 10.1016/j.chom.2019.02.007 [DOI] [PMC free article] [PubMed] [Google Scholar]
- 22.Kugadas A et al. Impact of Microbiota on Resistance to Ocular Pseudomonas aeruginosa-Induced Keratitis. PLoS Pathog (2016). doi: 10.1371/journal.ppat.1005855 [DOI] [PMC free article] [PubMed] [Google Scholar]
- 23.Li S et al. How ocular surface microbiota debuts in type 2 diabetes mellitus. Front. Cell. Infect. Microbiol (2019). doi: 10.3389/fcimb.2019.00202 [DOI] [PMC free article] [PubMed] [Google Scholar]
- 24.Ozkan J et al. Biogeography of the human ocular microbiota. Ocul. Surf (2019). doi: 10.1016/j.jtos.2018.11.005 [DOI] [PubMed] [Google Scholar]
- 25.Ozkan J & Willcox MD The Ocular Microbiome: Molecular Characterisation of a Unique and Low Microbial Environment. Current Eye Research (2019). doi: 10.1080/02713683.2019.1570526 [DOI] [PubMed] [Google Scholar]
- 26.Cavuoto KM, Banerjee S, Miller D & Galor A Composition and comparison of the ocular surface microbiome in infants and older children. Transl. Vis. Sci. Technol (2018). doi: 10.1167/tvst.7.6.16 [DOI] [PMC free article] [PubMed] [Google Scholar]
- 27.Kugadas A, Wright Q, Geddes-McAlister J & Gadjeva M Role of microbiota in strengthening ocular mucosal barrier function through secretory IgA. Investig. Ophthalmol. Vis. Sci (2017). doi: 10.1167/iovs.17-22119 [DOI] [PMC free article] [PubMed] [Google Scholar]
- 28.Ahmad MT, Zhang P, Dufresne C, Ferrucci L & Semba RD The Human Eye Proteome Project: Updates on an Emerging Proteome. Proteomics (2018). doi: 10.1002/pmic.201700394 [DOI] [PMC free article] [PubMed] [Google Scholar]
- 29.Zhang P et al. The proteome of human retina. Proteomics (2015). doi: 10.1002/pmic.201400397 [DOI] [PMC free article] [PubMed] [Google Scholar]
- 30.Zhang P et al. The proteome of normal human retrobulbar optic nerve and sclera. Proteomics (2016). doi: 10.1002/pmic.201600229 [DOI] [PubMed] [Google Scholar]
- 31.Dammeier S et al. Combined targeted analysis of metabolites and proteins in tear fluid with regard to clinical applications. Transl. Vis. Sci. Technol (2018). doi: 10.1167/tvst.7.6.22 [DOI] [PMC free article] [PubMed] [Google Scholar]
- 32.Jung JH et al. Proteomic analysis of human lacrimal and tear fluid in dry eye disease. Sci. Rep (2017). doi: 10.1038/s41598-017-13817-y [DOI] [PMC free article] [PubMed] [Google Scholar]
- 33.Karring H, Thøgersen IB, Klintworth GK, Møller-Pedersen T & Enghild JJ A dataset of human cornea proteins identified by peptide mass fingerprinting and tandem mass spectrometry. Mol. Cell. Proteomics (2005). doi: 10.1074/mcp.D500003-MCP200 [DOI] [PubMed] [Google Scholar]
- 34.Soria J et al. Tear proteome analysis in ocular surface diseases using label-free LC-MS/MS and multiplexed-microarray biomarker validation. Sci. Rep (2017). doi: 10.1038/s41598-017-17536-2 [DOI] [PMC free article] [PubMed] [Google Scholar]
- 35.Parikh T et al. Proteomic analyses of corneal tissue subjected to alkali exposure. Investig. Ophthalmol. Vis. Sci (2011). doi: 10.1167/iovs.10-5472 [DOI] [PMC free article] [PubMed] [Google Scholar]
- 36.Kang GY et al. Exosomal proteins in the aqueous humor as novel biomarkers in patients with neovascular age-related macular degeneration. J. Proteome Res (2014). doi: 10.1021/pr400751k [DOI] [PubMed] [Google Scholar]
- 37.Bouhenni R, Dunmire J, Rowe T & Bates J Proteomics in the study of bacterial keratitis. Proteomes (2015). doi: 10.3390/proteomes3040496 [DOI] [PMC free article] [PubMed] [Google Scholar]
- 38.Sewell A, Dunmire J, Wehmann M, Rowe T & Bouhenni R Proteomic analysis of keratitis-associated Pseudomonas aeruginosa. Mol. Vis (2014). [PMC free article] [PubMed]
- 39.Khan S et al. The role of CXC chemokine receptor 2 in Pseudomonas aeruginosa corneal infection . J. Leukoc. Biol (2007). doi: 10.1189/jlb.0506344 [DOI] [PubMed] [Google Scholar]
- 40.Subbaraman LN et al. Influence of protein deposition on bacterial adhesion to contact lenses. Optom. Vis. Sci (2011). doi: 10.1097/OPX.0b013e31821ffccb [DOI] [PubMed] [Google Scholar]
- 41.DiGiandomenico A, Rao J & Goldberg JB Oral vaccination of BALB/c mice with Salmonella enterica serovar typhimurium expressing Pseudomonas aeruginosa O antigen promotes increased survival in an acute fatal pneumonia model. Infect. Immun (2004). doi: 10.1128/IAI.72.12.7012-7021.2004 [DOI] [PMC free article] [PubMed] [Google Scholar]
- 42.Zhu H, Thuruthyil SJ & Willcox M Invasive strains of Pseudomonas aeruginosa are able to cause epithelial cell cytotoxicity that is dependent on bacterial cell density in Clinical and Experimental Ophthalmology (2000). doi: 10.1046/j.1442-9071.2000.00289.x [DOI] [PubMed] [Google Scholar]
- 43.Preston MJ, Alev Gerçeker A, Koles NL, Pollack M & Pier GB Prophylactic and therapeutic efficacy of immunoglobulin G antibodies to Pseudomonas aeruginosa lipopolysaccharide against murine experimental corneal infection. Investig. Ophthalmol. Vis. Sci (1997). [PubMed]
- 44.Fleiszig SMJ et al. Epithelial cell polarity affects susceptibility to Pseudomonas aeruginosa invasion and cytotoxicity. Infect. Immun (1997). [DOI] [PMC free article] [PubMed]
- 45.Zaidi TS, Preston MJ & Pier GB Inhibition of bacterial adherence to host tissue does not markedly affect disease in the murine model of Pseudomonas aeruginosa corneal infection. Infect. Immun (1997). [DOI] [PMC free article] [PubMed]
- 46.Pandya HJ et al. Label-free electrical sensing of bacteria in eye wash samples: A step towards point-of-care detection of pathogens in patients with infectious keratitis. Biosens. Bioelectron (2017). doi: 10.1016/j.bios.2016.12.035 [DOI] [PMC free article] [PubMed] [Google Scholar]
- 47.Shan Q, Dwyer M, Rahman S & Gadjeva M Distinct Susceptibilities of Corneal Pseudomonas aeruginosa Clinical Isolates to Neutrophil Extracellular Trap-Mediated Immunity. Infect. Immun (2014). doi: 10.1128/iai.02169-14 [DOI] [PMC free article] [PubMed] [Google Scholar]
- 48.Vijay AK et al. Bacterial adhesion to unworn and worn silicone hydrogel lenses. Optom. Vis. Sci (2012). doi: 10.1097/OPX.0b013e318264f4dc [DOI] [PubMed] [Google Scholar]
- 49.Preston MJ et al. Rapid and sensitive method for evaluating Pseudomonas aeruginosa virulence factors during corneal infections in mice. Infect. Immun (1995). [DOI] [PMC free article] [PubMed]
- 50.Gadjeva M, Nagashima J, Zaidi T, Mitchell RA & Pier GB Inhibition of macrophage migration inhibitory factor ameliorates ocular Pseudomonas aeruginosa-induced keratitis. PLoS Pathog (2010). doi: 10.1371/journal.ppat.1000826 [DOI] [PMC free article] [PubMed] [Google Scholar]
- 51.Geddes-McAlister J & Gadjeva M Mass spectromerty-based quantitative proteomics of murine-derived polymorphonuclear neutrophils. Curr. Protoc. Immunol In Press, (2019). [DOI] [PMC free article] [PubMed]
- 52.Rappsilber J, Mann M & Ishihama Y Protocol for micro-purification, enrichment, pre-fractionation and storage of peptides for proteomics using StageTips. Nat. Protoc 2, 1896–1906 (2007). [DOI] [PubMed] [Google Scholar]
- 53.Geddes JMH et al. Analysis of the protein kinase a-regulated proteome of Cryptococcus neoformans identifies a role for the ubiquitin-proteasome pathway in capsule formation. MBio 7, 1–15 (2016). [DOI] [PMC free article] [PubMed] [Google Scholar]
- 54.Cox J & Mann M MaxQuant enables high peptide identification rates, individualized p.p.b.-range mass accuracies and proteome-wide protein quantification. Nat. Biotechnol 26, 1367–1372 (2008). [DOI] [PubMed] [Google Scholar]
- 55.Cox J et al. Andromeda: A peptide search engine integrated into the MaxQuant environment. J. Proteome Res (2011). doi: 10.1021/pr101065j [DOI] [PubMed] [Google Scholar]
- 56.Cox J et al. Accurate Proteome-wide Label-free Quantification by Delayed Normalization and Maximal Peptide Ratio Extraction, Termed MaxLFQ. Mol. Cell. Proteomics 13, 2513–2526 (2014). [DOI] [PMC free article] [PubMed] [Google Scholar]
- 57.Grassl N et al. Ultra-deep and quantitative saliva proteome reveals dynamics of the oral microbiome. Genome Med 8, 1–13 (2016). [DOI] [PMC free article] [PubMed] [Google Scholar]
- 58.Tyanova S et al. The Perseus computational platform for comprehensive analysis of (prote)omics data. Nature Methods 13, 731–740 (2016). [DOI] [PubMed] [Google Scholar]
- 59.Cox J & Mann M 1D and 2D annotation enrichment: a statistical method integrating quantitative proteomics with complementary high-throughput data. BMC Bioinformatics (2012). doi: 10.1186/1471-2105-13-S16-S12 [DOI] [PMC free article] [PubMed] [Google Scholar]
- 60.R Foundation for Statistical Computing. R: a Language and Environment for Statistical Computing http://www.R-project.org/ (2018).
- 61.Szklarczyk D et al. STRING v11: Protein-protein association networks with increased coverage, supporting functional discovery in genome-wide experimental datasets. Nucleic Acids Res (2019). doi: 10.1093/nar/gky1131 [DOI] [PMC free article] [PubMed] [Google Scholar]
- 62.Fabregat A et al. The Reactome Pathway Knowledgebase. Nucleic Acids Res (2018). doi: 10.1093/nar/gkx1132 [DOI] [PMC free article] [PubMed] [Google Scholar]
- 63.Kanehisa M & Sato Y KEGG Mapper for inferring cellular functions from protein sequences. Protein Sci (2019). doi: 10.1002/pro.3711 [DOI] [PMC free article] [PubMed] [Google Scholar]
- 64.Suzuki K, Ota H, Sasagawa S, Sakatani T & Fujikura T Assay method for myeloperoxidase in human polymorphonuclear leukocytes. Anal. Biochem (1983). doi: 10.1016/0003-2697(83)90019-2 [DOI] [PubMed] [Google Scholar]
- 65.Sack R et al. Protein array characterization of bioactive proteins secreted by immortalized human corneal epithelium in response to Pseudomonas constituents. Curr. Eye Res (2009). doi: 10.1080/02713680802539869 [DOI] [PubMed] [Google Scholar]
- 66.Park AJ et al. A Temporal Examination of the Planktonic and Biofilm Proteome of Whole Cell Pseudomonas aeruginosa PAO1 Using Quantitative Mass Spectrometry. Mol. Cell. Proteomics (2014). doi: 10.1074/mcp.M113.033985 [DOI] [PMC free article] [PubMed] [Google Scholar]
- 67.Couto N, Schooling SR, Dutcher JR & Barber J Proteome Profiles of Outer Membrane Vesicles and Extracellular Matrix of Pseudomonas aeruginosa Biofilms. J. Proteome Res (2015). doi: 10.1021/acs.jproteome.5b00312 [DOI] [PubMed] [Google Scholar]
- 68.Poulsen ET et al. Proteomic profiling of TGFBI-null mouse corneas reveals only minor changes in matrix composition supportive of TGFBI knockdown as therapy against TGFBI-linked corneal dystrophies. FEBS J (2018). doi: 10.1111/febs.14321 [DOI] [PMC free article] [PubMed] [Google Scholar]
- 69.Shao HJ et al. Proteome profiling of wild type and lumican-deficient mouse corneas. J. Proteomics (2011). doi: 10.1016/j.jprot.2011.04.032 [DOI] [PMC free article] [PubMed] [Google Scholar]
- 70.Shen M et al. Quantitative proteomic analysis of mice corneal tissues reveals angiogenesis-related proteins involved in corneal neovascularization. Biochim. Biophys. Acta - Proteins Proteomics (2016). doi: 10.1016/j.bbapap.2016.04.001 [DOI] [PubMed] [Google Scholar]
- 71.Hume EBH et al. A Staphylococcus aureus mouse keratitis topical infection model: Cytokine balance in different strains of mice. Immunol. Cell Biol (2005). doi: 10.1111/j.1440-1711.2005.01326.x [DOI] [PubMed] [Google Scholar]
- 72.Green SN et al. Protection from Streptococcus pneumoniae keratitis by passive immunization with pneumolysin antiserum. Investig. Ophthalmol. Vis. Sci (2008). doi: 10.1167/iovs.07-0492 [DOI] [PMC free article] [PubMed] [Google Scholar]
- 73.Skaar EP The battle for iron between bacterial pathogens and their vertebrate hosts. PLoS Pathog (2010). doi: 10.1371/journal.ppat.1000949 [DOI] [PMC free article] [PubMed] [Google Scholar]
- 74.Andrews SC, Robinson AK & Rodríguez-Quiñones F Bacterial iron homeostasis. FEMS Microbiology Reviews (2003). doi: 10.1016/S0168-6445(03)00055-X [DOI] [PubMed] [Google Scholar]
- 75.Golonka R, Yeoh BS & Vijay-Kumar M The Iron Tug-of-War between Bacterial Siderophores and Innate Immunity. Journal of Innate Immunity (2019). doi: 10.1159/000494627 [DOI] [PMC free article] [PubMed] [Google Scholar]
- 76.Weinberg ED Nutritional Immunity: Host’s Attempt to Withhold Iron From Microbial Invaders. JAMA J. Am. Med. Assoc (1975). doi: 10.1001/jama.1975.03240130021018 [DOI] [PubMed] [Google Scholar]
- 77.Ganz T & Nemeth E Iron homeostasis in host defence and inflammation. Nature Reviews Immunology (2015). doi: 10.1038/nri3863 [DOI] [PMC free article] [PubMed] [Google Scholar]
- 78.Holmes MA, Paulsene W, Jide X, Ratledge C & Strong RK Siderocalin (Lcn 2) also binds carboxymycobactins, potentially defending against mycobacterial infections through iron sequestration. Structure (2005). doi: 10.1016/j.str.2004.10.009 [DOI] [PubMed] [Google Scholar]
- 79.Geyer PE et al. Plasma Proteome Profiling to Assess Human Health and Disease. Cell Syst 2, 185–195 (2016). [DOI] [PubMed] [Google Scholar]
- 80.Doll S, Gnad F & Mann M The Case for Proteomics and Phospho-Proteomics in Personalized Cancer Medicine. Proteomics - Clinical Applications (2019). doi: 10.1002/prca.201800113 [DOI] [PMC free article] [PubMed] [Google Scholar]
- 81.Yeats C & Bateman A The BON domain: A putative membrane-binding domain. Trends in Biochemical Sciences (2003). doi: 10.1016/S0968-0004(03)00115-4 [DOI] [PubMed] [Google Scholar]
- 82.Teriete P et al. Mycobacterium tuberculosis Rv0899 Adopts a Mixed α/β-Structure and Does Not Form a Transmembrane β-Barrel. Biochemistry (2010). doi: 10.1021/bi100158s [DOI] [PMC free article] [PubMed] [Google Scholar]
- 83.Bos MP, Grijpstra J, Tommassen-Van Boxtel R & Tommassen J Involvement of Neisseria meningitidis lipoprotein GNA2091 in the assembly of a subset of outer membrane proteins. J. Biol. Chem (2014). doi: 10.1074/jbc.M113.539510 [DOI] [PMC free article] [PubMed] [Google Scholar]
- 84.Baumann U, Mansouri E & Von Specht BU Recombinant OprF-OprI as a vaccine against Pseudomonas aeruginosa infections. in Vaccine (2004). doi: 10.1016/j.vaccine.2003.11.029 [DOI] [PubMed] [Google Scholar]
- 85.Straatsma TP & Soares TA Characterization of the outer membrane protein OprF of Pseudomonas aeruginosa in a lipopolysaccharide membrane by computer simulation. Proteins Struct. Funct. Bioinforma (2009). doi: 10.1002/prot.22165 [DOI] [PMC free article] [PubMed] [Google Scholar]
- 86.Mishra M, Ressler A, Schlesinger LS & Wozniak DJ Identification of OprF as a complement component C3 binding acceptor molecule on the surface of Pseudomonas aeruginosa. Infect. Immun (2015). doi: 10.1128/IAI.00081-15 [DOI] [PMC free article] [PubMed] [Google Scholar]
Associated Data
This section collects any data citations, data availability statements, or supplementary materials included in this article.
Supplementary Materials
Supplemental Table 1: Significantly different proteins in comparison of infected vs. control eye wash samples.
Supplemental Table 2: Significantly different proteins in comparison of infected vs. counter lateral eye wash samples.
Supplemental Table 3: General host response proteins identified in eye wash samples.
Supplemental Table 4: Site-specific host response proteins identified in eye wash samples.
Supplemental Table 5: Significantly different proteins in comparison of infected vs. control cornea samples.
Supplemental Table 7: General host response proteins identified in cornea samples.
Supplemental Table 6: Significantly different proteins in comparison of infected vs. counter lateral cornea samples.
Supplemental Table 8: Site-specific host response proteins identified in cornea samples.
Supplemental Table 9: Neutrophil associated proteins in eye wash.
Supplemental Table 10: Neutrophil associated proteins in cornea.
Supplemental Table 11: Eye wash unique proteins upon comparison to cornea total proteome.