

Abstract
Objective:
To identify the magnitude and distribution of ventilation defect score derived from hyperpolarized (HP) 129Xe magnetic resonance imaging (MRI) associated with clinically relevant airway obstruction.
Material and Methods:
Our retrospective, HIPAA compliant study was approved by our IRB with written informed consent. From 2012 to 2015, 76 subjects underwent HP 129Xe MRI (healthy volunteers, n=48 [mean age 54 ± 17 years]; asthma patients, n=20 [mean age 44 ± 20 years]; COPD patients, n=8 [mean age 67 ± 5 years]). All subjects underwent spirometry one day prior to MRI to establish the presence of airway obstruction (FEV1/FVC<70%). Five blinded readers assessed the degree of ventilation impairment and assigned a ventilation defect score (VDS, 0-100%). Inter-reader agreement was assessed by using the Fleiss’ kappa statistic. Using FEV1/FVC as the reference standard, the optimum VDS threshold for detection of airway obstruction was estimated using receiver operating characteristics (ROC) analysis with 10-fold cross validation.
Results:
Compared to healthy subjects, VDS was significantly higher in patients with airway obstruction (P< 0.0001) and significantly correlated with disease severity (r= 0.66, P < 0.0001). Ventilation defects in subjects with airway obstruction did not show location-specific pattern (P= 0.158); however, defects in healthy controls were more prevalent in the upper lungs (P= 0.014). ROC analysis yielded an optimal threshold of 12.4±6.1% for clinically significant VDS, corresponding to a threshold of 7.6±3.7% for ventilation defect percentage (VDP). The inter-reader agreement for 129Xe MRI was substantial (κ=0.71).
Conclusion:
In this multireader study of a diverse cohort of airway obstructed patients, it enabled establishing a threshold for clinically significant ventilation defects detected on HP 129Xe ventilation MRI.
Introduction
Hyperpolarized (HP) 129Xe magnetic resonance imaging (MRI) is emerging as promising tool to depict regional lung physiology (1). In particular, 129Xe ventilation imaging has been thoroughly investigated to augment traditional pulmonary function tests that are incapable of detecting regional heterogeneity of pulmonary impairment (2–4). HP 129Xe MRI has been evaluated in patients across a broad spectrum of airway obstructing conditions, and has been found to correlate significantly with pulmonary function tests. Consequently, HP 129Xe MRI is starting to be recognized as a valuable tool to assess regional ventilation heterogeneity.
The primary feature from 129Xe MRI that is being increasingly used to quantify pulmonary ventilation distribution is the ventilation defect (VD), defined as a region of the lung where distribution of inhaled gas density falls below a certain threshold. Ventilation defects are rated by readers using a ventilation defect score (VDS) or semi-automated calculated by a ventilation defect percentage (VDP), both describing the absence of gas in a lung segment due to airway obstruction (2). More recently introduced semi-automated methods allow to futher quantify areas with either reduced or enhanced ventilation (3).
In addition to its ability to characterize ventilation heterogeneity, a major advantage of HP 129Xe MRI compared to pulmonary function tests is its high sensitivity and high degree of reproducibility (4), allowing a robust and reliable identification of subtle airway obstruction (3). However, while 129Xe MRI is commonly interpreted by use of quantitative indices such as VDS and VDP, thus far there are no data to support whether and to what extent the measured values of VDS or VDP are actually clinically significant. This is an increasingly important question to address as the high spatial resolution and singal-to-noise ratio (SNR) of 129Xe MRI results in the detection of very sutble venticlation defects; even in healty volunteers with no history of lung disease exhibiting some degree of ventilation defects (5).
The current definition of clinically relevant obstruction based on spirometry is FEV1/FVC < 0.7 (6). While this value is well established across large populations, there can be significant ambiguity in individual patients. There are numerous examples of subjects with ratios less than 0.7 exhibiting few ventilation defects, and even more subjects with ratios >0.7, who still show quite substantial defects on V/Q scans. Thus, while FEV1/FVC is an imperfect gold standard, when used across a large sample of subjects and combined with estimates of inter-reader agreement, it can be used to establish a threshold for clinically significant ventilation defects on the less effort-dependent and more reproducible 129Xe MRI ventilation scans.
We sought to establish such a threshold by conducting an ROC analysis using FEV1 and FEV1/FVC as our reference standard for airway obstruction. Moreover, to further refine this threshold, we conducted a multi-reader study with 10-fold cross validation. Although computer algorithms are emerging to quantify 129Xe MRI, those must ultimately be validated by expert readers. Thus, herein we establish and test a framework for reader-based evaluation of HP 129Xe MRI images and with this test the inter-reader variability in determing VDS assigned by experts and refine thereafter the VDS threshold for clinically significant airway obstruction. Moreover, in an attempt to demonstrate the utility of the spatially resolved information provided by HP 129Xe MRI, we we further seek to identify emerging spatial patterns of obstruction.
The purpose of our study was to determine in a multi-reader study whether 129Xe MRI is able to reliably identify clinically significant airway obstruction using established pulmonary function tests as reference standard.
Materials and Methods
Study Design
This case-control study was approved by our IRB and is in compliance with HIPAA regulations. The trial was retrospectively conducted at a single, tertiary care center. Written, informed consent from all individuals was obtained prior to MR imaging. The local database was searched for suitable subjects starting from January 2012 to January 2015. The final study population consisted of 76 individuals. The methods used in this study are in accordance with the Standards of Reporting of Diagnostic Accuracy studies guidelines (12).
Eligibility Criteria
The clinical patient database at our institution was searched for individuals who had undergone HP 129Xe MR ventilation imaging, and seventy-six eligible patients were identified. This cohort comprised 48 healthy subjects, 8 patients with COPD, and 20 patients with chronic asthma. The following inclusion criteria were applied to the study population: 1) Lung function tests conducted and results recorded within one day of MRI; 2) No signs of exacerbation of respiratory symptoms between pulmonary function testing and the time of HP 129Xe MRI; 3) In cases of asthma or COPD, clinically confirmed diagnosis based on guidelines of the U.S. National Asthma Education and Prevention Program [NAEPP (13)] and the GOLD initiative criteria; 4) MR imaging protocol was completed with diagnostic image quality.
HP 129Xe MRI (Index test)
Isotopically enriched 129Xe gas (83% 129Xe, Linde Electronics and Specialty Gases, Alpha, NJ, USA) was polarized to 6-25% using a commercial polarizer (Model 9800; Po-larean Inc., Durham, NC, USA) (14) and cryogenically accumulated. It was then dispensed in 0.5-1L volumes into a Tedlar bag (Jensen Inert Products, Coral Springs, Florida, USA) and brought up to a total volume of one liter using N2 buffer gas. The polarization of the dispensed gas was measured using a dedicated polarization measurement station (Polarean 2881 Polarization Measurement Station, Durham, NC), prior to administration of the gas mixture to the test subjects.
MRI was performed with patients in the supine position. All subjects were coached to inhale polarized 129Xe from functional residual capacity (FRC) prior to the image acquisition to optimize subject compliance. The HP 129Xe gas mixture was delivered with the patient remaining in the supine position within the scanner bore. Heart rate, blood pressure and breathing frequency were continuously monitored over the course of the exam.
All MR scans were performed on a 1.5 T GE Healthcare EXCITE 15M4 MR system. The subjects were fitted with a flexible chest coil (Clinical MR solutions, Brookfield, Wi) that was tuned to the 17.66 MHz 129Xe frequency. The chest coil was further proton-blocked to permit anatomical scans to be acquired using the 1H body coil. After the initial 1H localizers scans, the subjects underwent HP 129Xe ventilation MRI. These images were acquired during a 10–14-s breath-hold, with slices recorded in the anterior-to-posterior direction using a spoiled gradient recalled echo (SPGRE) sequence (FOV = 40×28-40 cm2, matrix = 128×90-128, 12.5-15-mm slices, TR/TE = 7.9/1.9 ms, α = 5–7°, BW = 8.0 kHz).
Image Interpretation and Ventilation Defect Scores (VDS)
The reconstructed ventilation images were transferred to a central database accessible to readers. Five independent radiologists, blinded to the pulmonary function testing results and clinical diagnosis, assessed the HP 129Xe ventilation maps on a workstation equipped with an open-access thin-client (Osirix, version 7.5, Bernex, Switzerland). Four of the readers were trained chest radiologists with at least 5 years of expertise in the field. One reader was a fellow with 3 years of experience in chest imaging. Prior to the reading session, each reader received an individual tutorial on how to score the HP 129Xe ventilation images by using a separate training data set consisting of two healthy patients and four cases of airway obstruction. Airway obstruction was defined as the absence of HP 129Xe MR signal within the lung parenchyma, which was considered a ventilation defect.
To quantify the degree of ventilation impairment, we used a modified lung zone model, previously established in nuclear medicine ventilation studies using 133Xe (14). Each lung was divided in upper, mid and lower lung zones. The upper lung zone was bordered by a horizontal border drawn at the level of the bronchus intermedius. The mid lung zone was outlined by a horizontal line at the level of the bronchus intermedius cra-nially and by a horizontal line through the lower lobe main stem bronchus caudally. The lower lung zone was defined as the parenchyma below this line (Figure 1). Additionally, each lung was also divided in a central and peripheral zone by a vertical line separating the peripheral third of the lung from the central two thirds. Therefore, 12 lung zones per patient were scored by each reader for ventilation impairment as follows: 0= no defects; 1= 0–25%; 2= 25–50%; 3= 50–75%; 4= 75–100% (10). Scores were averaged for all regions to determine the cumulative ventilation impairment, and also averaged over each region to determine primary location (upper-, mid-, lower zone; central versus peripheral). These averaged scores were expressed as a percentage of total ventilation impairment and referred to as the ventilation defect score (VDS, 0-100%).
Figure 1.
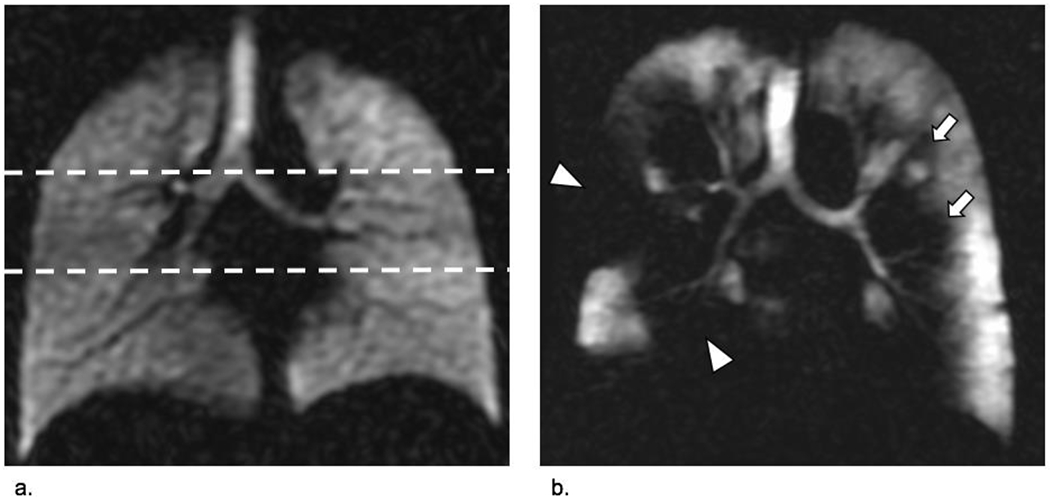
HP 129Xe MRI, coronal view at the level of the carina. A ventilation scan of a healthy lung without airway obstruction is provided in image (a.). Lung function tests in this case were normal (FEV1 83; FEV1/FVC 75). The dashed lines indicate the way in which readers differentiated the upper-, mid-, and lower lung zones. Image (b.) shows a ventilation scan of a patient with COPD (73-year-old smoker). Extensive ventilation defects are found in both lungs. Peripheral defects (arrow heads) as well as more centrally located ventilation defects (arrows) are equally present. Spirometry confirmed severe airway obstruction in this patient (FEV1 35%; FEV/FVC 39%).
Reference Standard for the Diagnosis of Airway Obstruction
A combination of FEV1 and FEV1/FVC was used as the reference standard that defined clinically relevant obstruction (15). The rationale for choosing this approach was that asthma and COPD guidelines use a combination of both metrics to quantify ventilation status and consequently airway obstruction. All enrolled subjects had undergone spirometry (forced expiratory volume in 1 second= FEV1; forced vital capacity= FVC; FEV1/FVC) performed according to ATS guidelines with Vmax Autobox (CareFusion, San Diego, CA) (16). For each case, the reported FEV1 and FVC were the highest of three technically satisfactory maneuvers. In accordance with the GOLD initiative guidelines and the NAEPP criteria (15,16), an FEV1/FVC less than 70% was considered positive for clinically relevant airway obstruction. We further stratified airway obstruction into mild (FEV1/FVC < 70%; FEV1≥ 80%); moderate (FEV1/FVC < 70%; FEV1 50-79%); and severe (FEV1/FVC < 70%; FEV1 < 50%).
Statistical Analysis
The correlation of VDS with FEV1 and FEV1/FVC was assessed using the Pearson’s correlation coefficient. Comparison of VDS between healthy controls and subjects with airway obstruction was conducted using f-tests for single comparisons, and one-way ANOVA with post-hoc Tukey-Kramer tests for multiple comparisons. VDS was compared between different regions of the lungs using repeated measures ANOVA and post-hoc paired t-tests. Correlation of VDS with disease severity was assessed using the Spearman’s correlation coefficient. For the index test, an optimum threshold for ventilation impairment was determined using receiver operating characteristics (ROC) analysis with 10-fold cross validation. The optimum threshold corresponded to the point on the ROC curve at which the Youden’s index (J = sensitivity + specificity − 1) was maximum. Subsequently, sensitivity, specificity, and accuracy were measured at the optimum threshold. ROC analysis was done for each rater separately, and a cumulative VDS threshold was then determined by averaging the thresholds obtained from all readers.
The inter-observer agreement for the detection of ventilation defects was determined using the Fleiss’ kappa statistic (κ). For this analysis, the VDS from each reader was assigned to one of two categories based on the cumulative threshold determined. The levels of inter-observer agreement were defined as follows: κ= 0-0.20, slight; κ= 0.21 - 0.40, fair; κ= 0.41-0.60, moderate; κ= 0.61-0.80, substantial; and κ= 0.81-1.00, almost perfect agreement.
Statistical analysis was performed with MedCalc (version 14.8.1; MedCalc Software, Mariakerke, Belgium) and JMP Pro (version 13.1.0; SAS Institute Inc., Cary, USA). P values were two sided, and P < 0.05 was considered indicative of a statistically significant difference.
Results
Participant Characteristics
The subject selection and classification of study participants is displayed in Figure 2. After applying the inclusion criteria, 55 subjects remained in the study cohort; 21 subjects had to be excluded because FEV1 and FVC had not been obtained. Among the 55 remaining subjects, 28 were classified as having asthma or COPD based on their clinical diagnosis, and 27 were categorized as healthy controls. Spirometric assessment reclassified 10 asthma patients as healthy showing FEV1 and FEV1/FVC within normal range. Therefore, no clinically significant airway obstruction in these patients was present at the time of lung function assessment. In contrast, spirometry also reclassified nine older healthy subjects as having mild (n=8) or moderate (n=1) airway obstruction. This resulted in a total of 27 patients with airway obstruction confirmed on spirometry, and 28 individuals with normal spirometry test results (Figure 3).
Figure 2.
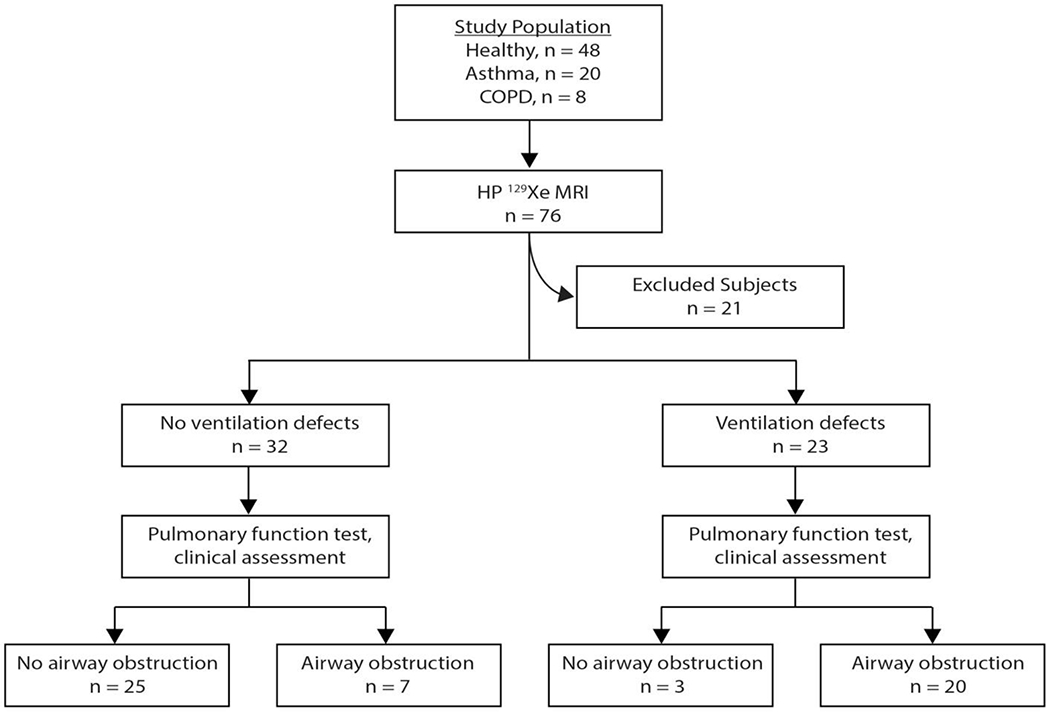
The diagnostic accuracy of HP 129Xe MR imaging is shown in the flowchart.
Figure 3.

Classification of individuals by using the reference standard (FEV1;FEV1/FVC).
The baseline demographic and clinical characteristics of all study participants are summarized in Table 1. The patient population consisted of 23 men (mean age of 53 ± 19 years) and 32 women (51 ± 18 years). Patients diagnosed with airway obstruction were significantly older (P= .02).
Table 1.
Patient characteristics.
| Airway obstruction |
No airway obstruction | |||
|---|---|---|---|---|
| Characteristic | Mild (n=12) | Moderate (n=14) | Severe (n=1) | (n=28) |
| Age (y) | 47 ± 20 | 57 ± 17 | 73 | 47 ± 20 |
| Cause of obstruction | ||||
| Asthma (n=20) | 4 | 6 | 0 | 10 |
| COPD (n=8) | 0 | 7 | 1 | 0 |
| Spirometry | ||||
| FEV1% | 94 ± 8 | 63 ± 9 | 35 | 97± 13 |
| FEV1/FVC | 0.66 ± 0.03 | 0.59 ± 0.09 | 0.39 | 0.76± 0.05 |
Values are expressed as mean ± one standard deviation
Ventilation Defect Score and Disease Status
Unless stated otherwise, the reported VDS represents an average across all readers. VDS correlated moderately with FEV1 (r = 0.55, P < 0.0001), and strongly with FEV1/FVC (r = 0.79, P < 0.0001). VDS was significantly lower in the healthy group (5.7 ± 6.1%) than in patients with airway obstruction (24.1 ± 18.9 %; P < 0.0001). Within the airway obstruction group, VDS in mild obstruction (n = 12) was 13.9 ± 10.7%; in moderate airway obstruction (n = 14) was 30.2 ± 19.5%; and was 60% in one patient with severe obstructive disease (Table 2). The VDS detected in healthy subjects versus patients with mild obstruction was not statistically significantly different (P = 0.15). However, it was significantly higher in patients with moderate to severe obstruction (P < 0.0001), who also exhibited a VDS that was significantly higher than in patients with mild obstruction (P = 0.0011) (Figure 4).
Table 2.
Ventilation defect scores (VDS, 0-100%) and disease status.
| Reader 1 | Reader 2 | Reader 3 | Reader 4 | Reader 5 | Average | |
|---|---|---|---|---|---|---|
| Healthy | 3.0±3.8 | 5.4±7.7 | 10.0±13.2 | 6.7±7.3 | 3.5±5.4 | 5.7±6.1 |
| Mild * | 8.2±7.1 | 14.9±14.3 | 25.4±20.9 | 10.4±10.6 | 10.6±8.6 | 13.9±10.7 |
| Moderate * | 31.7±24.9 | 33.8±19.4 | 30.5±23.0 | 27.1±17.5 | 28.0±24.5 | 30.2±19.5 |
| Severe * | 47.9 | 75.0 | 89.6 | 35.4 | 52.1 | 60 |
Values are expressed as mean ± one standard deviation
Asthma status
Figure 4.
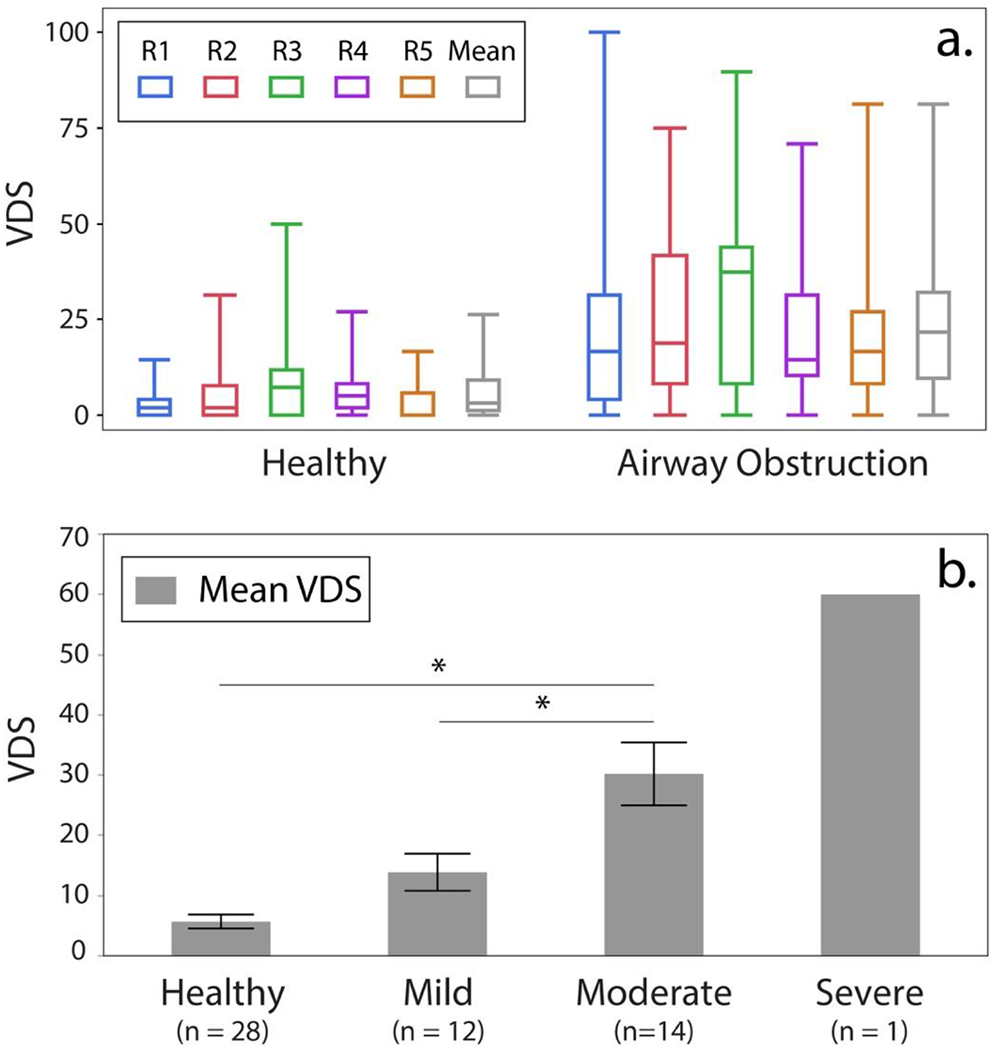
Individual and mean VDS for healthy subjects and patients with airway obstruction are depicted in (a.) R= Reader. The mean VDS for each group is provided in (b.). (*= significant difference).
The Optimum Threshold for Ventilation Defect Score
Figure 5 shows representative ROC curves for VDS from all readers and corresponding area under the curve (AUC). The optimum threshold for VDS, and corresponding measures of sensitivity, specificity, and accuracy were averaged over all iterations of the 10-fold cross validation analysis and are reported in Table 3. The mean threshold across all raters was 12.4±6.1%. At this threshold, mean VDS identified 3 healthy individuals as false positives (5%) and 7 subjects with airway obstruction were categorized as false negatives (13%). Representative false positive and false negative cases are shown in Figure 6.
Figure 5.
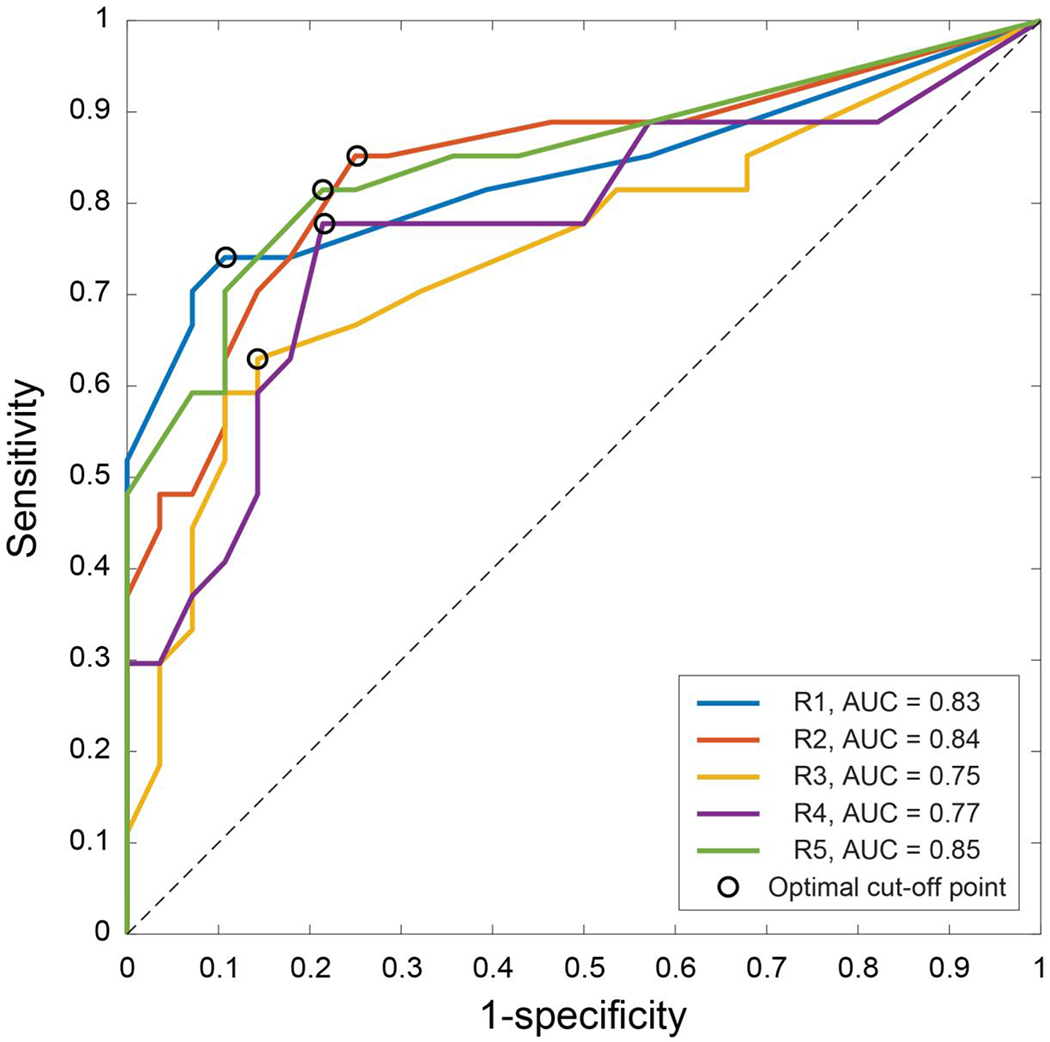
ROC curves for 129Xe MR ventilation defect scores.
Table 3.
Optimum threshold, AUC, sensitivity, specificity, and accuracy from ROC analysis with 10-fnld r.rnss validation
| Threshold | AUC | Youden’s Index, J1 | Sensitivity2 | Specificity3 | Accuracy4 | |
|---|---|---|---|---|---|---|
| Reader 1 | 9.3±1.0% | 0.83±0.0 | 0.63±0.03 | 73±33% | 93±17% | 83±18% |
| Reader 2 | 8.9±1.7% | 0.84±0.0 | 0.59±0.03 | 76±33% | 84±24% | 80±18% |
| Reader 3 | 23.3±6.2% | 0.75±0.0 | 0.49±0.04 | 57±36% | 84 ±2 5% | 72 ±21% |
| Reader 4 | 10.4±0.0% | 0.77±0.0 | 0.56±0.04 | 67±35% | 83±25% | 74±19% |
| Reader 5 | 10.2±1.6% | 0.85±0.0 | 0.61 ±0.03 | 72±34% | 89±21% | 80±19% |
Values are calculated from 100 iterations of 10-fold cross validation analysis and expressed as mean ± one standard deviation
Younden’s Index, J = max (sensitivity + specificity − 1)
Figure 6.

Representative false positive and false negative findings: Panel (a.) shows a false positive case. This healthy older subject (FEV1/FVC= 0.72) showed ventilation defects in 129Xe MRI (mean VDS= 26.3±14.8%).
Panel (b) shows a young asthmatic patient (FEV1/FVC= 0.66), classified as false negative; mean VDS= 2.1±2.9%;. Another false negative finding is depicted on panel (c). This older asthmatic patient (FEV1/FVC= 0.68) was categorized as healthy by readers (VDS= 0%).
Ventilation Defect Pattern Analysis
VDS from different regions in the lungs was compared in healthy subjects and subjects with airway obstruction to identify any differences in 129Xe gas distribution between these groups. As seen in Figure 7, in cases of airway obstruction, ventilation defects in the upper-, mid-, and lower zones were not significantly different (P = 0.158). In the healthy subjects, ventilation defects exhibited a significant cranio-caudal gradient (P = 0.014). Post-hoc analysis showed that this difference was attributed to the detection of significantly more ventilation defects in the upper versus middle (P = 0.0042) and lower (P = 0.0770) lung zones. The prevalence of ventilation defects in the upper lung zones depended significantly on subject age (r = 0.66, P < 0.0001). This correlation with age was stronger than that observed in all of the other lung zones. For all groups, peripheral ventilation defects were more prevalent than central ones (healthy subjects, P < 0.0001; airway obstruction P < 0.0001).
Figure 7.
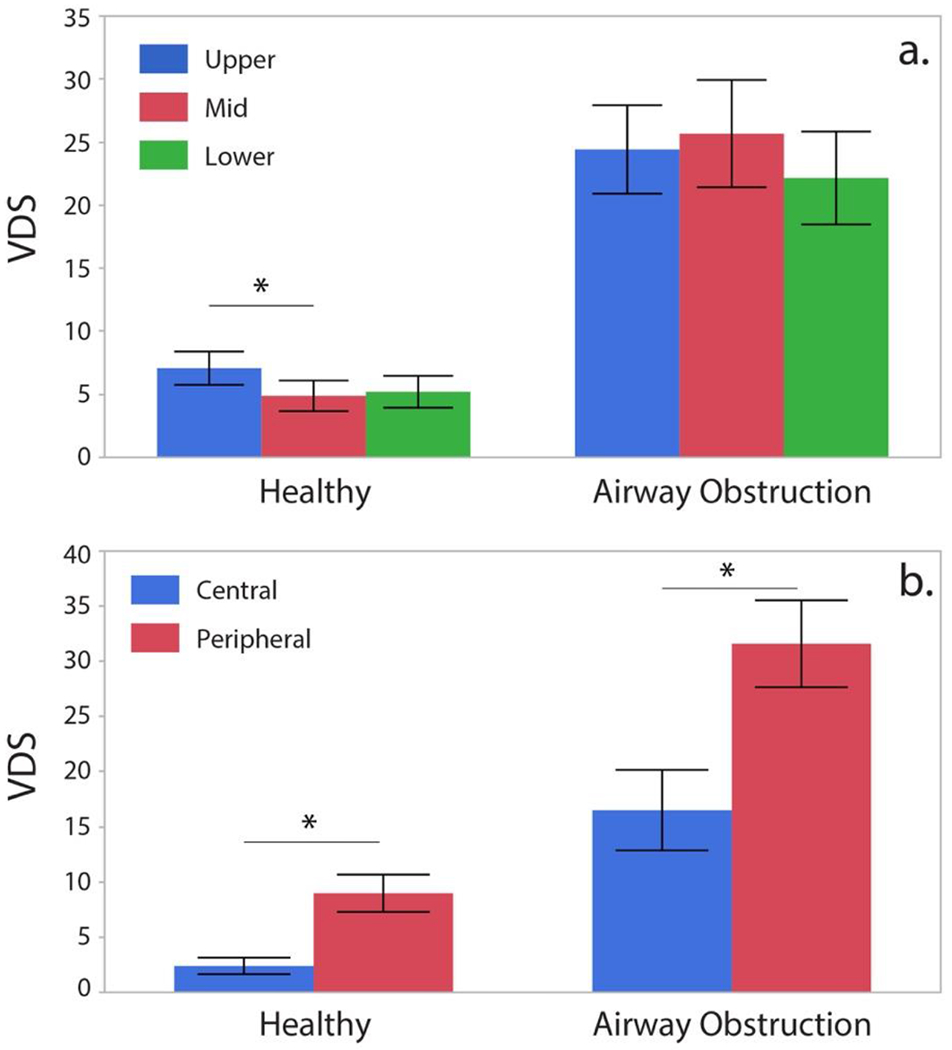
Zonal ventilation distribution in healthy controls and patients with airway obstruction (*= significant difference).
Inter-reader Agreement
Inter-reader agreement for whole-lung VDS for the entire cohort was substantial (κ = 0.71). When agreement was separately examined within the healthy and airway obstruction groups, it was found to be almost perfect (healthy: = 0.83, airway obstruction: = 0.84).
Inter-reader agreement was further evaluated within the five lung zones: upper, mid, lower, central and peripheral. For the upper and lower lungs, it was moderate (κ = 0.57 and κ = 0.56, respectively), whereas in the mid lung it was substantial (κ= 0.68). In central zones, agreement was moderate (κ= 0.44), whereas in the lung periphery it was substantial (κ= 0.67).
Discussion
Our data shows that VDS measured with HP129Xe MR imaging correlates with the severity of airway obstruction, and is significantly different between healthy control subjects and patients with mild as well as moderate airway obstruction. This reflects the potential of HP 129Xe MR to capture disease severity. However, our patient cohort only included one COPD patient with severe airway obstruction according to GOLD initiative criteria (FEV1% = 35, FEV1/FVC = 39). Thus, the results in this category cannot be generalized. Probably the most interesting cases in this study were the “false” positives and negatives who either exhibited more homogeneous or heterogeneous ventilation than would be expected based on FEV1/FVC. To the extent that regional ventilation with HP 129Xe MRI is more repeatable and less effort-dependent, this discrepancy could ultimately speak to the higher sensitivity of MRI compared to PFTs. This could ultimately be proven by demonstrating cases where defects detected on 129Xe MRI but not PFTs respond to therapy.
For this study cohort, the inter-reader agreement for ventilation defects in each patient was found to be substantial (κ = 0.71). This finding reflects the robustness of readers estimating VDS from 129Xe ventilation scans. To the best of our knowledge, reader-derived VDS has not been validated systematically in the literature yet. This validation is important because although computer algorithms for 129Xe MRI analysis are emerging, they must ultimately be validated by human readers. Thus, our results provide a framework of reader-based VDS classification. In comparing VDS to ventilation defect percentage (VDP) derived by our 6-bin computer based analysis, we find that the ratio VDS to VDP equals 1.64. This means, that with this scaling, the clinically relevant threshold for VDP would be 7.6±3.7%. However, work remains to be done to reconcile the various approaches for calculating VDP that have been presented in the literature (3, 17, 18)
Since the ultimate utility of HP 129Xe MRI is that it also provides spatially resolved information, we investigated spatial patterns of obstruction. An analysis of the ventilation defect patterns in asthma and COPD patients yielded a significantly higher prevalence of defects in the subpleural lung zones. This finding is consistent with expected pathophysiology in both disease entities. In the healthy control group, we found a significantly higher prevalence of ventilation defects in the apical lung zones compared to the middle and lower lung zone. Because this gradient appears to be age-related, the apical ventilation impairment could be a result of reduced elastic recoil of the pulmonary tissues attributable to senile emphysema (19).
Previous studies investigating imaging methods to capture regional ventilation primarily focused on 133Xe, CT and hyperpolarized 3He MR imaging. By comparison, these methods are afflicted with inherent limitations. First, 133Xe ventilation studies only provide low resolution images with limited spatial information (20). Second, Xe enhanced CT showed promising results, but is still hampered by ionizing radiation (21). HP 3He MR imaging yielded significant results for airway assessment, but high costs and limited supply prevent this method from widespread clinical implementation (22, 23). In this scenario, HP 129Xe MR imaging seems a promising application to fill this gap. In particular, HP 129Xe MRI may be idealy suited to evaluate regional interventions like bronchial stents, valves and bronchial thermoplasty (24).
Our study had notable limitations. Foremost, the retrospective study design might result in selection bias. Another potential limitation might be represented by the relatively small study cohort. However, it has to be considered that HP 129Xe MRI is still an experimental tool that is only now proceeding through FDA approval.
In conclusion, we found ventilation impairment derived from HP 129Xe MRI to correlate significantly with disease severity. Of note, the substantial inter-reader agreement underlines high reproducibility of this method, and reader-derived quatification of VDS applying the suggested VDS threshold allows to discern clinically significant airway obstruction depicted on HP 129Xe ventilation MRI.
Acknowledgements:
Lukas Ebner received financial funding by the Swiss National Science Foundation (SNSF; Grant P2SKP3_158645 / 1).
Footnotes
The authors have nothing to disclose.
References
- 1.Ebner L, Kammerman J, Driehuys B, Schiebler ML, Cadman RV, Fain SB. The role of hyperpolarized 129xenon in MR imaging of pulmonary function. Eur J Radiol. 2017. January;86:343–352. [DOI] [PMC free article] [PubMed] [Google Scholar]
- 2.Virgincar Rohan S, Cleveland Zackary I, Kaushik S Sivaram, et al. Quantitative analysis of hyperpolarized 129Xe ventilation imaging in healthy volunteers and subjects with chronic obstructive pulmonary disease. NMR Bio-med. 2013;:1–23h [DOI] [PMC free article] [PubMed] [Google Scholar]
- 3.He M, Driehuys B, Que LG, Huang YT. Using Hyperpolarized 129Xe MRI to Quantify the Pulmonary Ventilation Distribution. Acad Rad. Volume 23, Issue 12, 2016, p: 1521 –1531 [DOI] [PMC free article] [PubMed] [Google Scholar]
- 4.Ebner L, He M, Virgincar RS. Hyperpolarized 129Xenon Magnetic Resonance Imaging to Quantify Regional Ventilation Differences in Mild to Moderate Asthma: A Prospective Comparison Between Semiautomated Ventilation Defect Percentage Calculation and Pulmonary Function Tests. Invest Radiol. 2017. February;52(2): 120–127. [DOI] [PMC free article] [PubMed] [Google Scholar]
- 5.Kirby M, Svenningsen S, Owrangi A, Wheatley A. Hyperpolarized 3He and 129Xe MR imaging in healthy volunteers and patients with chronic obstructive pulmonary disease. Radiology. 2012. November;265(2):600–10. [DOI] [PubMed] [Google Scholar]
- 6.Salzman SH. Which Pulmonary Function Tests Best Differentiate Between COPD Phenotypes? Respiratory Care. 2012;57:50–60. [DOI] [PubMed] [Google Scholar]
- 7.He M, Robertson SH, Kaushik SS, et al. Dose and pulse sequence considerations for hyperpolarized 129Xe ventilation MRI. Magnetic Resonance Imaging. 2015;33:877–885. [DOI] [PMC free article] [PubMed] [Google Scholar]
- 8.Virgincar RS, Cleveland Zl, Sivaram Kaushik S, et al. Quantitative analysis of hyperpolarized 129Xe ventilation imaging in healthy volunteers and subjects with chronic obstructive pulmonary disease. NMR Biomed. 2012;26:424–435. [DOI] [PMC free article] [PubMed] [Google Scholar]
- 9.Ebner L, He M, Virgincar RS, et al. Hyperpolarized 129Xenon Magnetic Resonance Imaging to Quantify Regional Ventilation Differences in Mild to Moderate Asthma. Invest Radiol. 2017;52:120–127. [DOI] [PMC free article] [PubMed] [Google Scholar]
- 10.He M, Kaushik SS, Robertson SH, et al. Extending Semiautomatic Ventilation Defect Analysis for Hyperpolarized 129Xe Ventilation MRI. Academic Radiology. 2014;21:1530–1541. [DOI] [PMC free article] [PubMed] [Google Scholar]
- 11.MS ΜΗ, PhD BD, MD LGQ, MHS Y-CTHM. Using Hyperpolarized 129Xe MRI to Quantify the Pulmonary Ventilation Distribution. Academic Radiology. Elsevier Inc. 2016;23:1521–1531. [DOI] [PMC free article] [PubMed] [Google Scholar]
- 12.Bossuyt PM, Reitsma JB, Bruns DE, et al. The STARD statement for reporting studies of diagnostic accuracy: explanation and elaboration. The Standards for Reporting of Diagnostic Accuracy Group. Croat. Med. J 2003. pp. 639–650. [PubMed] [Google Scholar]
- 13.NHLBI. Expert Panel Report 3: Guidelines for the Diagnosis and Management of Asthma. 2007;: 1–440. [DOI] [PubMed]
- 14.Win T, Tasker AD, Groves AM, et al. Ventilation-Perfusion Scintigraphy to Predict Postoperative Pulmonary Function in Lung Cancer Patients Undergoing Pneumonectomy. AJR Am J Roentgenol. 2006;187:1260–1265. [DOI] [PubMed] [Google Scholar]
- 15.Rabe KF, Hurd S, Anzueto A, et al. Global Strategy for the Diagnosis, Management, and Prevention of Chronic Obstructive Pulmonary Disease. Am J Respir Crit Care Med. 2007;176:532–555. [DOI] [PubMed] [Google Scholar]
- 16.Reddel HK, Taylor DR, Bateman ED, et al. An Official American Thoracic Society/European Respiratory Society Statement: Asthma Control and Exacerbations. Am J Respir Crit Care Med. 2009;180:59–99. [DOI] [PubMed] [Google Scholar]
- 17.8. Virgincar Rohan S, Cleveland Zackary I, Kaushik S Sivaram, et al. Quantitative analysis of hyperpolarized 129Xe ventilation imaging in healthy volunteers and subjects with chronic obstructive pulmonary disease. NMR Bio-med. 2013;:1–23h [DOI] [PMC free article] [PubMed] [Google Scholar]
- 18.He M, Kaushik SS, Robertson SH et al. Extending Semiautomatic Ventilation Defect Analysis for Hyperpolarized. Academic Radiology. Elsevier Ltd. 2014;21:1530–1541. [DOI] [PMC free article] [PubMed] [Google Scholar]
- 19.Janssens JP, Pache JC, Nicod LP. Physiological changes in respiratory function associated with ageing. European Respiratory Journal. 1999;13:197–205. [DOI] [PubMed] [Google Scholar]
- 20.Suga K Technical and analytical advances in pulmonary ventilation SPECT with xenon-133 gas and Tc-99m-Technegas. Ann Nucl Med. 2002;16:303–310. [DOI] [PubMed] [Google Scholar]
- 21.Chae EJ, Seo JB, Goo HW, et al. Xenon Ventilation CT with a Dual-Energy Technique of Dual-Source CT: Initial Experience 1. Radiology. 2008;248:615–624. [DOI] [PubMed] [Google Scholar]
- 22.Bannier E, Cieslar K, Mosbah K, et al. Hyperpolarized 3He MR for Sensitive Imaging of Ventilation Function and Treatment Efficiency in Young Cystic Fibrosis Patients with Normal Lung Function 1. Radiology. 2010;255:225–232. [DOI] [PubMed] [Google Scholar]
- 23.Roos JE, McAdams HP, Kaushik SS, Driehuys B. Hyperpolarized Gas MR Imaging. Magnetic Resonance Imaging Clinics of NA. 2015;23:217–229. [DOI] [PMC free article] [PubMed] [Google Scholar]
- 24.Mahmood K, Ebner L, He M et al. Novel Magnetic Resonance Imaging for Assessment of Bronchial Stenosis in Lung Transplant Recipients. Am J Transplant. 2017. July;17(7): 1895–1904. [DOI] [PMC free article] [PubMed] [Google Scholar]