

Abstract
Objective:
This study aimed to determine the effects of humanlike Western and Mediterranean diets on caloric intake, obesity, metabolism, and hepatosteatosis in an established nonhuman primate model of obesity, cardiometabolic syndrome, type 2 diabetes, and atherosclerosis.
Methods:
A 38-month, randomized, preclinical, nonhuman primate primary prevention trial of 38 socially housed, middle-aged adult females was conducted. The monkeys were characterized during a 7-month baseline phase while consuming chow and then randomized to either Western or Mediterranean diets; the groups were balanced on baseline characteristics. Western and Mediterranean diets were formulated to closely reflect human diets, matched on macronutrient content, with protein and fat derived largely from animal sources in the Western diet and plant sources in the Mediterranean diet. Food consumption, activity levels, energy expenditure, body composition, carbohydrate metabolism, and hepatosteatosis were measured during baseline and treatment phases.
Results:
The Western diet increased caloric intake for the first 6 months and body fat, activity, energy expenditure, insulin resistance, and hepatosteatosis after 2.5 years, whereas the Mediterranean diet reduced triglyceride levels.
Conclusions:
This is the first report of differential caloric intake and obesity with long-term consumption of a Western versus Mediterranean diet under controlled experimental conditions and the first experimental evidence that a Mediterranean diet protects against hepatosteatosis compared with a Western diet.
Introduction
The literature regarding diet composition effects on caloric intake and subsequent systemic responses has been largely based on population studies that rely on self-reported food intake, short-term feeding studies, or rodent studies with diets unlike human diets. This is problematic for several reasons. Self-reported food intake characteristics of population studies are demonstrably inaccurate (1,2); thus, conclusions based on this literature are premature and require experimental validation. Short-term controlled trials are more reliable in terms of energy intake but may not predict long-term health effects. Preclinical rodent studies of diet composition effects on food consumption and subsequent systemic responses have largely employed diets that are dissimilar to those that humans consume. For example, the high-fat “diet-induced obesity” diets composed of rodent chow plus 45% to 65% of calories as saturated fat have been used in the majority of preclinical reports, whereas modern Western diets contain about 33% of calories as fat, and only about one-third of that is saturated (3) (Table 1). Furthermore, fat type and amount were shown to differentially affect the development of adiposity in different rodent strains (4).
TABLE 1.
Macronutrient content of experimental diets and monkey chow compared with human diets
| Diet composition | Human | Nonhuman primate | |||
|---|---|---|---|---|---|
| WEST | MED | WEST | MED | Lab chowa | |
| % of Calories | |||||
| Protein | 15b | 17c | 16b | 16c | 18 |
| Carbohydrates | 51b | 51c | 54b | 54c | 69 |
| Fat | 33b | 32c | 31b | 31c | 13 |
| % of Total fats | |||||
| Saturated | 33b | 21c | 36b | 21c | 26 |
| Monounsaturated | 36b | 56c | 36b | 57c | 28 |
| Polyunsaturated | 24b | 15c | 26b | 20c | 32 |
| n-3:n-6 fatty acids | 15:1d | 2.1–3:1e | 14.8:1d | 2.9:1e | 12:1 |
| Cholesterol, mg/kcalf | 0.13b | 0.16b | 0.16b | 0.15c | trace |
| Fiber, g/kcal | 0.01b | 0.03g | 0.02b | 0.04g | 0.01 |
| Sodium, mg/kcal | 1.7b,h | 1.3c,g | 1.7b,h | 1.0c,g | 0.25 |
An additional consideration is that while the contributions of rodent studies to the understanding of energy metabolism have been invaluable, rodents differ from humans in many ways that affect energy metabolism; they are nocturnal, grow throughout life, have high reproductive output, and have short life-spans. Thus, forward translation into large animal models that recapitulate key characteristics of human energy metabolism is important because food intake can be measured accurately for long time periods, confounding environmental variables can be controlled, and tissues that would be unavailable in human studies can be collected for study.
The translatability of preclinical studies to humans is maximized by the use of diets that better reflect human diets, animal models that more closely resemble humans in factors affecting energy metabolism, and generally longer experimental periods. A series of recent publications from the Prevención con Dieta Mediterránea (PREDIMED) study, a randomized trial of Mediterranean diet constituents, has reported beneficial effects on a number of health outcomes, including cardiovascular disease risk (5). Notably, while the growing literature documents associations between adherence to a Mediterranean diet and beneficial health effects, Mediterranean-like diets have never been studied in preclinical experiments.
Here, we report the effects of the consumption of a Western-like (WEST) versus Mediterranean-like (MED) diet on food consumption, body composition, metabolism, and hepatosteatosis in socially housed, adult female cynomolgus monkeys using a controlled, randomized, preclinical experimental design with a 31-month treatment period. This time period represents about 9% of the life-span of this species. This animal model is ideal, as there is an extensive literature documenting Western diet-induced obesity, cardiometabolic syndrome, type 2 diabetes, and coronary artery atherosclerosis in this species (6–8).
Methods
Subjects
Forty-three adult, middle-aged (mean = 9.0 years, range = 8.2–10.4 years, estimated by dentition), female Macaca fascicularis were obtained (SNBL USA, Ltd., Alice, Texas), quarantined in single cages for 1 month, and moved to social groups of four animals each, living in pens (3 m × 3 m × 3 m) with daylight exposure on a 12/12 light/dark cycle with monkey chow and water available ad libitum.
Experimental design
The monkeys habituated to their social groups for 3 months and were characterized during the last 4 months of a 7-month baseline phase while consuming monkey chow (monkey diet 5037/5038; LabDiet, St. Louis, Missouri; Table 1). The monkeys were randomly assigned to diets designed to mimic diet patterns observed in the West or the Mediterranean for 31 months (approximately equal to 8–12 human years). The two resulting groups were balanced on body weight (BW), BMI, and plasma triglyceride concentrations. The sampling schedule is depicted in Supporting Information Figure S1. All animal manipulations were performed according to the guidelines of state and federal laws, the US Department of Health and Human Services, and the Animal Care and Use Committee of Wake Forest University School of Medicine.
Experimental diets
The composition of the WEST and MED diets is shown in Table 2. These semipurified diets were formulated to be isocaloric with respect to protein, fat, and carbohydrate macronutrients and identical in cholesterol content (~320 mg/2,000 kcal/day) (Table 1). The WEST diet was formulated to be similar to that consumed by American women aged 40 to 49 as reported by the US Department of Agriculture (3). Specifically, protein and fat were derived mainly from animal sources, and the diet was high in saturated fats and sodium and low in monounsaturated and n-3 fatty acids (9). The MED diet was formulated to mimic key aspects of the Mediterranean diet. Protein and fat were derived mainly from plant sources, with some lean protein from fish and dairy, and monounsaturated fatty acids were relatively high (10,11). The Mediterranean diet n-6:n-3 fatty acid ratio was similar to a traditional hunter-gatherer type diet (12,13) and was high in complex carbohydrates and fiber and lower than the WEST diet in sodium and refined sugars. Key ingredients included English walnut powder and extra-virgin olive oil, which were the two foods provided to participants in the PREDIMED study (5). Both test diets differed considerably from monkey chow (Table 1).
TABLE 2.
Experimental diet composition
| Western-like diet (WEST) | Mediterranean-like diet (MED) | ||
|---|---|---|---|
| Ingredient | g/kg | Ingredient | g/kg |
| Casein, USP | 85.0 | Casein, USP | 17.4 |
| Whey protein, 895 | 85.0 | Whey protein, 895 | 17.4 |
| Dried egg white | 26.1 | ||
| Fish meal (menhaden) | 26.1 | ||
| English walnut powder | 8.7 | ||
| Black bean flour | 43.5 | ||
| Garbanzo bean flour | 17.4 | ||
| Wheat flour (all-purpose) | 243.5 | ||
| Dextrin | 260.0 | Dextrin | 96.6 |
| Sucrose | 180.0 | Sucrose | 34.8 |
| High fructose corn syrup, 55 | 70.0 | Banana | 130.4 |
| Applesauce | 38.2 | ||
| Tomato paste | 17.4 | ||
| Cellulose (Alpha-Cel)a | 79.4 | Cellulose (Alpha-Cel)a | 94.8 |
| Lard | 41.5 | Olive oil (Filippo Berio Extra-Virgin) | 61.7 |
| Beef tallow HHR | 40.0 | Menhaden oil (OmegaPure) | 8.7 |
| Butter, lightly salted | 12.5 | Butter, lightly salted | 8.7 |
| Corn oil | 35.0 | Corn oil | 10.4 |
| Flaxseed oil | 3.0 | Flaxseed oil | 1.7 |
| Dried egg yolk | 6.0 | Dried egg yolk | 14.8 |
| Crystalline cholesterol | 0.4 | ||
| Complete vitamin mix (Teklad) | 25.0 | Complete vitamin mix (Teklad) | 21.7 |
| Mineral Mix w/o Ca, P, NaCl | 50.0 | Mineral mix w/o Ca, P, NaCl | 43.5 |
| Calcium carbonate | 4.3 | Calcium carbonate | 3.7 |
| Calcium phosphate, monobasic | 7.5 | Calcium phosphate, monobasic | 6.5 |
| NaCl (table salt) | 16.0 | NaCl (table salt) | 6.3 |
| Total | 1,000 | Total | 1,000 |
Total fiber (percent of diet): WEST, 7.94; MED, 12.7.
Adiposity and body composition
BW and body length (suprasternal notch to pubic symphysis) were measured during the last month of the 7-month baseline phase and during months 6, 14, 20, 24, 27, and 31 of the treatment phase. BMI was calculated as BW/(body length [meters])2 (14). Body composition was also measured by computed tomography (CT) (online Supporting Information) in anesthetized nonhuman primates (NHPs) during month 6 of the 7-month baseline and during months 14 and 27 of the treatment phase. The fat compartment was defined as tissue with attenuation between −190 and −30 Hounsfield units, and total fat was then determined across the whole body.
Hepatosteatosis
Liver attenuation measured by CT is a validated quantitative measure that is inversely related to liver fat burden and hepatosteatosis (15). Hepatosteatosis was assessed from the whole-body CT examinations. Mean liver attenuation was obtained as the average Hounsfield unit of nine regions of interest (three from each slice for three sequential slices) manually placed to avoid structures.
Food consumption
Individual feeding cages were fabricated and placed inside group pens. The monkeys were trained to run into the feeding cages on voice command, consume their food, and then be released back into their group pen. Throughout the experiment, the animals finished feeding in the first 30 minutes. Each monkey was offered 120 kcal diet/kg BW/day. During the baseline phase and the first year of the treatment phase, the monkeys were fed for 2 hours once a day at ~0730 hours. During the last half of the treatment phase, beginning in month 16, one-half of the ration was fed at ~0730 hours for 1 hour, and the other half was fed at ~1330 hours for 1 hour in order to ensure that the monkeys had adequate access to diet. Food consumption was measured intermittently during month 5 of the baseline phase and months 3 to 6, 7 to 10, 17 to 20, and 27 to 30 of the treatment phase; average consumption was calculated for each time period. Experimental diets were weighed before and after the meal, and calories consumed were calculated. Chow biscuit weights were variable because of absorbed moisture; thus, the number of biscuits consumed was used as a measure of food intake during the baseline phase. Because the chow and experimental diet consumption was measured differently, they are graphed separately.
Activity and energy expenditure
Activity levels and energy expenditure were measured for 24 hours during month 4 of the baseline phase and during months 11 and 28 of the treatment phase. Prior to data collection, the monkeys were sedated (15 mg/kg ketamine HCl), outfitted with ActiGraph GT3X monitors (ActiGraph, Pensacola, Florida) in the pocket of the mesh jacket, and allowed to recover for 24 hours before recording. Activity was expressed as the mean of the counts summed over 24 hours as previously described (16,17). Energy expenditure was calculated as energy expenditure = 0.045 cal × BW × activity (17).
Carbohydrate metabolism and triglyceride concentrations
Intravenous glucose tolerance tests with insulin responses were done during month 6 of the baseline phase and during month 26 of the treatment phase as previously described (18). Briefly, NHPs were sedated (ketamine HCl 15 mg/kg) after an 18-hour fast and administered 500 mg/kg dextrose. Blood samples were taken at 0, 5, 10, 20, 30, 40, and 60 minutes. Glucose area under the curve (AUC) and glucose disappearance rate K, calculated as previously described (18), were unaffected by diet and are not mentioned further. Insulin AUC was calculated using insulin responses between 10 and 40 minutes. Elevated triglyceride levels were shown to be a common dyslipidemic feature of prediabetic states, and increases over time predicted type 2 diabetes (19). Triglyceride concentrations were measured following an overnight fast during month 5 of the baseline phase and during month 24 of the treatment phase. Glucose and triglyceride concentrations were determined as previously described (20). Insulin was determined by enzyme-linked immunosorbent assay (ELISA; Mercodia, Uppsala, Sweden).
Data analysis
The primary analyses were conducted using general linear mixed model analyses of variance (ANOVA) and covariance (ANCOVA) with one categorical variable (diet, MED or WEST), one repeated measure (multiple measures of the dependent variable), and one continuous variable, the baseline values for the dependent variable, when it significantly predicted outcomes. The inclusion of baseline values as covariates adjusted for small individual differences in the dependent variable prior to treatment and optimized the estimate of treatment group differences. Data were transformed as necessary to better approximate homogeneity of variance. Potential differences in baseline values for each dependent variable were assessed using t tests. Duncan test was used for post hoc comparisons to clarify differences in group × time interactions of food consumption. Transformation of the data made no difference in the outcomes of statistical tests, and thus raw means and SEs are depicted in graphs unless otherwise stated. The significance level was set at P = 0.05.
Results
Of the 43 NHPs, 2 animals did not tolerate the experimental diets, were fed standard monkey chow, and excluded from analyses reported here. In addition, 3 animals died during the course of the study, resulting in a final sample size of 38 (WEST: n = 21; MED: n = 17). One monkey was ill during months 7 to 10, and food consumption was not recorded.
Adiposity
BMI (Figure 1) did not differ between treatment groups during the baseline phase (t[36] = 0.02; P = 0.98). Treatment phase BMI, during months 6 to 31, was adjusted for baseline in a 2 × 6 ANCOVA. The baseline covariate was a significant predictor (F[1,35] = 46.95; P < 0.0001). Overall, there was a significant difference in BMI between treatment groups during months 6 to 31 (main effect of diet: F[1,35] = 9.66; P = 0.004). Changes over the 6- to 31-month time period (F[5,175] = 0.55; P = 0.74) and the treatment group × time interaction (F[5,175] = 2.01; P = 0.08) were not significant (Figure 1A). The increase in BMI appeared to be largely due to an increase in percent fat as measured by CT (Figure 1B). Percent fat did not differ between treatment groups during the baseline phase (t[36] = 0.52; P = 0.60). Treatment phase percent fat, during treatment months 14 and 27, was adjusted for baseline in a 2 × 2 ANCOVA. The baseline covariate was a significant predictor (F[1,35] = 12.02; P < 0.001). Overall, there was a significant difference in percent fat between treatment groups (F[1,35] = 4.47; P = 0.04). Changes over the 6- to 31-month time period (F[1,35] = 0.001; P = 0.98) and the treatment group × time interaction (F[1,35] = 0.02; P = 0.89) were not significant (Figure 1B). BW followed the same pattern (Supporting Information Figure S2).
Figure 1. Body composition and adiposity.

(A) Body composition: BMI did not differ between treatment groups during the baseline phase (t[36] = 0.02; P = 0.98). There was a significant difference in BMI between treatment groups during months 6 to 31 (2 × 6 ANCOVA F[1,35] = 9.66; P = 0.004). (B) Body fat determined by CT did not differ between treatment groups during the baseline phase (t[36] = 0.52; P = 0.60). After the baseline phase, there was a significant difference in amount of fat between treatment groups (2 × 2 ANCOVA, main effect of diet: F[1,35] = 4.47; P = 0.04). Changes over the 6- to 31-month time period (F[1,35] = 0.001; P = 0.98) and the treatment group × time interaction (F[1,35] = 0.02; P = 0.89) were not significant. [Colour figure can be viewed at wileyonlinelibrary.com]
Food consumption
There was no significant difference in chow intake between the two treatment groups during the baseline phase (mean number of biscuits: t[36] = 0.47; P = 0.64; Figure 2A inset). Treatment phase caloric intake was adjusted for baseline intake in a 2 × 4 ANCOVA. Baseline intake was a significant predictor (F[1,34] = 15.38; P = 0.0004). Overall, there was no significant difference in calories consumed between treatment groups (F[1,34] = 2.65; P = 0.11) or over the 6- to 31-month time period (F[4,136] = 1.51; P = 0.22), and there was no significant diet × time interaction (F[3,102] = 41.66; P = 0.18).
Figure 2.
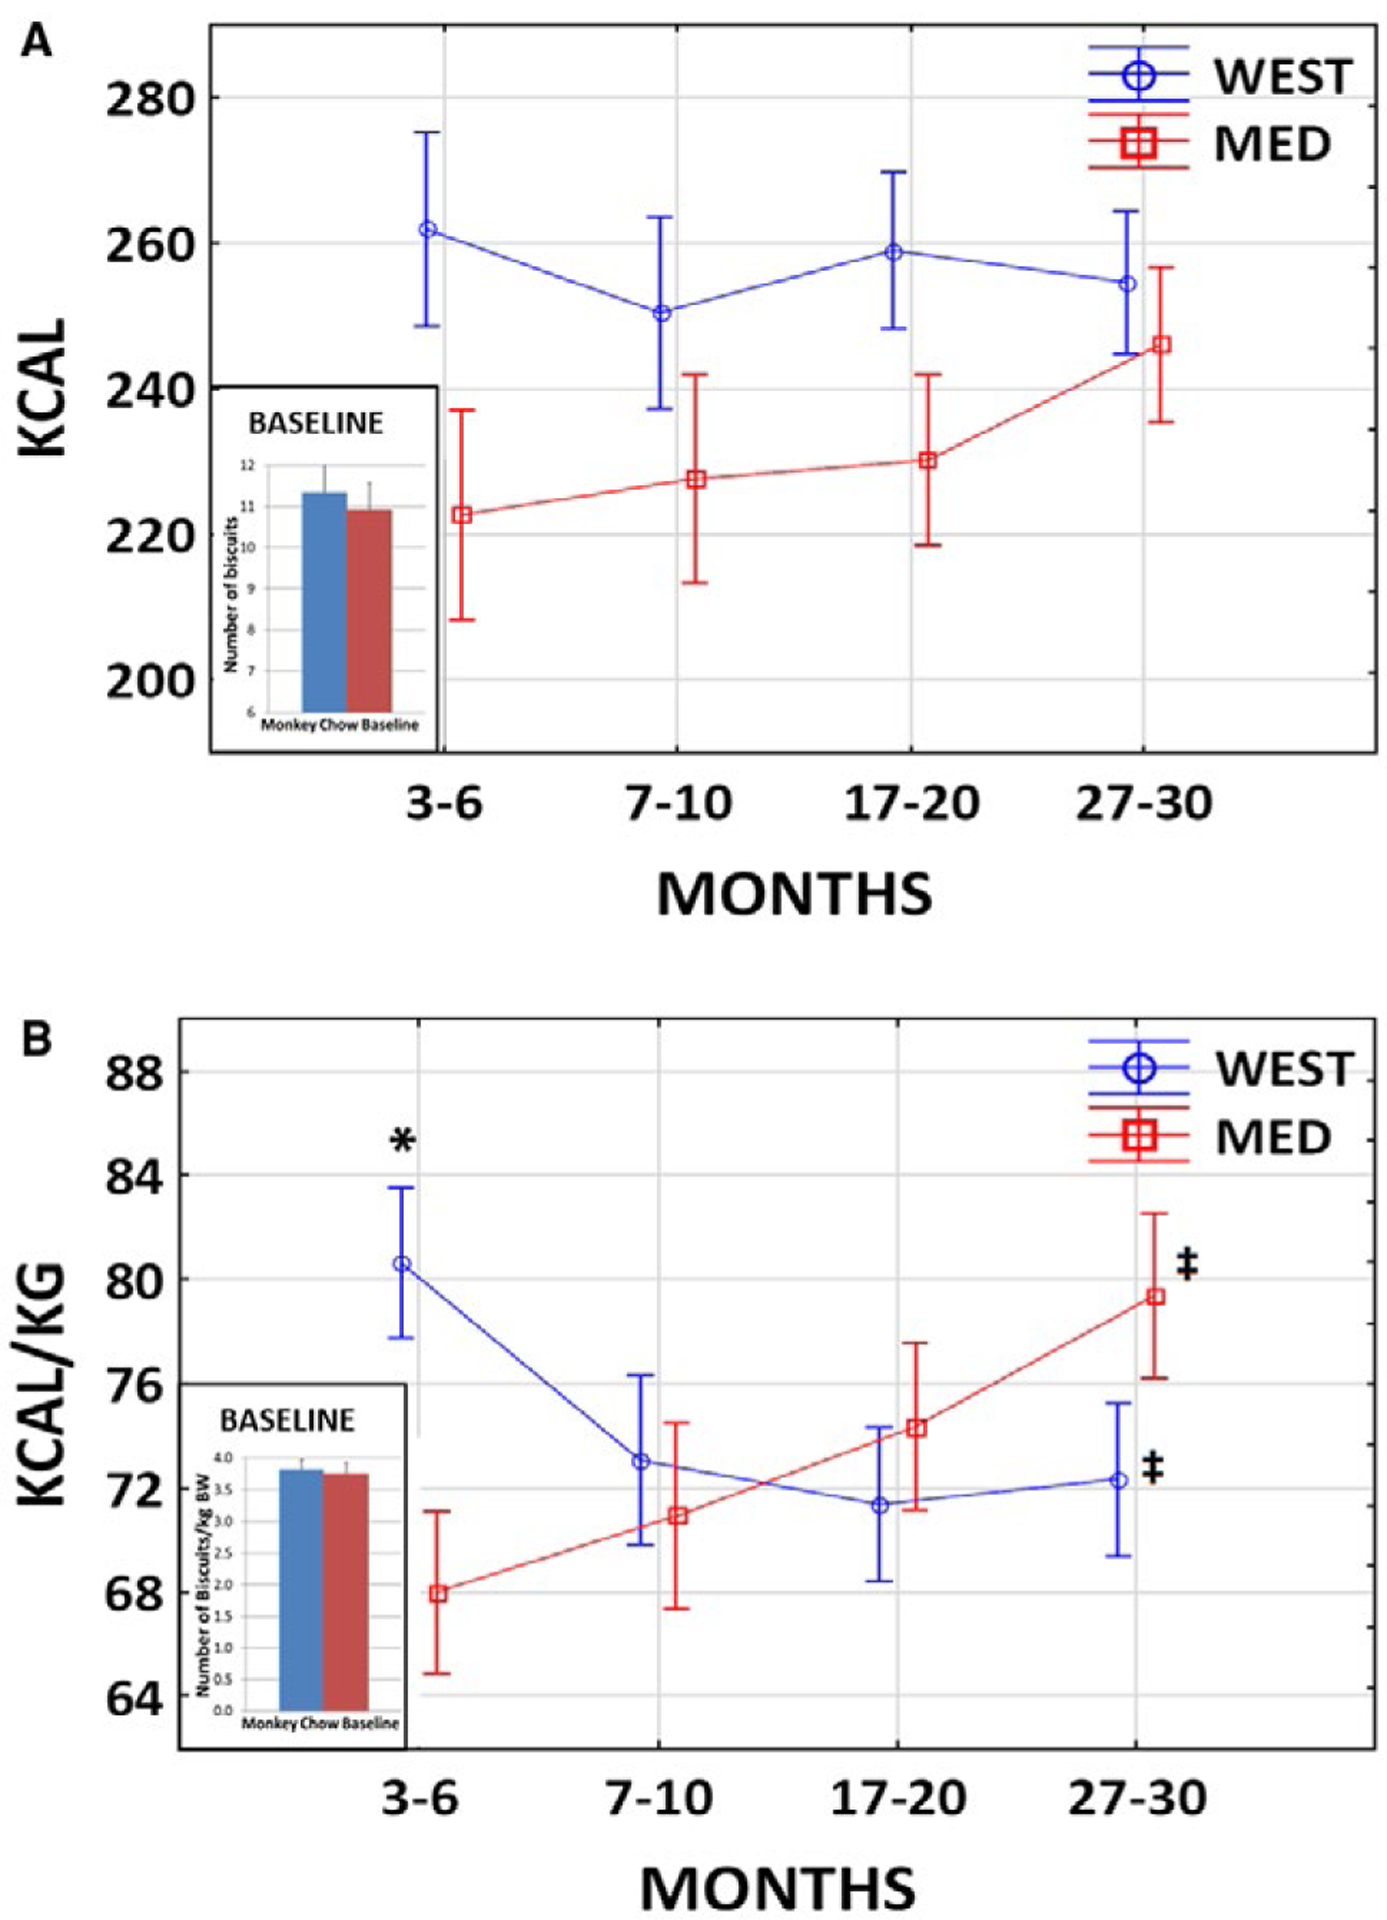
Food consumption. (A) Calories consumed. There was no significant difference in chow intake (number of biscuits) between the two treatment groups during the baseline phase (t[36] = 0.47; P = 0.64; inset). Overall, there was no significant difference in calories consumed between treatment groups (2 × 4 ANCOVA F[1,34] = 2.65; P = 0.11) or over time (F[4,136] = 1.51; P = 0.22), and there was no significant diet × time interaction (F[3,102] = 41.66; P = 0.18). (B) Calories per kilogram body weight (BW). There was no significant difference in number of biscuits consumed per kilogram BW between the two treatment groups during the baseline phase (t[36] = 0.32; P = 0.75; inset). There was no significant difference in calories per kilogram BW consumed between treatment groups (2 × 4 ANCOVA F[1,34] = 0.11; P = 0.74) or over time (F[3,102] = 0.68; P = 0.56). There was a significant diet × time interaction (F[3,102] = 7.49; P = 0.0001). Post hoc tests revealed that the WEST group consumed more than the MED group at 3 to 6 months (*P = 0.01) but not at any other time point thereafter (all Ps > 0.17). Those in the WEST group consumed significantly less per kilogram BW at 27 to 30 months compared with 3 to 6 months (†P = 0.02), whereas those in the MED group consumed significantly more per kilogram BW at 27 to 30 months compared with 3 to 6 months (‡P = 0.001). [Colour figure can be viewed at wileyonlinelibrary.com]
Because BW and BMI increased during the treatment phase in the WEST group, consumption was also assessed as calories per kilogram BW. There was no significant difference in chow intake per kilogram BW between the two treatment groups during the baseline phase (mean number of biscuits/kg BW: t[36] = 0.32; P = 0.75; Figure 2B inset). Baseline intake per kilogram BW was a significant predictor (2 × 4 ANCOVA F[1,34] = 4.43; P = 0.043). Overall, there was no significant difference in calories per kilogram consumed between treatment groups (F[1,34] = 0.11; P = 0.74) or over time (F[3,102] = 0.68; P = 0.56). There was a significant diet × time interaction (F[3,102] = 7.49; P = 0.0001). The two groups were compared at each time point, and the 3- to 6-month time point was compared with the 27- to 30-month time point within each group with Duncan post hoc test. The WEST group consumed more than the MED group at 3 to 6 months (P = 0.01) but not at any time thereafter (all Ps > 0.17). Those in the WEST group consumed significantly less per kilogram BW at 27 to 30 months compared with 3 to 6 months (P = 0.02), whereas those in the MED group consumed significantly more per kilogram BW at 27 to 30 months compared with 3 to 6 months (P = 0.001). Thus, although the WEST group ate less during the latter part of the treatment phase, it maintained the increased BMI. Furthermore, although the MED group ate more per kilogram BW during the latter part of the treatment phase, it too maintained the comparatively low BMI at about baseline levels.
Activity levels and estimated energy expenditure
Activity levels at baseline were lower in the MED group on average, although the difference did not reach significance (t[36] = 1.98; P = 0.055; Figure 3A). Treatment phase activity was adjusted for baseline in a 2 × 2 ANCOVA. Baseline activity was a significant predictor (F[1,35] = 25.72; P < 0.0001). Overall, there was a significant difference between treatment groups in activity levels during the treatment phase (F[1,35] = 4.19; P = 0.048); the WEST group was more active than the MED group even when controlling for baseline levels. Changes over time (F[1,35] = 0.26; P = 0.61) and the treatment group × time interaction (F[1,35] = 1.35; P = 0.25) were not significant (Figure 3A).
Figure 3.
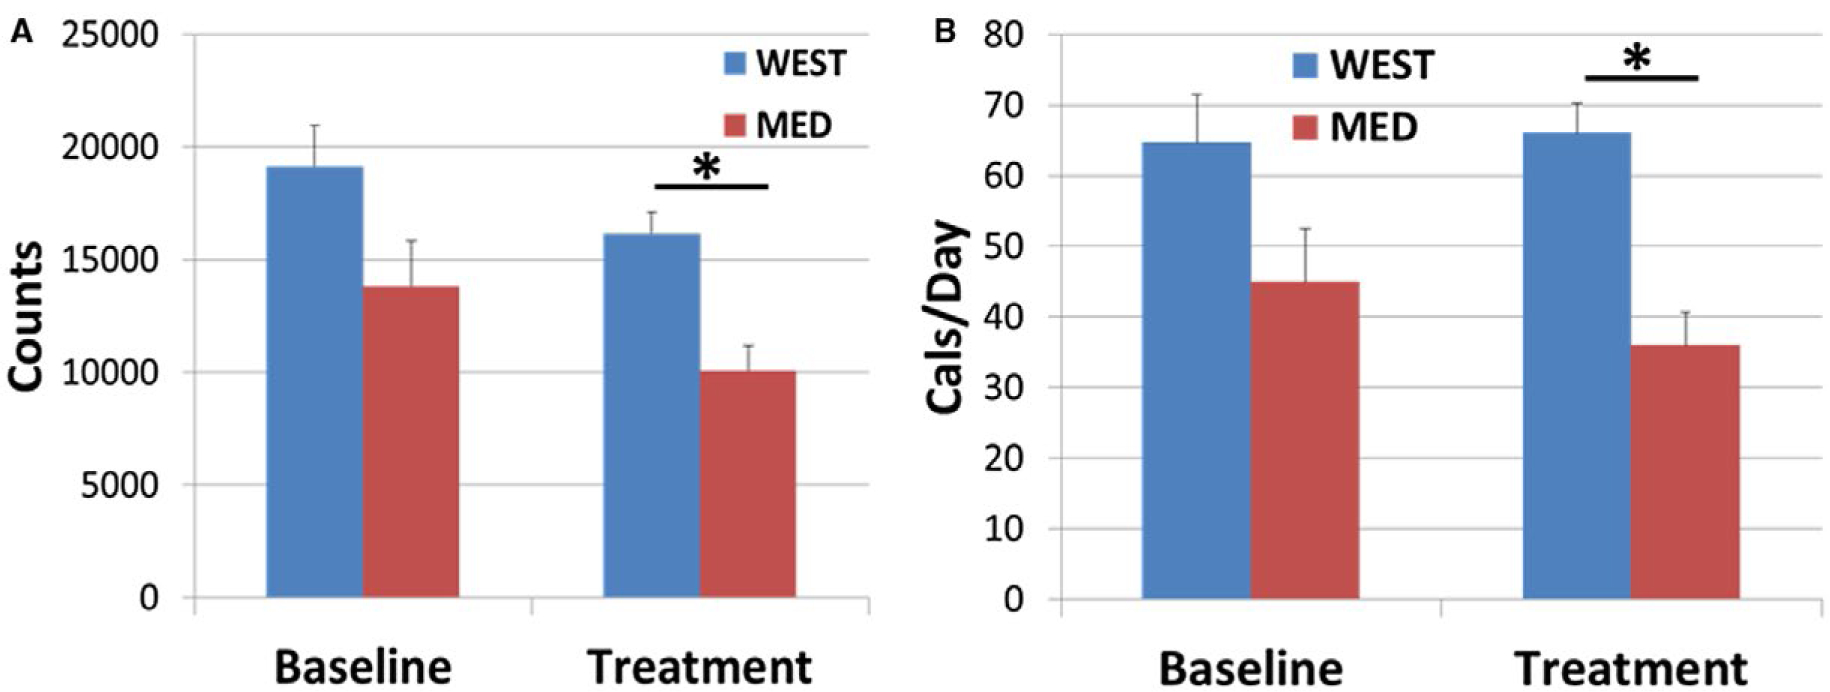
Activity levels and energy expenditure. (A) On average, activity levels at baseline were lower in the MED group, although the difference did not reach significance (t[36] = 1.98; P = 0.055). Overall, there was a significant difference between treatment groups in activity levels during the treatment phase (2 × 2 ANCOVA, main effect of diet: F[1,35] = 4.19; *P = 0.048). Treatment phase means were adjusted for baseline. (B) On average, energy expenditure at baseline was lower in the MED group, although the difference did not reach significance (t[36] = 1.85; P = 0.073). Overall, there was a significant difference between treatment groups in energy expenditure during the treatment phase (2 × 2 ANCOVA, main effect of diet: F[1,35] = 4.16; *P = 0.049). Treatment means were adjusted for baseline. [Colour figure can be viewed at wileyonlinelibrary.com]
Patterns of energy expenditure followed activity levels. On average, energy expenditure at baseline was lower in the MED group, although the difference did not reach significance (t[36] = 1.85; P = 0.073; Figure 3B). Treatment phase caloric intake was adjusted for baseline in a 2 × 2 ANCOVA. The baseline covariate was a significant predictor (F[1,35] = 30.85; P < 0.0001). Overall, there was a significant difference between treatment groups in energy expenditure during the treatment phase (F[1,35] = 6.19; P = 0.018). Effects of time (F[1,35] = 0.12; P = 0.73) and the treatment group × time interaction (F[1,35] = 1.10; P = 0.30) were not significant (Figure 3B).
Carbohydrate metabolism and triglyceride concentrations
The insulin AUC at baseline was not significantly different between groups (t[36] = 1.35; P = 0.18). Treatment phase insulin AUC was adjusted for baseline in a 1 × 2 ANCOVA. The baseline covariate was a significant predictor (F[1,35] = 16.13; P = 0.0003). Overall, the insulin response was higher in the WEST than the MED group during the treatment phase (F[1,35] = 4.16; P = 0.049) (Figure 4A).
Figure 4.
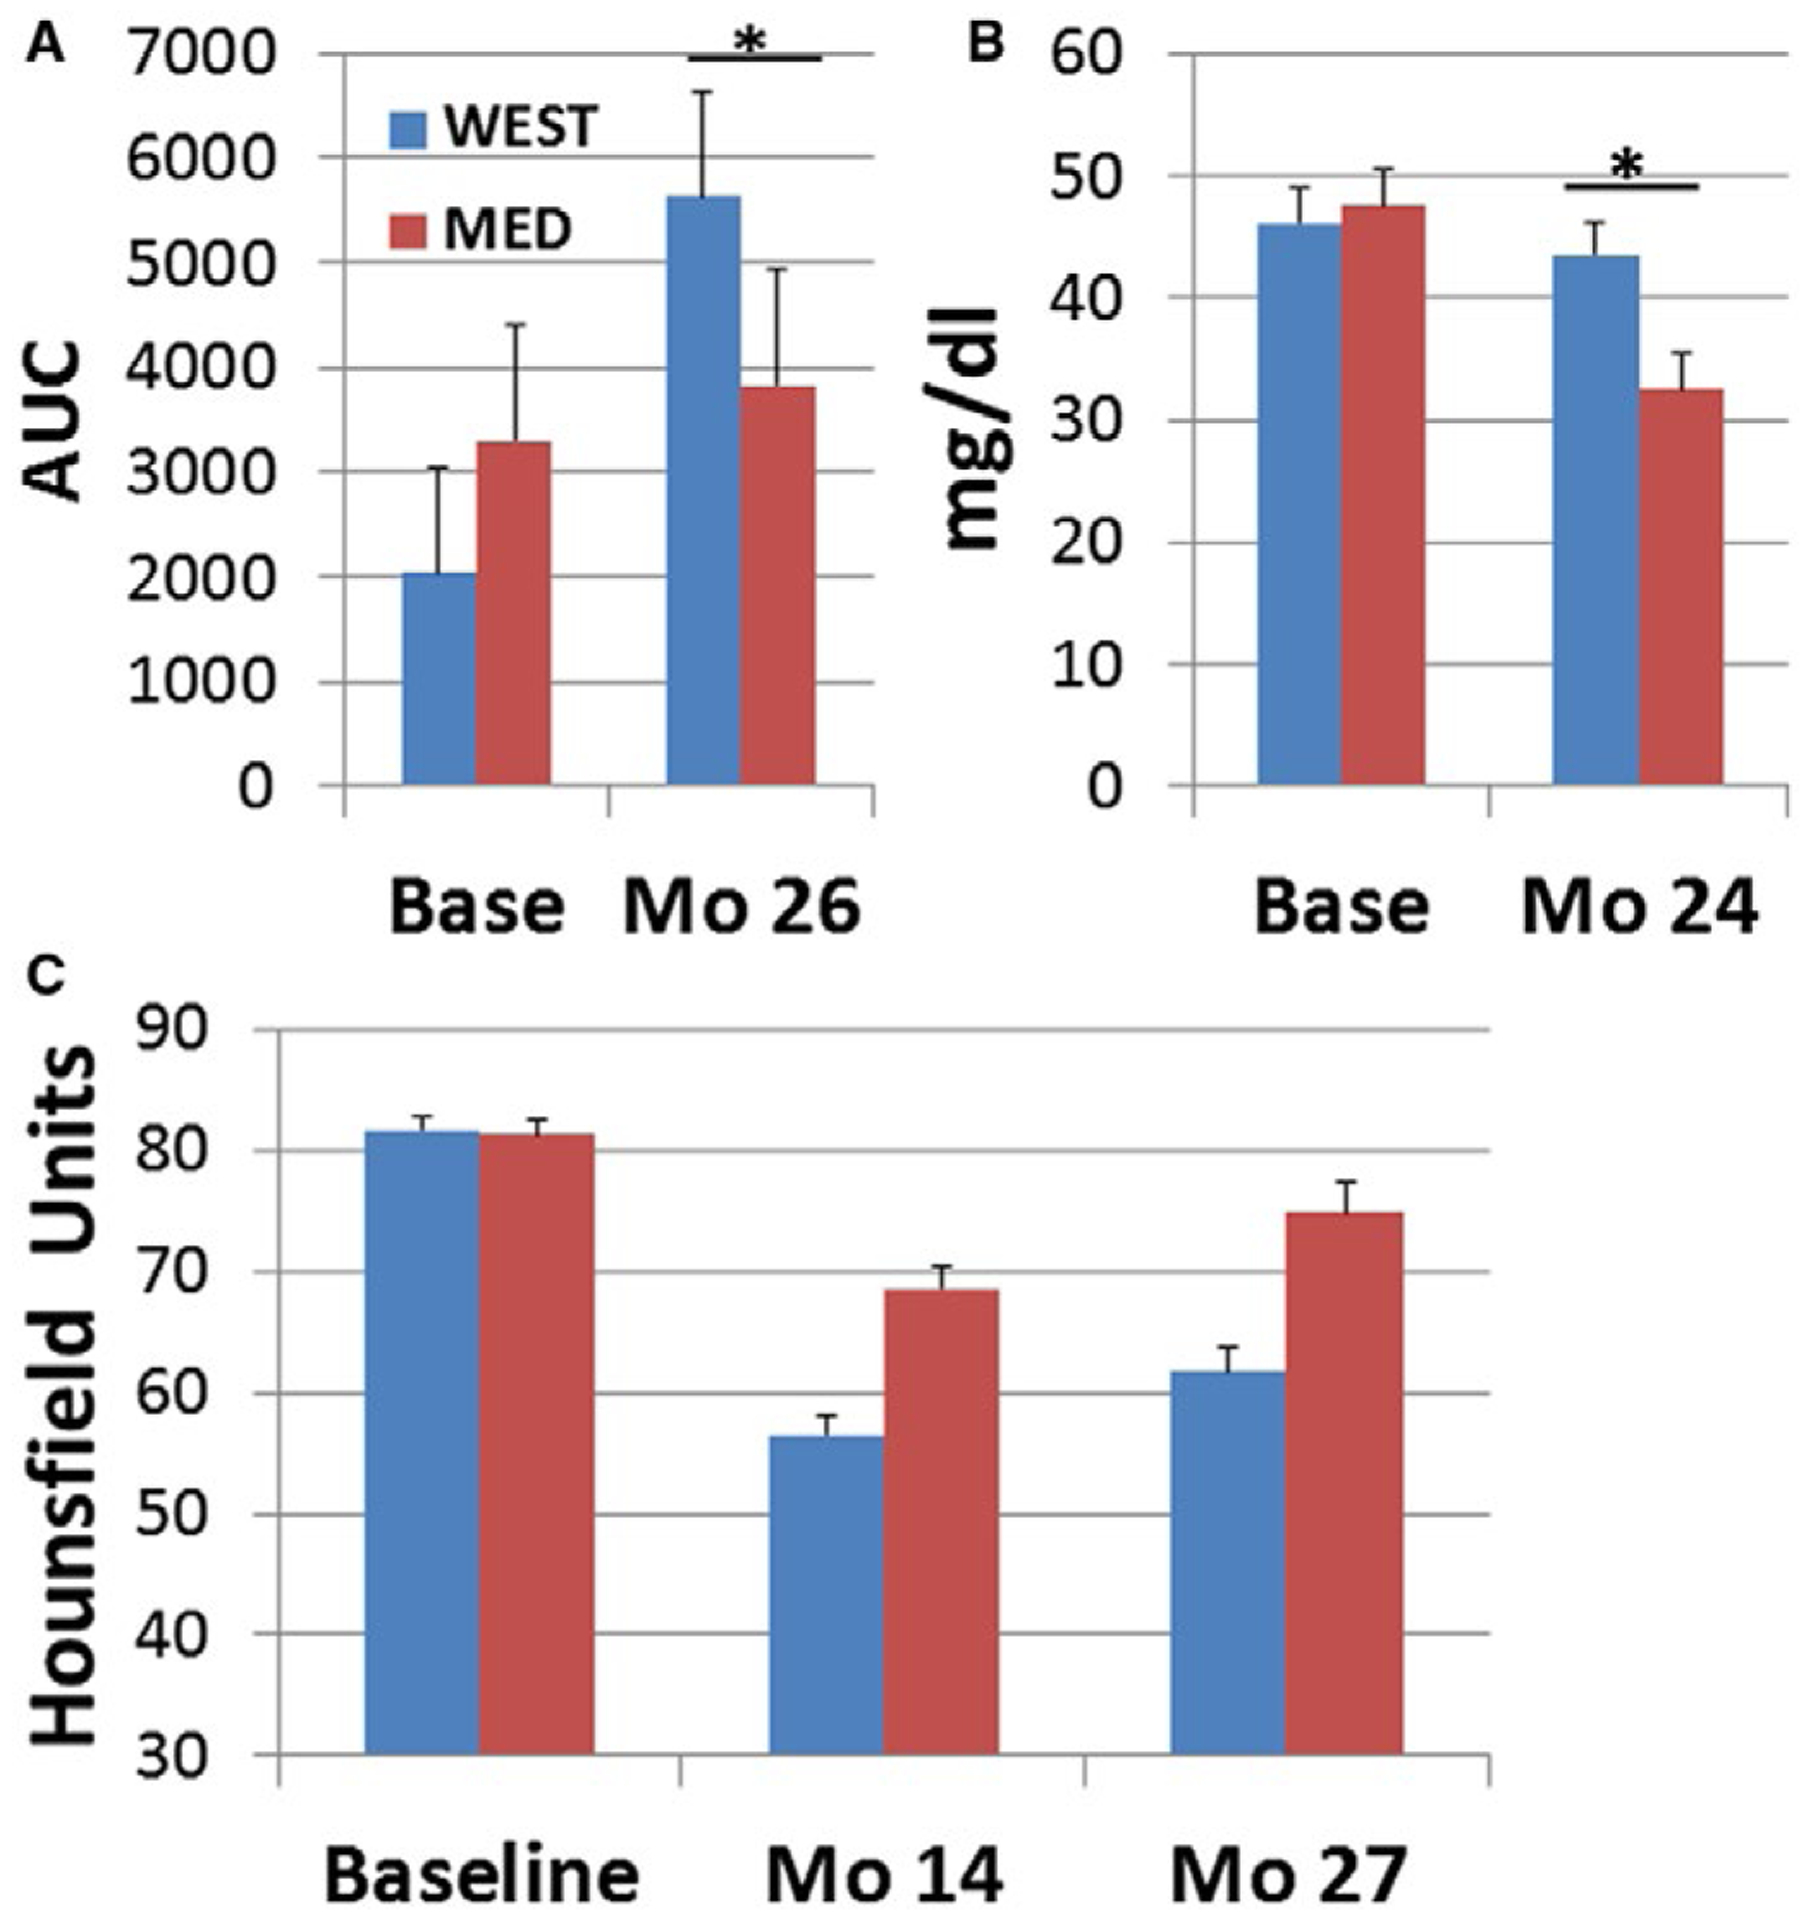
Insulin, triglycerides, and hepatosteatosis. (A) Insulin responses to glucose challenge. There was no significant difference in the insulin AUC at baseline (t[36] = 1.35; P = 0.18). Insulin AUC after 26 months of treatment was higher in the WEST group (1 × 2 ANCOVA, main effect of diet: F[1,35] = 4.16; *P = 0.049). Means were adjusted for baseline. (B) There was no difference in baseline triglyceride concentrations (t[36] = 0.25; P = 0.81). Triglyceride concentrations after 24 months of treatment were higher in the WEST group (1 × 2 ANOVA, main effect of diet: F[1,35] = 7.49; *P = 0.01); (C) Hepatosteatosis. Liver attenuation was not significantly different between groups at baseline (t[36] = 0.33; P = 0.74). Liver attenuation during the treatment phase was lower in the WEST than the MED group, indicating increased fat deposition (2 × 2 ANOVA, main effect of diet: F[1,35] = 21.19; P < 0.0001). Liver attenuation also increased, indicating a decrease in fat deposition between 14 and 27 months (main effect of time: F[1,35] = 31.41; P < 0.00001). [Colour figure can be viewed at wileyonlinelibrary.com]
There was no difference in baseline triglyceride concentrations (t[36] = 0.25; P = 0.81). The baseline covariate was not a significant predictor in ANCOVA (F[1,35] = 2.37; P = 0.13), and thus ANOVA results are reported. Triglyceride concentrations were higher in the WEST than the MED group during the treatment phase (1 × 2 ANOVA F[1,35] = 7.49; P = 0.01) (Figure 4B) because of significant decreases in triglycerides in the MED group (baseline versus treatment: t[16] = 3.21; P = 0.006) but not the WEST group (baseline versus treatment: t[20] = 7.41; P = 0.47).
Hepatosteatosis
Liver attenuation was not significantly different between groups at baseline (t[36] = 0.33; P = 0.74). The baseline covariate was not a significant predictor in ANCOVA (F[1,35] = 2.49; P = 0.12), and thus ANOVA results are reported. Liver attenuation after 14 and 27 months of diet consumption was lower in the WEST than the MED group, indicating increased fat deposition in the WEST compared with the MED group (2 × 2 ANOVA, main effect of diet: F[1,35] = 21.19; P = 0.0001). Liver attenuation also increased, indicating a decrease in fat deposition between 14 and 27 months (main effect of time: F[1,35] = 31.41; P < 0.00001) (Figure 4C).
Discussion
This preclinical, NHP, randomized primary prevention trial of effects of dietary patterns on health outcomes is unique and has notable strengths. First, the composition of the experimental diets closely approximated those that humans consume. The WEST diet was based on an extensive history of Western diet formulation and use in NHP studies (6,7,21,22). The MED diet was formulated specifically for this experiment based on nutritional analyses of Mediterranean diets consumed by humans (10–12) and was developed and extensively tested for health effects and palatability in macaques over a 2-year period prior to this study. The trial design allowed detailed assessment of subjects prior to treatment, and treatment groups were balanced on key pretreatment characteristics. While these experimental design characteristics are common in human clinical trials, this level of experimental rigor is relatively rare in animal studies. Additional covariate analyses assured that observed differences in treatment groups were due to diet and not spurious effects. Furthermore, diet effects were studied for a significant portion of the subjects’ lives. In addition, subjects were housed socially to promote normal physiology and behavior, and procedures were developed to measure consumption while NHPs lived socially. Notably, the elaborated primate brain is a major driver of energy metabolism (23), with energy demands that may challenge the demands of other systems. Therefore, solutions that evolved to address this demand may be primate specific. From this perspective, the use of an NHP model minimizes the breadth of the translational leap to humans.
During the baseline phase chow consumption, there was no difference in food intake between the MED versus WEST groups. When the NHPs began consuming the WEST diet, their caloric intake per kilogram BW was greater than that of the MED group for the first 6 months. The literature is mixed as to whether calorie source affects caloric intake or subjective assessments of satiety (24,25). The MED and WEST diets were similar in simple sugar content (simple sugar percent of calories: WEST = 25.4; MED = 21.4) but varied in fatty acid content. In two human studies, no differential effect of monounsaturated, polyunsaturated, or saturated fat on self-reported satiety was observed in studies of consumption of one meal (26,27). However, high-fat–diet-induced hyperphagia was reported in humans in a 2-week feeding study utilizing a mixture of fats, but fatty acid content was not reported (28). Hyperphagia because of high-saturated-fat diets was reported in rodents, and some brain and peripheral mechanisms were identified (29). In one study, the combination of high saturated fat and high sucrose resulted in hyperphagia, whereas either alone did not (30). In the melanocortin-4 receptor knockout mouse, diets enriched in either saturated or monounsaturated fats elicited hyperphagia and weight gain (31). In lean and obese male Zucker rats, type of fat influenced calorie intake only in the obese group (4). While the effects of fatty acids on food consumption have been studied, very little is known about the potential effects of amino acid differences, because of differences in protein source, on food consumption. Thus, additional studies are warranted to understand mechanisms mediating the differential effects of the MED and WEST diets on food consumption in primates.
After 6 months, intake per kilogram BW decreased in the WEST group; however, BW and BMI continued to increase, and the increase in percent fat (measured by CT) was maintained throughout the experimental phase. In contrast, the MED group increased intake per kilogram BW over the course of the experimental phase while maintaining BW and BMI at near baseline levels. The increased intake may have been a result of moving to feeding twice per day, although it did not have that effect in the WEST group. This is the first report of differences in caloric intake resulting from long-term consumption of either a Western or Mediterranean diet under controlled experimental conditions. The importance of long-term studies is exemplified by the apparent changes over time in consumption and in the relationship between BMI and consumption. These observations suggest that changes in metabolism in the WEST group that accrued during the initial stage of increased consumption maintained or possibly reprogrammed the BW–caloric intake relationship over the long term.
Activity levels and energy expenditure did not appear to influence BW. This conclusion is tempered by two considerations. First, there tended to be group differences in these measures at baseline, with higher values in the group assigned to the WEST diet. However, adjustment for baseline levels still resulted in higher activity levels and energy expenditure in the WEST group. Second, in general, activity levels and food intake are often positively correlated (32), and increases in exercise associated with increased caloric intake are reported to be more pronounced in females, suggesting the possibility of sex differences (32,33). Thus, the observations reported here may be sex specific. Nonetheless, a simple energy in/energy out hypothesis is not supported by these observations.
The increase in insulin in the WEST group accompanied by weight gain in female macaques is similar to that observed in humans and indicative of a prediabetic state. Prediabetes is an important predictor of all-cause and cardiovascular mortality, type 2 diabetes, and hepatosteatosis (34). Diet impacts the gut microbiome, and gut microbiota are associated with type 2 diabetes, prediabetes, and obesity in humans (35). We also observed diet group differences in the gut (and breast) microbiome in this study (36,37), which may have contributed to changes in adiposity and metabolism.
Nonalcoholic hepatosteatosis has become the most common form of liver disease, and obesity and insulin resistance are primary risk factors (34). A Mediterranean diet may be beneficial in treating hepatostatosis, as n-3 fatty acid and monounsaturated fat intake is associated with lower risk, high n-6:n-3 fatty acid ratios and saturated fat intake are associated with increased risk (38), and one small short-term feeding study reported beneficial effects of the Mediterranean diet in 12 nondiabetics with fatty liver disease (39). Here, we report the first experimental evidence that a Mediterranean diet protects against the development of hepatosteatosis compared with a Western diet. Similar to current human diets, both experimental diets contained 31% of calories from fat, and both diets increased liver lipid content compared with the baseline chow diet, which contained only 13% of calories from fat. However, the diets varied considerably in fatty acid content, and the WEST diet increased fat deposition in the liver by approximately 40%, whereas the MED diet increased fat in the liver by only approximately 14%.
Weaknesses in the study include the difficulty in accurately measuring caloric intake when feeding lab chow, the inability of two animals (4.7%) to tolerate the experimental diets, and a relatively modest sample size. Likewise, temporal changes should be interpreted with caution, as treatment phase duration is naturally confounded by factors such as aging and season (40).
Conclusion
These results demonstrate that the MED diet protected against the increases in consumption, obesity, prediabetes, and hepatosteatosis observed in the WEST group, despite containing similar proportions of fat, protein, and carbohydrates, suggesting an important contribution of diet composition rather than macronutrient content. Diet composition is a critically important contributor to US public health, as those at greatest risk for obesity and related costly chronic diseases are also those with the poorest-quality diets (41). Importantly, people who adhere to more of a Mediterranean than Western diet pattern have other characteristics that may contribute to human health, including higher levels of physical activity, sleep quality, and education and income level, and they have been reported to smoke less (42–45). The data reported here suggest that diet composition itself is an important contributor to the healthy function of multiple systems involved in energy metabolism. Long-term controlled trials of health effects of a Mediterranean diet are warranted, as several outcomes of this study would have been different had this been a shorter-term study. Ultimately, the translational value of preclinical experiments will be enhanced by the use of diets that more closely approximate those consumed by humans.
Supplementary Material
Acknowledgments
The authors thank Maryanne Post, JD Bottoms, Edison Floyd, Jason Lucas, Joshua Long, Rebecca Marcus, Diane Wood, and Sherri Samples for technical support.
Funding agencies: This study was supported by NIH R01HL087103 (CAS), NIH R01 HL122393 (TCR), U24 DK097748 (TCR), NIH T35 OD010946, an intramural grant from the Department of Pathology, Wake Forest School of Medicine (CAS), and the Pepper Older Americans For Independence Center (P30 AG21332).
Footnotes
Disclosure: The authors declared no conflict of interest.
Additional Supporting Information may be found in the online version of this article.
References
- 1.Stice E, Durant S. Elevated objectively measured but not self-reported energy intake predicts future weight gain in adolescents. Appetite 2014;81:84–88. [DOI] [PMC free article] [PubMed] [Google Scholar]
- 2.Suchanek P, Poledne R, Hubacek JA. Dietary intake reports fidelity–fact or fiction? Neuro Endocrinol Lett 2011;32(suppl 2):29–31. [PubMed] [Google Scholar]
- 3.U.S. Department of Agriculture, Agricultural Research Service. Energy intakes: percentages of energy from protein, carbohydrate, fat, and alcohol, by gender and age. What We Eat in America, NHANES 2013–2014. https://www.ars.usda.gov/ARSUserFiles/80400530/pdf/1314/Table_5_EIN_GEN_13.pdf. Published 2016. Accessed April 6, 2018. [Google Scholar]
- 4.Loh MY, Flatt WP, Martin RJ, Hausman DB. Dietary fat type and level influence adiposity development in obese but not lean Zucker rats. Proc Soc Exp Biol Med 1998;218:38–44. [DOI] [PubMed] [Google Scholar]
- 5.Estruch R, Ros E, Salas-Salvado J, et al. Primary prevention of cardiovascular disease with a Mediterranean diet. N Engl J Med 2013;368:1279–1290. [DOI] [PubMed] [Google Scholar]
- 6.Wagner JD, Cline JM, Shadoan MK, Bullock BC, Rankin SE, Cefalu WT. Naturally occurring and experimental diabetes in cynomolgus monkeys: a comparison of carbohydrate and lipid metabolism and islet pathology. Toxicol Pathol 2001;29:142–148. [DOI] [PubMed] [Google Scholar]
- 7.Shively CA, Register TC, Clarkson TB. Social stress, visceral obesity, and coronary artery atherosclerosis in female primates. Obesity (Silver Spring) 2009;17:1513–1520. [DOI] [PubMed] [Google Scholar]
- 8.Shively CA, Register TC, Appt SE, Clarkson TB. Effects of long-term sertraline treatment and depression on coronary artery atherosclerosis in premenopausal female primates. Psychosom Med 2015;77:267–278. [DOI] [PMC free article] [PubMed] [Google Scholar]
- 9.Powles J, Fahimi S, Micha R, et al. Global, regional and national sodium intakes in 1990 and 2010: a systematic analysis of 24 h urinary sodium excretion and dietary surveys worldwide. BMJ Open 2013;3:e003733. doi: 10.1136/bmjopen-2013-003733 [DOI] [PMC free article] [PubMed] [Google Scholar]
- 10.Bedard A, Riverin M, Dodin S, Corneau L, Lemieux S. Sex differences in the impact of the Mediterranean diet on cardiovascular risk profile. Br J Nutr 2012;108:1428–1434. [DOI] [PubMed] [Google Scholar]
- 11.Kafatos A, Verhagen H, Moschandreas J, Apostolaki I, Van Westerop JJ. Mediterranean diet of Crete: foods and nutrient content. J Am Diet Assoc 2000;100:1487–1493. [DOI] [PubMed] [Google Scholar]
- 12.Cordain L, Eaton SB, Sebastian A, et al. Origins and evolution of the Western diet: health implications for the 21st century. Am J Clin Nutr 2005;81:341–354. [DOI] [PubMed] [Google Scholar]
- 13.Simopoulos AP. Evolutionary aspects of diet, the omega-6/omega-3 ratio and genetic variation: nutritional implications for chronic diseases. Biomed Pharmacother 2006;60:502–507. [DOI] [PubMed] [Google Scholar]
- 14.Jayo JM, Shively CA, Kaplan JR, Manuck SB. Effects of exercise and stress on body fat distribution in male cynomolgus monkeys. Int J Obes Relat Metab Disord 1993;17:597–604. [PubMed] [Google Scholar]
- 15.Yoshimitsu K, Kuroda Y, Nakamuta M, et al. Noninvasive estimation of hepatic steatosis using plain CT vs. chemical-shift MR imaging: significance for living donors. J Magn Reson Imaging 2008;28:678–684. [DOI] [PubMed] [Google Scholar]
- 16.Santos-Lozano A, Santin-Medeiros F, Cardon G, et al. Actigraph GT3X: validation and determination of physical activity intensity cut points. Int J Sports Med 2013;34:975–982. [DOI] [PubMed] [Google Scholar]
- 17.Sullivan EL, Koegler FH, Cameron JL. Individual differences in physical activity are closely associated with changes in body weight in adult female rhesus monkeys (Macaca mulatta). Am J Physiol Regul Integr Comp Physiol 2006;291:R633–R642. [DOI] [PMC free article] [PubMed] [Google Scholar]
- 18.Shively CA, Clarkson TB. Regional obesity and coronary artery atherosclerosis in females: a non-human primate model. Acta Med Scand Suppl 1988;723:71–78. [DOI] [PubMed] [Google Scholar]
- 19.Tirosh A, Shai I, Bitzur R, et al. Changes in triglyceride levels over time and risk of type 2 diabetes in young men. Diabetes Care 2008;31:2032–2037. [DOI] [PMC free article] [PubMed] [Google Scholar]
- 20.Adams MR, Golden DL, Williams JK, Franke AA, Register TC, Kaplan JR. Soy protein containing isoflavones reduces the size of atherosclerotic plaques without affecting coronary artery reactivity in adult male monkeys. J Nutr 2005;135:2852–2856. [DOI] [PubMed] [Google Scholar]
- 21.Appt SE, Chen H, Goode AK, et al. The effect of diet and cardiovascular risk on ovarian aging in cynomolgus monkeys (Macaca fascicularis). Menopause 2010;17: 741–748. [DOI] [PMC free article] [PubMed] [Google Scholar]
- 22.Wagner WD, St Clair RW, Clarkson TB. Angiochemical and tissue cholesterol changes of Macaca fascicularis fed an atherogenic diet for 3 years. Exp Mol Pathol 1978;28:140–153. [DOI] [PubMed] [Google Scholar]
- 23.Dunbar RIM, Shultz S. Why are there so many explanations for primate brain evolution? Phil Trans Soc Lond B Biol Sci 2017;372: 20160244. doi: 10.1098/rstb.2016.0244 [DOI] [PMC free article] [PubMed] [Google Scholar]
- 24.Coelho DF, Pereira-Lancha LO, Chaves DS, et al. Effect of high-fat diets on body composition, lipid metabolism and insulin sensitivity, and the role of exercise on these parameters. Braz J Med Biol Res 2011;44:966–972. [DOI] [PubMed] [Google Scholar]
- 25.Carreiro AL, Dhillon J, Gordon S, et al. The macronutrients, appetite, and energy intake. Annu Rev Nutr 2016;36:73–103. [DOI] [PMC free article] [PubMed] [Google Scholar]
- 26.Alfenas RC, Mattes RD. Effect of fat sources on satiety. Obes Res 2003;11:183–187. [DOI] [PubMed] [Google Scholar]
- 27.Strik CM, Lithander FE, McGill AT, MacGibbon AK, McArdle BH, Poppitt SD. No evidence of differential effects of SFA, MUFA or PUFA on post-ingestive satiety and energy intake: a randomised trial of fatty acid saturation. Nutr J 2010;9:24. doi: 10.1186/1475-2891-9-24 [DOI] [PMC free article] [PubMed] [Google Scholar]
- 28.Lissner L, Levitsky DA, Strupp BJ, Kalkwarf HJ, Roe DA. Dietary fat and the regulation of energy intake in human subjects. Am J Clin Nutr 1987;46:886–892. [DOI] [PubMed] [Google Scholar]
- 29.Argueta DA, DiPatrizio NV. Peripheral endocannabinoid signaling controls hyperphagia in western diet-induced obesity. Physiol Behav 2017;171:32–39. [DOI] [PMC free article] [PubMed] [Google Scholar]
- 30.la Fleur SE, van Rozen AJ, Luijendijk MC, Groeneweg F, Adan RA. A free-choice high-fat high-sugar diet induces changes in arcuate neuropeptide expression that support hyperphagia. Int J Obes (Lond) 2010;34:537–546. [DOI] [PubMed] [Google Scholar]
- 31.Srisai D, Gillum MP, Panaro BL, et al. Characterization of the hyperphagic response to dietary fat in the MC4R knockout mouse. Endocrinology 2011;152:890–902. [DOI] [PMC free article] [PubMed] [Google Scholar]
- 32.Titchenal CA. Exercise and food intake. What is the relationship? Sports Med 1988;6:135–145. [DOI] [PubMed] [Google Scholar]
- 33.King NA, Snell L, Smith RD, Blundell JE. Effects of short-term exercise on appetite responses in unrestrained females. Eur J Clin Nutr 1996;50:663–667. [PubMed] [Google Scholar]
- 34.Anania C, Perla FM, Olivero F, Pacifico L, Chiesa C. Mediterranean diet and nonalcoholic fatty liver disease. World J Gastroenterol 2018;24:2083–2094. [DOI] [PMC free article] [PubMed] [Google Scholar]
- 35.Singh RK, Chang HW, Yan D, et al. Influence of diet on the gut microbiome and implications for human health. J Transl Med 2017;15:73. doi: 10.1186/s12967-017-1175-y [DOI] [PMC free article] [PubMed] [Google Scholar]
- 36.Nagpal R, Shively CA, Appt SA, et al. Gut microbiome composition in non-human primates consuming a Western or Mediterranean diet. Front Nutr 2018;5:28. doi: 10.3389/fnut.2018.00028 [DOI] [PMC free article] [PubMed] [Google Scholar]
- 37.Shively CA, Register TC, Appt SE, et al. Consumption of Mediterranean versus Western diet leads to distinct mammary gland microbiome populations. Cell Rep 2018;25:47–56.e3. [DOI] [PMC free article] [PubMed] [Google Scholar]
- 38.Velasco N, Contreras A, Grassi B. The Mediterranean diet, hepatic steatosis and nonalcoholic fatty liver disease. Curr Opin Clin Nutr Metab Care 2014;17:453–457. [DOI] [PubMed] [Google Scholar]
- 39.Ryan MC, Itsiopoulos C, Thodis T, et al. The Mediterranean diet improves hepatic steatosis and insulin sensitivity in individuals with non-alcoholic fatty liver disease. J Hepatol 2013;59:138–143. [DOI] [PubMed] [Google Scholar]
- 40.Torgerson DJ, Torgerson CJ. The limitations of before and after designs. Designing Randomised Trials in Health, Education and the Social Sciences: An Introduction. London: Palgrave Macmillan; 2008:9–16. [Google Scholar]
- 41.Darmon N, Drewnowski A. Does social class predict diet quality? Am J Clin Nutr 2008;87:1107–1117. [DOI] [PubMed] [Google Scholar]
- 42.Cavaliere A, De Marchi E, Banterle A. Exploring the adherence to the Mediterranean diet and its relationship with individual lifestyle: the role of healthy behaviors, pro-environmental behaviors, income, and education. Nutrients 2018;10:141. doi: 10.3390/nu10020141 [DOI] [PMC free article] [PubMed] [Google Scholar]
- 43.Mamalaki E, Anastasiou CA, Ntanasi E, et al. Associations between the Mediterranean diet and sleep in older adults: results from the Hellenic Longitudinal Investigation of Aging and Diet study. Geriatr Gerontol Int 2018;18:1543–1548. [DOI] [PubMed] [Google Scholar]
- 44.Ruggiero E, Di Castelnuovo A, Costanzo S, et al. Socioeconomic and psychosocial determinants of adherence to the Mediterranean diet in a general adult Italian population. Eur J Public Health 2019;29:328–335. [DOI] [PubMed] [Google Scholar]
- 45.Zurita-Ortega F, San Roman-Mata S, Chacon-Cuberos R, Castro-Sanchez M, Muros JJ. Adherence to the Mediterranean diet is associated with physical activity, self-concept and sociodemographic factors in university student. Nutrients 2018;10:966. doi: 10.3390/nu10080966 [DOI] [PMC free article] [PubMed] [Google Scholar]
Associated Data
This section collects any data citations, data availability statements, or supplementary materials included in this article.