

Abstract
Botanical dietary supplements (BDS) are used around the world for many purported therapeutic properties. The selection of an authentic product and it’s phytochemical characterization is critical to generate robust safety data. Because botanicals are complex mixtures with variable quality, identification of a representative product for testing has been challenging. Echinacea is used for its purported immune stimulant properties and was listed as the 2nd top-selling BDS in 2018. However, there are limited safety data for Echinacea. Hence, the National Toxicology Program (NTP) has selected Echinacea for safety testing using rodent models. Here, we describe selection and comprehensive characterization of an Echinacea purpurea root extract to be used in the NTP testing program. Using non-targeted chemical analyses combined with chemometric analysis, a potential unfinished product (i.e., an extract that serves as source material for finished products) of Echinacea purpurea was selected. The product was then authenticated using chemical and DNA techniques and characterized, including the phytochemical composition. Among numerous constituents identified, caftaric acid, chicoric acid, chlorogenic acid and dodeca-2(E),4(E),8(Z),10(E/Z)-tetraenoic acid isobutylamide made up a small fraction of the extract. Based on these analyses, an approach is proposed for test article selection for Echinacea research which can be adapted to other botanicals.
Keywords: Echinacea purpurea, botanical dietary supplements, phytochemical characterization, constituents
Introduction
Botanical dietary supplements (BDS) are purported to have therapeutic properties and hence are a key component of traditional and complementary medicine around the world (Wachtel-Galor and Benzie, 2011). In the U.S., dietary supplements, which include BDS, are defined as products that are intended to supplement the diet and are regulated by the Food and Drug Administration (FDA) via the provisions of the Federal Food Drug and Cosmetic Act. Congress passed the Dietary Supplement Health and Education Act (DSHEA) which established a regulatory framework for safety and claims for dietary supplements (http://health.gov/dietsupp/ch1.htm). According to DSHEA, products containing dietary ingredients in commerce prior to 1994 do not require notification to the FDA. Manufacturers are required to notify the FDA of any new dietary ingredient (NDI) prior to marketing. This notification is required to include the history of use or other evidence (e.g., published literature and unpublished toxicological or clinical studies) that the NDI, when taken under the suggested or recommended conditions on the label, is reasonably safe. However, this notification does not necessarily require manufacturers to demonstrate the pre-market safety of NDIs in combination with other ingredients used prior to 1994. Currently, there is no published guidance for safety testing or history of use for NDIs. The safety of these products is dependent upon the FDA enforcing current good manufacturing practices to ensure quality, potency, and identity of dietary supplements. The FDA acts to remove an unsafe or mislabeled product from the market following post-marketing adverse event reporting by the manufacturer or the public (https://www.fda.gov/food/dietarysupplements/default.htm). To keep up with the rapid growth in the industry, the FDA created the Office of the Dietary Supplement Programs in 2015, under the Center for Food Safety and Applied Nutrition. Recently, FDA announced the agency’s goal to implement one of the most significant modernizations of dietary supplement regulation and oversight in more than 25 years (https://www.fda.gov/NewsEvents/Newsroom/PressAnnouncements/UCM631065.htm).
BDS are manufactured from plant materials and hence are complex mixtures with a large number of constituents making up the phytochemical composition There are many sources of variation in the composition of a given botanical which pose a challenge for both industry and regulators to maintain a high level of product quality (Barnes et al., 2005; Ryan et al., 2019; Shipkowski et al., 2018). In 2018, sales of BDS in the U.S. alone surpassed $8 billion, a record 9.4% increase from 2017 (Smith et al., 2019). Today, there are a plethora of BDS on the market. According to the National Institute of Health’s Dietary Supplement Label Database (DSLD), there are over 27,000 products in the botanical ingredient category (NIH, 2019). A National Health Information Survey conducted in 2012 reported that approximately 18% of the U.S population used nonvitamin, nonmineral dietary supplements (Clarke et al., 2015). Because BDS are used widely by people of all ages, the safety of these products is of utmost importance. However, currently, there is a paucity of safety data available for these products. To fill data gaps, the National Toxicology Program (NTP) has been investigating BDS safety using in vitro assays and in vivo studies in rodent models following both short- and long-term exposure (https://ntp.niehs.nih.gov/results/areas/botanical/index.html; Rider et al., 2018).
Echinacea is a popular botanical ingredient used for its purported immune stimulant properties that illustrates the many challenges inherent in evaluating the safety of BDS products. There are 11 species within the genus Echinacea of which 3 (E. purpurea, E. pallida and E. angustifolia) are currently employed medicinally in the US (Barnes et al., 2005). Echinacea was the 2nd top-selling BDS in mainstream outlets (e.g., grocery and drug stores) in 2018 with sales over $110 million (Smith et al., 2019). Consumer spending on Echinacea increased approximately 15% from 2017 to 2018. Over 500 Echinacea-containing products are listed in the DSLD (NIH, 2019). These products include tablets, extracts, and teas made using a variety of plant parts including roots, aerial parts, flowers or combinations thereof of Echinacea species and combination products that include other botanicals (e.g., goldenseal, elderberry).
Although E. purpurea, E. pallida and E. angustifolia belong to the same genus, they do not have the same phytochemical composition and there are potential differences in their effect profiles (Barnes et al., 2005; Senchina et al., 2005; USP, 2015). The biologically-active constituents of Echinacea are believed to be polyacetylenes, polysaccharides, alkamides, and phenolics (e.g., caftaric acid, chlorogenic acid, caffeic acid, cynarin, echinacoside and chicoric acid), the composition of which may vary depending on the species, the plant part used in the preparations, and other environmental conditions (AHP, 2004; Barnes et al., 2005). For example, the phenolic constituent profile (chicoric acid, caftaric acid and chlorogenic acid) in E. purpurea are similar in roots, flowers, and aerial parts, with cyanarin and echinacoside being low or absent. The roots of E. angustifolia have low amounts of chicoric acid and cynarin while E. pallida root has both chicoric acid and cynarin with echinacoside being a major constituent in both species. Alkamides are found in the roots of E. angustifolia; however, alkamides are less abundant in E. purpurea and are absent in E. pallida (AHP, 2004; Barnes et al., 2005). The United States Pharmacopeia (USP) recommendation for the standardization of Echinacea is based on the total phenol content (USP, 2015). For example, the standardized extract of powdered E. purpurea root, aerial part or a mixture of them should contain not less than 4.0% of total phenols, calculated as the sum of caftaric acid, chicoric acid, and chlorogenic acid, on a dried basis; it should contain not less than 0.025% of dodecatetraenoic acid isobutylamides (USP, 2015). There has been reports of potential economically-motivated adulteration and/or contamination of Echinacea with roots of other plant species such as Parthenium integrifolium, Eryngium aquaticum, Rudbeckia nitida etc (Zhang et al., 2017).
Despite widespread use of Echinacea over the years, there are significant knowledge gaps in the safety of products containing Echinacea (Barrett, 2003). Studies in rats and mice suggest that acute toxicity of Echinacea species is quite low (Mengs et al., 1991). Interestingly, oral consumption of Echinacea during pregnancy has been associated with fetal loss in 2 strains of mice (Barcz, 2007; Chow et al., 2006); albeit, other literature suggests there is not enough information to understand the risks for use during pregnancy (Gallo and Koren, 2001). However, a recent study conducted on a large population of Norwegian women and their children showed lack of adverse pregnancy outcomes associated with the use of Echinacea during pregnancy (Heitmann et al., 2016). Echinacea has been implicated to have effects on drug metabolizing enzymes, although there are inconsistencies between studies in terms of induction versus inhibition (Awortwe et al., 2015; Meng and Liu, 2014; Mooiman et al., 2014; Ryan et al., 2019; Yale and Glurich, 2005). In order to address the knowledge gaps, the NTP is evaluating the toxicity/safety of Echinacea using a combination of in vitro assays and in vivo studies, in rodent models, following both short- and long-term exposure (https://ntp.niehs.nih.gov/results/areas/botanical/index.html). The NTP selected E. purpurea root extract as the botanical ingredient to test.
The use of an appropriate and quality botanical product is key to generate robust safety data that can be compared widely across studies and used to evaluate risk. However, due to the complexity of botanicals and variability of products in the marketplace, selection of a quality product for safety assessment has been a key challenge. At the present time, there aren’t any well-established strategies or standards followed by researchers when selecting a product for testing. The research community has recognized this deficiency, which has driven recommendations for more systematic evaluation of the products prior to use in testing. For example, a recent review provides recommendations from researchers in the Natural Product Drug Interaction Center on characterization and selection of botanical materials for study (Kellogg et al., 2019). Furthermore, the National Center for Complementary and Integrative Health (NCCIH) recently put forth the Natural Product Integrity Policy which provides guidance to NCCIH-funded researchers on the characterization of botanical products to ensure quality and reproducibility of botanical research (Kuszak et al., 2016). Recently, the concept of ‘sufficient similarity’ was applied to BDS to either 1) screen various products to identify a representative product that resembles either a high-quality finished product or a reference material or 2) compare a ‘tested product’ to nominally-related products in the marketplace such that the toxicological findings from the tested product can be extrapolated to other products on the market place to determine safety (Catlin et al., 2018; Ryan et al., 2019).
This investigation describes the selection and characterization of an E. purpurea root extract to be used in NTP research. As mentioned previously, there are a wide variety of finished products for Echinacea in the market and testing of each product is not feasible. The product selected should be available in a large quantity to be used in research over the projected testing period and suitable to be formulated in a vehicle to administer in animals. Hence, multiple unfinished (unformulated) products (i.e., bulk extract that serves as source material for finished products) were evaluated, with the assumption that they adequately represent finished (formulated) products in the market. All commercially available Echinacea reference materials and some finished products representing what humans are exposed to, were also included in the analyses. A combination of non-targeted and targeted analytical approaches was utilized along with the concept of sufficient similarity (Catlin et al., 2018) to identify a potential E. purpurea root extract for testing. The selected extract was subsequently characterized comprehensively, including phytochemical composition, using a variety of analytical techniques. Additionally, the stability of the extract was determined with respect to selected marker constituents to ensure the suitability of the material for research over the testing period.
Materials and Methods
Procurement
A variety of Echinacea products including unfinished material (i.e., bulk extracts that serve as source material for finished products), finished products (i.e., commercially available Echinacea tablets, capsules etc.), and reference materials (e.g., E. purpurea root extract XRM™ (XRM)) were procured. A total of 13 unfinished products from 8 suppliers, 5 finished products from 5 suppliers, and 6 commercially available reference materials for Echinacea from one supplier (ChromaDex, Irvine, CA) were procured (Table 1). Echinacea constituents and potential adulterants were procured from several sources (Table S1). Samples were stored at either room temperature or −20 °C and standards were stored at −20 °C.
Table 1.
Echinacea samples procured
| Samplea | Sample ID | Type of Sampleb | Supplier |
|---|---|---|---|
| Echinacea purpurea root extract XRMTM c | 1 | Reference material | 1 |
| Echinacea purpurea root VBRM | 2 | Reference material | 1 |
| Echinacea purpurea leaf and stem VBRM | 3 | Reference material | 1 |
| Echinacea purpurea flowers VBRM | 4 | Reference material | 1 |
| Echinacea angustifolia root VBRM | 5 | Reference material | 1 |
| Echinacea pallida root VBRM | 6 | Reference material | 1 |
| Echinacea purpurea root | 7 | Unfinished product | 2 |
| Echinacea purpurea root | 8 | Unfinished product | 2 |
| Echinacea purpurea herb | 9 | Unfinished product | 3 |
| Echinacea purpurea herb | 10 | Unfinished product | 4 |
| Echinacea purpurea herb | 11 | Unfinished product | 5 |
| Echinacea purpurea extract | 12 | Unfinished product | 6 |
| Echinacea purpurea extract | 13 | Unfinished product | 7 |
| Echinacea purpurea root | 14 | Unfinished product | 6 |
| Echinacea purpurea extract | 15 | Unfinished product | 7 |
| Echinacea purpurea extract | 16 | Unfinished product | 8 |
| Echinacea purpurea extract | 17 | Unfinished product | 8 |
| Echinacea purpurea extract | 18 | Unfinished product | 9 |
| Echinacea purpurea extract | 19 | Unfinished product | 9 |
| Echinacea powder | 20 | Finished product | 10 |
| Echinacea purpurea | 21 | Finished product | 11 |
| Echinacea purpurea root | 22 | Finished product | 12 |
| Echinacea purpurea root | 23 | Finished product | 13 |
| Echinacea purpurea root | 24 | Finished product | 14 |
According to CoA or package labelling.
Reference material indicates a standardized material; unfinished indicates a bulk material; finished indicates a capsule or tablet form.
XRM™, certified root extract reference material; VBRM, vouchered botanical reference material. All reference materials were obtained from ChromaDex, Irvine, CA.
Instrumentation
HPLC Methods 1 and 2:
Agilent 1200 (Santa Clara, CA) high performance liquid chromatograph (HPLC) coupled to a charged aerosol detector (CAD) (Method 1) or an ultraviolet (UV) detector at 254 nm (Method 2) was used with a Phenomenex Gemini C18 column (250 × 4.6 mm, 5 μm) (Torrance, CA). Mobile phases A (0.1% aqueous trifluoroacetic acid, TFA) and B (0.1% TFA in acetonitrile) were used at 1 mL/min and with a slow linear gradient of (% B): 10–18, in 9 min, 18–30 in 5 min, 30–80 in 31 min, and 80–100 in 2 min.
Mass Spectrometry Method 1.
A Waters Acquity 1-Class (Milford, MA) ultra-high-performance liquid chromatograph (UPLC) (used in the high-performance mode) coupled to an AB Sciex TripleTOF 5600 time of flight (TOF) mass spectrometer (MS) (Toronto, Canada) was used with a Phenomenex Gemini C18 column (250 × 4.6 mm, 5 μm) (Torrance, CA). Mobile phases A (1% formic acid in water) and B (1% formic acid in acetonitrile) were used at a flow rate of 1 mL/min. The following linear gradient was run (% B): 10 to 18 in 9 min, 18 to 30 in 5 min, 30 to 80 in 31 min, 80 to 100 in 2 min. The Turboionspray ion source was operated in positive ion mode with a spray voltage of 5500 V and source temperature of 700 °C. The mass spectrometer was scanned from m/z 50 to 2000 with information-dependent acquisition (IDA) MS/MS from m/z 20 to 2000. In IDA mode, the instrument was operated in full scan MS mode until peaks over 50 counts per second were detected; MS/MS product ion spectra of peaks detected were then acquired, and then resumed to MS mode. This allowed for both MS and MS/MS spectra of sample to be acquired.
Mass Spectrometry Method 2:
A Shimadzu Prominence LC (Kyoto, Japan) coupled to an API 4000 quadrupole MS (Ontario, Canada) was used with a Phenomenex Gemini C18 column (250 × 4.6 mm, 5 μm,) (Torrance, CA). Mobile phases A (1% formic acid in water) and B (1% formic acid in acetonitrile) were used at a flow rate of 1 mL/min. The following linear gradient was run (%B): 5 for 5 min, 5 to 18 in 5 min, 18 for 5 min, 18 to 70 in 3 min, 70 to 90 in 17 min and held at 90 for 6 min. The turboionspray ion source was operated in negative ion mode with a spray voltage of −4500 V and source temperature of 400 °C. The mass spectrometer was scanned from m/z 50 to 1000 and data were acquired in MS mode.
Mass Spectrometry Method 3:
The instrumentation and conditions used were similar to Mass Spectrometry Method 2 except the following. A linear gradient was run with (%B): 10 to 18 in 9 min, 18 to 30 in 5 min, 30 to 80 in 31 min, 80 to 100 in 2 min. The turboionspray ion source was operated in negative ion mode from 0 to 27 min with a spray voltage of −4500 V for all analytes except from 27–60 min for DTA-IBA where it was operated in positive ion mode with a spray voltage of 5500 V. The transitions monitored for quantitation were: caftaric acid, m/z 311 → 179; chlorogenic acid, m/z 353 → 191; echinacoside, m/z 785 → 161; 1,3-dicaffeoylquinic acid, m/z 515 →353; chicoric acid, m/z 473 →311; DTA-IBA, m/z 248 →167.
Non-targeted chemical analysis using HPLC-CAD
A 0.5 g aliquot of unfinished products, finished products (e.g., capsules) (except sample 24 where 0.25 g was used inadvertently), XRM, or 5 g of vouchered botanical reference material (VBRM) of Echinacea samples as listed in Table 1 were extracted as follows. To all samples, ethanol:water:trifluoroacetic acid (TFA) (60:40:0.1) was added such that the final extraction volume was ~ 20 mL. Samples were extracted by vortexing for 5 min, sonicating for 20 min, followed by rotating end over end at 70 rpm overnight (16–20 h). Samples were centrifuged at ~ 1600 g for 5 min, supernatants were diluted to 25 mL using the same solvent as above and filtered through 0.45-μm PFTE filter. Standards of Echinacea constituents (1–6) listed on Table S1 were also prepared at 1000 μg/mL in the same extraction solvent as above. Standards were combined and diluted to make a combined solution at 167 μg/mL per each analyte. All samples and standards were analyzed using HPLC Method 1. Standards were interspersed throughout the analytical runs to check for retention time variability and allow for peak alignments (see below).
The HPLC-CAD chromatograms were imported as time and response pairs into SpecAlign (v2.4.1, University of Oxford, England) for preprocessing. The chromatograms were cropped from 3.7 to 46 min to remove the components eluting in the void volume and those during column flushing. An average chromatogram was generated using all individual chromatograms and was used as the reference to align the individual chromatograms. Standards of known Echinacea constituents were used to constrain the movement of alignment software. The aligned chromatograms were exported as comma separated variable (CSV) files containing time and response pairs, into the Eigenvector Research Solo (v8.5.1, Manson, WA,) chemometrics software for principal component analysis (PCA), in which a dataset is transformed into a set of orthogonal variables that account for the greatest degree of variability in the data.
Using the HPLC-CAD data, the concentration of constituents in samples were also estimated from the average response factor for a single concentration of selected Echinacea constituent standards. The percent of each constituent in samples was estimated on a per weight basis using the peak area, the average response factor of the combined standard, the extract volume, and the weight of sample extracted. It should be noted that these are estimates based on a single solvent standard.
Chemical fingerprinting using high performance-thin layer chromatography (HP-TLC)
E. purpurea root extract sample 7, which was selected as the potential E. purpurea root extract lot (see Results), was analyzed, along with the XRM (sample 1) (Table 1) for chemical fingerprinting by 3 independent laboratories: Alkemist Labs (Lab 1, Costa Mesa, CA), USBSL (Lab 2, Candler, NC), Labs-Mart (Lab 3, Farmington Hills, MI). Sample preparation and analysis by each laboratory are presented in Table S2.
DNA barcoding
E. purpurea root extract samples 1 and 7 were analyzed by 3 independent laboratories: DNA4 technologies (Lab A) (Halethorpe, MD); NSF AuthenTechnologies (Lab B) (Richmond, CA); and Molecular Epidemiology Inc. (Lab C) (Lake Forest Park, WA). Sample preparation and analyses for each laboratory are presented in Table S3.
Contaminant analysis
E. purpurea root extract samples 1 and 7 were analyzed to determine the presence/absence of heavy metals (antimony, arsenic, cadmium, lead, and mercury), pesticides (a panel of 310 compounds), mycotoxins (aflatoxins, ochratoxin, and zearalenone), aerobic plate count, Salmonella, E. coli, Staphylococcus enterotoxins (Covance Laboratories, Madison, WI). Covance Laboratories utilized validated and/or standardized methods and analyses were conducted per laboratory operating protocols (https://www.covance.com).
Comprehensive characterization of E. purpurea root extract
Based on a combination of the above analyses, sample 7 was chosen as a potential unfinished product (see Results). The sample was taken through a series of additional analyses to ensure the suitability of the lot for NTP research and testing (Table S4). Some analyses were also conducted on sample 1 (XRM) for comparison.
The first set of analyses included weight loss by drying, total inorganic content (determined as ash), elemental analysis, nutritional analysis (fat, carbohydrate, and protein content), and in some cases were conducted by more than one laboratory (Battelle, Columbus, OH; Covance Laboratories, Madison, WI; Eurofins Scientific Inc, Des Moines, IA) to ensure the quality and consistency of data (Table S4).
Identification of E. purpurea constituents by mass spectrometry:
Constituents were identified using Mass Spectrometry Methods 1 and 2. Aliquots (~ 40 mg) of sample 7 were extracted with 1 mL of water:methanol:formic acid (80:20:0.1) by sonicating for ~ 30 min. Samples were centrifuged and the supernatant was filtered through a 0.45 μM filter. Extraction blanks were also prepared similarly. All samples were analyzed by Mass Spectrometry Method 1 in positive ion mode. The data were searched in Sciex metabolite library (MS/MS) and the XCMS Online METLIN libraries (MS and MS/MS) to identify peaks. Peaks ≥ 1.5 larger in the Echinacea extract than in the blank and with ≥ 6 signal-to-noise ratios were selected for identification. The METLIN library match criteria were set at mass defect of 5 ppm and both the large MS library (using the full scan data) and smaller MS/MS library (using the IDA MS/MS data) were searched. The exact masses of known Echinacea constituents were also manually searched for in the data. For the manual search, a peak matching the [M+H]+ ion within 0.002 Da was considered a match.
For analysis by Mass Spectrometry Method 2, aliquots (~ 200 mg) of sample 7 were extracted with 8 mL of ethanol:water (60:40) by sonicating for ~ 20 min. Samples were centrifuged and the supernatant was combined with 0.1 mL of formic acid to a final volume of 10 mL. Blanks (without Echinacea sample) were also prepared similarly. Standards of potential Echinacea constituents (Table S1) were prepared at 1 mg/mL in methanol:water:formic acid (70:30:1), with the exception of dodeca-2E,4E-dienoic acid isobutylamide and chicoric acid, which were prepared at 0.5 mg/mL in 1:1 ethanol:water (50:50): methanol:water:formic acid (70:30:1). The standards were further diluted with ethanol:water:formic acid (60:40:1) to a final concentration of 200 μg/mL, with the exception of dodeca-2E,4E-dienoic acid isobutylamide, and chicoric acid, where the final concentration was 100 μg/mL. All samples, blanks, and standards were analyzed in MS mode as outlined in methods under Mass Spectrometry Method 2 in negative ion mode. Constituents in sample were identified based on a combination of retention time and MS spectral matching with the standards.
Quantitation of E. purpurea constituents by HPLC-CAD and LC-MS/MS:
Based on the findings from analyses by Mass Spectrometry Methods 1 and 2 and commercial availability of standards, 6 constituents were selected for quantitation by two methods.
In the first method HPLC-CAD (HPLC Method 1) was used in combination with standard addition method (Meija et al., 2014). Briefly, the method involves spiking of the sample with standards of analytes to be quantified at approximately 0 (unspiked), 1x, 2x, and 4x of the expected concentration based on preliminary analysis. From data, a linear regression was generated which was subsequently used to calculate the concentration of analytes in unspiked sample (Table S5). Individual standards of chicoric acid, caftaric acid, chlorogenic acid, 1,3-dicaffeoylquinic acid, echinacoside, and dodeca-2(E),4(E), 8(Z),10(E/Z)-tetraenoic acid isobutylamide (DTA-IBA) were made in solvent (ethanol:water:TFA, 60:40:0.1) at 10,000, 4,000, 2,000, 1,000, 1,000, and 2,000 μg/mL, respectively. Combined standard solution for chlorogenic acid, 1,3-dicaffeoylquinic acid, echinacoside, and DTA-IBA was made in the same solvent from individual standards for final concentration of 600, 150, 150, and 600 μg/mL, respectively. Four sets of E. purpurea root extract samples 7 and 1 (200 ± 5 mg) were prepared in duplicate. The standard solutions (or solvent alone for unspiked sample) were added to each tube as given in Table S5. Samples were mixed and allowed to sit for ~ 30 min. Eight milliliter of solvent was added to each sample, vortexed for 5 min and sonicated for 20 min followed by end-over-end rotation overnight. Samples were centrifuged ~ 1900 g for 5 min and the supernatants were transferred to 10-mL volumetric flasks. Pellets were extracted twice with an additional 1 mL each of solvent and supernatants were combined with the original supernatant. The flasks were brought to volume with the solvent and mixed well. An aliquot from each sample was filtered through 0.45-μm syringe filter and analyzed by HPLC Method 1. A linear regression equation was calculated relating the detector response (y) to the spiked concentration (x) of each standard in the sample. The regression equation was solved for the absolute value of the x-intercept, which is equivalent to the concentration of the compound in the unspiked sample.
In the second method LC-MS/MS (Mass Spectrometry Method 3) was used. Combined standards of chicoric acid, caftaric acid, chlorogenic acid, 1,3-dicaffeoylquinic acid, echinacoside, and DTA-IBA were made at 50, 75, 100, 200, 300 and 500 ng/mL, with respect to each constituent in solvent (ethanol:water:formic acid, 60:40:1. To duplicate samples of E. purpurea root extract (sample 7, 500 mg each), 20 mL of solvent was added and extracted as above for HPLC-CAD method. The supernatants were transferred to 25-mL volumetric flasks and the flasks were brought to volume with the solvent and mixed well. An aliquot from each sample was filtered through 0.45-μm syringe filter, diluted if needed, and analyzed by Mass Spectrometry Method 3. A linear 1/x weighted regression equation was calculated relating the detector response (y) to the nominal standard concentration. The concentration of each analyte in sample was calculated using its individual response ratio, the regression equation, and any dilution factors, when applicable. For both methods, the calculated concentration, dilution volume, and the initial weight of E. purpurea extract was used to estimate the weight percent of each constituent in the E. purpurea root extract.
Storage stability of bulk E. purpurea root extract
To ensure that the material is stable while in storage during research and testing activities, a stability assessment, including accelerated stability studies at 60 °C. Aliquots of samples were stored in sealed amber glass vials at 60, 5, −20 °C, and at ambient temperature for up to 20 d. The appearance of each sample was noted before and after storage. At the end of the storage period, triplicate aliquots (200 mg) from each vial were extracted with 3 mL water containing 10 μL trifluoroacetic acid. Samples were extracted using a combination of vortex mixing (5–10 min), sonication (~ 20 min) followed by shaking using a wrist action shaker (~ 30 min). Six milliliters of ethanol were added and the same mixing procedure was followed. To each sample, 1 mL of coumaric acid (2 mg/mL) in ethanol:water:trifluoroacetic acid (60:40:0.1) was added as an internal standard, samples were mixed and centrifuged for ~ 5 min at ~1900 g. An aliquot of the supernatant was filtered through a 0.45-μm PTFE filter and analyzed by HPLC Method 1 for three representative E. purpurea constituents (caftaric acid, chicoric acid, and DTA-IBA). The response factor for each constituent at each storage condition was estimated by dividing the peak area for the analyte by the internal standard peak area normalized to the sample weight used. The average response factor for samples at a given storage temperature was compared to that at −20 °C as the reference (the best-case scenario) using the student’s t-test.
Results
Non-targeted chemical analysis of Echinacea samples
Data from non-targeted chemical analysis of Echinacea samples were compared. Sample identifiers are given in Table 1. HPLC-CAD aligned chromatograms of combined standards and reference materials are given in Figure 1A. A visual comparison showed that chromatographic profiles of E. purpurea reference samples were similar (samples 1–4) and were different from those of E. angustifolia (sample 5) and E. pallida (sample 6). Chromatographic profiles of E. purpurea root extract reference material, XRM (sample 1), and unfinished products (samples 7–19) are given in Figure 1B. Profiles of samples 8, 9, 12, 14 are visually different from the XRM (sample 1) with lower intensity of peaks present. Profiles of 7,10, 11, 13, 15, 16, 18, and 19 are similar to each other and to the E. purpurea XRM. The chromatogram of sample 17 has an additional cluster of peaks between 17 to 19 min that were not evident in the reference material. Of the finished products, only samples 21 and 23 showed similar chromatographic patterns to XRM (Figure 1C).
Figure 1.
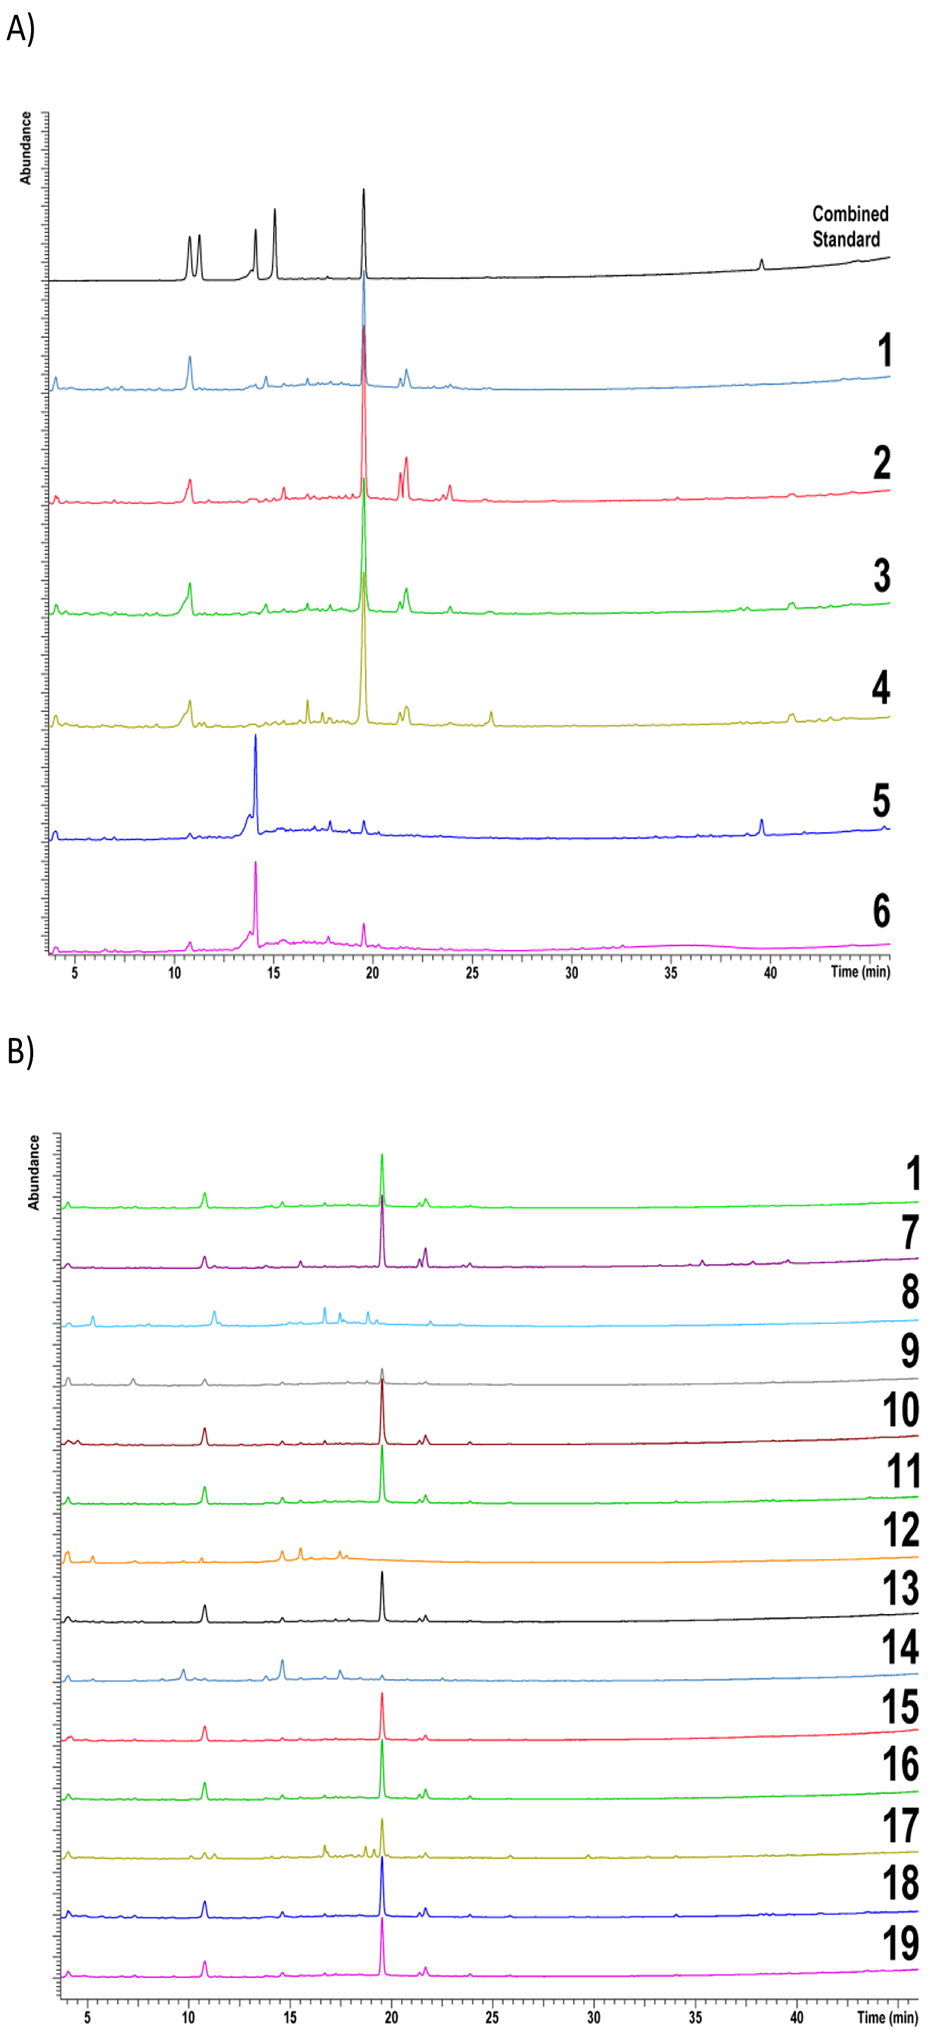
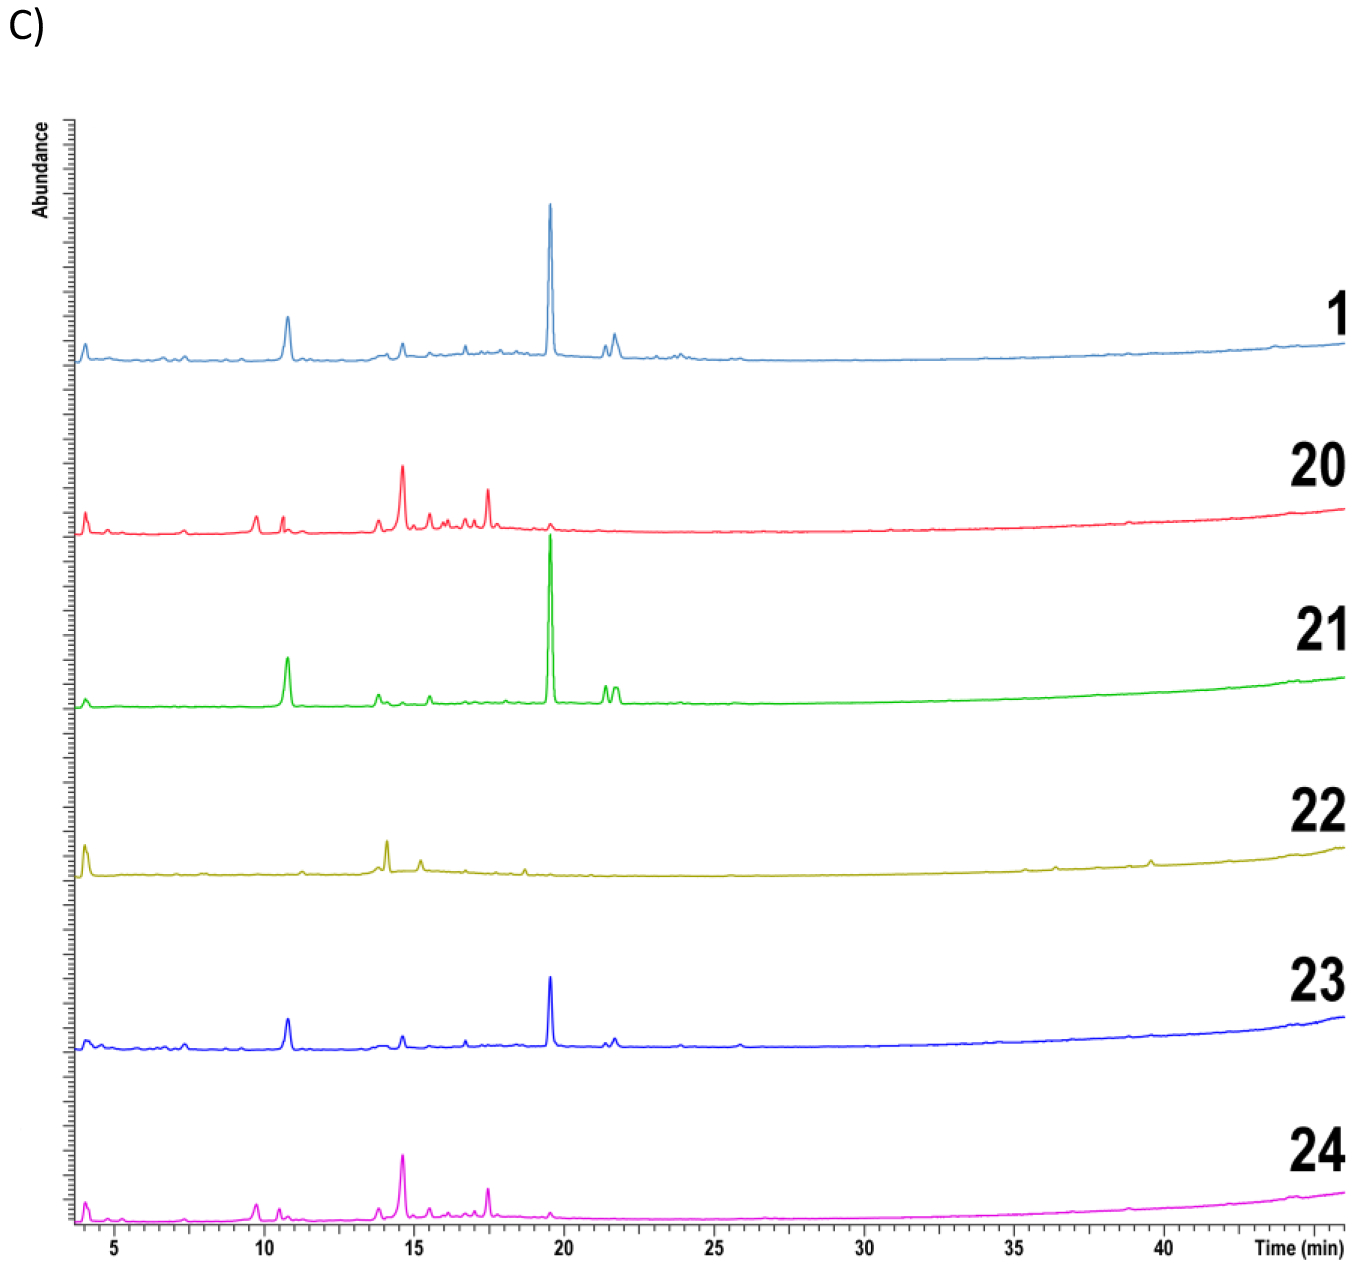
HPLC-CAD aligned chromatograms of A) standards and reference materials B) reference material for E. purpurea root extract and unfinished products C) reference material for E. purpurea root extract and finished products. Samples include reference materials (1–6), unformulated products (7–19) and formulated products (20–24). The key for sample numbers is found in Table 1.
The PCA 2-dimensional (2D) score plot from chemometric analysis of non-targeted data is shown in Figures 2A, 2B and Figure S1. A visual inspection of plots revealed that all E. purpurea reference materials (samples 1–4) clustered together; reference materials of E. angustifolia (5) and E. pallida (6) grouped outside the 95% confidence interval ( 95% CI) (blue ellipse) of E. purpurea reference materials. Unfinished products 7, 11, 16, 17, and 18 fell within the 95% CI ellipse for E. purpurea reference materials (1–4) in all 2D plots; samples 8, 9, 12, and 14 did not cluster with reference materials and hence are either potentially adulterated or not E. purpurea. Unfinished materials 9, 10, 13, 15, and 19 fell within the 95% confidence ellipse for the E. pururea reference materials in one or two of the PCA plots and hence are also potentially adulterated E. purpurea. Of the finished products, only sample 21 clustered with the potential E. purpurea samples and reference materials in all 2D plots (Figures 2A, 2B and S1). Finished product sample 23 fell within the 95% confidence ellipse in one of the PCA plots and was just outside in the other two, indicating it may also be adulterated E. purpurea.
Figure 2.
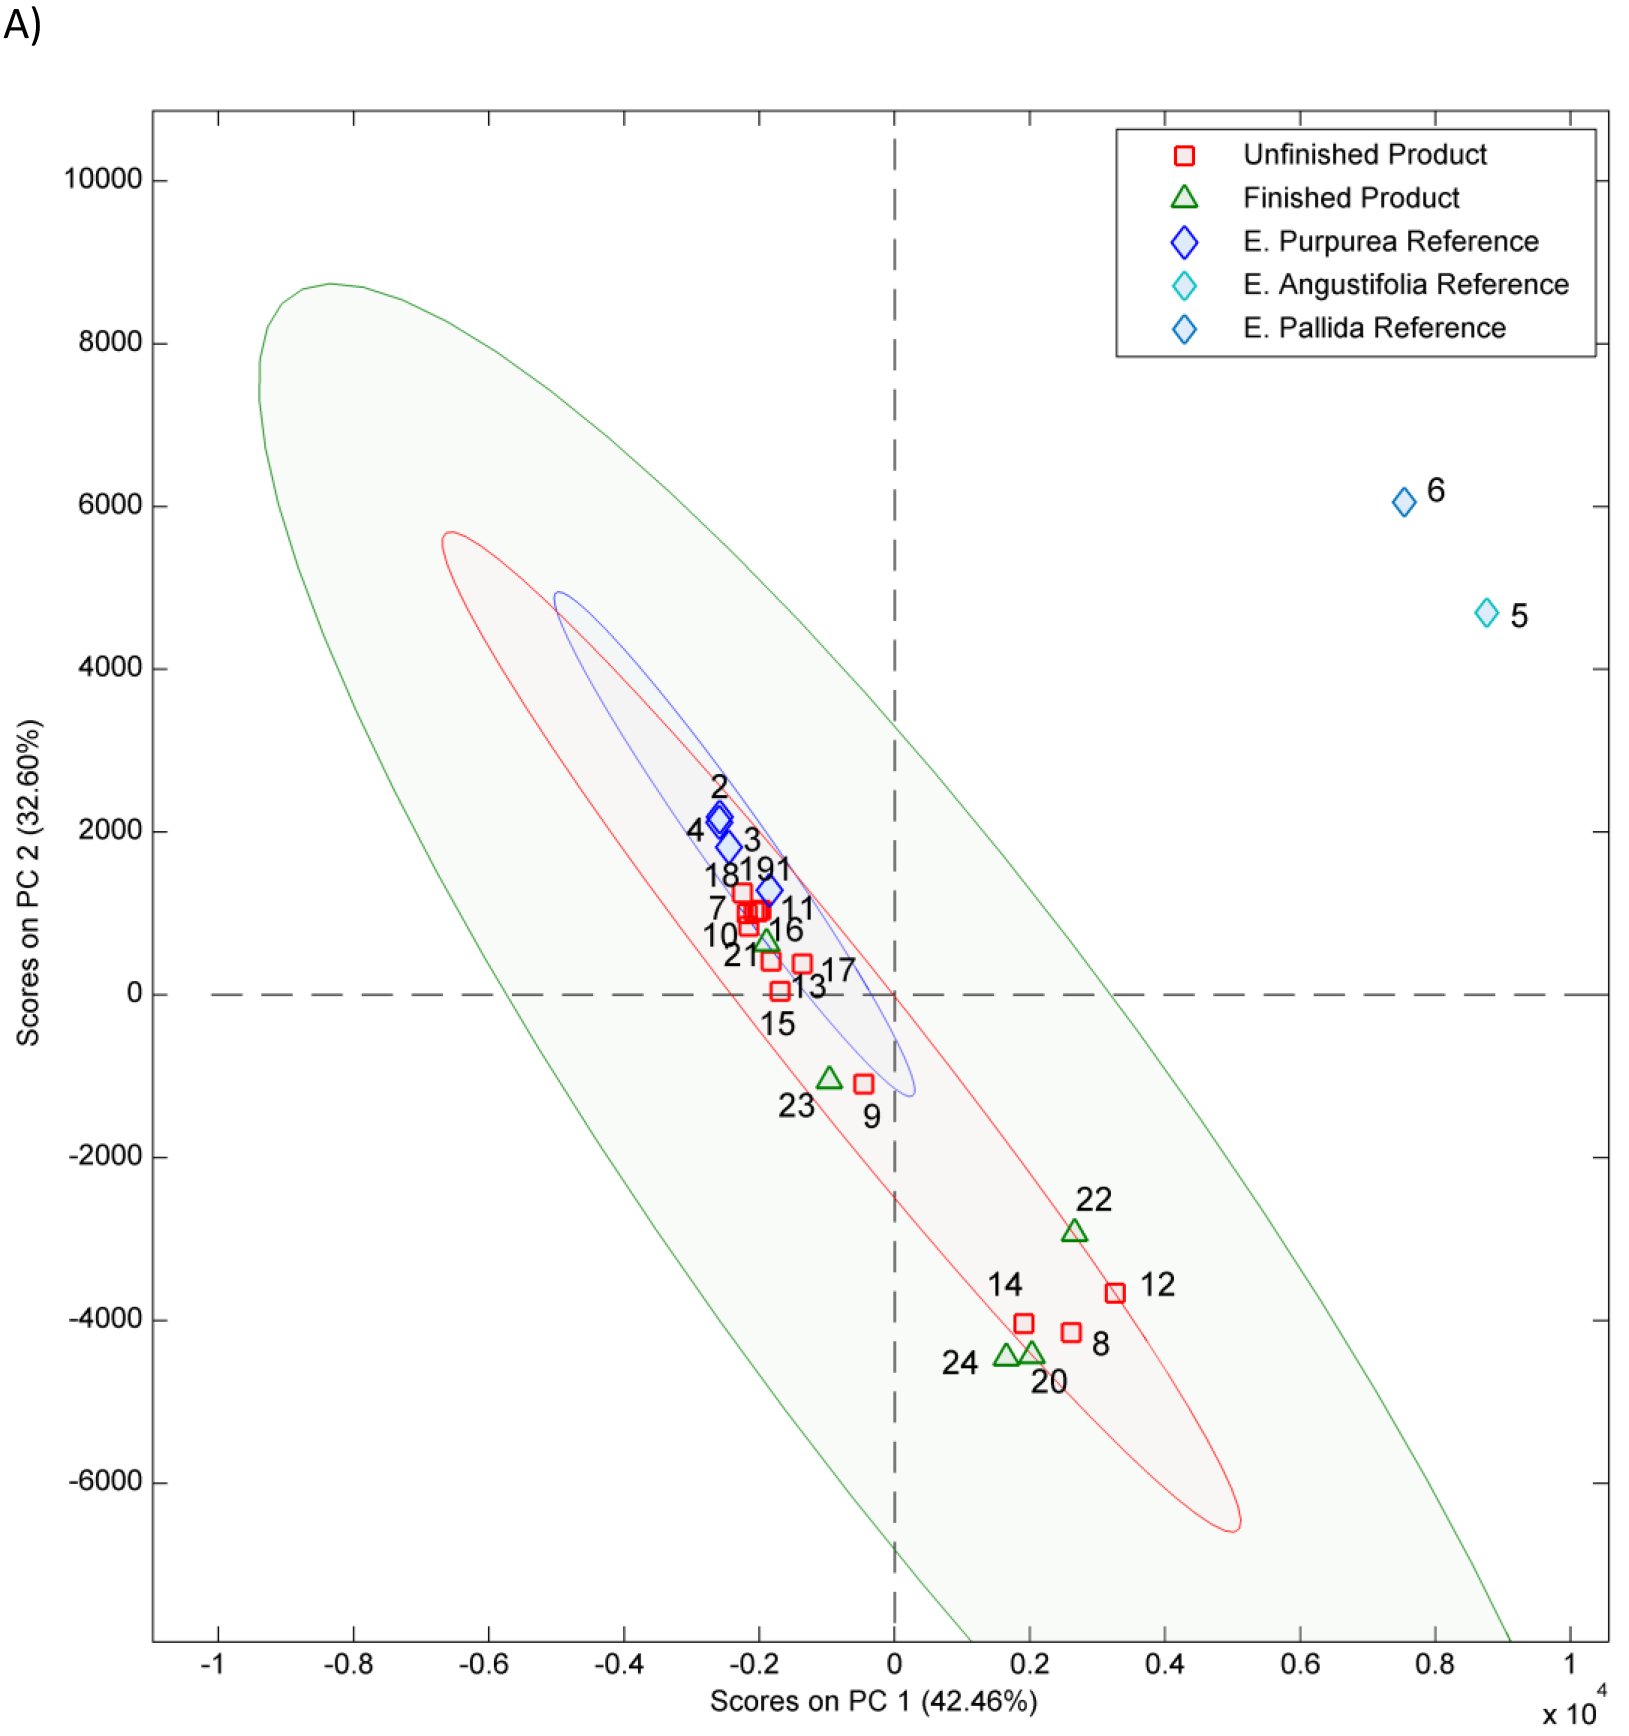
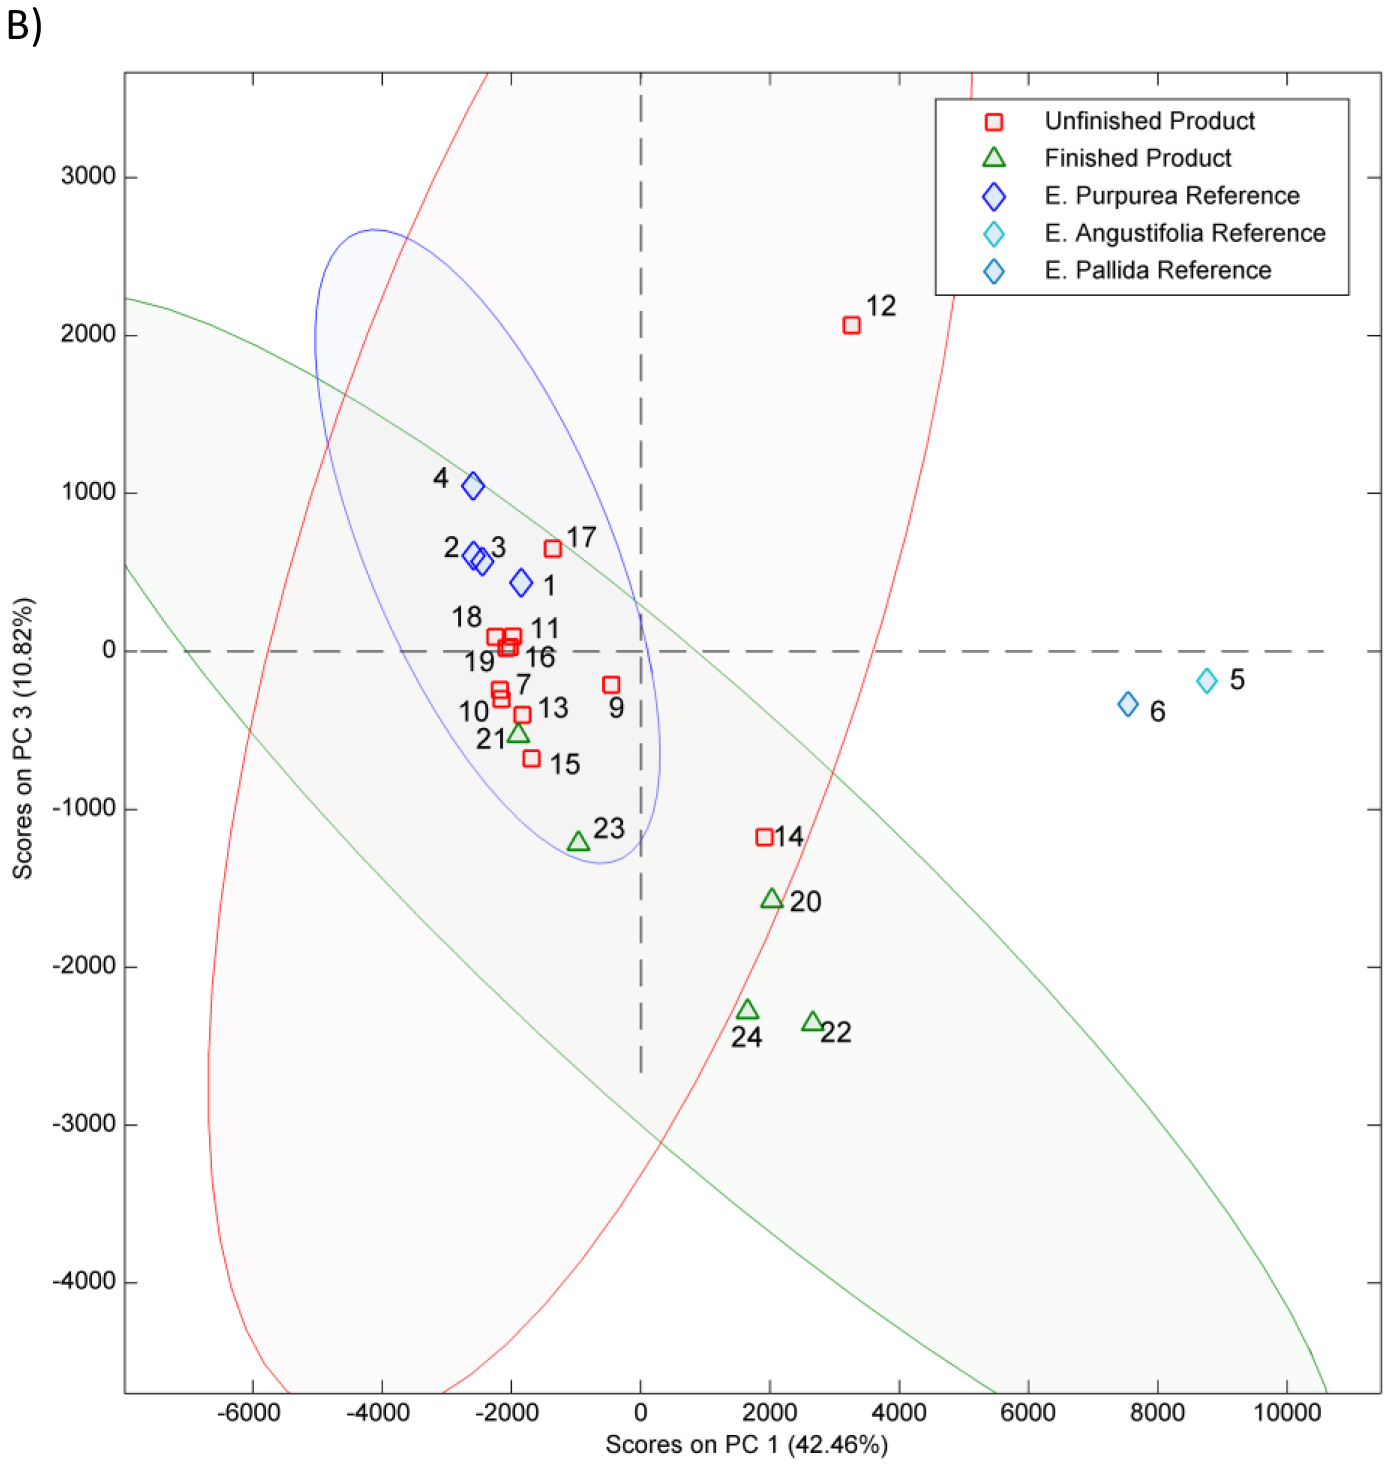
Principal component (PC) analysis 2-dimensional score plots A) PC1 versus PC2 B) PC1 versus PC3 of HPLC-CAD non-targeted data for Echinacea samples. Peaks were aligned using SpecAlign (University of Oxford, England) and the plot was generated using Solo v8.5.1 software (Eigenvector Research, Manson, WA). Each point represents a single Echinacea sample. Samples include reference materials (1–6), unformulated products (7–19) and formulated products (20–24). The 95% confidence intervals for the E. purpurea reference materials (blue ellipse), unformulated products (red ellipse) and formulated products (green ellipse) are shown. For sample 24 half the amount of the product was used inadvertently. The key for sample numbers is given in Table 1.
HPLC-CAD data were also evaluated with respect to levels of 6 Echinacea-specific constituents. The percent of each constituent in the samples was estimated per weight basis (Table S7). It should be noted that these estimates are based on quantifying against a single solvent standard but provide a meaningful way to compare across different samples. The data are given in Figure 3A as a stacked plot and in Figure 3B as a PCA score plot. For PCA, only two principal components were used since they accounted for 95% of the variance. Although the pattern of constituents was similar visually in all E. purpurea reference materials (1–4), the % constituent levels in XRM (sample 1), were higher than those in VBRMs (2–4) (Figure 3A) likely due the extract being a concentrate compared to the powdered plant materials. As expected, the constituent pattern and levels in E. pallida (sample 5) and E. angustifolia (sample 6) VBRMs was different from that of the E. purpurea VBRMs (samples 2–4) (Figure 3A). The constituent levels and pattern between unfinished products of E. purpurea (samples 7–19) varied significantly (Figure 3A). For example, samples 8, 9, 12, and 14 have significantly lower total constituent levels; sample 17 also has lower total constituent levels and, in addition, has higher levels of chlorogenic and echinacoside than sample 1. Based on the PCA score plot of constituent levels, samples 7, 10, 11, 13, 15,16, 17, 18, and 19 fell in the same quadrant as the E. purpurea root XRM (sample 1) with samples 13, 15, and 17 being less similar; samples 8, 9, 12, and 14 did not (Figure 3B). Of the finished products, only sample 21 fell in the same quadrant as the E. purpurea XRM (Figures 3B).
Figure 3.
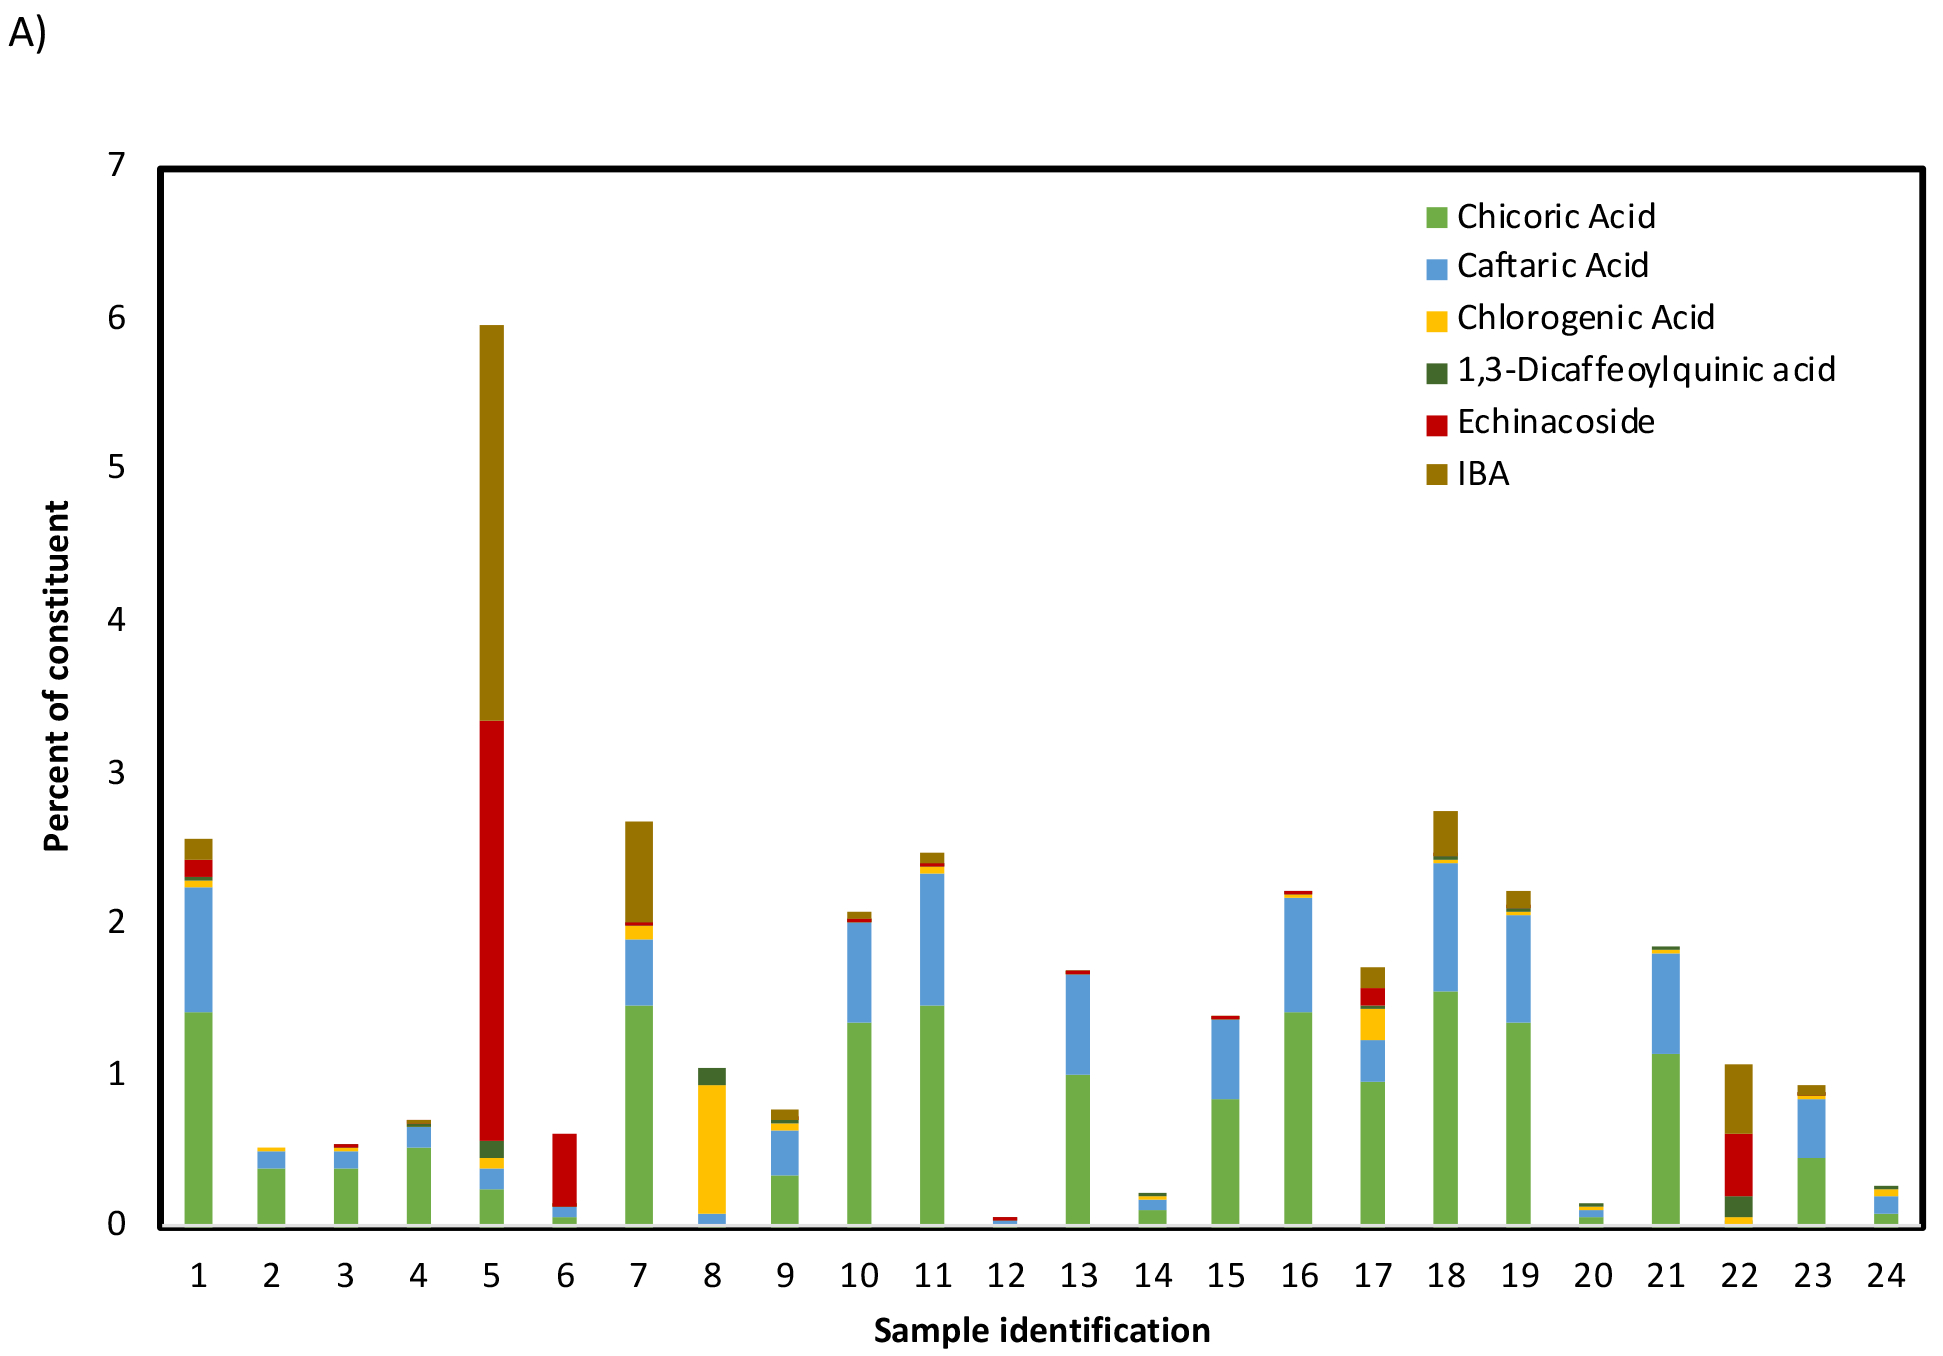
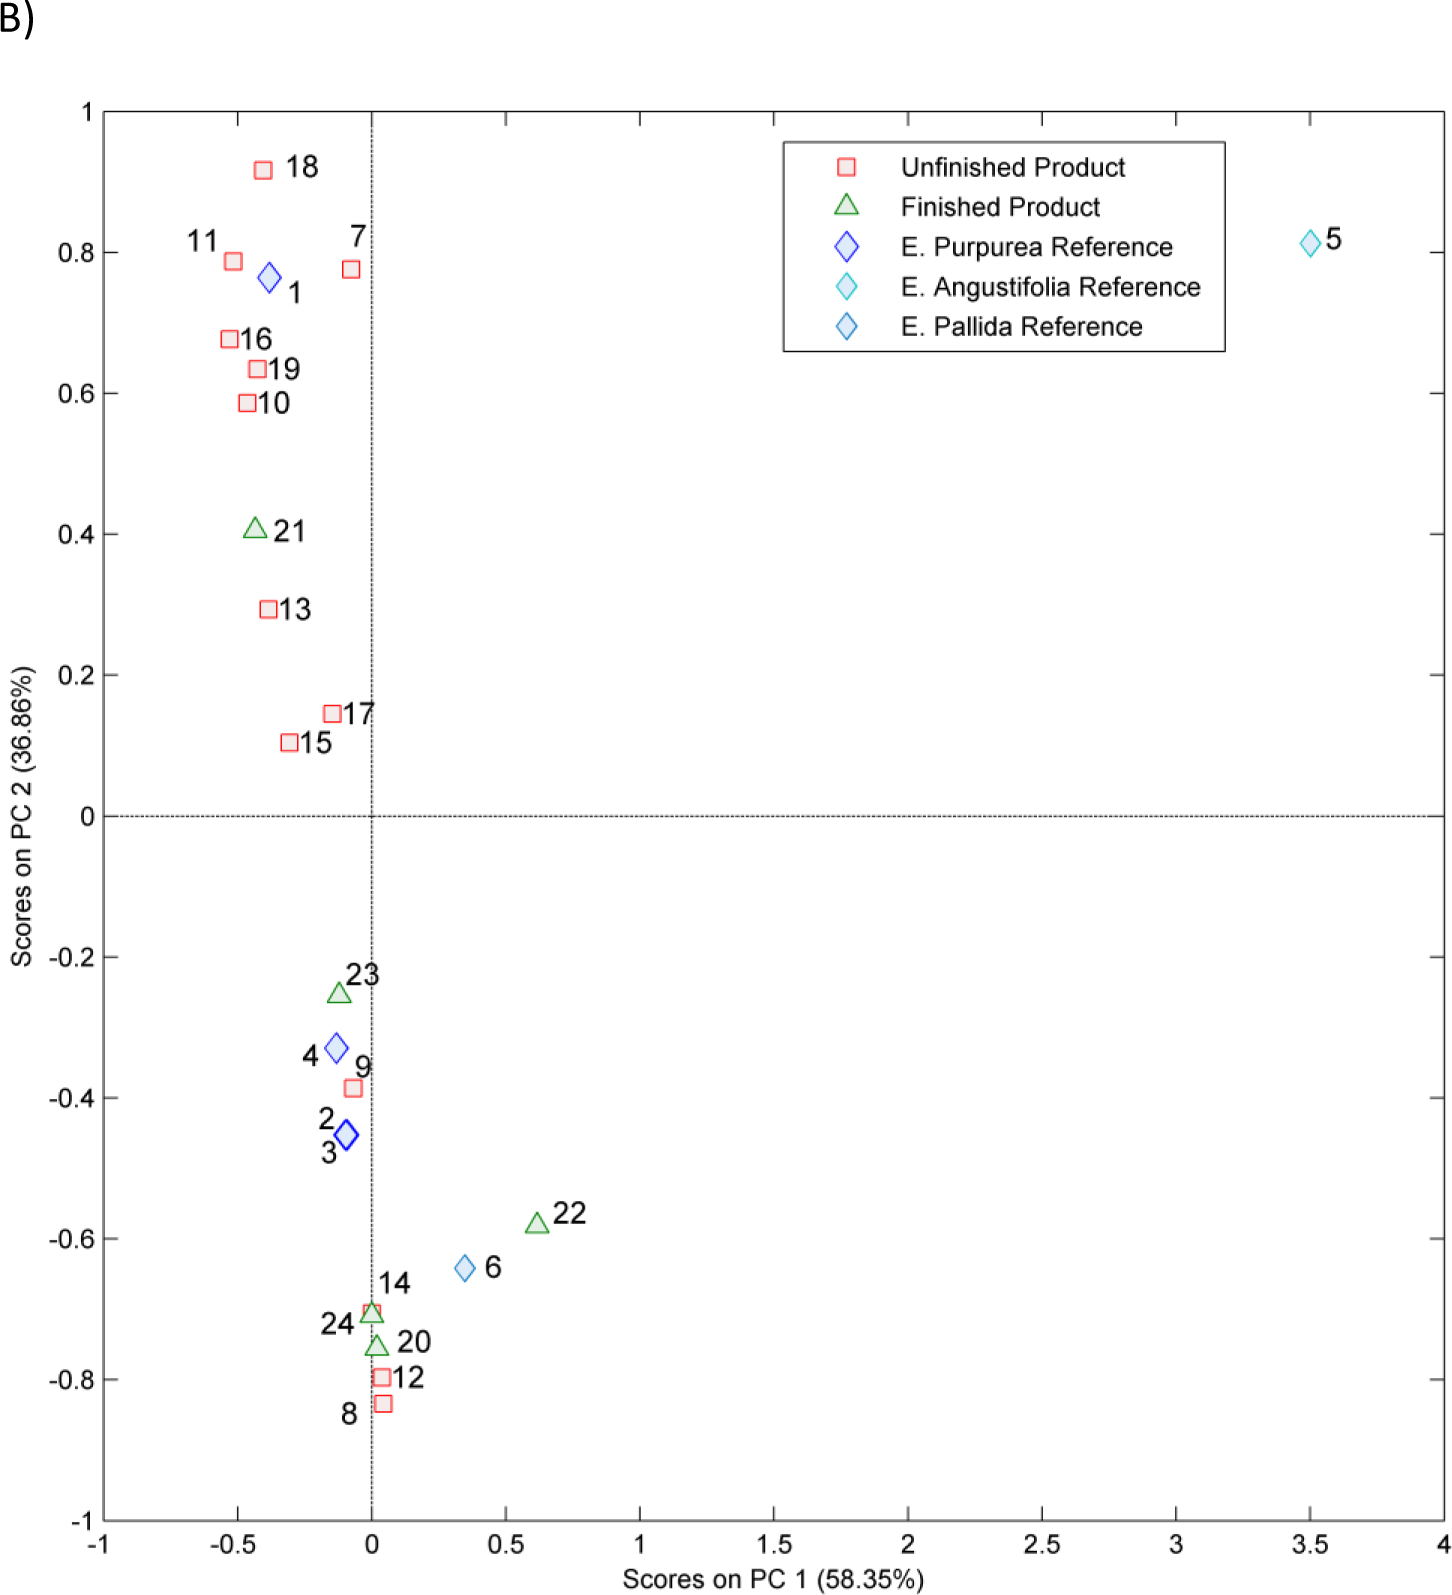
Percent (w/w) of Echinacea constituents estimated in nontargeted analysis using a single solvent calibration given as A) stacked plot and B) Principal component analysis score plot. Samples include reference materials (1–6), unformulated products (7–19) and formulated products (20–24). For sample 24 half the amount of the product was used inadvertently. Each column or point represents a single Echinacea sample. The key for sample numbers is given in Table 1.
Based on these visual assessments of HPLC-CAD data, unfinished products 7, 10, 11, 16, 18, and 19 were sufficiently similar to each other and to E. purpurea reference materials (samples 1–4), while samples 8, 9, 12, and 14 were different. Samples 13, 15, and 17 may be similar to E. purpurea. From the potential E. purpurea samples, samples 10, 11, 16, 18, and 19 were E. purpurea herb powders or extracts and hence were eliminated from further consideration. Sample 7, which was an E. purpurea root extract, was selected as the potential test material for further evaluation.
Contaminant analysis
Sample 7 was analyzed for contaminants and data are shown in Table 2. Sample 1, the XRM, was included for comparison. Aerobic plate count, which is used as an indicator of bacterial contamination, in sample 7 was <10 CFU/g and in XRM was 1000 CFU/g. The assays for Salmonella, E. coli, Staphylococcus enterotoxins were negative in both samples. Of the heavy metals analyzed, only arsenic, cadmium, and lead were detected in sample 7 and arsenic and lead were detected in sample 1, but were below the threshold limits for BDS of 5 ppm, 0.3 ppm, and 10 ppm, respectively in both samples (WHO, 2007; AHPA, 2009). Of the 310 pesticides screened, in sample 7, only 6 were detectable (0.011–0.28 ppm) above the limits of quantitation of assays; all were below the threshold limit values.
Table 2.
Contaminant analysis of E. purpurea root extract (sample 7) and root extract reference material (XRM, sample 1)a
| End point | Sample 7 | Sample 1 (XRM) |
|---|---|---|
| Microbes | ||
| Aerobic plate count (CFU/g) | < 10 | 1000 |
| E. coli (CFU/g) | < 10 | < 10 |
| Salmonella (per 25 g) | Negative | Negative |
| Staphylococcus enterotoxins (per 25 g) | Negative | Negative |
| Mycotoxins (ppb) | ||
| Aflatoxins (B1, B2, G1, G2) | < 1.0 | < 1.0 |
| Ochratoxin | < 1.0 | < 1.0 |
| Zearalenone | < 10.0 | < 10.0 |
| Heavy metals (ppb) | ||
| Antimony | < 10.0 | < 10.0 |
| Arsenic | 129 | 60.3 |
| Cadmium | 12.9 | < 10.0 |
| Lead | 36.4 | 144 |
| Mercury | < 10.0 | < 10.0 |
| Pesticide screen (ppm)b | ||
| Carbaryl | < 0.01 | 0.026 |
| Chlorpropham | 0.057 | < 0.01 |
| Difencoconazole | 0.079 | < 0.01 |
| Epoxiconazole | 0.011 | < 0.01 |
| Pendimethalin | 0.091 | < 0.01 |
| Phenylphenol, 2- (OPP) | 0.016 | 0.016 |
| Trifloxystrobin | 0.28 | < 0.01 |
Analyses were conducted by Covance Laboratories (Madison, WI, https://www.covance.com/)
Panel included 310 pesticides. Typical limits of detection (LOD) were 0.01, 0.02, or 0.05 ppm. Only the analytes above LOD are shown.
HP-TLC analysis
Chemical fingerprinting on sample 7 and 1 was conducted using HP-TLC by 3 independent laboratories. Multiple laboratories were selected to increase the confidence in the decision. Detection at 365 nm shows compounds with double bonds (e.g., flavonoids, polyphenols and phenolcarboxylic acids). The plates in some cases were also treated with the Natural Product Reagent, 2-aminoethyl diphenylborate; this treatment enhances fluorescence of these compounds and subsequently the detection.
Data from Lab 1 is shown in Figure 4A with (right panel) and without (left panel) treatment with Natural Product Reagent. In the right panel, Echinacea sample 7 (lane 5) is similar to that of the testing laboratory E. purpurea root reference standard (lanes 2 and 3) with respect to the number and retention factor (Rf) of analytes; the main bands at Rf ~ 0.4 and 0.8 match chicoric and caftaric acid standards (lane 8). Similarity in the intensity of bands suggests similar concentrations of constituents in sample 7 and the testing laboratory E. purpurea root extract reference sample. The pattern of sample 7 (lane 5) does not match with the reference materials of E. angustifolia (lane 6) or E. pallida (lane 7); echinacoside (Rf ~ 0.2) and cynarin, are either absent or low in sample 7 confirming the absence of E. angustifolia or E. pallida in sample 7. The XRM (sample 1, lane 4) is similar to the testing lab E. purpurea root extract standard (lanes 2 and 3) and sample 7 and is different from patterns for E. angustifolia (lane 6) or E. pallida (lane 7). There are intense bands for chicoric and caftaric acid with low levels of echinacoside. Untreated plate (Figure 4A, left panel) shows additional bands in reference sample 1; there is an intense band Rf ~ 0.5 that is minimal in testing lab’s E. purpurea reference material (lanes 2 and 3) and a smear of compounds close to the origin (Rf ~ 0–0.2). In addition, there is a red band at top of the untreated plate (Figure 4A, left panel), which is not present on the treated-plate, (Figure 4A, right panel) indicative of presence of chlorophyll.
Figure 4.
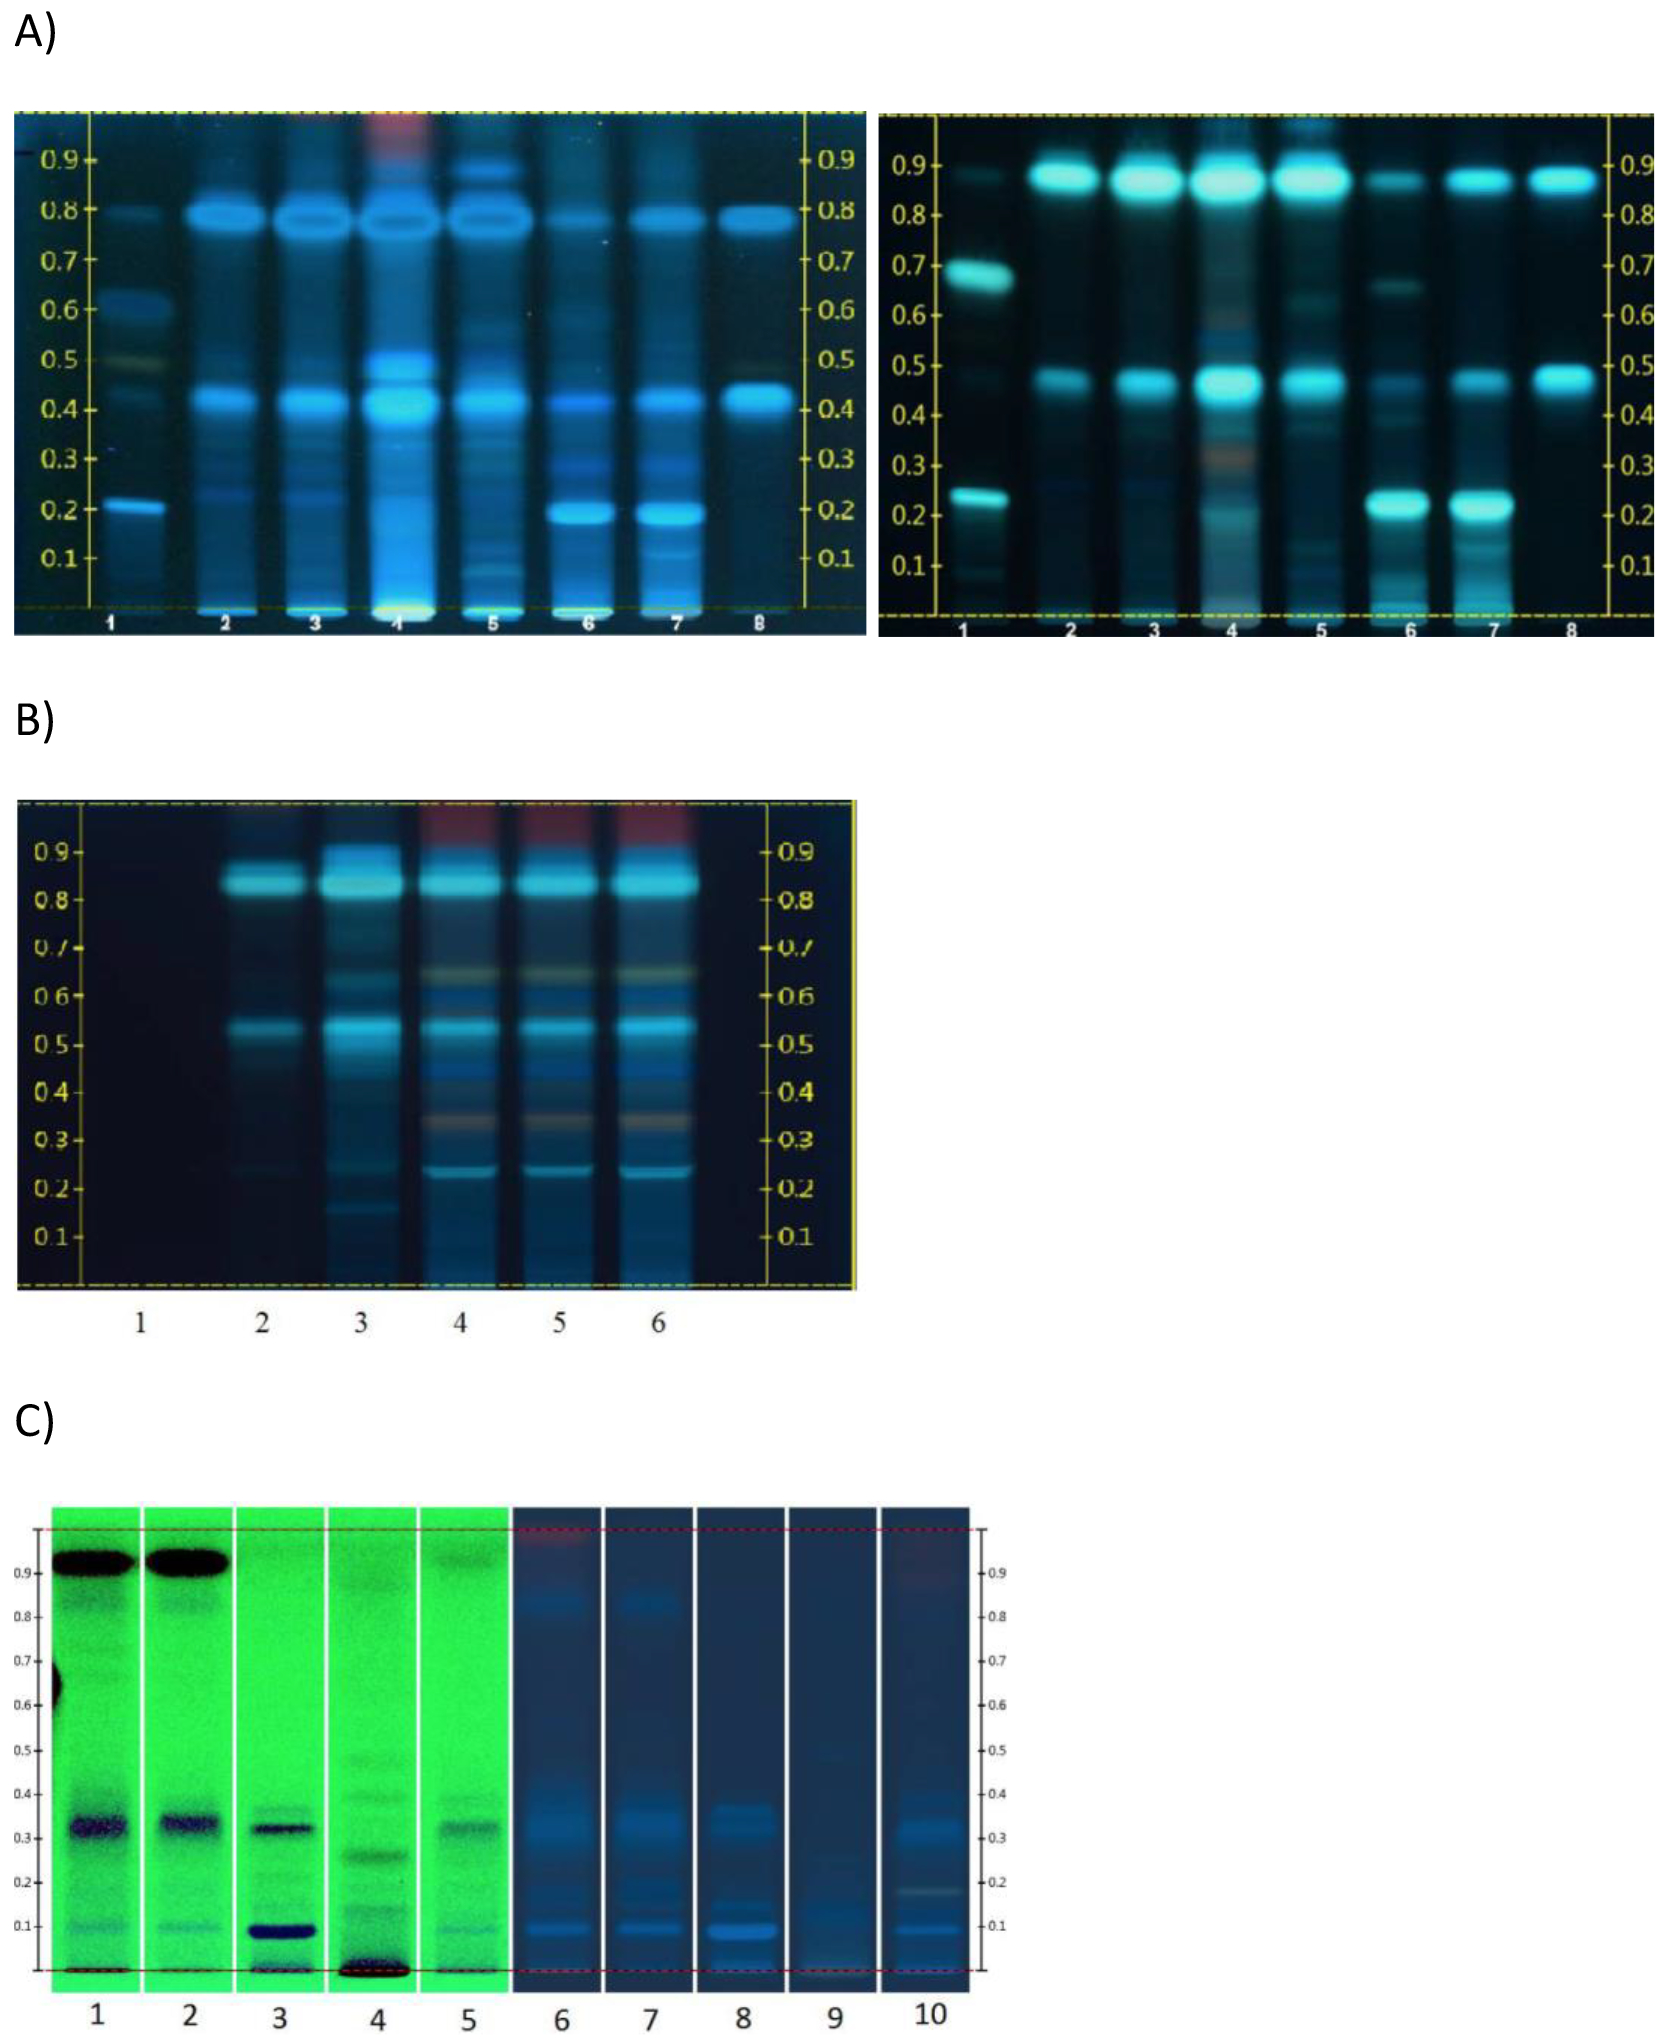
HP-TLC analysis by 3 independent laboratoriesa A) Lab 1 (left panel, UV detection at 365 nm; right panel, plates treated with Natural Product Reagent followed by UV detection at 365 nm) B) Lab 2 (UV detection at 366 nm) and C) Lab 3 (lanes 1–5, UV detection at 365 nm; lanes 6–10, UV detection at 254 nm)
a Lab 1 lane designation: 1. echinacoside and cynarin; 2 and 3. 2 or 4 μL testing lab E. purpurea root extract reference standard; 4. XRM (sample 1); 5. test lot (sample 7) 6. testing lab E. angustifolia root extract standard; 7. testing lab E. pallida root extract standard; 8. caftaric and chicoroc acid.
Lab 2 lane designation: 1. chichoric acid; 2. testing lab E. purpurea root extract standard; 3. test lot (sample 7); 4–6. XRM (sample 1).
Lab 3 lane designation: 1. testing lab E. purpurea root extract reference standard; 2. test lot (sample 7); 3. testing lab E. angustifolia root reference standard; 4. testing lab E. purpurea flower standard; 5.XRM (sample 1); 6. testing lab E. purpurea root extract reference standard; 7. test lot (sample 7); 8. testing lab E. angustifolia root reference standard; 9. testing lab E. purpurea flower standard; 10. XRM (sample 1); 1–5; UV 254 nm. 6–10, UV 366 nm.
Based on the analysis by Lab 2 (Figure 4B), the pattern for sample 7 (lane 3) is very similar to the testing lab reference standard for E. purpurea root (lane 2), with a higher intensity likely due to concentration difference in the two samples. In the chromatogram, a band was absent for the chicoric acid standard (lane 1); unfortunately, an explanation was not provided by the testing lab. The pattern for XRM (sample 1, lanes 4–6), was similar to the testing lab E. purpurea root reference standard and sample 7, with characteristic bands including caftaric and chicoric acids. Extra bands were observed at Rf ~ 0.35 and ~0.95.
Analysis by Lab 3 is shown in Figure 4C. The pattern and major bands in sample 7 (lanes 2 and 7) are similar to the testing lab’s E. purpurea root reference standard (lanes 1 and 6) and different from that of E. angustifolia root reference standard (lanes 3 and 8). Testing lab standards for E. purpurea flower (lanes 4 and 9) are different from E. purpurea root (lanes 1 and 6). The data supports that sample 7 is characteristic of E. purpurea root extract. The major bands in the XRM (sample 1, lanes 5 and 10) are similar to those of testing lab’s E. purpurea root standard (lanes 1 and 6), but with lower intensity demonstrating that XRM is characteristic of E. purpurea root extract. Taken together, the analyses by the 3 laboratories confirm that sample 7 is characteristic of E. purpurea root extract.
DNA barcoding
Multiple laboratories were selected to increase confidence in the data. Lab A reported that there was no evidence of Echinacea in sample 7. However, they also concluded that there was insufficient DNA present in both samples 1 and 7; PCR amplification could not be achieved using a universal primer. For this reason, the data from Lab A should be considered inconclusive. Lab B used specific primers for DNA amplification and found that both sample 7 and sample 1 contained E. purpurea. This analysis did not include any testing for other Echinacea species or potential adulterants. Lab C used specific primers for DNA amplification. Analysis confirmed the presence of E. purpurea (97–99%) and absence of E. angustifolia in sample 7. The laboratory did not have primers available to detect other Echinacea species. Similarly, Lab C confirmed the presence of E. purpurea (96–99%) and absence of E. angustifolia in sample 1, the XRM.
Comprehensive characterization and stability of E. purpurea root extract sample
Based on above analyses, sample 7 was selected as a potential lot for comprehensive characterization. Per certificate of analysis (COA), the bulk lot of sample 7 is E. purpurea root PE 0.8% chicoric acid (lot # D189/013/A13; Maypro Industries LLC, Purchase, NY).
Weight loss on drying, moisture content, inorganic and nutrient analysis:
Summary data for these analyses are given in Table 3. For sample 7, the moisture content ranged from 4.5 to 7.4%; the estimated average from all laboratories was 5.4%. This value was slightly higher than the moisture value of 2.18% reported in the COA. The total inorganic content averaged at 2.4% which is similar to that provided in the COA (1.9 %). The levels of fat, carbohydrate, and protein determined by multiple laboratories agreed well with average values across all labs of 1.5, 75.5, and 8.9%, respectively (Table 3); however, these values were not provided in the COA for comparison. For the XRM (sample 1), the moisture content was 5.5%. The inorganic (ash) content estimated was much higher (45.3%) and carbohydrate level estimated was much lower compared to sample 7 (15.4%).
Table 3.
Summary of composition of E. purpurea root extract (Sample 1) and root extract reference material (XRM, sample 1)
| Laboratorya | Fat | Carbohydrate | Protein | Ash | Moisture | Totald |
|---|---|---|---|---|---|---|
| Sample 7 | ||||||
| 1 | 1.9 | NA | 8.6 | 2.6 | 7.4 | - |
| 2 | 1.1 (± 0.1)b | 72.8 (± 2.8) | 9.0 (± 0.1) | 2.6 (± 0.1) | 4.5 (± 0.0) | 90 |
| 2c | 1.1 (± 0.0) | 76.1 (± 1.4) | 9.2 (± 0.0) | 2.5 (± 0.0) | 4.9 (± 0.1) | 94 |
| 3 | 2.0 (± 0.2) | 77.7 (± 1.0) | NA | 1.8 (± 0.4) | 4.7 (± 0.7) | 86 |
| Averagee | 1.5 (± 0.5) | 75.5 (± 2.5) | 8.9 (± 0.3) | 2.4 (± 0.4) | 5.4 (± 1.4) | 94 |
| Sample 1 (XRM) | ||||||
| 2 | 0.7 (± 0.1) | 15.4 (± 0.1) | 5.7 (± 0.0) | 45.3 (± 0.0) | 5.5 (± 0.0) | 72.6 |
1=Eurofins Scientific Inc, Des Moines, IA; 2=Covance, Madison, WI; 3=Battelle, Columbus, OH.
Values reported are average (± standard error).
Repeated analysis.
Total in extract accounted for per laboratory per analysis.
Average based on analysis by all laboratories.
Identification of E. purpurea constituents by mass spectrometry:
Sample 7 was analyzed by two methods to identify constituents. In the first method, samples were analyzed by TOF-MS using MS or MS/MS; a combination of accurate mass of known Echinacea constituents, manual searches based on literature reported constituents, and library matches were used to identify constituents present in the sample. Total ion chromatograms for the sample and blank are shown in Figure S2. The library search results using the Sciex metabolite library found mainly non-specific analytes such as amino acids. The peaks identified by the METLIN MS/MS library with at least 80% match were primarily fatty acid amides. Potential Echinacea constituents identified based on exact mass and library match and exact mass alone are shown in Table 4 and 5, respectively. Of the compounds identified by the METLIN MS/MS library and the manual search of the data for Echinacea constituents reported in the literature, the presence of chicoric acid, caftaric acid, chlorogenic acid was confirmed (Table 4). Many of the peaks (approximately 24 peaks) in the chromatogram corresponded to butylamides including DT-IBA and dodeca-2E,4E-dienoic acid isobutylamide. Based on exact mass alone (Table 5), 4 cynarin (dicaffeoylquinic acid) isomers were identified along with additional butylamides. Constituents reported in the literature but not identified under these conditions are given in Table S9.
Table 4.
Constituents identified in E. purpurea extract (sample 7) by TOF-MS using library match and exact mass (± 0.002 Da)a,b
| Constituent | CAS | Molecular formula | Molecular weight | Monoisotopic mass (M+H) | Found m/z | Retention time (min) | Referencec |
|---|---|---|---|---|---|---|---|
| Chicoric Acid | 6537-80-0 | C22H18O12 | 474.3711 | 475.0877 | 475.0860 | 13.95 | 1 |
| 475.0863 | 17.19 | ||||||
| 475.0866 | 18.18 | ||||||
| Caftaric Acid | 67879-58-7 | C13H12O9 | 312.2290 | 313.0560 | 313.0551 | 20.64 | 1 |
| Chlorogenic Acid | 327-97-9 | C16H18O9 | 354.3087 | 355.1029 | 355.1021 | 9.50 | 1 |
| 355.1024 | 7.04 | ||||||
| Undeca-2E-ene-8,10-diynoic acid isobutylamide | Unknown | C15H21NO | 231.3333 | 232.1701 | 232.1692 | 31.93 | 2 |
| 232.1692 | 32.35 | ||||||
| Undeca-2E,4Z-diene-8,10-diynoic acid 2-methylbutylamide | Unknown | C16H21NO | 243.3440 | 244.1701 | 244.1694 | 33.97 | 2 |
| 244.1697 | 26.50 | ||||||
| 244.1698 | 36.63 | ||||||
| Undeca-2Z,4E-diene-8,10-diynoic acid 2-methylbutylamide |
Unknown | 244.1702 | 36.14 | 2 | |||
| 244.1704 | 34.74 | ||||||
| 244.1708 | 35.23 | ||||||
| Dodeca-2E,4Z-diene-8,10-diynoic acid isobutylamide |
Unknown | 244.1709 | 37.48 | 1 | |||
| 244.1715 | 33.41 | ||||||
| Dodeca-2E,4E,10E-trien-8-ynoic acid isobutylamide | Unknown | C16H23NO | 245.3599 | 246.1858 | 246.1843 | 26.29 | 1 |
| 246.1845 | 29.75 | ||||||
| 246.1848 | 19.59 | ||||||
| 246.1849 | 19.17 | ||||||
| 246.1853 | 27.49 | ||||||
| 246.1853 | 36.07 | ||||||
| 246.1856 | 26.93 | ||||||
| 246.1863 | 34.67 | ||||||
| 246.1867 | 35.58 | ||||||
| 246.1843 | 26.29 | ||||||
| 246.1845 | 29.75 | ||||||
| 246.1848 | 19.59 | ||||||
| 246.1849 | 19.17 | ||||||
| Dodeca-2E,4E,10E-trien-8-ynoic acid isobutylamide | Unknown | C16H23NO | 245.3599 | 246.1858 | 246.1853 | 27.49 | 1 |
| 246.1853 | 36.07 | ||||||
| 246.1856 | 26.93 | ||||||
| 246.1863 | 34.67 | ||||||
| 246.1867 | 35.58 | ||||||
| Caryophyllene | 87-44-5 | C15H24 | 204.3511 | 205.1956 | 205.1951 | 42.49 | 1 |
| Humulene | 6753-98-6 | ||||||
| Germacrene D | 37839-63-7 | ||||||
| Linolenic acid | 463-40-1 | C18H30O2 | 278.4296 | 279.2324 | 279.2329 | 39.38 | 1 |
| Glycine betaine | 107-43-7 | C5H11NO2 | 117.1463 | 118.0868 | 118.0860 | 3.17 | 1 |
| Tussilagine | 80151-77-5 | C10H17NO3 | 199.2469 | 200.1287 | 200.1276 | 15.65 | 1 |
| Isotussilagine | 91108-32-6 |
Multiple features identified for some compounds may partly be due to the presence of isomeric compound(s) or fragmentation of a derivative with a larger molecular weight to the mass detected.
Sciex Metabolite MS/MS library, MTELIN library, METLIN MS/MS library or a manual search for the M+H (± 0.002 Da) was used to identify features.
References for the presence of this compound in Echinacea: 1) AHP (2004); 2) Spelmen et al., 2009.
Table 5.
Constituents identified in E. purpurea extract (sample 7) by TOF-MS using exact mass (± 0.002 Da)a,b
| Constituent | CAS | Molecular formula | Molecularweight | Monoisotopic mass (M+H) | Found m/z | Retention time (min) | Referencea |
|---|---|---|---|---|---|---|---|
| Cynarin Isomers: 1,3-Dicaffeoylquinic Acid |
19870-46-3 | C25H24O12 | 516.4509 | 517.1346 | 517.1343 | 16.77 | 1 |
| 1,5-Dicaffeoylquinic Acid | 30964-13-7 | 517.1338 | 17.26 | ||||
| 3,5-Dicaffeoylquinic Acid | 2450-53-5 | 517.1364 | 16.77 | ||||
| 4,5-Dicaffeoylquinic Acid | 57378-72-0 | ||||||
| Undeca-2E,4Z-diene-8,10-diynoic | Unknown | C15H19NO | 229.3170 | 230.1545 | 230.1547 | 31.37 | 1 |
| acid isobutylamide | |||||||
| Undeca-2Z,4E-diene-8,10-diynoic | 13894-69-4 | 230.1549 | 32.64 | ||||
| acid isobutylamide | |||||||
| Trideca-2E,7Z-diene-10,12-diynoic acid isobutylamide | Unknown | C17H23NO | 257.3706 | 258.1858 | 258.1850 | 35.37 | 1 |
| 258.1859 | 35.86 | ||||||
| Dodeca-2E,4Z-diene-8,10-diynoic acid 2-methylbutylamide |
Unknown | 258.1865 | 37.20 | ||||
| Dodeca-2E,4E,8Z,10Z-tetraenoic acid isobutylamide | 77448-63-6 | C16H25NO | 247.3758 | 248.2014 | 248.1999 | 36.00 | 1 |
| 248.2008 | 39.10 | ||||||
| 248.2009 | 35.44 | ||||||
| 248.2009 | 38.25 | ||||||
| Dodeca-2E,4E,8Z,10E-tetraenoic acid isobutylamide | 75917-90-7 | 248.2014 | 27.07 | ||||
| 248.2024 | 39.52 | ||||||
| 248.2024 | 37.69 | ||||||
| Dodeca-2E,4E,8Z-trienoic acid isobutylamide | Unknown | C16H27NO | 249.3917 | 250.2171 | 250.2155 | 38.81 | 1 |
| 250.2172 | 41.00 | ||||||
| 250.2176 | 40.37 | ||||||
| Dodeca-2E,4E-dienoic acid isobutylamide | 24738-51-0 | C16H29NO | 251.4076 | 252.2327 | 252.2307 | 32.42 | 1 |
| 252.2307 | 32.00 | ||||||
| p-Cymene | 99-87-6 | C10H14 | 134.2182 | 135.1174 | 135.1154 | 14.51 | 1 |
| Caryophyllene epoxide | 1139-30-6 | C15H24O | 220.3505 | 221.1905 | 221.1888 | 28.26 | 1 |
| 221.1889 | 25.80 | ||||||
| Vanillin | 121-33-5 | C8H8O3 | 152.1473 | 153.0552 | 153.0553 | 14.30 | 1 |
| Rutin | 153-18-4 | C27H30O16 | 610.5175 | 611.1612 | 611.1614 | 15.42 | 2 |
Multiple features identified for some compounds may partly be due to the presence of isomeric compound(s) or fragmentation of a derivative with a larger molecular weight to the mass detected.
Sciex Metabolite MS/MS library, MTELIN library, METLIN MS/MS library or a manual search for the M+H (± 0.002 Da) was used to identify features.
References for the presence of this compound in Echinacea species: 1) AHP (2004) 2) Kurkin et al., (2011)
In the second method, targeted analysis using Echinacea constituent authentic standards (Table S1) to guide the identification were conducted using LC-MS. In addition, mass spectra of other peaks in the chromatogram were evaluated to identify additional constituents in the sample. During the analysis UV chromatogram was also obtained. Total ion chromatogram (TIC) and UV chromatogram at 254 nm are given in Figures 5A and 5B, respectively. Some of the larger peaks are common in both TIC and UV chromatogram. Caftaric acid, chicoric acid, chlorogenic acid, echinacoside, 1,3-dicaffeoylquinic acid (cynarin isomer), DT-IBA, and dodeca-2E,4E-dienoic acid isobutylamide were tentatively identified using retention time matching with authentic standards and are labelled in the figure. For definitive identification, the mass spectrum of standard was compared with that obtained for the peak in the sample eluting at the same retention time. For example, Figures 6A shows the mass spectrum of caftaric acid in sample and Figure 6B shows that of the standard; the two spectra were a good match confirming the identity of caftaric acid in the sample. Similarly, the identities of chicoric acid, chlorogenic acid, echinacoside, and 1,3-dicaffeoylquinic acid were confirmed in sample 7 (data not shown). The pattern of peaks observed between 19 and 23 min in the UV spectrum (Figure 5B) are likely from the low levels of butylamides present in the sample based on the similarity to the UV trace; however, the levels were too low to be confirmed by LC-MS.
Figure 5.
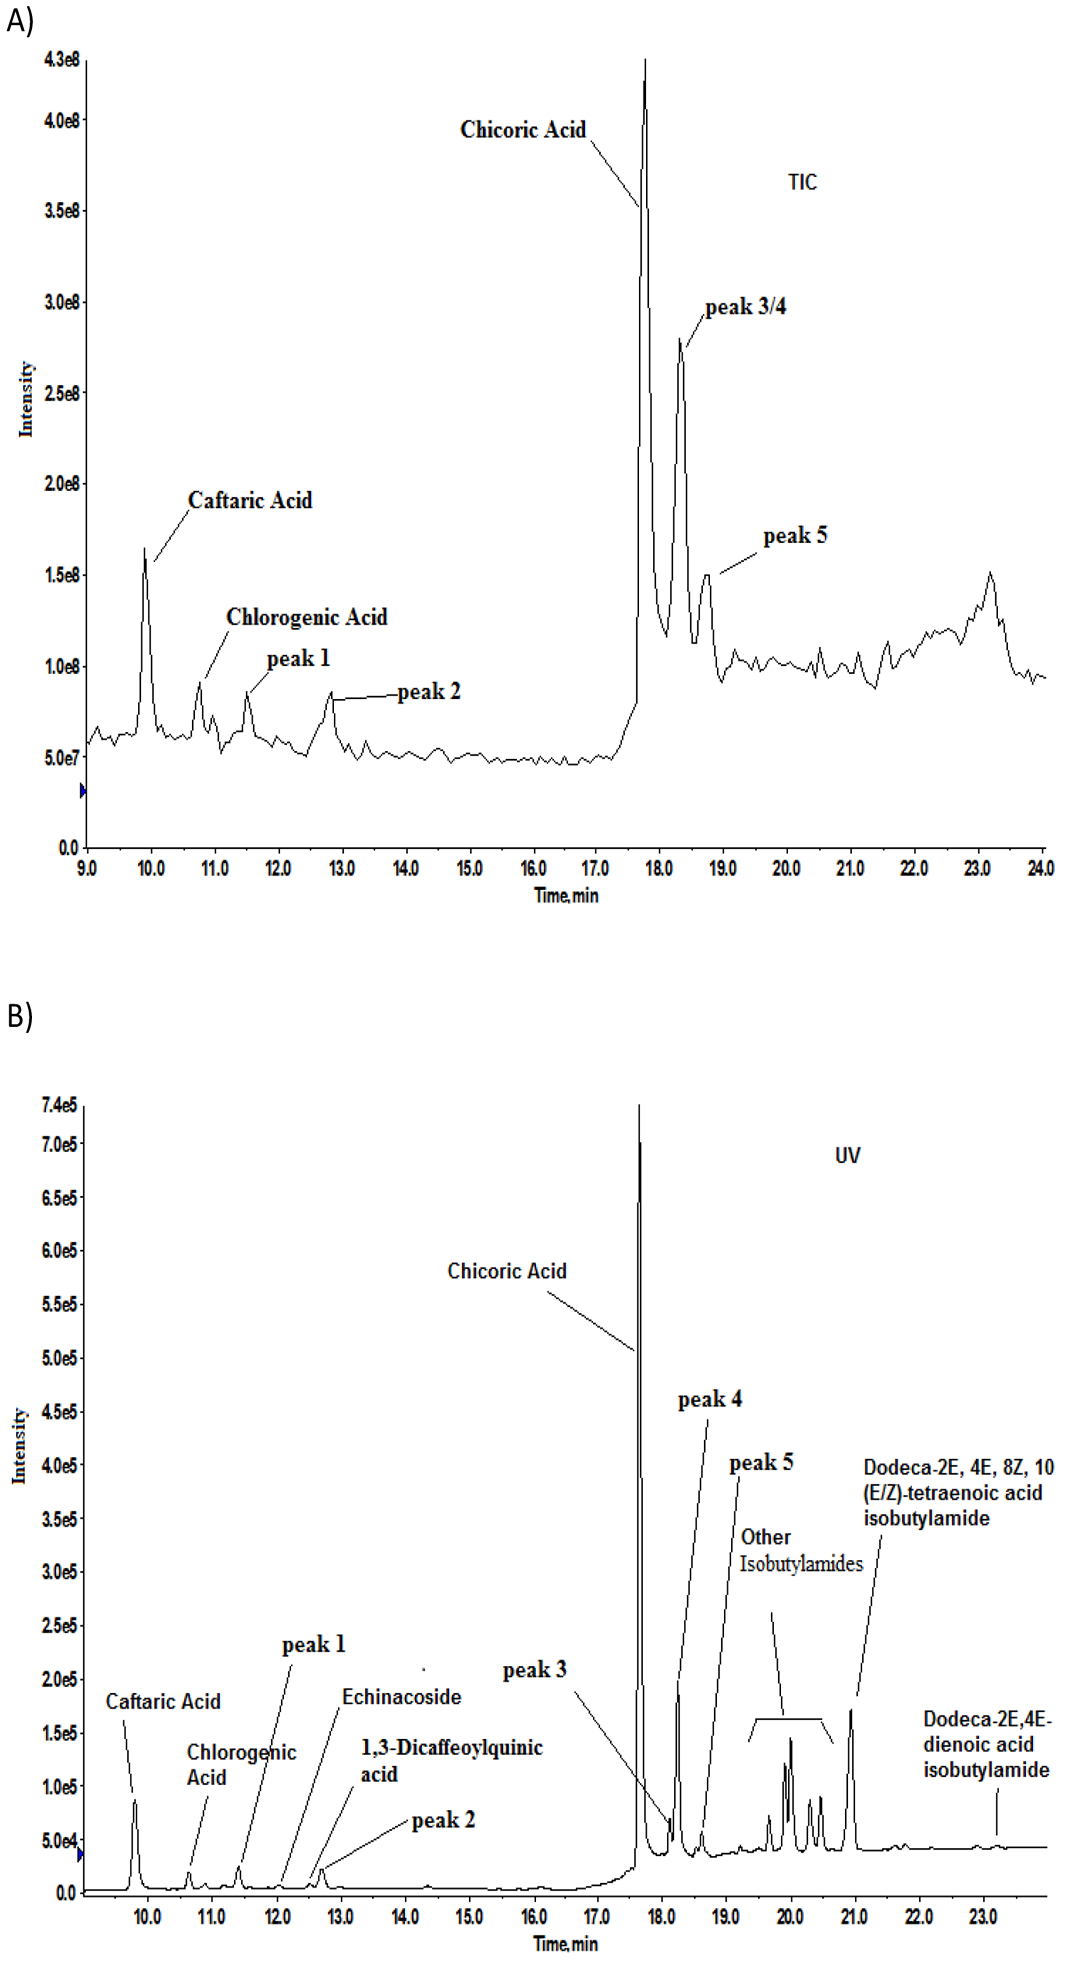
LC-MS analysis in negative ion mode of E. purpurea sample 7 for identification of constituents A) Total in chromatogram B) UV chromatogram at 254 nm. Constituents based on retention times of standards analyzed along with the sample are shown in the figure.
Figure 6.
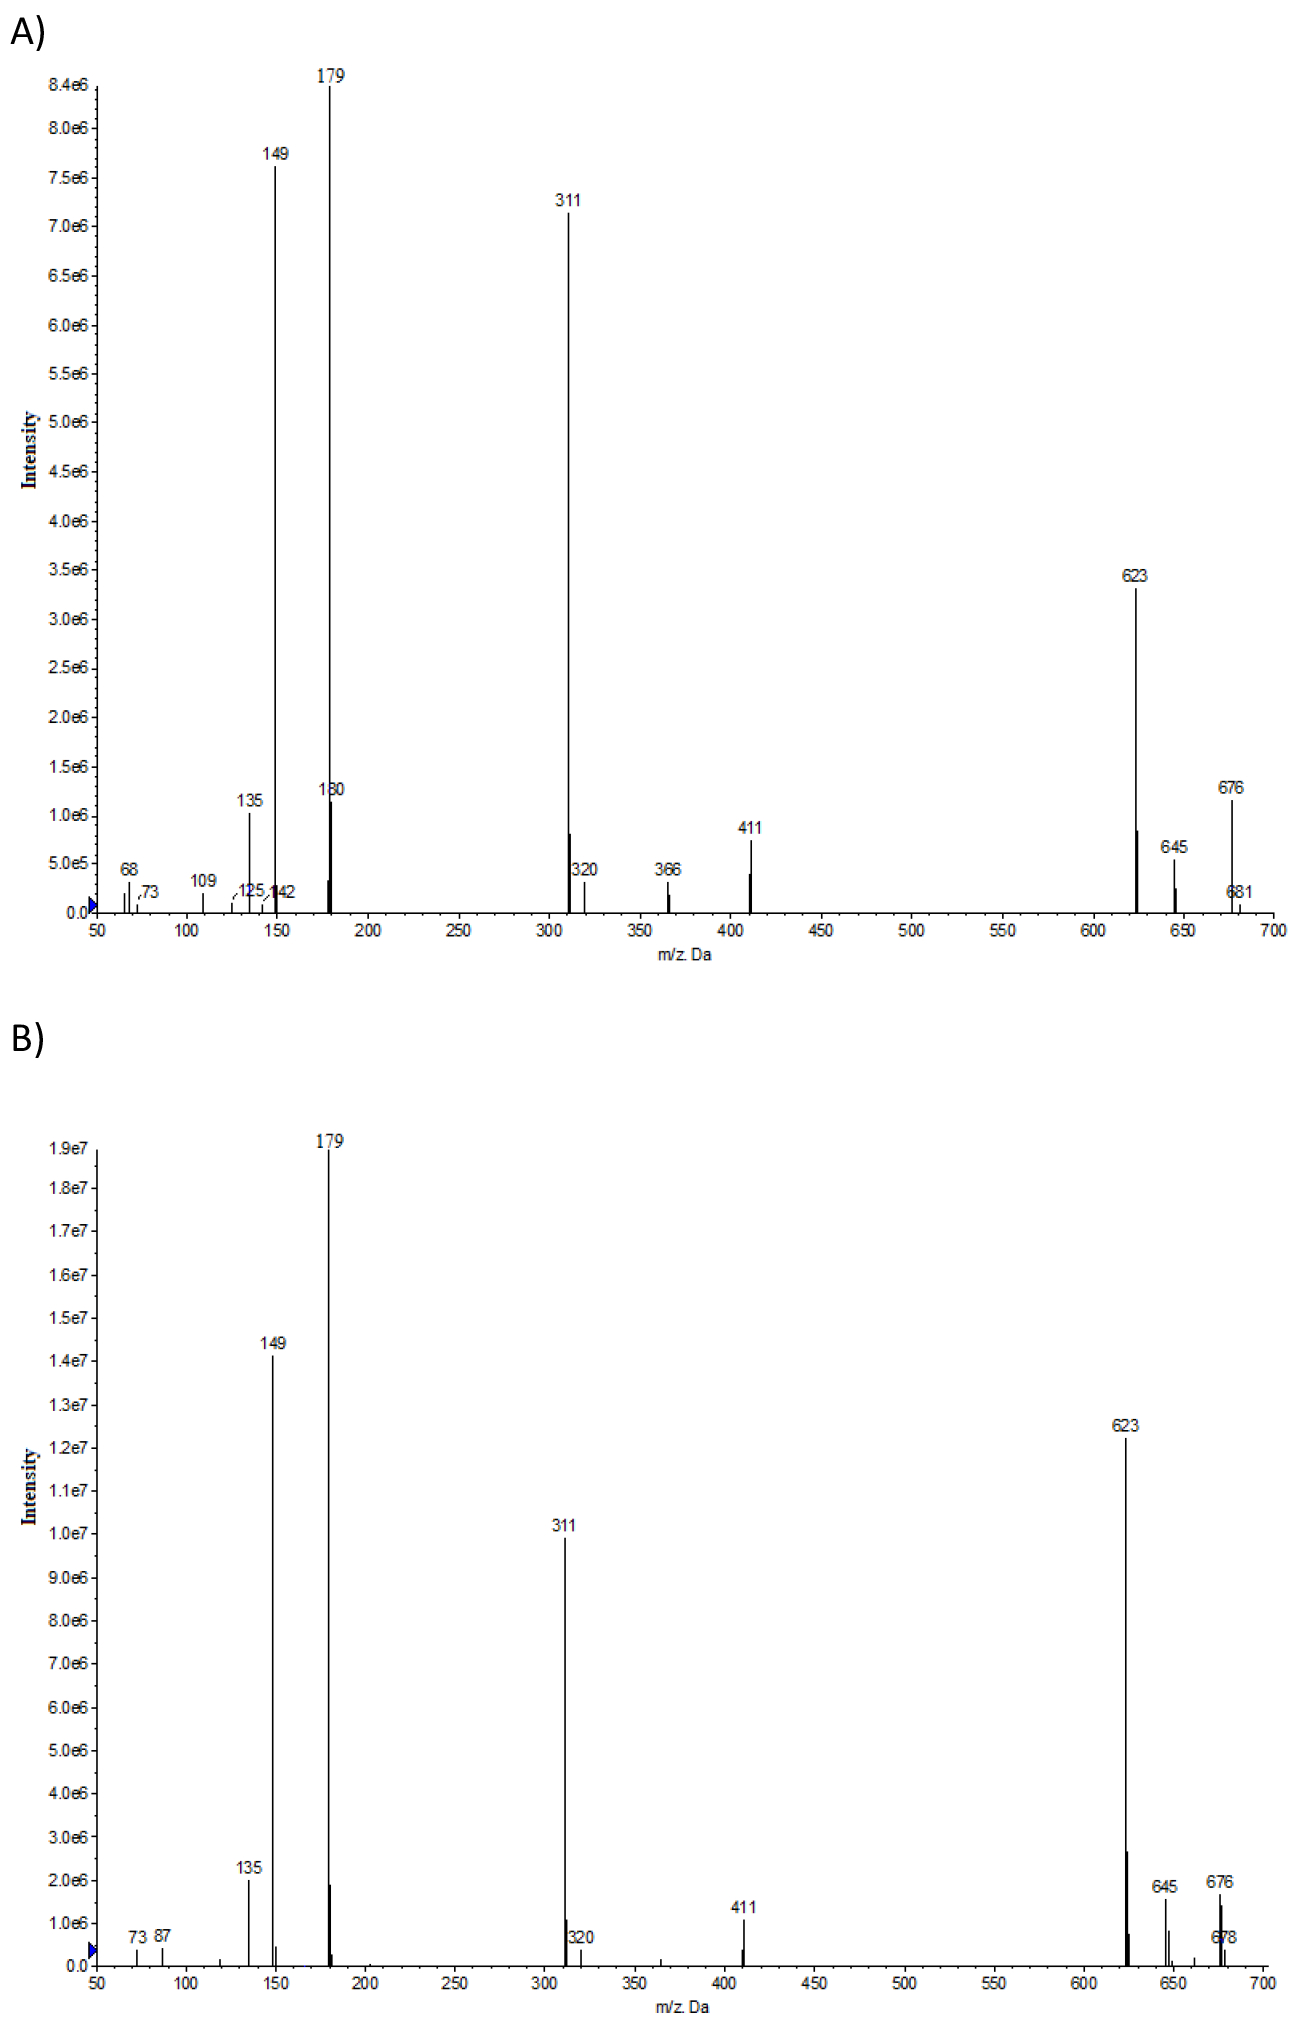
Negative ion LC-MS/MS product ion spectrum of caftaric acid in A) E. purpurea sample 7 and B) the authentic standard confirming the presence of caftaric acid in sample 7.
There were a few other abundant peaks in the TIC with unknown identity; peaks are labelled as 1–5 in the TIC and UV chromatogram (Figures 5A and 5B). Peaks 1, 3, 4, and 5 were tentatively identified as dihydroxycinnamic acid derivatives as described below and known to be present in Echinacea. The mass spectrum of peak 1 (Figure S3A) has ions m/z 179 and 135 similar to the standard of 2,4-dihydroxycinnamic acid (180 amu, Figure S3B). In the 2,4-dihydroxycinnamic acid spectrum, the ions m/z 179 and 135 correspond to loss of H and CO2, respectively, from the parent. Similarly, in the peak 1 spectrum, the ions at m/z 179 and 135 may correspond to loss of the derivative fragment and CO2. The spectrum of peak 3 (Figure S4A) has some fragments similar to caftaric acid (312 amu, Figure S4B) with characteristic ions m/z 149, 179, and 311 and likely contains caftaric acid as part of its structure hence it was tentatively identified as a caftaric acid derivative. Peaks 4 and 5 were tentatively identified as cinnamic acid derivatives, caffeoyl-feruloyl-tartaric acid (Figure S5A; m/z 477 (M-H)) and feruloyl-feruloyl-tartaric acid (Figure S5B; m/z 501 (M-H)), respectively, based on comparison to literature spectra (Lu et al., 2012). Authentic standards were not available for caffeoyl-feruloyl-tartaric acid and feruloyl-feruloyl-tartaric acid to confirm the identity.
Based on these analyses, the main constituents identified and their corresponding structures are shown in Figure 7.
Figure 7.
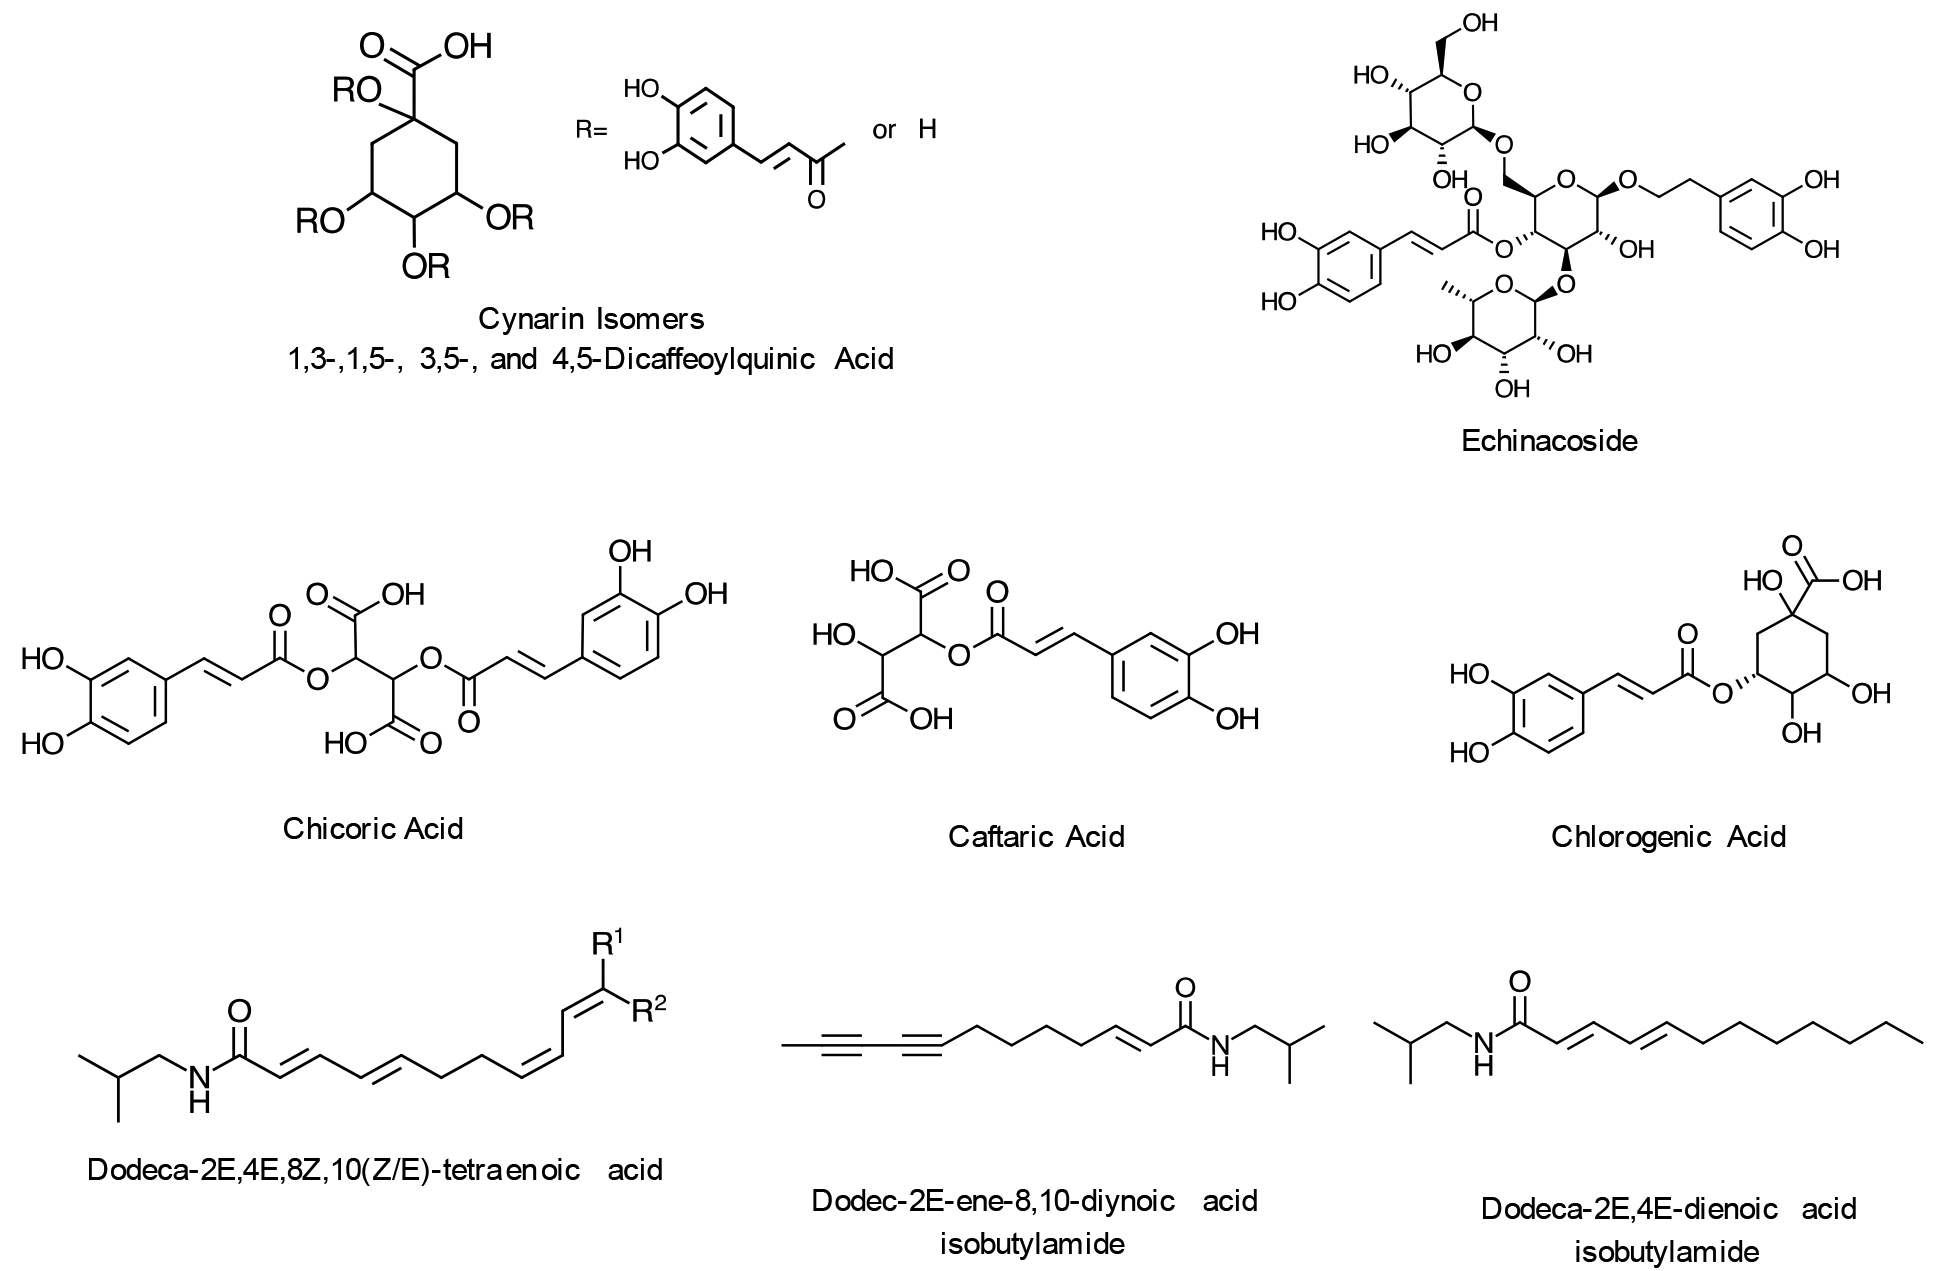
Selected constituents identified in E. purpurea root extract sample 7.
Quantitation of E. purpurea constituents by HPLC-CAD and LC-MS/MS
HPLC-CAD has been used widely for the quantitation of analytes including in botanical research (Baker and Regg, 2018; Poplawska et al., 2018; Soliven et al., 2017; Vervoort et al., 2008). However, depending on the type of sample, the selectivity of the CAD may or may not be sufficient to quantitate constituents in a complex mixture. Hence, we compared constituent levels estimated by both CAD and MS detectors.
An overlaid HPLC-CAD chromatogram showing E. purpurea root extract sample spiked with standards at (0), 1x, 2x and 4x of anticipated concentration is shown in Figure S6. Linear regression equations for standards are given in Table S6; coefficient of determination for all analytes were ≥ 0.95. The amount of each analyte estimated is presented as percent in E. purpurea root extract per weight basis (weight of constituent/weight of extract *100) (Table 6). The highest percent of constituent in both sample 7 (4.68%) and sample 1 (4.64%) was chicoric acid and the levels were similar. Caftaric acid was the next highest constituent (sample 7, 0.78%; sample 1, 1.40%). As expected for E. purpurea, levels of 1,3-dicaffeoylquinic acid and echinacoside were low (< 0.1%). Due to a variety of isobutylamides present and that the authentic standard was available, for the isobutylamides, DTA-IBA was quantified (0.25%). The levels observed were within those expected for E. purpurea (AHP, 2004; USP, 2015). The total Echinacea-specific constituent levels in sample 7 was 5.94 % and in sample 1 was similar at 6.56% (Table 6).
Table 6.
Percent constituents determined using HPLC-CAD and LC-MS/MS in E. purpurea extract (sample 7) and root extract reference material (XRM, sample 1)a
| Constituent | Percent (w/w) | ||
|---|---|---|---|
| HPLC-CAD | LC-MS/MSb | ||
| Sample (7) | XRM (1) | Sample (7) | |
| Chicoric acid | 4.68 | 4.64 | 1.52 |
| Chlorogenic acid | 0.09 | 0.04 | 0.07 |
| Caftaric acid | 0.78 | 1.40 | 0.37 |
| Echinacoside | 0.02 | 0.38 | NDc |
| Dodeca-2(E),4(E), 8(Z),10(E/Z)-tetraenoic acid isobutylamide (DTA-IBA) | 0.25 | 0.05 | 0.11 |
| 1,3-Dicaffeoylquinic acid (cynarin isomer) | 0.13 | 0.04 | ND |
| Total constituents | 5.94 | 6.56 | 2.08 |
Values shown are average of 2 replicates. Percent is estimated per weight basis (weight of constituent/weight of extract)*100.
Only sample 7 was analyzed by LC-MS/MS.
The lower limit of quantitation for this method is approximately 50 ng/mL for all analytes. The limits of detection for this method for chicoric acid, chlorogenic acid, caftaric acid, echinacoside, DTA-IBA, and 1,3-dicaffeoylquinic acid is 7.71, 4.53, 10.6, 27.8, 11.8, and 16.1 ng/mL, respectively.
ND, not detected above the limit of detection.
An overlaid LC-MS/MS chromatogram of E. purpurea root extract sample 7 and constituent standards are is shown in Figure S7. Linear regression equations for standards are given in Table S8; coefficient of determination for all analytes were ≥ 0.95. The amount of each analyte estimated is presented as percent in E. purpurea root extract per weight basis (Table 6). The pattern of constituent levels estimated were similar to those estimated by HPLC-CAD with chochoric (1.52%) and caftaric acid (0.37%) being the highest and chlorgenic acid, echinacoside, and 1,3-dicaffeoylquinic acid being either lowest or not detected. However, the levels were 2- to 3-fold lower by MS detection compared to CAD. The total Echinacea-specific constituent levels estimated by LC-MS/MS was 2.08% (Table 6).
Stability of E. purpurea constituents in bulk material
A visual observation showed that the appearance of the sample did not change after being in storage for ~ 20 days except at 60 °C where the original tan material was slightly darker (data not shown). The data for samples stored at different temperatures (5, 25, 60 °C) relative to a sample stored at - 20 °C are shown in Figure 8 for caftaric acid, chicoric acid, and DT-IBA. The relative value for caftaric acid in samples stored at all 3 temperatures were statistically similar (p-values > 0.05) to that stored at - 20 °C. The relative value for chicoric acid and DTA-IBA in samples stored at 5 °C and ambient temperatures were statistically similar (p-values > 0.05) to that at - 20 °C; however, chicoric acid (p-value = 0.011) and DTA-IBA acid (p-value = 0.0003) in samples stored at 60 °C was statistically different from that of −20 °C. These data suggest that the bulk material may be stable at ambient, refrigerated, or frozen conditions over long-term storage. In order to ensure the stability during long-term storage, the bulk was stored at −20 °C.
Figure 8.
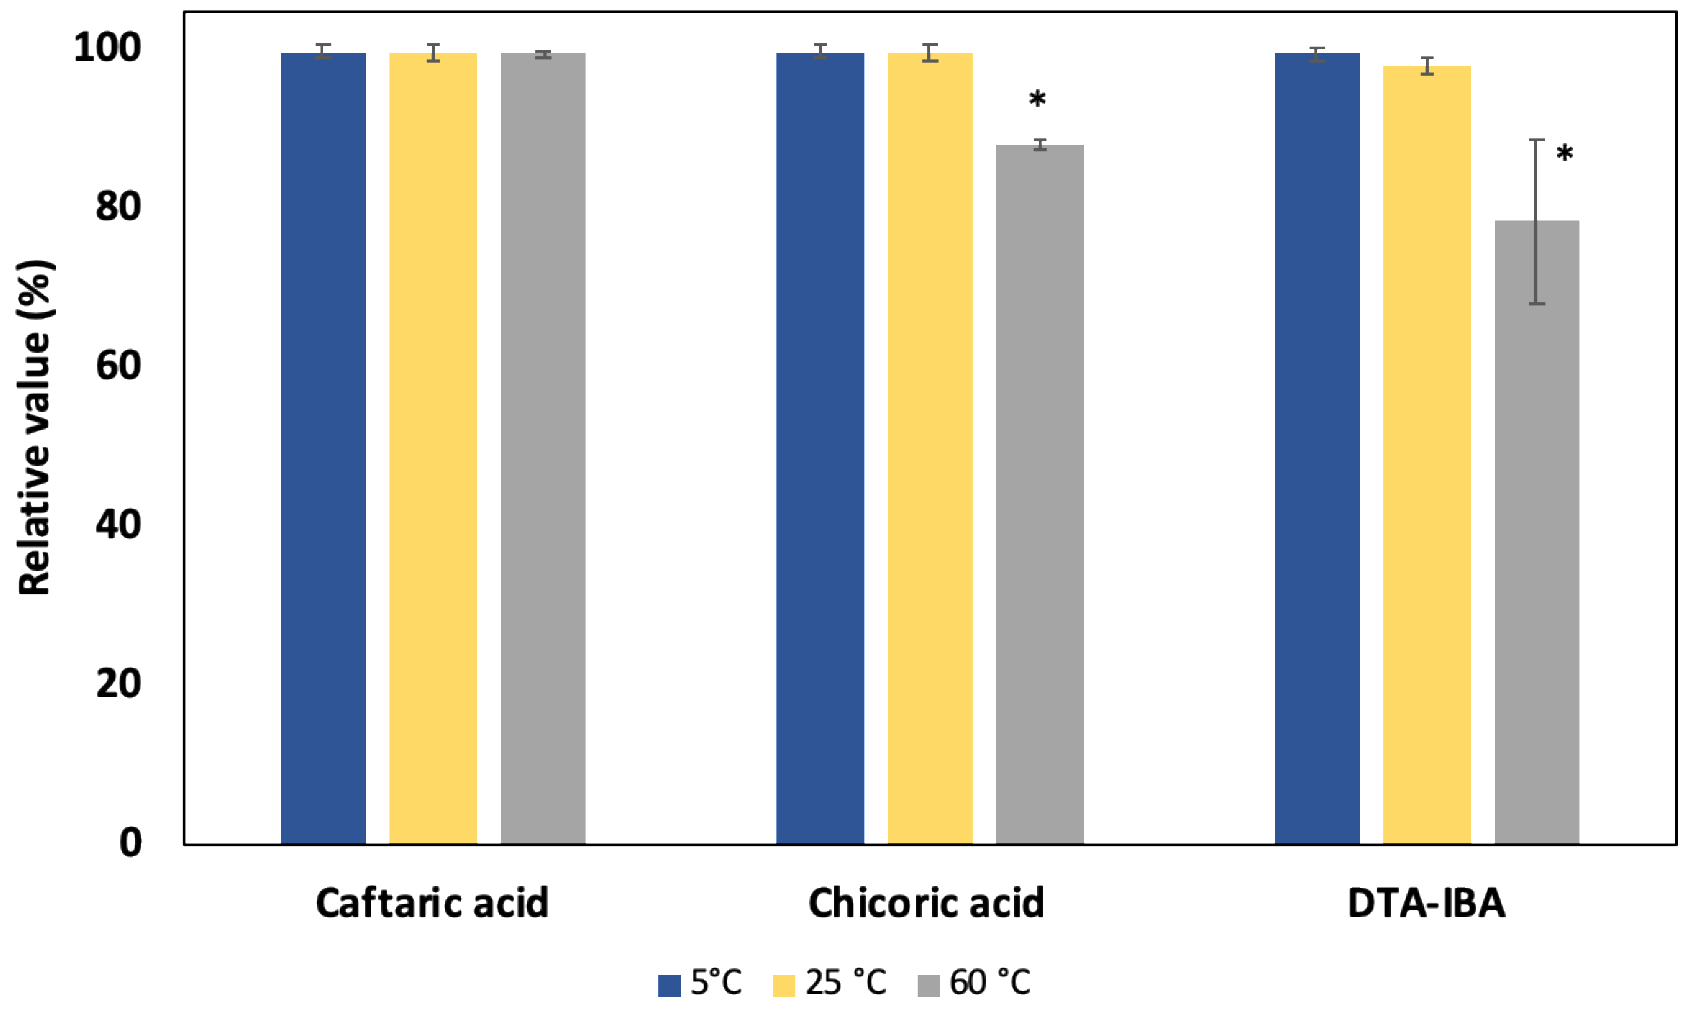
Stability of E. purpurea bulk material during storage. Percent of select constituents relative to a sample stored at −20 °C is shown. DTA-IBA =8(Z),10(E/Z)-tetraenoic acid isobutylamide. * Denotes significant difference from a sample stored at −20 °C.
Discussion
The NTP has a substantial portfolio of BDS research including comprehensive toxicity and carcinogenicity evaluation of Ginkgo biloba extract, green tea extract, goldenseal root powder, etc. in mice and rats (Rider et al., 2018) (https://ntp.niehs.nih.gov/results/areas/botanical/index.html). The selection of an appropriate and high-quality product for testing and subsequent comprehensive characterization, including phytochemical composition and contaminant analysis, is the key to generate robust safety data that can be compared widely across studies and used to inform risk assessment. Because botanicals are typically complex mixtures with a large unidentified fraction and there is product variability in the marketplace, identification of a suitable unfinished product for preclinical safety testing has been a primary challenge. There are several considerations when selecting a product for safety testing: 1) it should be authentic (i.e., belonging to the correct plant genus and species), 2) it should be representative of what is used by consumers to the extent possible, 3) the material should be free of contaminants and adulterants, 4) the phytochemical composition should be known, the extent of which could depend on the botanical product of interest (e.g., for a botanical with a highly potent active constituent the knowledge on that constituent may be sufficient whereas for a botanical with on knowledge on active constituents one may need to identify as many as constituents making up the product) , 5) the batch/lot size should be large enough to support all planned studies, and 6) the stability of the product over study duration should be confirmed. Here, we present the lot selection and characterization of Echinacea for NTP studies and the approach used is given in Figure 9.
Figure 9.
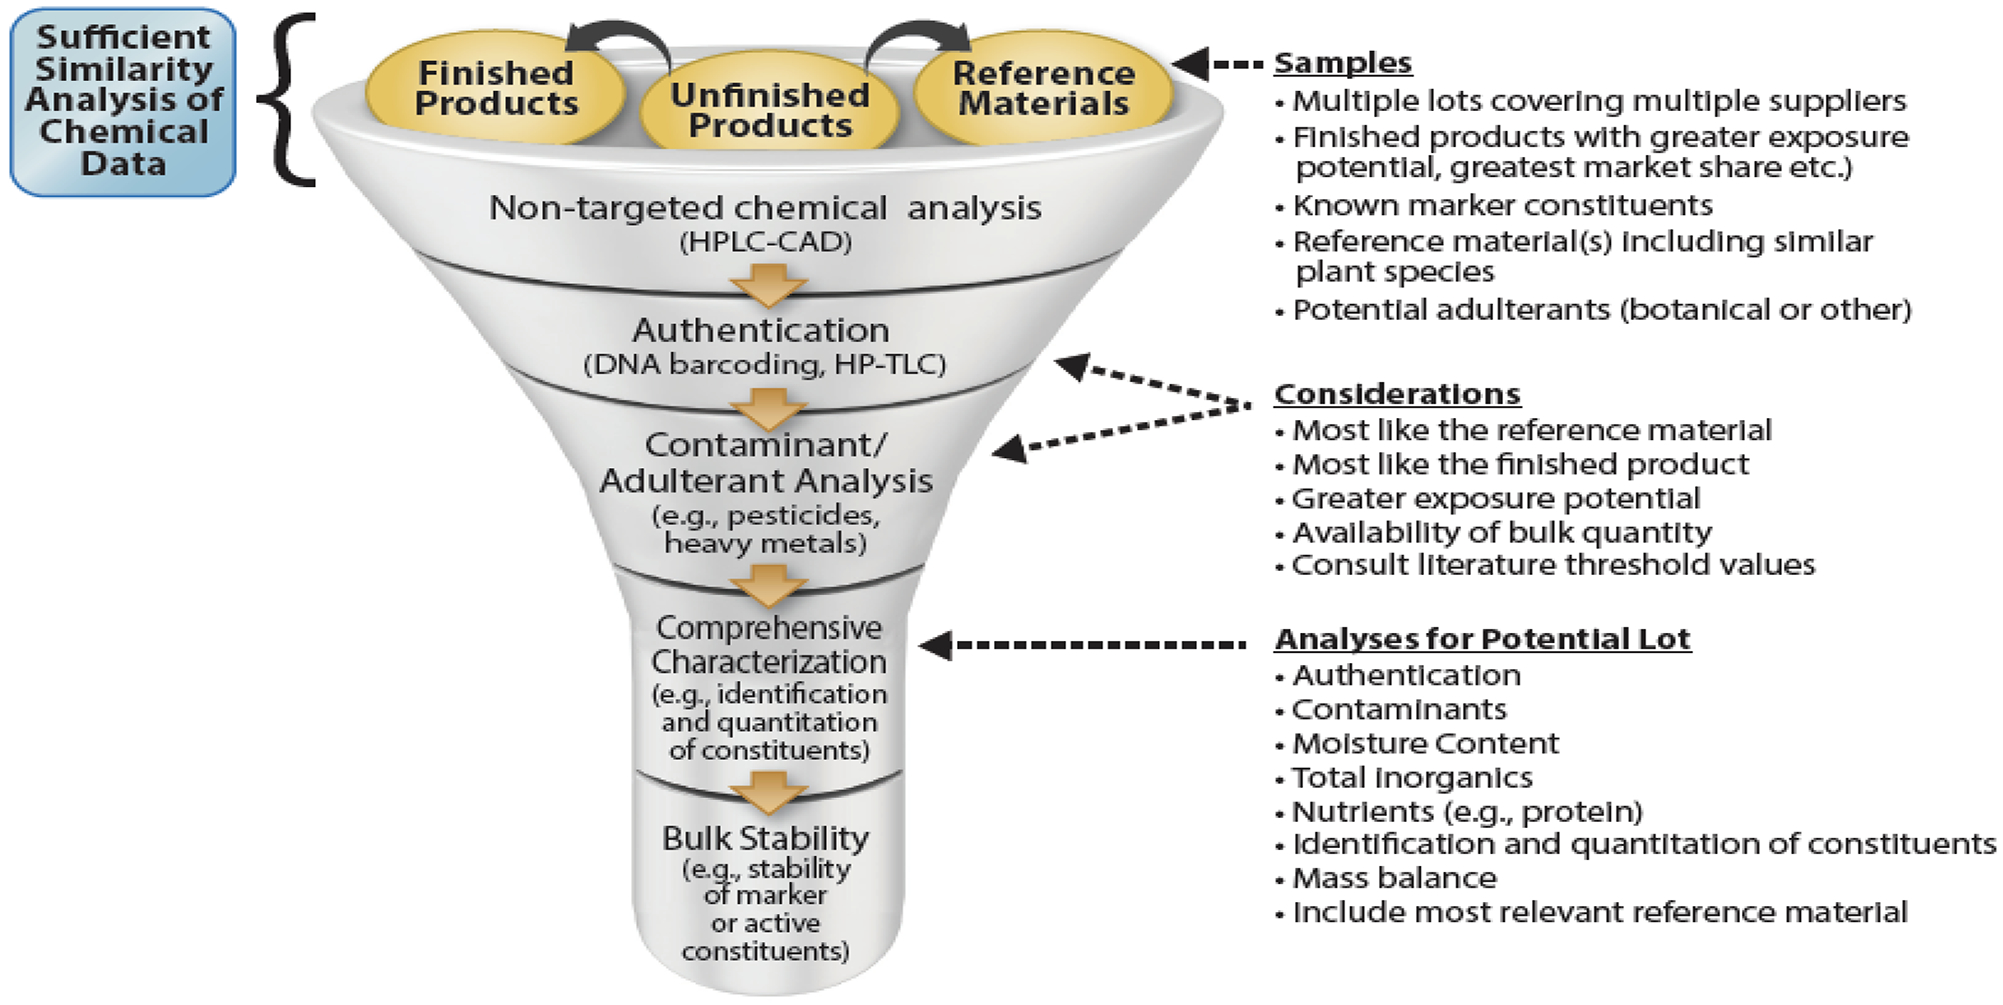
The strategy used for material selection and phytochemical characterization of Echinacea for safety testing.
The first step in the process of Echinacea test article selection was to procure a diverse suite of products to evaluate, with the goal being to compare a set of candidate samples (unfinished samples that are potential test materials) to finished products and reference material(s) to identify a test article that is authentic and high quality, as well as representative of what consumers are using. Whenever possible, including reference material from related plant species (e.g., E. pallida and E. angustifolia in the current case) and potential adulterants is recommended. Unfortunately, reference materials are not currently available for many botanicals. Those that are available for purchase are limited to a few sources (e.g., National Institute of Standards and Technology, https://www.nist.gov; the USP, https://www.usp.org; Chromadex, https://chromadex.com) and hence development of high-quality botanical reference material is an area needing research attention. Recognizing this need, the NIH Office of Dietary Supplements funds research for developing reference materials through the Analytical Methods and Reference Materials Program (https://ods.od.nih.gov/Research/AMRMProgramOverview.aspx). A secondary aim of the comparison across samples is to survey the range of quality in source material and consumer products. An important consideration in this phase is the critical number of samples required to increase the probability of finding an authentic and high-quality sample for testing. For Echinacea, we procured 13 unfinished extracts from 8 suppliers, reflecting the availability of bulk quantities, and all commercially available Echinacea reference materials (representing different plant parts of E. purpurea, as well as E. pallida and E. angustifolia). In addition, we obtained 5 different finished products based on the following criteria; Amazon best-selling Echinacea Herbal Supplements, contains Echinacea only, contains E. purpurea root, commercial availability.
The second step was to screen products to identify product(s) that are similar to and those that are different from (e.g., adulterated) reference materials and finished products. Non-targeted chemical analysis techniques (e.g., HPLC- or GC- mass spectrometry, particularly high-resolution mass spectrometry, and NMR) are becoming popular for analysis of BDS since they are easy to use, rapid, cost-effective and provide high content data representative of the whole mixture. We used HPLC-CAD analysis to screen samples for initial investigation of similarity and difference between different products. Use of chemometric methods to process and analyze such data to identify variability, adulteration etc. have advanced significantly over the years (Harnly et al., 2007; Kellogg et al., 2016). Here we used simple fit-for purpose approach to determine the similarity and differences between different products of Echinacea. Inclusion of replicate samples, known constituents, quality control samples, and blanks throughout the analytical run should be considered to account for sample preparation and run-to-run variability. Although replicate samples were not included in the current study, a subsequent assessment established that under the conditions used, the variability in sample preparation and analysis was negligible (data not shown). Based on non-targeted analysis, several unfinished products were identified as potential lots of E. purpurea extracts. However, most of the products were herb powders or extracts; only one sample (sample 7) was a root extract and was available in bulk quantity and hence was selected as a potential sample for further assessment. Of the finished products, 4 out of 5 were not representative of E. purpurea (Figures 1C, 2 and 3) although lack of similarity for sample 24 could partly be due to the lower amount used for analysis. The low frequency could partly be due to potential adulteration with other Echinacea species. Overall, the low number of authentic unfinished and finished E. purpurea samples identified in our studies with Echinacea is likely due to the small number of samples procured, which we recognize as a limitation of our study design.
It is critical to ensure that the selected material is authentic (i.e., derived from to Echinacea purpurea). The authenticity of a product can be accomplished by several techniques and the appropriateness of the technique(s) depends on the type of product being considered for testing. The traditional method to confirm the authenticity of a botanical used raw or unprocessed plant material whose morphological and microscopical characteristics are compared to a vouchered specimen by a trained expert (Walker and Applequist, 2012); the robustness of the data depends on the diagnostic characteristics that enable one product to be separated from other closely related plant species. Alternatively, DNA-based authentication methods are becoming popular and offer an effective way of confirming the authenticity. However, many publications have laid out the challenges associated with DNA barcoding in authentication of processed botanical products, and hence, this approach requires special attention to DNA quantity and integrity and selection of appropriate analysis methods (Hollingsworth et al., 2011; Moraes et al., 2015; Parveen et al., 2016; Pawar et al., 2017; Raclariu et al., 2018a; Ragupathy et al., 2019). In our investigation with Echinacea, traditional authentication methods were precluded due to the highly processed materials. Therefore, we selected multiple laboratories to evaluate the authenticity of E. purpurea root extract sample 7 and a reference (sample 1) via DNA barcoding to build confidence in the data generated. Not surprisingly, the three different labs provided divergent results. The more specific primers used by Labs B and C likely led to the confirmation of E. purpurea in samples in contrast with Lab A, which used a universal DNA barcode, although few details were provided by the laboratories to make a definitive conclusion. This outcome is supported by evidence from other researchers, with Parveen et al., (2016) asserting that “the relatively long genomic regions required for universal DNA barcoding are no longer present in most botanical extracts.” Even in cases where the use of DNA barcoding has been successful in authentication of botanicals, DNA barcoding cannot be used to distinguish between samples that utilize different plant parts, as has been recently demonstrated for Echinacea (Raclariu et al., 2018a). While advances in the field (e.g., next generation sequencing) continue to improve our ability to confirm the identity of ingredients and adulterants from imperfect samples for this technique (e.g., highly processed, degraded DNA) (Lu et al., 2018), there is a continued need to develop and validate these methods, as well as expansion of databases containing DNA sequences for various plant ingredients and adulterants to facilitate identification (Moraes et al., 2015). The current example adds to the body of work supporting careful selection of primers in DNA barcoding authentication efforts. Despite its limitations, DNA barcoding of processed botanical products should be considered as a complementary tool in authentication efforts, in conjunction with chemical analysis methods.
HP-TLC has been widely used to separate and detect organic compounds although the technique is not suitable to analyze volatile and labile compounds. Its application in monitoring the quality and authenticity of botanical products has been demonstrated (Reich et al., 2008). The technique has been successfully applied to differentiate between Echinacea species (Raclariu et al., 2018b; Reich et al., 2008; Reich and Widmer, 2009) and among other applications, to identify adulterants in grape seed extracts down to 5% (http://cms.herbalgram.org/BAP/LGD/BAPP-LGDs-grapeseedextract-FINAL.pdf). In our studies, the characteristics of Echinacea sample 7 as E. purpurea root extract was also established by HP-TLC by commercial laboratories using the commercial laboratories’ reference materials, to determine the authenticity of sample 7. These analyses further highlight the importance of reference materials. In contrast to DNA barcoding efforts, all three labs came to the same conclusion regarding the authenticity of sample 7, although the thoroughness of the experimental design and the levels of details provided by the laboratories varied. Since the HP-TLC technique is fairly well-established, analysis by a single laboratory may be adequate. One of the major limitations in the use of HP-TLC technique alone was the inability to routinely provide insights into other plant species and adulterants present in the product being tested.
The fourth step was to ensure that the potential Echinacea test material is contaminant/adulterant free (Figure 9). We used multiple analyses including aerobic plate counts, and evaluation of mycotoxins, pesticides, and heavy metals to ensure that these contaminants were absent, or if present, were below the limits established for botanical dietary supplements (AHPA, 2009; WHO, 2007). The data from these analyses strengthened the argument for the suitability of Echinacea sample 7 to be used in safety testing. Adulteration of BDS can arise from misidentification of plant species, economically-motivated adulteration, where a less expensive botanical ingredient is used in place of authentic more expensive material on the label, and/or adulteration with pharmaceutical drugs or drug analogs to drive the efficacy. Although we have not investigated it in our studies with Echinacea, potential adulteration and/or contamination of Echinacea products with roots of other plant species such as Parthenium integrifolium, Eryngium aquaticum, Rudbeckia nitida etc. has been noted (Zhang et al., 2017). A Botanical Adulteration Prevention Program to educate members of the herbal and dietary supplement industry about ingredient and product adulteration is available on the American Botanical Council’s website (http://cms.herbalgram.org/BAP/BotanicalAdulterantsIndex.html#Adulteration%20Reports). In addition, FDA maintains a database of botanical ingredients adulterated with drugs and actions it has taken to remove those products from the market.
Once we had confidence that sample 7 was authentic and contaminant free, the next step was to comprehensively characterize the material, including its phytochemical composition (Figure 9). The types of analyses used will depend, to some degree, on the botanical product of interest (e.g., tincture, powder). For E. purpurea root extract, a series of analyses was used first to determine the moisture content, total inorganic content (determined as ash in our study), and nutritional content (total protein, carbohydrate, and fat), calculated as weight percent (weight of component/weight of extract *100) (Table 3). The total weight percent that these inorganic and nutritional contents contributed to extract mass was ~ 94%, suggesting that the extract may contain ~ 6% of E. purpurea root-specific constituents. However, it should be noted that some of these analyses may not have the level of precision required to determine the exact mass balance.
The identification of marker and/or bioactive constituents and establishing their concentrations are the key to ensuring that data across multiple studies can be compared. The success of these targeted techniques this depends on the available analytical instrumentation and the information on marker constituents in the form of monographs such as those published by USP or AHP (AHP, 2004; USP, 2015). Although in some cases the known constituents make up a significant fraction of the botanical ingredient (e.g., Garcinia cambogia, green tea extract, Ginkgo biloba extract), in many circumstances, as in the case of Echinacea, the known constituents make up a very small fraction, making it difficult to arrive at a decision regarding the authenticity of the botanical product based on targeted chemical analysis alone. With Echinacea, first the identification of marker constituents was accomplished using a combination of MS and MS/MS methods. Here, one can also consider techniques such as NMR for identification of constituents; the success of such techniques will depend on the ability to isolate the constituents and the concentration of constituents in a botanical product. Echinacea species are known to contain caftaric acid, chicoric acid, chlorogenic acid, butylamides (e.g., DT-IBA), echinacosides, and cynarins; the level and ratio of constituents depends on multiple factors including the species and plant part(s) and extraction process used in the preparation (AHP, 2004; Barnes et al., 2005; Kurkin et al., 2011; USP, 2015). The mass spectrometric data confirmed the presence of caftaric acid, chicoric acid, chlorogenic acid, numerous butylamides, echinacoside, and cynarin isomers along with other phytochemicals (Figure 7, Tables 4 and 5). A few additional constituents were tentatively identified; however, due to unavailability of authentic standards, definitive identification of those constituents could not be made at the present time.
For constituents where authentic standards were available, levels were quantitated in samples 7 and 1. Methods incorporating solvent standards or standard addition have been used to quantitate constituents (https://www.aoac.org/aoac_prod_imis/AOAC_Docs/StandardsDevelopment/SLV_Guidelines_Dietary_Supplements.pdf). However, in our experience with Echinacea, use of solvent standards with HPLC-CAD analysis to quantitate constituent levels provided variable estimates potentially due to matrix-effects and/or co-elution with other analytes in the complex matrix. Hence, we compared two methods for quantitation of constituents in sample 7; standard addition followed by analysis using HPLC-CAD and use of solvent calibration curves and analysis by LC-MS/MS. In our analysis using standard addition followed by HPLC-CAD, chicoric acid and caftaric acid were the highest constituents in both samples (1 and 7) with low echinacoside and cynarin levels, further confirming the authenticity of these materials as E. purpurea. The total % of E. purpurea constituents estimated in our extract was ~ 6%, which is consistent with that predicted based on the mass balance estimates (Table 3). Although the pattern of constituent distribution was similar between the two methods, the levels estimated using HPLC-CAD was 2- to 3-fold higher than that using LC-MS/MS. This potential overestimation by the CAD is likely due to lower specificity and selectivity of the detector and hence the use of more specific and selective mass spectrometric detection is recommended for quantitation of constituents in these complex mixtures. Overall, our data suggest that most of the key E. purpurea-specifc constituents in sample 7 were accounted for by these analyses and that the unknown Echinacea-related constituent fraction is likely small.
The stability of material through the duration of the study is of utmost importance to ensure reproducibility of research and to facilitate comparison across different studies. For complex mixtures like botanicals, the stability can be assessed relative to marker constituents, and if known, relative to biologically-active constituents under different conditions. In addition, the stability of key constituents should be confirmed periodically and also prior to the start of a new study, by quantifying marker or bioactive constituents and comparing against previously determined levels. For E. purpurea root extract, the data showed that three key marker constituents were stable under the conditions tested, except under the accelerated stability conditions (60 °C) where the levels of chicoric acid and DTA-IBA were statistically lower than those at −20 °C. To ensure the stability, the bulk material is stored at −20 °C and composition of constituents are monitored periodically; no degradation of constituents was observed (data not shown).
As demonstrated here, chemistry-based approaches for comparing candidate samples are critical to selecting an appropriate test article for study. Here, for Echinacea, we used simple fit-for purpose methods with minimal data processing which has broad application potential to compare across divergent samples to identify a suitable product. However, efforts will be made in future work to refine and improve the methods used here to identify the best practices for assessing the sufficient similarity of complex mixtures. Biological activity assessments provide a complementary facet that should also be included in the comparison of candidate samples to aid in the selection of a test article. In the Echinacea work, we evaluated multiple Echinacea candidates, including sample 7, for their biological similarity via evaluation of gene expression changes in primary human hepatocytes (Ryan et al., 2019). Interestingly, we found that sample 7 (labelled as sample EP1 in Ryan et al. 2109) and a few other unfinished samples behave similarly in the in vitro hepatocyte assay. When we further refined our comparisons to include similarity by chemical composition, we determined that sample 7 is biologically and chemically similar to five other samples of unfinished E. purpurea. Hence, these samples can be considered as candidate lots if an additional test article or bulk quantity is needed.
Conclusion
Non-targeted chemical fingerprinting techniques and chemometric analysis of data were used to select an E. purpurea root extract for toxicological evaluation. The product was then authenticated using HP-TLC and DNA barcoding techniques and comprehensively characterized, including the determination of phytochemical composition. Among numerous constituents identified, key constituents quantified were caftaric acid, chicoric acid, chlorogenic acid and dodeca-2(E),4(E),8(Z),10(E/Z)-tetraenoic acid isobutylamide which made up a small fraction of the extract.
Supplementary Material
Acknowledgements
The authors are grateful to Mr. Brad Collins and Dr. David Crizer for their review of this manuscript. This work was supported by the Intramural Research Program of the NIH, National Institute of Environmental Health Sciences, Intramural Research project ZIA ES103316-04, and performed for the National Toxicology Program, National Institute of Environmental Health Sciences, National Institutes of Health, U.S. Department of Health and Human Services, under contract HHSN273201400027C (Battelle, Columbus, OH).
References
- AHP, 2004. Americal Herbal Pharmacopoeia and Therapeutic Compendium (AHP) Echinacea purpurea root. Standard of analysis, quality control and therapeutics [Google Scholar]
- AHPA, 2009. American Herbal Products Association. Heavy Metals: Analysis and Limits in Herbal Dietary Supplements. [Google Scholar]
- Awortwe C, Manda VK, Avonto C, Khan SI, Khan IA, Walker LA, Bouic PJ, Rosenkranz B, 2015. Echinacea purpurea up-regulates CYP1A2, CYP3A4 and MDR1 gene expression by activation of pregnane X receptor pathway. Xenobiotica 45, 218–229. [DOI] [PMC free article] [PubMed] [Google Scholar]
- Baker TR, Regg BT, 2018. A multi-detector chromatographic approach for characterization and quantitation of botanical constituents to enable in silico safety assessments. Analytical and Bioanalytical Chemistry 410, 5143–5154. [DOI] [PMC free article] [PubMed] [Google Scholar]
- Barcz ES, E.; Nartowska J; Balan B; Chorostowska-Wynimko J;Skopińska-Rózewska E, 2007. Influence of Echinacea purpurea intake during pregnancy on fetal growth. FOLIA HISTOCHEMICA 45, 35–39. [PubMed] [Google Scholar]
- Barnes J, Anderson LA, Gibbons S, Phillipson JD, 2005. Echinacea species (Echinacea angustifolia (DC.) Hell., Echinacea pallida (Nutt.) Nutt.,Echinacea purpurea (L.) Moench): a review of their chemistry, pharmacology and clinical properties. J Pharm Pharmacol 57, 929–954. [DOI] [PubMed] [Google Scholar]
- Barrett B, 2003. Medicinal properties of Echinacea: a critical review. Phytomedicine 10, 66–86. [DOI] [PubMed] [Google Scholar]
- Catlin NR, Collins BJ, Auerbach SS, Ferguson SS, Harnly JM, Gennings C, Waidyanatha S, Rice GE, Smith-Roe SL, Witt KL, Rider CV, 2018. How similar is similar enough? A sufficient similarity case study with Ginkgo biloba extract. Food Chem Toxicol 118, 328–339. [DOI] [PMC free article] [PubMed] [Google Scholar]
- Chow G, Johns T, Miller SC, 2006. Dietary Echinacea purpurea during murine pregnancy: effect on maternal hemopoiesis and fetal growth. Biol Neonate 89, 133–138. [DOI] [PubMed] [Google Scholar]
- Clarke TC, Black LI, Stussman BJ, Barnes PM, Nahin RL, 2015. Trends in the use of complementary health approaches among adults: United States, 2002–2012. National Health Statistics Reports 10, 1–16. [PMC free article] [PubMed] [Google Scholar]
- Gallo M, Koren G, 2001. Can herbal products be used safely during pregnancy? Focus on echinacea. Can Fam Physician 47, 1727–1728. [PMC free article] [PubMed] [Google Scholar]
- Harnly JM, Bhagwat S, Lin LZ, 2007. Profiling methods for the determination of phenolic compounds in foods and dietary supplements. Anal Bioanal Chem 389, 47–61. [DOI] [PMC free article] [PubMed] [Google Scholar]
- Heitmann K, Havnen GC, Holst L, Nordeng H, 2016. Pregnancy outcomes after prenatal exposure to echinacea: the Norwegian Mother and Child Cohort Study. Eur J Clin Pharmacol 72, 623–630. [DOI] [PubMed] [Google Scholar]
- Hollingsworth PM, Graham SW, Little DP, 2011. Choosing and using a plant DNA barcode. Plos One 6, e19254. [DOI] [PMC free article] [PubMed] [Google Scholar]
- Kellogg JJ, Paine MF, McCune JS, Oberlies NH, Cech NB, 2019. Selection and characterization of botanical natural products for research studies: a NaPDI center recommended approach. Nat Prod Rep 36, 1196–1221. [DOI] [PMC free article] [PubMed] [Google Scholar]
- Kellogg JJ, Todd DA, Egan JM, Raja HA, Oberlies NH, Kvalheim OM, Cech NB, 2016. Biochemometrics for Natural Products Research: Comparison of Data Analysis Approaches and Application to Identification of Bioactive Compounds. J Nat Prod 79, 376–386. [DOI] [PMC free article] [PubMed] [Google Scholar]
- Kurkin VA, Akushskaya AS, Avdeeva EV, Velmyaikina EI, Daeva ED, Kadentsev VI, 2011. Flavonoids from Echinacea purpurea. Russ J Bioorg Chem+ 37, 905–906. [Google Scholar]
- Kuszak AJ, Hopp DC, Williamson JS, Betz JM, Sorkin BC, 2016. Approaches by the US National Institutes of Health to support rigorous scientific research on dietary supplements and natural products. Drug Test Anal 8, 413–417. [DOI] [PMC free article] [PubMed] [Google Scholar]
- Lu ZF, Rubinsky M, Babajanian S, Zhang YJ, Chang P, Swanson G, 2018. Visualization of DNA in highly processed botanical materials. Food Chemistry 245, 1042–1051. [DOI] [PubMed] [Google Scholar]
- Meija J, Pagliano E, Mester Z, 2014. Coordinate Swapping in Standard Addition Graphs for Analytical Chemistry: A Simplified Path for Uncertainty Calculation in Linear and Nonlinear Plots. Anal Chem 86, 8563–8567. [DOI] [PubMed] [Google Scholar]
- Meng Q, Liu KX, 2014. Pharmacokinetic Interactions Between Herbal Medicines and Prescribed Drugs: Focus on Drug Metabolic Enzymes and Transporters. Curr Drug Metab 15, 791–807. [DOI] [PubMed] [Google Scholar]
- Mengs U, Clare CB, Poiley JA, 1991. Toxicity of Echinacea Purpurea - Acute, Subacute and Genotoxicity Studies. Arzneimittel-Forsch 41–2, 1076–1081. [PubMed] [Google Scholar]
- Mooiman KD, Maas-Bakker RF, Hendrikx JJMA, Bank PCD, Rosing H, Beijnen JH, Schellens JHM, Meijerman I, 2014. The effect of complementary and alternative medicines on CYP3A4-mediated metabolism of three different substrates: 7-benzyloxy-4-trifluoromethyl-coumarin, midazolam and docetaxel. J Pharm Pharmacol 66, 865–874. [DOI] [PubMed] [Google Scholar]
- Moraes DFC, Still DW, Lum MR, Hirsch AM, 2015. DNA-Based Authentication of Botanicals and Plant-Derived Dietary Supplements: Where Have We Been and Where Are We Going? Planta Medica 81, 687–695. [DOI] [PubMed] [Google Scholar]
- NIH, 2019. Dietary Supplement Label Database. Last accessed September 1, 2019. [Google Scholar]
- Parveen I, Gafner S, Techen N, Murch SJ, Khan IA, 2016. DNA Barcoding for the Identification of Botanicals in Herbal Medicine and Dietary Supplements: Strengths and Limitations. Planta Medica 82, 1225–1235. [DOI] [PubMed] [Google Scholar]
- Pawar RS, Handy SM, Cheng R, Shyong N, Grundel E, 2017. Assessment of the Authenticity of Herbal Dietary Supplements: Comparison of Chemical and DNA Barcoding Methods. Planta Medica 83, 921–936. [DOI] [PubMed] [Google Scholar]
- Poplawska M, Blazewicz A, Kaminski K, Bednarek E, Fijalek Z, Kozerski L, 2018. Application of high-performance liquid chromatography with charged aerosol detection (LC-CAD) for unified quantification of synthetic cannabinoids in herbal blends and comparison with quantitative NMR results. Forensic Toxicol 36, 122–140. [Google Scholar]
- Raclariu AC, Heinrich M, Ichim MC, de Boer H, 2018a. Benefits and Limitations of DNA Barcoding and Metabarcoding in Herbal Product Authentication. Phytochem Anal 29, 123–128. [DOI] [PMC free article] [PubMed] [Google Scholar]
- Raclariu AC, Tebrencu CE, Ichim MC, Ciuperca OT, Brysting AK, de Boer H, 2018b. What’s in the box? Authentication of Echinacea herbal products using DNA metabarcoding and HPTLC. Phytomedicine 44, 32–38. [DOI] [PubMed] [Google Scholar]
- Ragupathy S, Faller AC, Shanmughanandhan D, Kesanakurti P, Shaanker RU, Ravikanth G, Sathishkumar R, Mathivanan N, Song JY, Han JP, Newmaster S, 2019. Exploring DNA quantity and quality from raw materials to botanical extracts. Heliyon 5. [DOI] [PMC free article] [PubMed] [Google Scholar]
- Reich E, Schibli A, DeBatt A, 2008. Validation of high-performance thin-layer chromatograpic methods for the identification of botanicals in a cGMP environment. Journal of Aoac International 91, 13–20. [PMC free article] [PubMed] [Google Scholar]
- Reich E, Widmer V, 2009. Plant analysis 2008--planar chromatography. Planta Med 75, 711–718. [DOI] [PubMed] [Google Scholar]
- Rider CV, Walker NJ, Waidyanatha S, 2018. Getting to the Root of the Matter: Challenges and Recommendations for Assessing the Safety of Botanical Dietary Supplements. Clin Pharmacol Ther 104, 429–431. [DOI] [PMC free article] [PubMed] [Google Scholar]
- Ryan KR, Huang MC, Ferguson SS, Waidyanatha S, Ramaiahgari S, Rice JR, Dunlap PE, Auerbach SS, Mutlu E, Cristy T, Peirfelice J, DeVito MJ, Smith-Roe SL, Rider CV, 2019. Evaluating Sufficient Similarity of Botanical Dietary Supplements: Combining Chemical and In Vitro Biological Data. Toxicological Sciences. [DOI] [PMC free article] [PubMed] [Google Scholar]
- Senchina DS, McCann DA, Asp JM, Johnson JA, Cunnick JE, Kaiser MS, Kohut ML, 2005. Changes in immunomodulatory properties of Echinacea spp. root infusions and tinctures stored at 4 degrees C for four days. Clin Chim Acta 355, 67–82. [DOI] [PubMed] [Google Scholar]
- Shipkowski KA, Betz JM, Birnbaum LS, Bucher JR, Coates PM, Hopp DC, MacKay D, Oketch-Rabah H, Walker NJ, Welch C, Rider CV, 2018. Naturally complex: Perspectives and challenges associated with Botanical Dietary Supplement Safety assessment. Food Chem Toxicol 118, 963–971. [DOI] [PMC free article] [PubMed] [Google Scholar]
- Smith T, Gillespie M, Eckl V, Knepper J, CM R, 2019. Herbal Supplement Sales in US Increase by 9.4% in 2018. HerbalGram 123, 62–73. [Google Scholar]
- Soliven A, Ahmad IAH, Tam J, Kadrichu N, Challoner P, Markovich R, Blasko A, 2017. A simplified guide for charged aerosol detection of non-chromophoric compounds-Analytical method development and validation for the HPLC assay of aerosol particle size distribution for amikacin. Journal of pharmaceutical and biomedical analysis 143, 68–76. [DOI] [PubMed] [Google Scholar]
- USP, 2015. United States Pharmacopea Dietary supplements compendium The United States Pharmacopeal Convention, Twinbrook Parkway, Rockville, MD: 1. [Google Scholar]
- Vervoort N, Daemen D, Torok G, 2008. Performance evaluation of evaporative light scattering detection and charged aerosol detection in reversed phase liquid chromatography. Journal of Chromatography A 1189, 92–100. [DOI] [PubMed] [Google Scholar]
- Wachtel-Galor S, Benzie IFF, 2011. Herbal Medicine: An Introduction to Its History, Usage, Regulation, Current Trends, and Research Needs, in: nd Benzie IFF Wachtel-Galor S (Eds.), Herbal Medicine: Biomolecular and Clinical Aspects, Boca Raton (FL). [PubMed] [Google Scholar]
- Walker KM, Applequist WL, 2012. Adulteration of Selected Unprocessed Botanicals in the U.S. Retail Herbal Trade. Economic Botany 66, 321–327. [Google Scholar]
- WHO, 2007. WHO guidelines for assessing quality of herbal medicines with reference to contaminants and residues. [Google Scholar]
- Yale SH, Glurich I, 2005. Analysis of the inhibitory potential of Ginkgo biloba, Echinacea purpurea, and Serenoa repens on the metabolic activity of cytochrome P450 3A4, 2D6, and 2C9. J Altern Complement Med 11, 433–439. [DOI] [PubMed] [Google Scholar]
- Zhang N, Erickson DL, Ramachandran P, Ottesen AR, Timme RE, Funk VA, Luo Y, Handy SM, 2017. An analysis of Echinacea chloroplast genomes: Implications for future botanical identification. Sci Rep 7, 216. [DOI] [PMC free article] [PubMed] [Google Scholar]
Associated Data
This section collects any data citations, data availability statements, or supplementary materials included in this article.