Abstract
Hydrogel scaffolding of stem cells is a promising strategy to overcome initial cell loss and manipulate cell function post-transplantation. Matrix degradation is a requirement for downstream cell differentiation and functional tissue integration, which determines therapeutic outcome. Therefore, monitoring of hydrogel degradation is essential for scaffolded cell replacement therapies. We show here that chemical exchange saturation transfer magnetic resonance imaging (CEST MRI) can be used as a label-free imaging platform for monitoring the degradation of crosslinked hydrogels containing gelatin (Gel) and hyaluronic acid (HA), of which the stiffness can be fine-tuned by varying the ratio of the Gel:HA. By labeling Gel and HA with two different NIR dyes having distinct emission excitation frequencies, we show here that the HA signal remains stable for 42 days, while the Gel signal gradually decreases to <25% of its initial value at this time point. Both imaging modalities were in excellent agreement for both the time course and relative value of CEST MRI and NIR signals (R2=0.94). These findings support the further use of CEST MRI for monitoring biodegradation and optimizing of gelatin-containing hydrogels in a label-free manner.
Keywords: CEST MRI, NIR imaging, biodegradation, hydrogel, gelatin, hyaluronic acid
Graphical Abstract
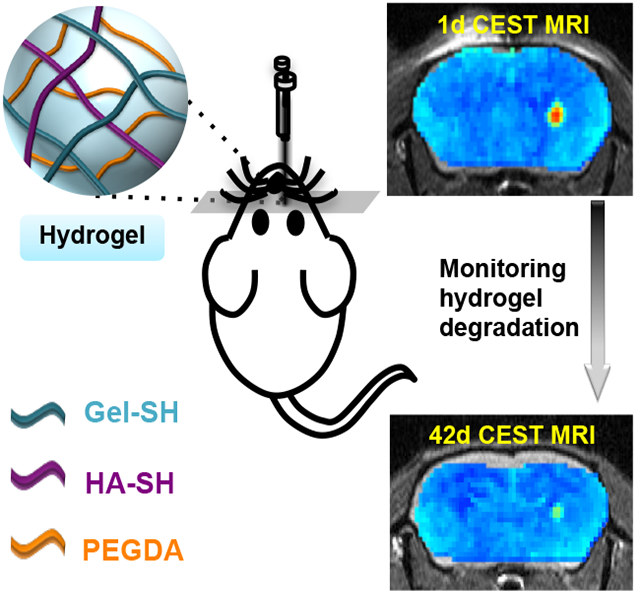
Chemical exchange saturation transfer (CEST) magnetic resonance imaging (MRI) can be used to monitor composite hydrogel degradation in vivo in a non-invasive and label-free manner. Using two different near-infrared dyes for labeling gelatin and hyaluronic acid, it was shown that the gelatin component is not only the major source of CEST contrast, but also biodegradation.
1. Introduction
Cell therapy has been applied for treating a myriad of tissue injuries and diseases. Direct cell injection often leads to limited initial and sustained cell engraftment due to poor cell survival caused by mechanical shear forces and the harsh tissue environment in the degenerative region. It has been reported that injected stem cells may exhibit less than 5% retention at the desired site within days of post-injection.[1] As a successful outcome of cell therapy is dependent on the number of cells retained after injection, improving cell retention and survival is of utmost importance. Scaffolding transplanted cells with biomaterials has been a promising strategy to overcome initial cell loss, as well as to increase cell survival, fate, and function in the days and weeks that follow treatment.[2] Injectable hydrogels have been attractive biomaterials for scaffolding cells due to their excellent biocompatibility and high water content[3]. For cell delivery applications, the hydrogels can be either a pre-crosslinked fluid that undergoes a shear-thinning process during injection or a liquid formulation that is gelled in situ by a chemical crosslinker, ultraviolet light, or a pH change. Compared to naked cells suspended in a simple fluid such as saline, hydrogels are able to increase the viscosity of the cell injectate, preventing cells from exposure to a hostile tissue environment and providing a safe haven for cell retention.[4]
For optimal design of hydrogels for cell scaffolding, they should degrade within an optimal time frame. Degradation can neither be too quickly, resulting in insufficient cell protection and retention, nor too slow, which would lead to insufficient cell release, inhibition of cell migration, and the induction of fibrosis.[5] The differentiation of stem cells can also be directed by hydrogel degradation, independent from cell morphology or hydrogel mechanics.[6] Hence, developing non-invasive means to monitoring such hydrogel degradation is highly desirable to further optimize scaffolded cell therapy[7]. Hydrogels and other composite scaffolds have previously been labeled with NIR fluorescent dyes[8], carbon nanodots[9], radiopaque X-ray contrast agents[10], 1H MRI contrast agents[11] or perfluorocarbon 19F MRI tracers[11e, 12] in order to detect their location and immediate dispersion. However, these labels cannot report directly on hydrogel biodegradation and would also need additional regulatory clearance for clinical use.
We have previously shown that chemical exchange saturation transfer (CEST) MRI has potential to visualize the in vivo stability of hydrogels in a label-free fashion[13]. Here, CEST MRI relies on the endogenous signal of specific hydrogel components in the absence of exogenous contrast. Since CEST MRI is sensitive to molecular components rich in exchangeable protons including amide and hydroxyl protons, hydrogels composed of gelatin and hyaluronic acid (HA) can be readily detected with CEST MRI. In this study, we examined the rheological and CEST MRI properties of various composite hydrogel formulations containing thiolated gelatin, HA, and poly(ethylene glycol) diacrylate (PEGDA). In these composite gels, the HA used as backbone provides the necessary mechanical stiffness, the gelatin facilities cell attachment, and the PEGDA serves as crosslinker. Our goal was to monitor the in vivo biodegradation of gelatin and HA over time with CEST MRI signal changes as readout, using NIR imaging as an independent validation method for the persistence of the labeled hydrogel components.
2. Results and Discussion
2.1. CEST imaging of hydrogels in vitro
Hydrogels were synthesized via binding of thiolated gelatin (Gel-SH), thiolated HA (HA-SH), and PEGDA (Figure 1a). PEGDA serves as a crosslinker between Gel-SH and HA-SH to form a hydrogel network (Figure S1, Supporting Information). The potentially exchangeable protons present on this hydrogel included those on the amide and hydroxyl groups. We first examined the CEST properties of a hydrogel with a 1:1 ratio of Gel-SH to HA-SH. This hydrogel showed a broad spectrum of CEST signal in the range of 0–6 ppm, increasing with increasing saturation field strength (Figure 1b). Two peaks could be detected: one peak between 0.5 to 2.0 ppm and another peak at 3.6 ppm. For 3.6 ppm, a B1 value of 3.6 μT produced a comparable CEST signal to 4.7 μT, with a narrower spectrum than higher B1 values. Therefore, B1= 3.6 μT was used for all further experiments. To determine the individual CEST signal contributions, the three components Gel-SH, HA-SH, and PEGDA, were further separately studies. The CEST z-spectra (Figure 1c) and MTRasym spectra (Figure 1d) demonstrated that Gel-SH contributes to the majority of CEST signal, which can be assigned to the ample exchangeable amide protons (Figure 1e).
Figure 1. In vitro CEST MRI of Gel/HA/PEGDA composite hydrogel and its individual components.
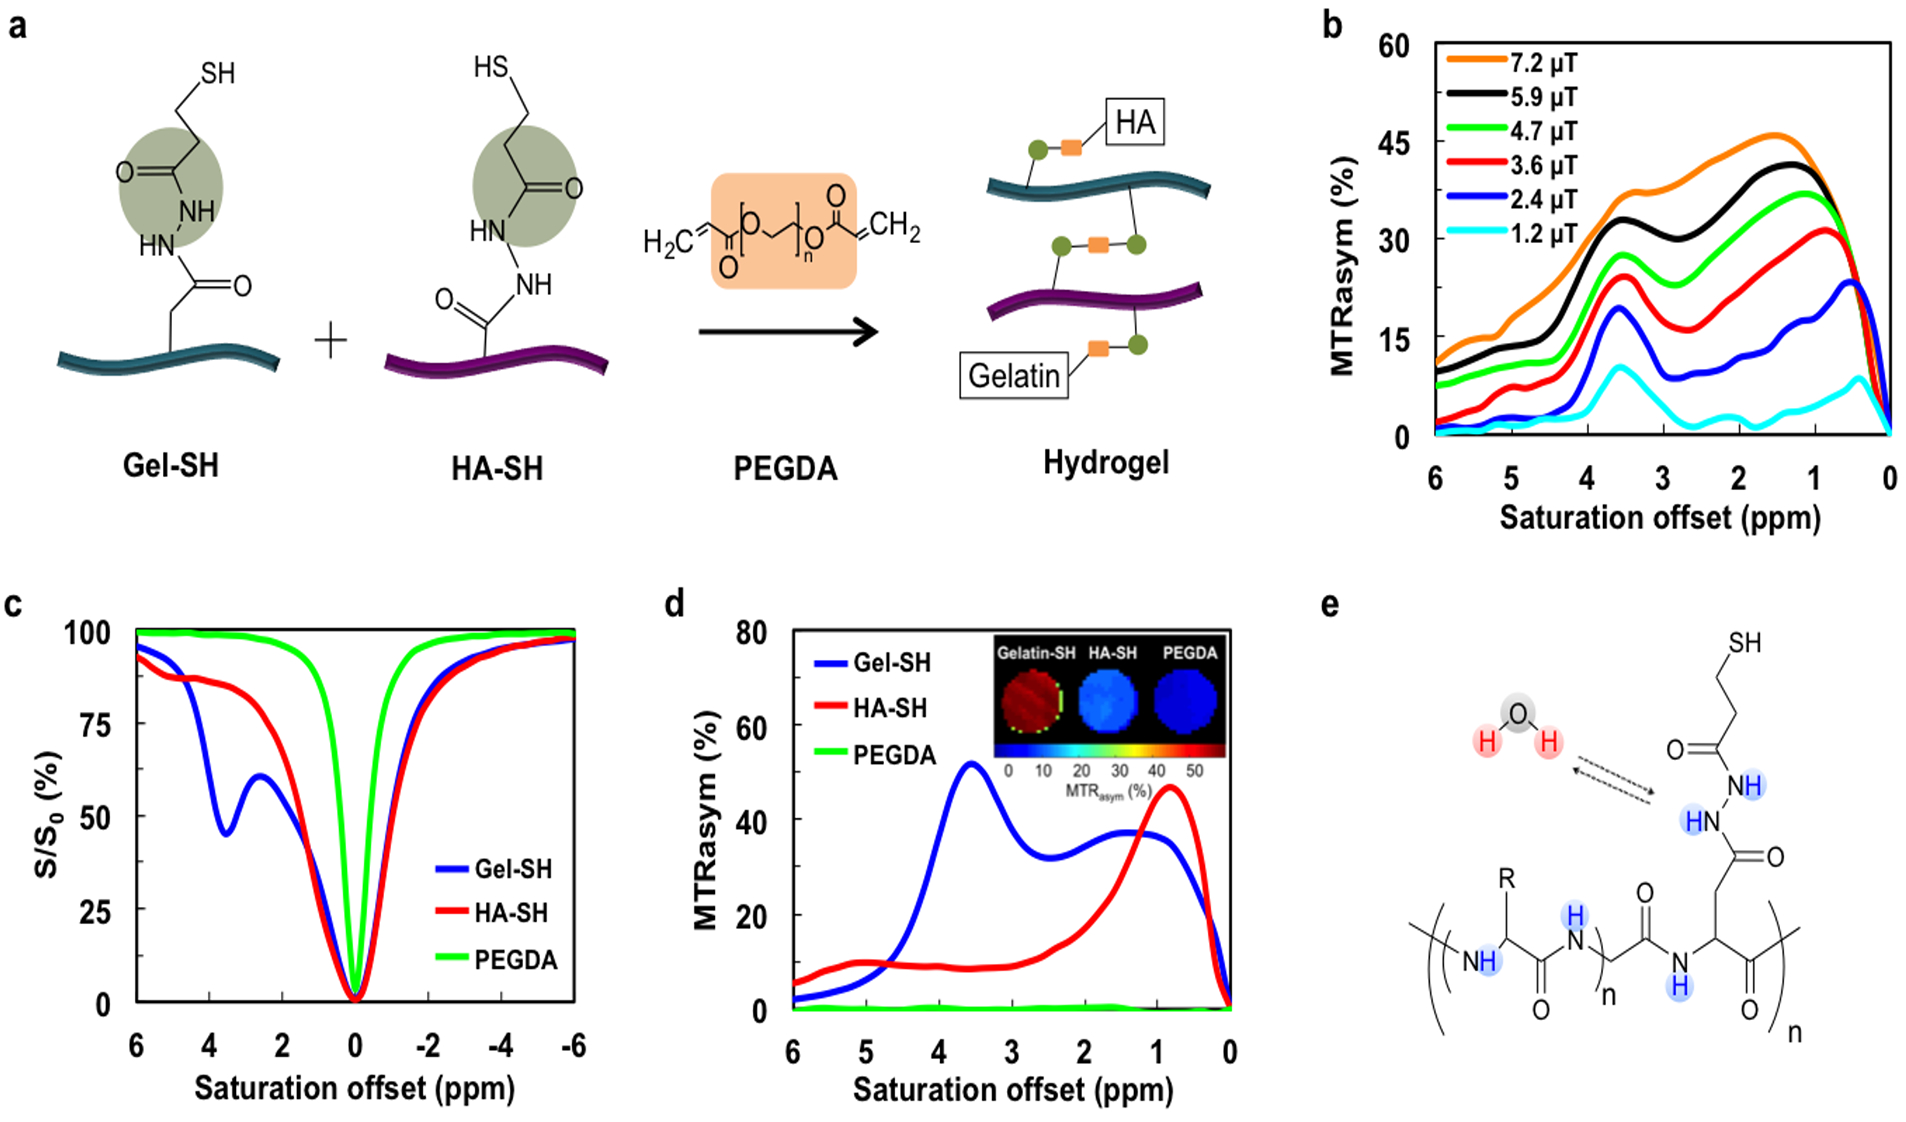
a) Scheme of hydrogel formation. PEGDA serves as a crosslinker between Gel and HA. b) Dependence of composite hydrogel MTRasym values on saturation powers of B1=1.2, 2.4, 3.6, 5.9, and 7.2 μT. Two peaks (0.5–2.0 and 3.6 ppm) are present. c) Z-spectra and d) MTRasym values of the three individual hydrogel components, Gel-SH, HA-SH, and PEGDA, for a saturation power of 3.6 μT. Inset show a CEST MR image of the three individual components at 3.6 ppm. e) Chemical structure of Gel-SH showing the multiple amide protons that are exchangeable with water.
Since gelatin is the major contributor of CEST contrast, its proportion in the composite hydrogel was then increased up to a 4:1 Gel-SH to HA-SH ratio in an effort to achieve higher CEST contrast. As expected, the peak between 0.5–2.0 ppm, representing HA hydroxyl protons, remained constant amongst the four formulations of hydrogels. In contrast, the CEST signal of gelatin increased greatly (Figure 2a,b). The MTRasym values showed a linear correlation with the gelatin content in the hydrogel (R2=0.94) (Figure 2c). Next, we examined the CEST properties of hydrogels in vivo. Hydrogels with 4:1 and 1:1 Gel-SH:HA-SH ratios were injected into the striatum of mouse brain. A control group receiving a saline sham injection exhibited a homogeneous CEST map without any distinct contrast in the region of injection (Figure 2d). In contrast, both the 4:1 and 1:1 hydrogel could be clearly distinguished from the surrounding brain tissue. The in vivo MTRasym spectra and CEST maps were similar to those seen in vitro, with two peaks at 0.5–2.0 ppm and 3.6 ppm, with a higher CEST contrast for the higher gelatin content (Figure 2e). However, in contrast to the in vitro studies, the peak at 0.5–2.0 ppm also increased for higher gelatin. The saline control showed a broad peak of endogenous tissue contrast, without a peak at 3.6 ppm, and a shift from 0.5–2.0 ppm seen in vitro to 2.0 ppm in vivo. Tissues possess a vast majority of ECM, including proteins, polysaccharides, and other biomolecules, which all will contribute to the overall CEST signal. Brain tissue has also a high content of HA[14]. Regardless of the underlying contributions, it is evident that the signal at 3.6 ppm provides a more specific indicator for the presence of the hydrogel.
Figure 2. In vitro and in vivo CEST MRI of hydrogel formulations with varying gelatin content.
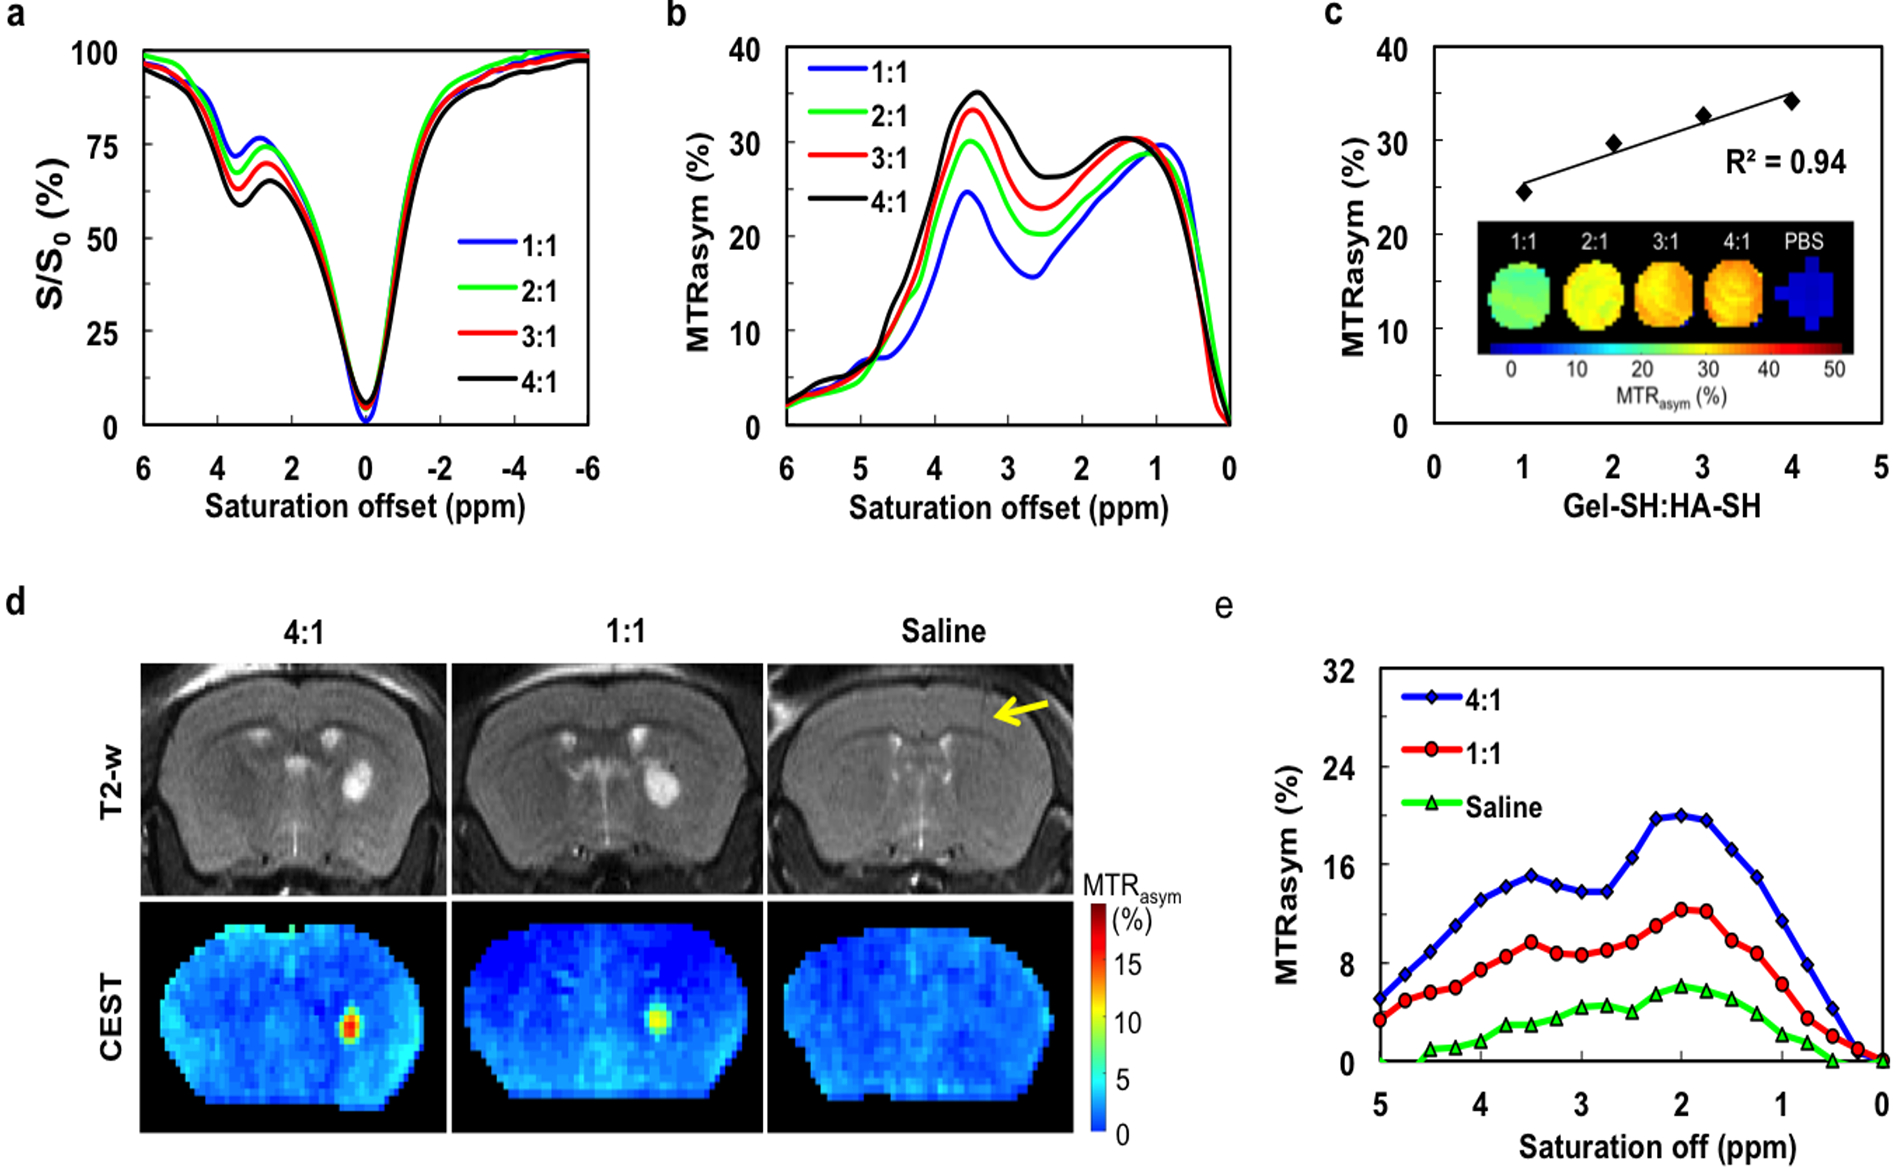
a) In vitro z-spectra and (b) In vitro MTRasym values of hydrogels with different Gel-SH to HA-SH ratios (4:1, 3:1, 2:1, and 1:1) for a saturation power of 3.6 μT. c) Quantitative MTRasym values and CEST maps for various hydrogels at 3.6 ppm. Increasing the proportion of Gel-HS leads to higher CEST contrast, with the MTRasym values exhibiting a linear correlation with gelatin content. d) In vivo CEST MRI at 3.6 ppm of hydrogels (4:1 and 1:1 Gel-SH:HA-SH ratio) and sham (saline) control injected into striatum of mouse brain (arrow indicates needle track). d) In vivo MTRasym values of implanted hydrogel scaffolds and sham control.
2.2. Rheological hydrogel properties
As the stiffness of tissues varies from 0.1 kPa for soft brain tissue to more than 30 kPa for the rigid calcifying bone,[15] the rheological properties of hydrogel scaffolds must be targeted to have a value that is within the range of the relevant tissue.[16] We therefore measured the rheological properties of hydrogels. The gelation of the hydrogel is initiated immediately after the addition of PEGDA (Figure 3a). Different Gel-SH to HA-SH ratios affected the rheological properties and gelation rate, showing a lower storage modulus and prolonged gelation time with increasing gelatin content. The complex viscosity (η) was then measured as a function of frequency (ω) (Figure 3b). The complex viscosity approaches a linear relationship with increasing frequency, suggesting the presence of crosslinked gel structures.[15] The complex viscosity decreased with increasing gelatin content, suggesting that gelatin promotes the relative movement between macromolecular chains. The storage moduli of all hydrogels displayed a plateau in a frequency range of 0.1–100 rad/s (Figure 3c), indicating that the hydrogels are crosslinked and mechanically robust. By altering the ratio of Gel-SH to HA-SH, the stiffness of hydrogel could be easily tuned. The storage (elastic) modulus was 426 Pa for the 1:1 hydrogel, decreasing to 108 Pa for the 4:1 hydrogel (Figure 3d). This variation in stiffness of hydrogel corresponds to the physicochemical properties of the components. Compared with gelatin, HA has a higher rigidity and mechanical stiffness due to the 6-membered ring structure in the main chain (Figure S1, Supporting Information). HA-SH serves as a rigid backbone in the hydrogel, and hence a higher relative proportion of HA-SH leads to a higher mechanical strength.
Figure 3. Rheological properties of hydrogels with varying gelatin content.
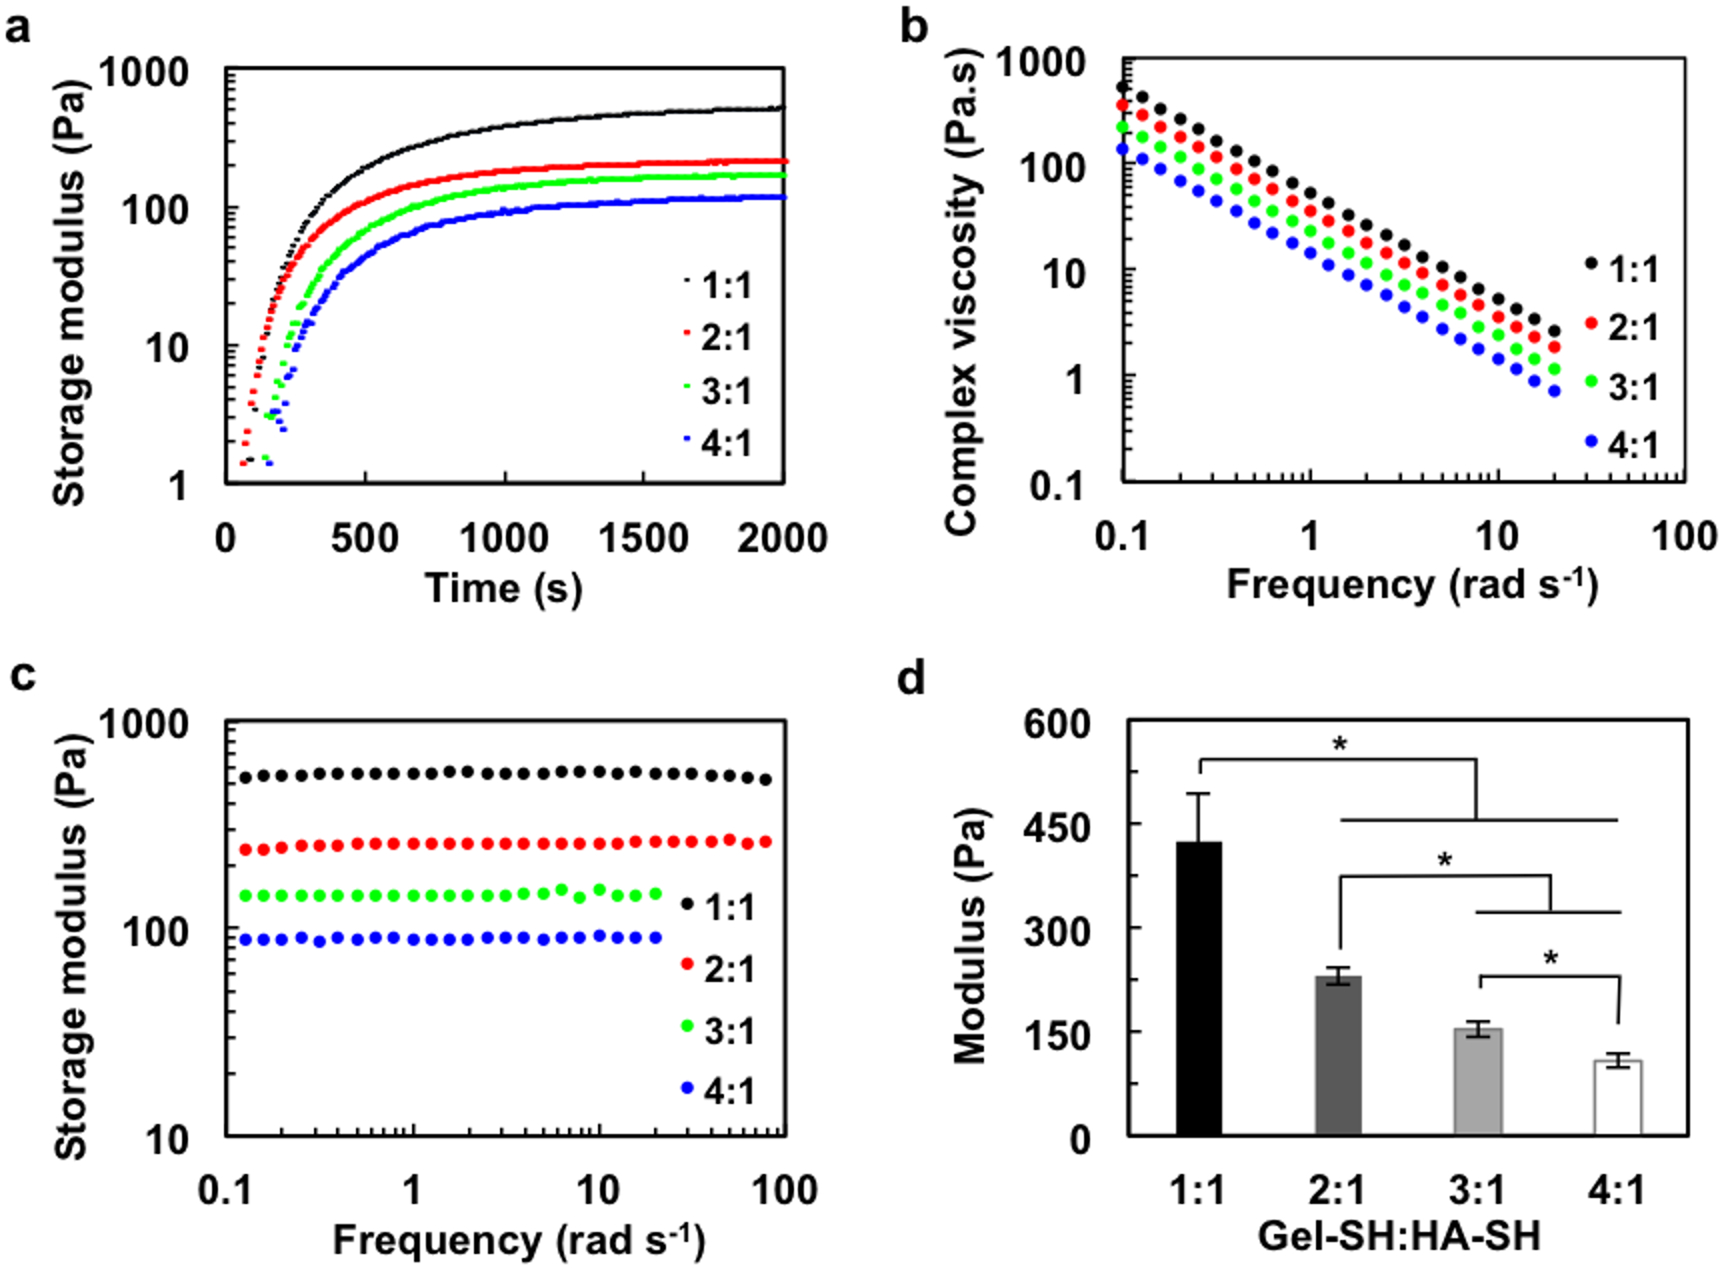
a) Gelation kinetics of hydrogels with different Gel-SH:HA-SH ratios at 37 °C under 1% strain and 1 Hz frequency. The increase of gelatin content prolongs the gelation time, as indicated by the delayed plateau. b) Complex viscosity as a function of frequency. Increasing gelatin content reduces complex viscosity. c) Storage moduli of hydrogels as a function of frequency at 37 °C, and d) corresponding modulus values. *p<0.05, n=3.
The suitability of hydrogels for delivering of scaffolded cells is mainly attributed to their mechanical properties.[17] The stiffness of the hydrogel substrate not only impacts cell migration and proliferation, but also cell differentiation.[18] All our four formulations exhibit the proper stiffness for cerebral implantation, i.e. within the typical range of brain elasticity (Ebrain = 0.1–1 kPa).[19]
2.3. In vitro hydrogel cell scaffolding studies
We have chosen to study the fate of mouse glial-restricted precursor cells (mGRPs) as GRPs have been widely used for cell therapy of stroke,[20] ALS,[21] and dysmyelination[22]. Cells were first scaffolded in hydrogels in vitro and assessed for cell survival. One day after scaffolding, mGRPs demonstrated >60% viability for all four composite hydrogels (Figure 4a,b). Use of the 4:1 Gel-SH:HA-SH hydrogel with the lowest stiffness led to the highest amount of cell survival, i.e., 84% (Figure 4b). Cells kept proliferating for at least 15 days (Figure 4c). In accordance with cell viability measurements, hydrogels with a lower stiffness exhibited a higher cell proliferation rate. This is in agreement with other studies, where it has been reported that the cell proliferation rate decreases with an increase rate of hydrogel stiffness, as a more rigid matrix limits the diffusion of oxygen and cell nutrients, impairing the growth and migration of scaffolded cells.[23] Furthermore, 3D cultures of a 4:1 ratio hydrogel demonstrated a higher cell proliferation rate than that of 2D cultures (Figure 4d). 2D-cultured cells showed a high proliferation during the initial 9 days that leveled off, while the cells in the 3D hydrogels continued to proliferate for over 15 days in culture. This can be explained by cell crowding in 2D monolayers, whereas cells in a 3D hydrogel environment are able to grow in a larger space. Taken together, these results indicate that an increase of gelatin content not only enhances CEST contrast, but also improves cell survival and proliferation due to its softening properties.
Figure 4. Cell survival and cell proliferation in hydrogels with varying gelatin content.
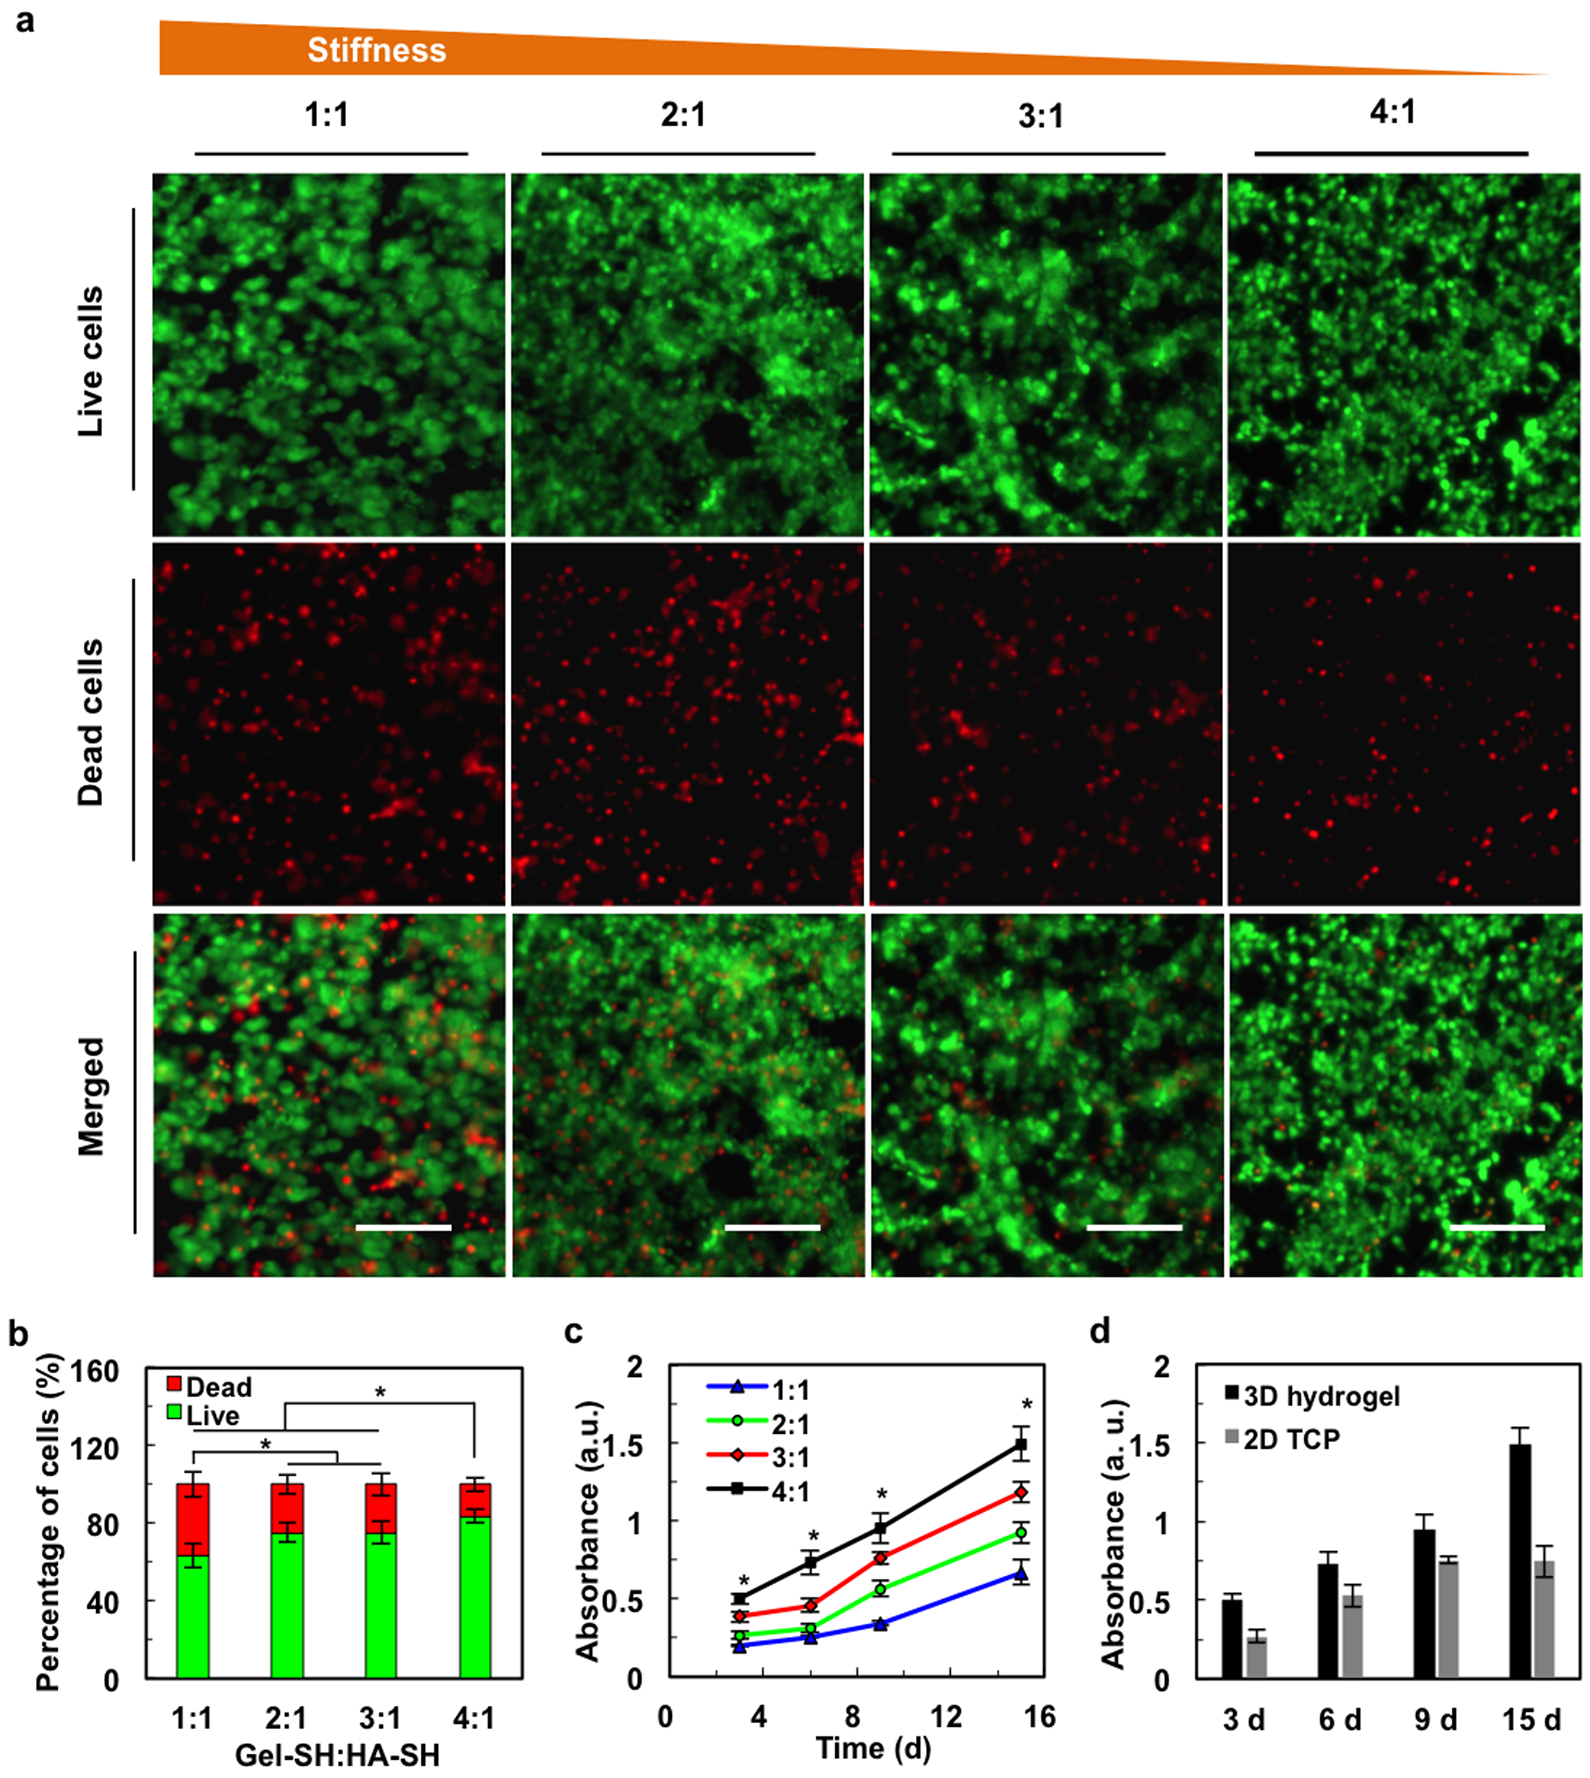
a) Fluorescence live/dead cell staining shows improved cell viability with increasing Gel-SH to HA-SH ratios. Scale bar=100 μm. b) Quantification of live/dead cell assay. c) mGRP proliferation increases with increasing gelatin content. d) Proliferation of mGRPs in 2D vs. 3D hydrogels for 4:1 Gel-SH:HA-SH ratio, *p<0.05, n=5.
2.4. CEST MRI and two-color NIR imaging of composite hydrogel degradation in vitro
Next, we tested the feasibility that CEST MRI can be applied to monitor the degradation of our hydrogel system. A 4:1 ratio hydrogel was selected due to it has highest CEST contrast and protection for optimal cell survival and proliferation. We first incubated our hydrogel with collagenase which is able to digest gelatin, the major component in our 4:1 hydrogel. The CEST signal was then monitored over time. Both the CEST maps and MTRasym values demonstrated a rapid decrease in signal as a result from hydrogel decomposition, which became nearly undetectable at 2 weeks post-digestion (Figure 5).
Figure 5. CEST MRI of collagenase-induced hydrogel degradation in vitro.
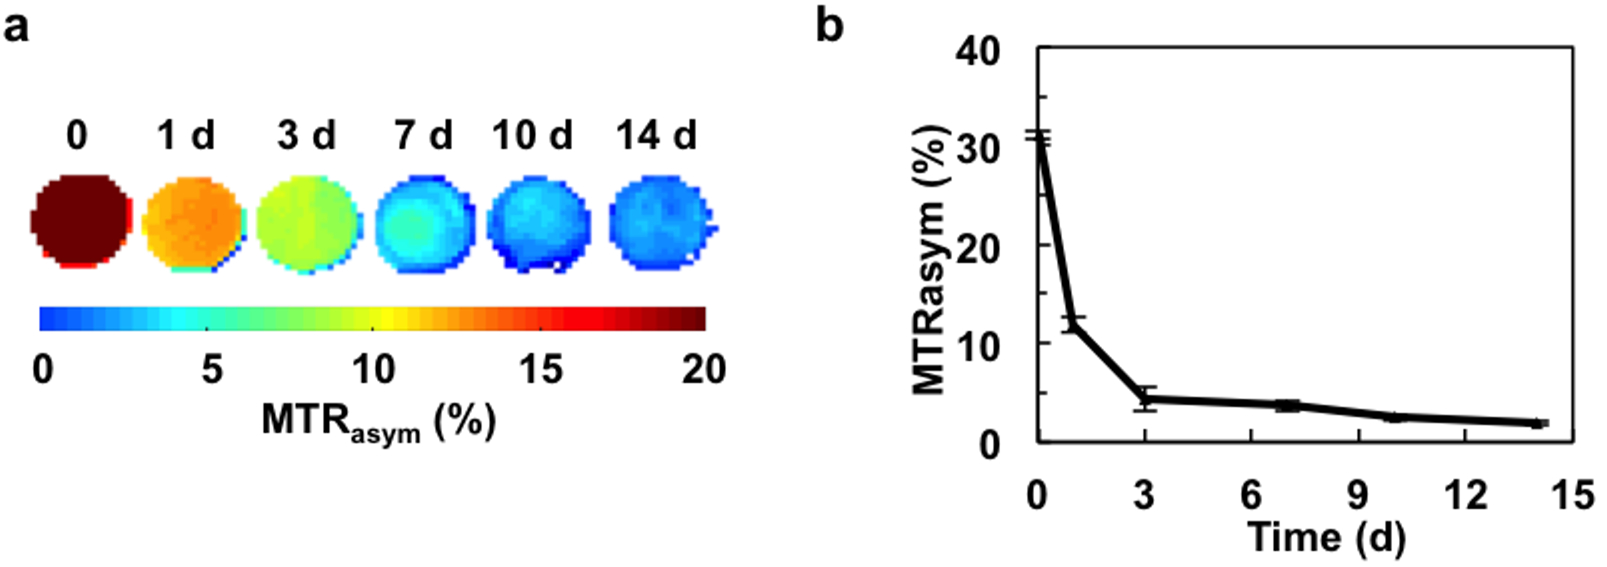
a) CEST MRI maps and b) MTRasym values obtained at 3.6 ppm.
To further validate our findings, we used two-color NIR imaging to independently monitor the collagenase-induced digestion of gelatin vs. HA. Gel-SH and HA-SH were labeled with IRDye 800CW maleimide and IRDye 680LT maleimide, respectively (Figure 6a–c). Through a Michael addition reaction, the maleimide group of the dye permits conjugation to molecules containing free sulfhydryl groups with high yield[8]. The maleimide-induced chemical linkage was stable over time, as the dye remained within the hydrogel without leaking into the upper fluid compartment (Figure 6d). Moreover, no photobleaching was observed. When the composite hydrogel was subjected to collagenase digestion, only the gelatin exhibited a decrease in photon signal that became nearly detectable at 14 days post-digestion. There is a discrepancy between the in vitro NIR and CEST MRI biodegradation measurements in that the CEST MRI signal decreased exponentially while the NIR results showed a linear decrease. This may be explained by the fact that CEST MRI measures the exchangeable protons in the hydrogel. Once the hydrogel is degraded by the enzyme, the number of exchangeable protons decreases immediately even though the degraded products are not removed. In contrast, the in vitro NIR signal is derived from the dye, and unlike CEST MRI not from the gel itself. While washing was done before performing each NIR measurement, the residual dye in the biodegraded gel components was cleared at a slower rate.
Figure 6.
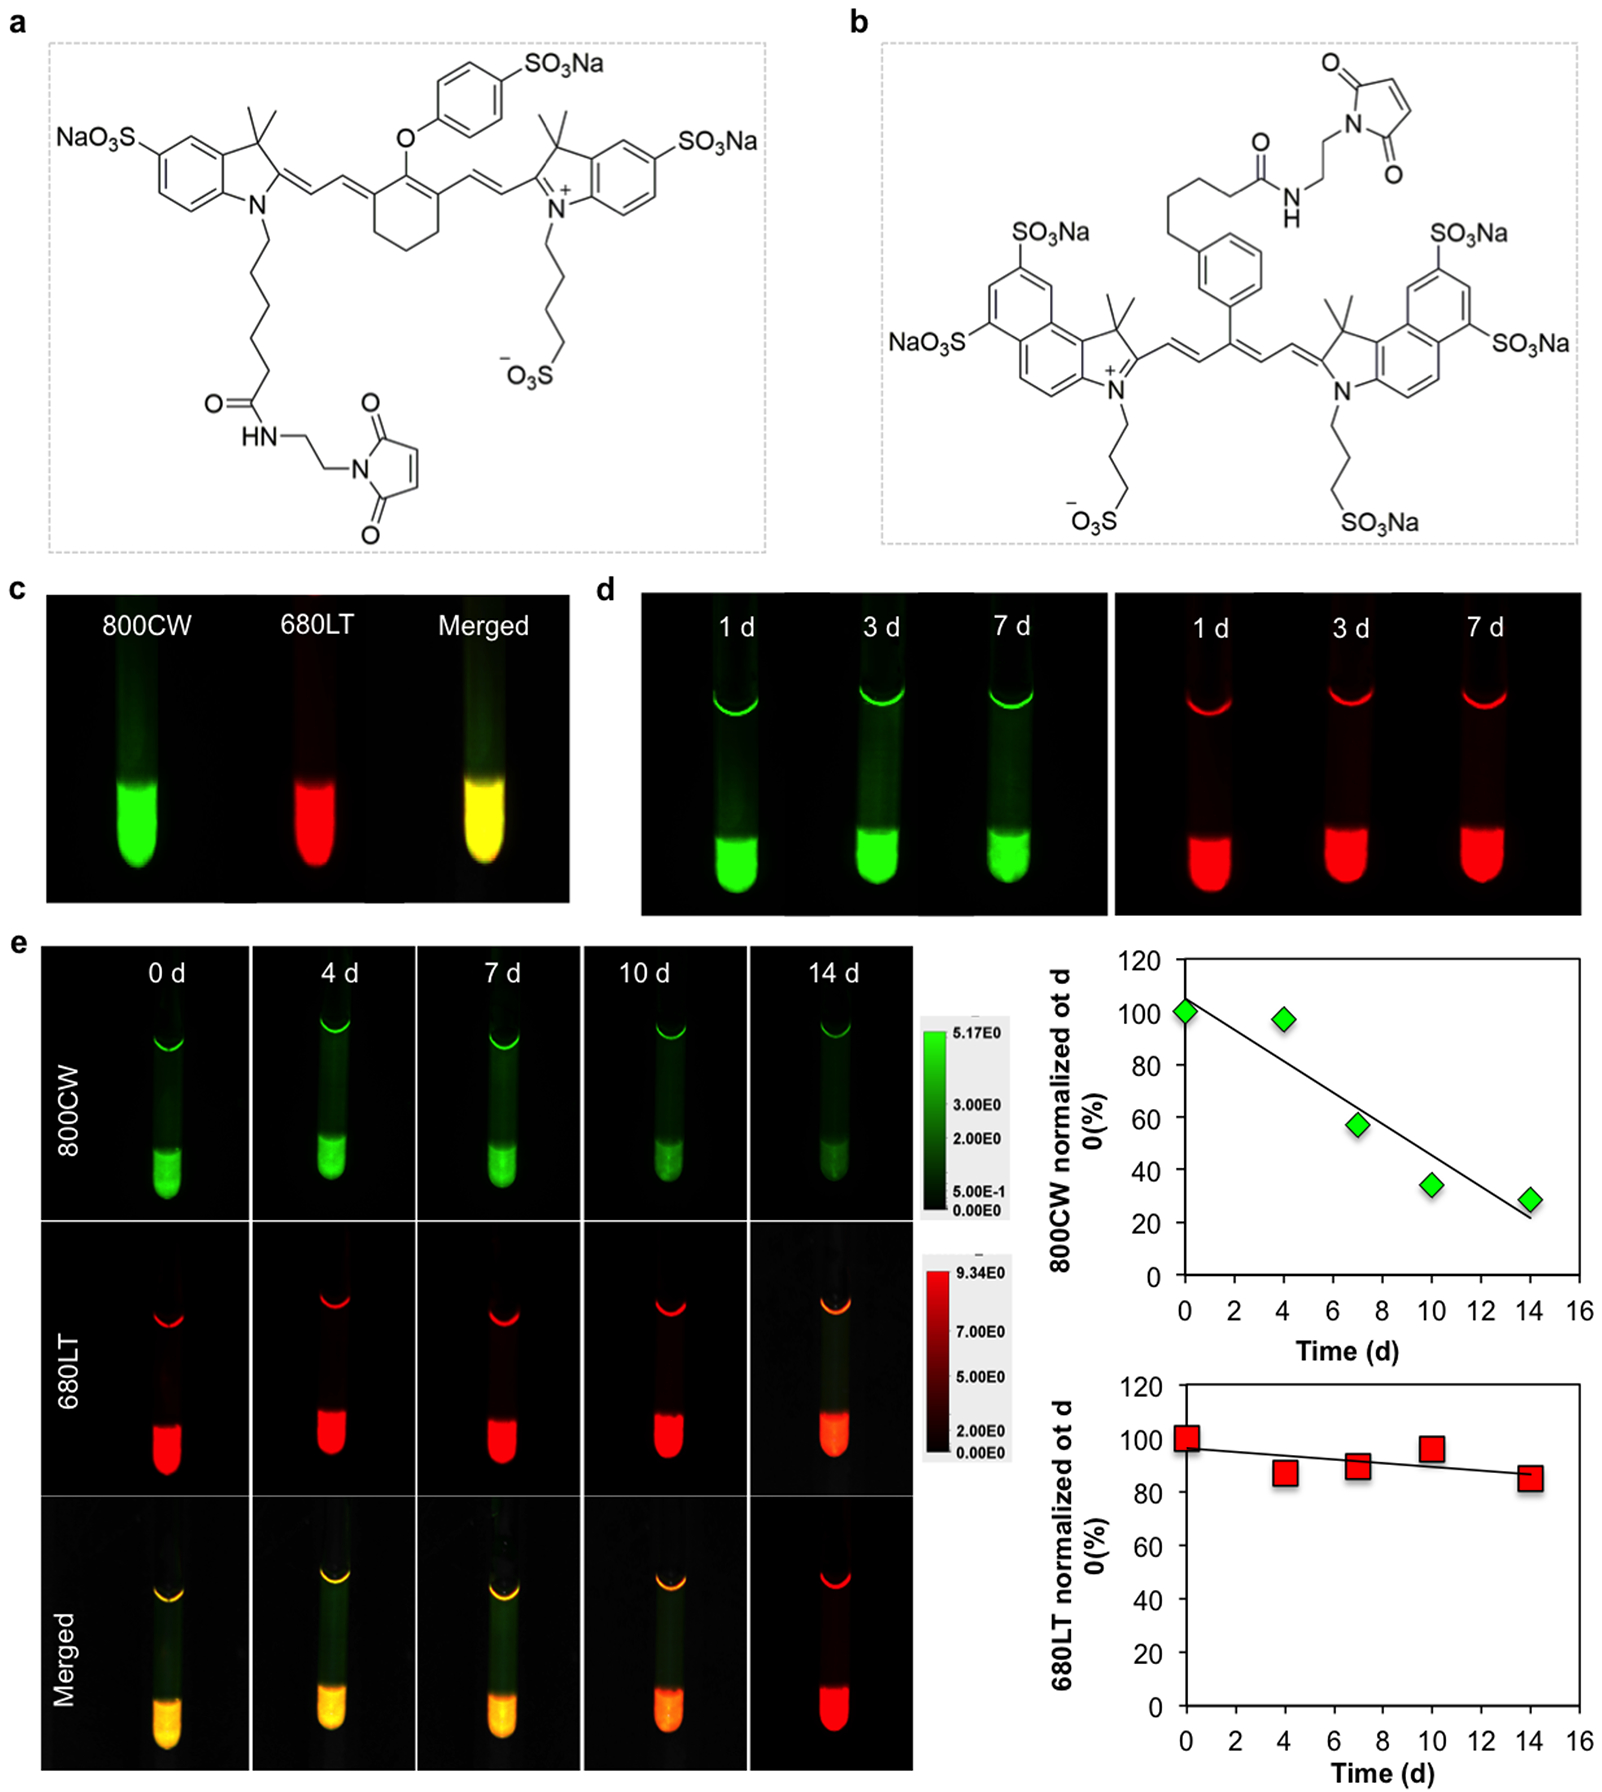
Chemical structure of the two NIR fluorescence dyes a) IRDye 800CW Maleimide and b) IRDye 680LT maleimide used for labeling Gel-SH and HA-SH, respectively. c) In vitro two-color NIR imaging of the composite labeled hydrogel. d) No detectable photobleaching of dyes could be observed over a period of 7 days. e) Two-color NIR images of individual hydrogel component degradation over time, showing collagenase specificity for gelatin. For quantification, data were normalized to day 0 (before collagenase addition).
2.5. CEST MRI and two-color NIR imaging of composite hydrogel degradation in vivo
Following injection of the composite hydrogel into mouse brain striatum, its degradation was monitored over a period of 42 days using CEST MRI and two-color NIR imaging. Prior to performing CEST MRI, T2-weighted MRI was performed to determine the anatomical localization of the hydrogel. Due to its high water content, the hyperintense hydrogel MRI T2-w signal was easily identified (Figure 7a, top), with the signal remaining constant over the entire period while decreasing in size. The signal in T2-w MRI represents the amount of unbound water in the hydrogel, which is affected by hydrogel swelling or shrinking. In contrast, CEST MRI is selective for the exchangeable protons on the hydrogel itself, and not the actual water content. The results showed that the CEST MTRasym values at 3.6 ppm exhibited a continuous decrease over 42 days only in the region of the hydrogel (Figure 7a, bottom).
Figure 7. In vivo CEST MRI and two-color NIR imaging of hydrogel degradation.
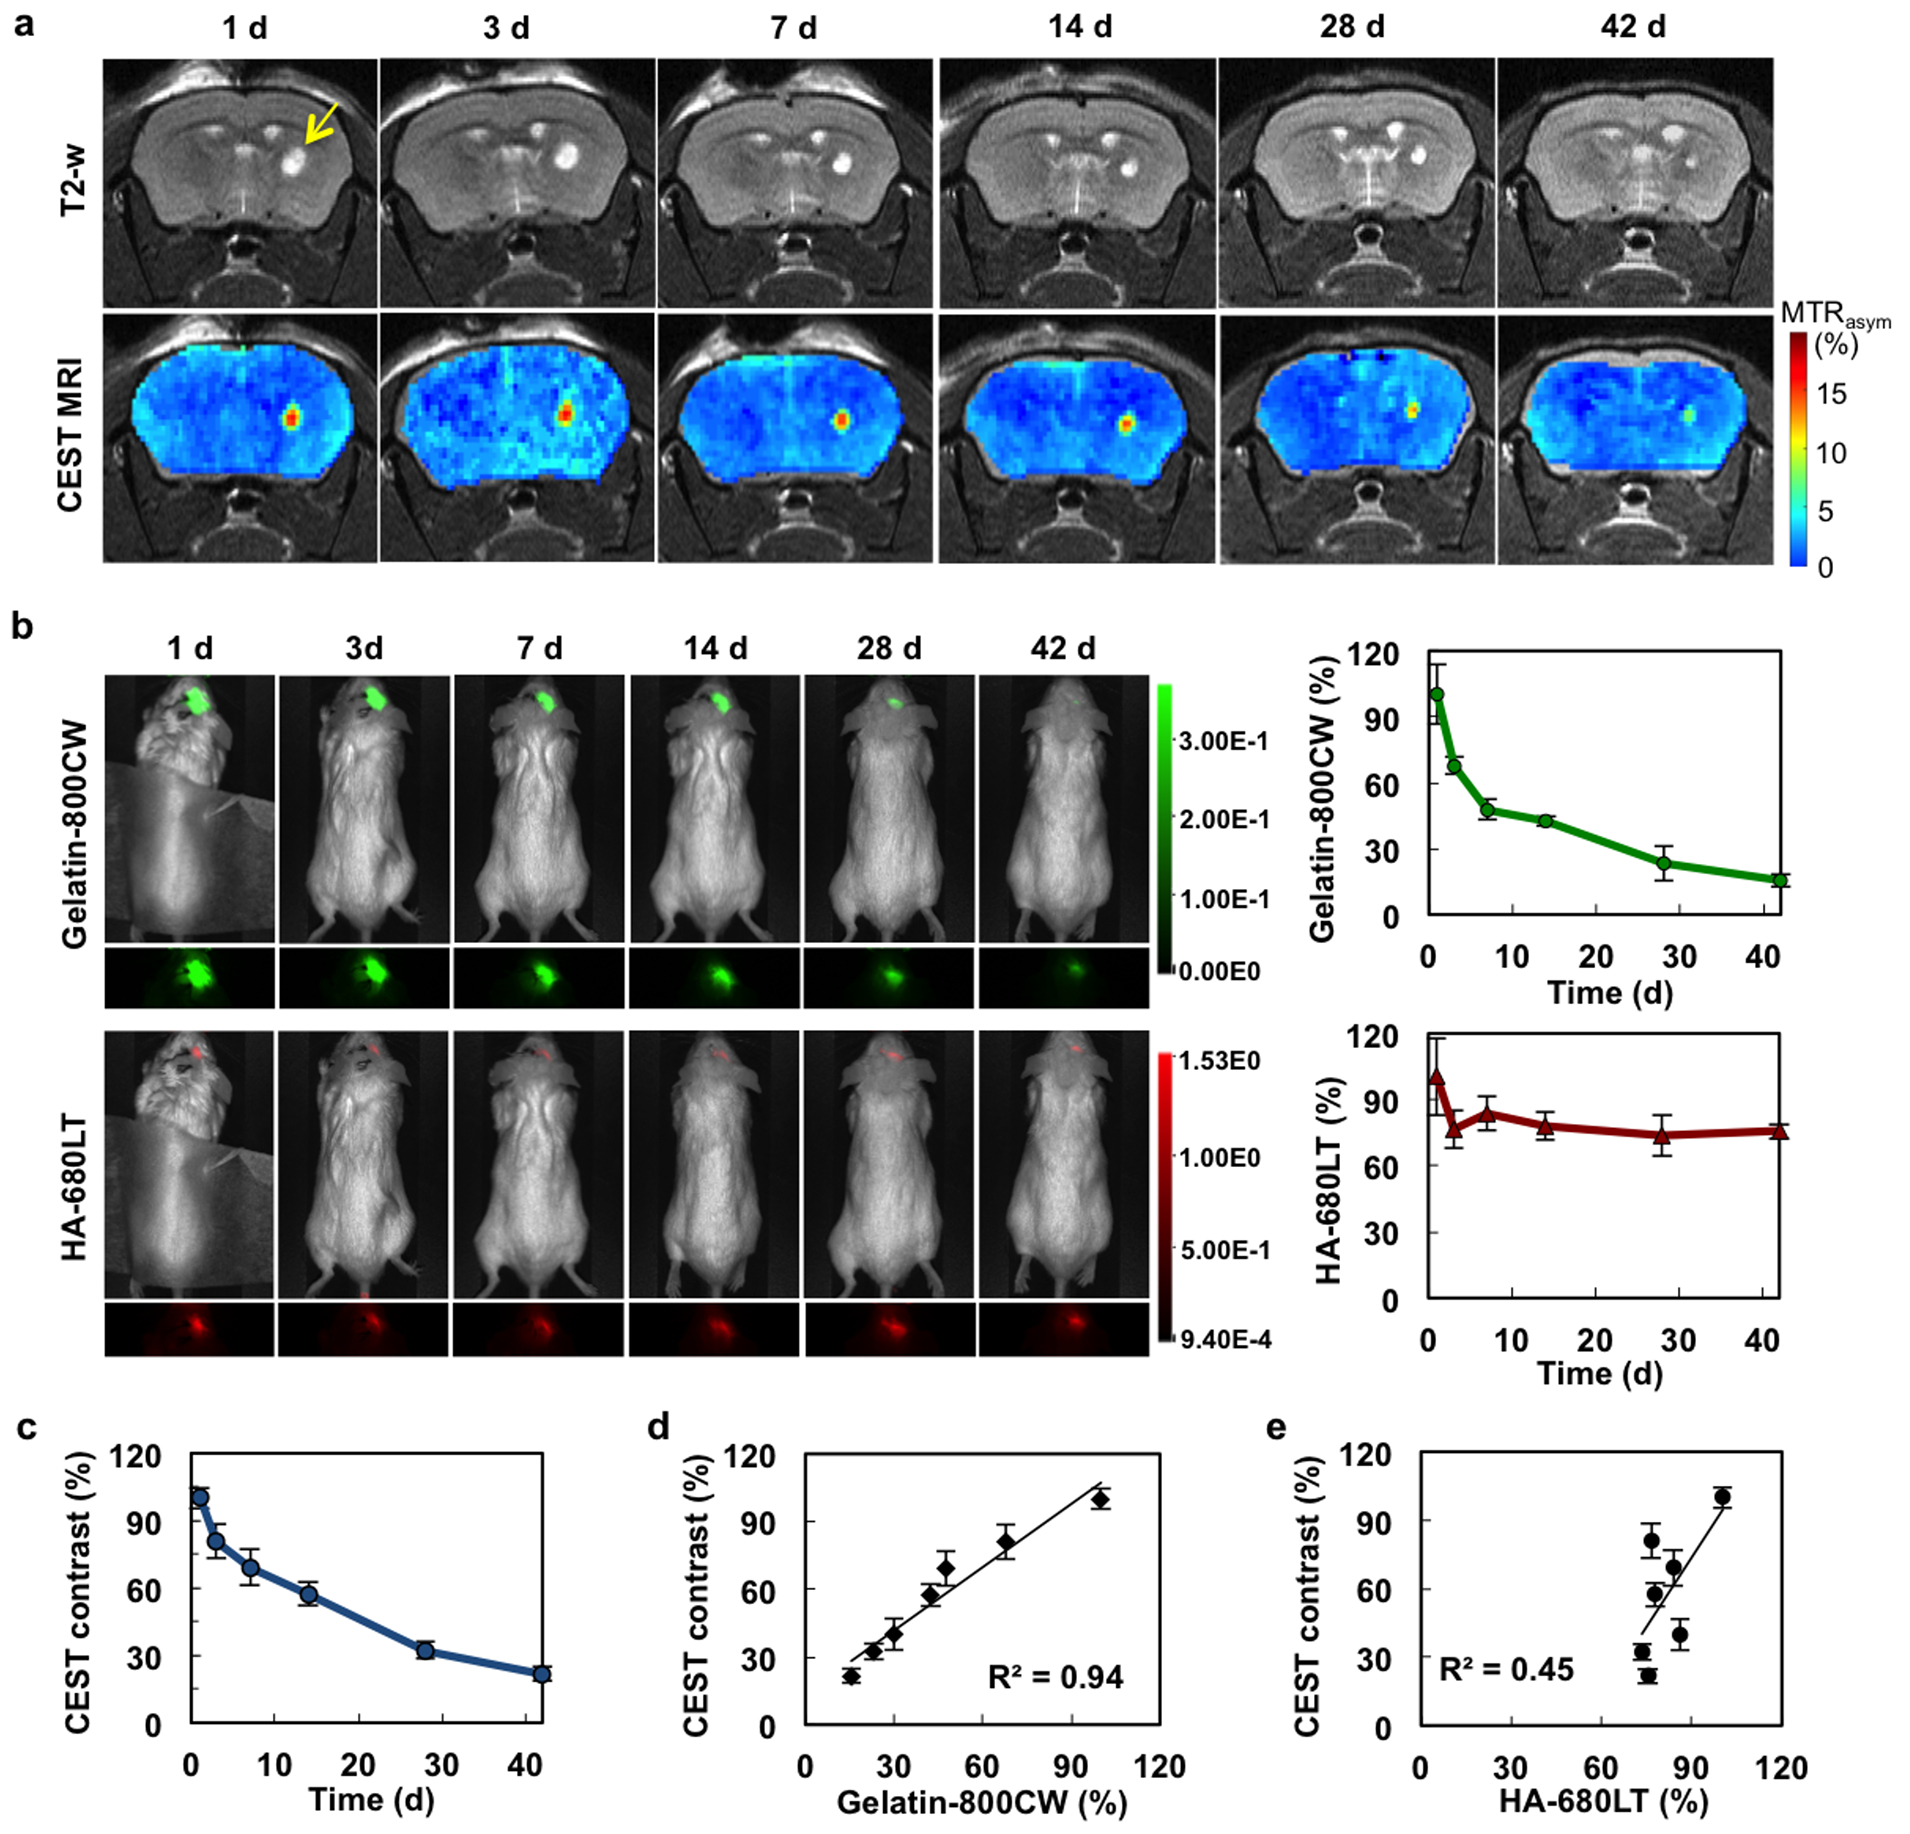
a) Time course of T2-weighted and CEST MRI (at 3.6 ppm) from day 1 to day 42. Arrow indicates the region of hydrogel injection in the striatum. b) NIR images and NIR signal quantification of the same mice shown in a) (gelatin=green; HA=red). c) Quantification of CEST MRI signal. d) and e) Correlation of the in vivo CEST MRI signal NIR signal for gelatin and HA, respectively. For quantification, all data were normalized to day 1 (n=4 animals).
Two color NIR-imaging was then used to assess the in vivo biodegradation of gelatin vs. HA. Similar to the in vitro degradation studies, the HA NIR signal remained nearly constant over the entire period, while the gelatin NIR signal showed a sharp decrease (Figure 7b), mimicking the time course of the declining CEST MRI signal (Figure 7c). Correlative analysis between the CEST MRI signal and gelatin NIR signal showed an excellent agreement (R2=0.94, Figure 7d), while the CEST MRI/HA NIR signal correlated poorly (R2=0.45, Figure 7e). These results are a further indication that gelatin-sensitive CEST MRI can properly monitor the degradation of the hydrogel in vivo.
2.6. Host response to implanted hydrogels
Following the last imaging time point of day 42 post-implantation, the presence of GFAP+ astrocytes could be observed around the hydrogel scaffold injection site (Figure 8a–c). Macrophage/microglia infiltration around this area was negligible, as evidenced by ant-Iba-1 staining (Figure 8d–f). Prussian blue staining for iron showed an absence of any remaining hemorrhagic trauma (Figure 8g–i).
Figure 8. Histopathological analysis of hydrogel scaffolds 42 days post-implantation.
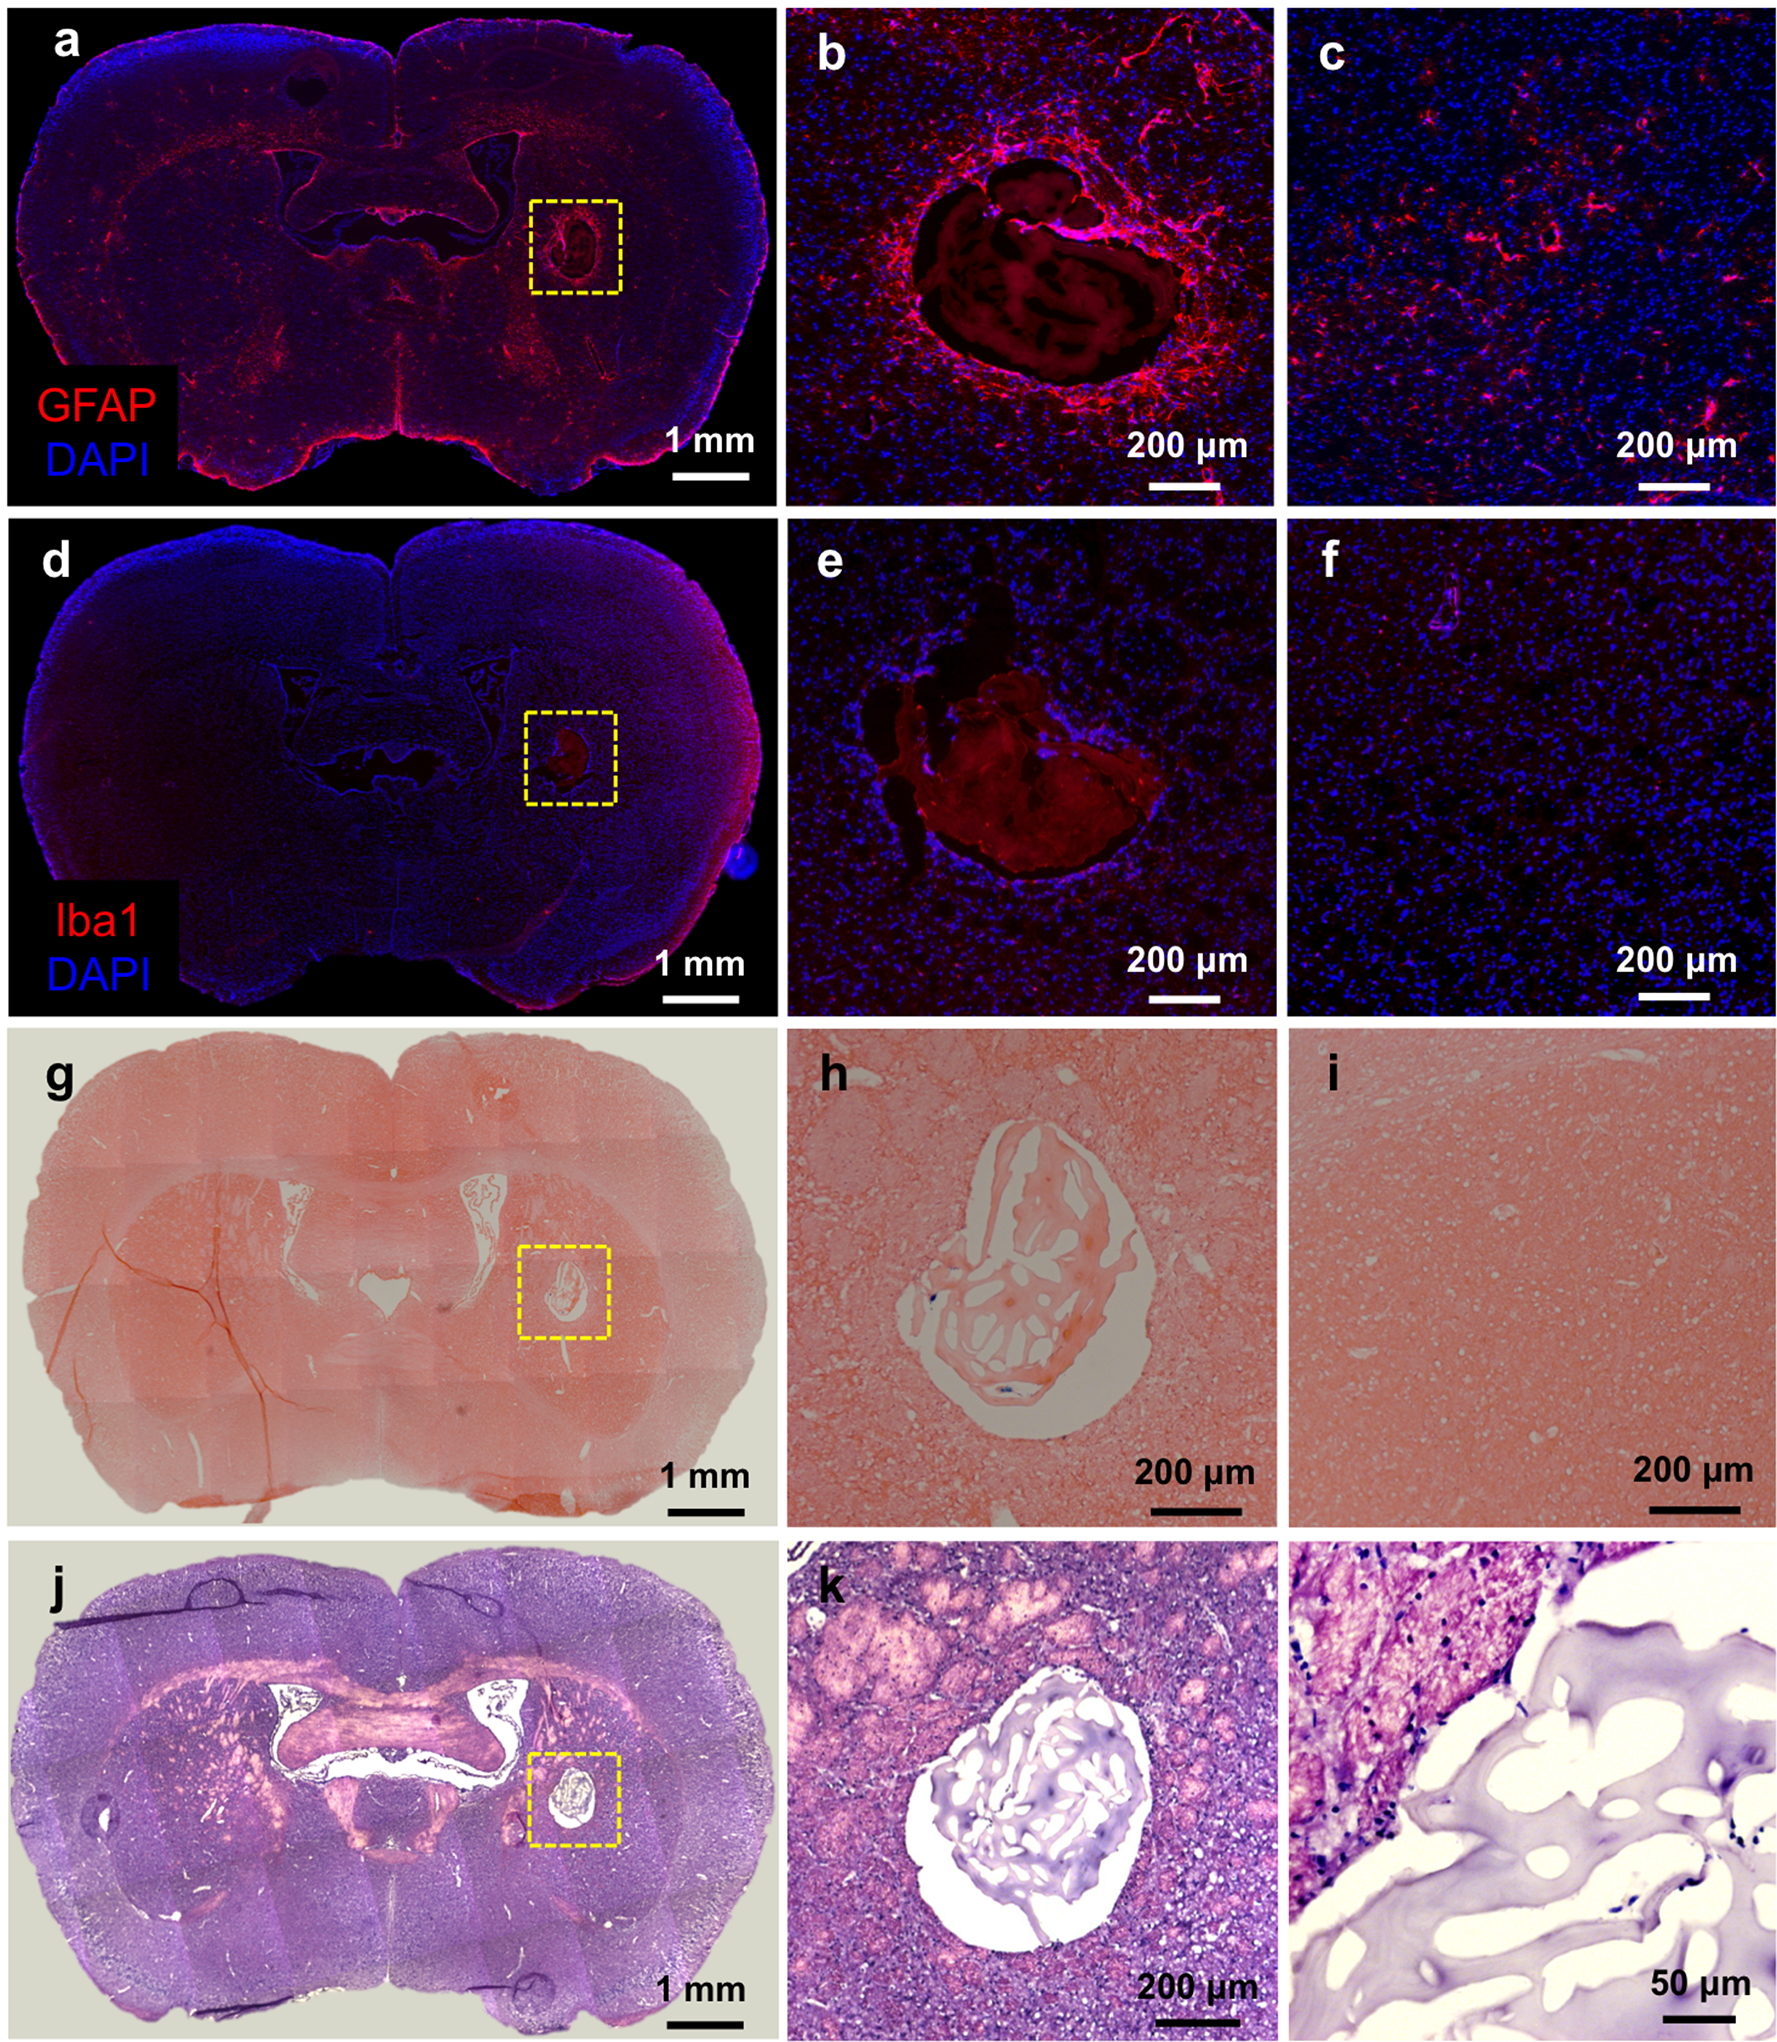
a) Anti-GFAP immunostaining, b) high magnification image of injected area, and c) contralateral (non-implanted) side of the same section. d) Anti-Iba-1 immunostaining, e) magnified image of the hydrogel scaffold injected area, and f) contralateral (non-implanted) side. g) Prussian blue/eosin staining, h) magnified image of the hydrogel scaffold injected area, and i) contralateral (non-implanted) side. j) H&E staining and k, l) high magnification images of the hydrogel scaffold injected area.
Hematoxylin/eosin staining (Figure 8j–l) was applied to observe the remaining hydrogel scaffold morphology. The hydrogel scaffold did not maintain an intact structure due to our deducted loss of gelatin content, with gelatin degradation compromising the preservation of the scaffold’s internal structure. This, over time, leads to a decrease of the overall volume of the implanted hydrogel scaffold, which is accompanied by a decrease in water content. As a result, the T2w-image signal decreases over time (see Fig, 7a) as the hydrogel volume changes. This is in contrast to the HA-specific NIR signal, which did not change given that the hydrogel volume is not related to the HA-NIR signal.
3. Conclusions
Composite gelatin-containing hydrogels can be visualized non-invasively with CEST MRI. The CEST contrast is dependent on the proportion of gelatin in the hydrogel, with higher amounts providing higher contrast. Time course studies both in vitro and in vivo demonstrate that a decay in CEST MRI signal is caused by gelatin degradation, as validated using two-color NIR imaging studies.
4. Experimental section
Hydrogel preparation and characterization.
Gel-SH, HA-SH, and PEGDA were purchased from from ESI BIO Stem Cell Solutions (Alameda, CA). Gel-SH, HA-SH, and PEGDA were dissolved in degassed, deionized water at a concentration of 20 mg mL−1. Hydrogels were synthesized by mixing 20 mg mL−1 Gel-SH and 20 mg mL−1 HA-SH at different ratios (v/v), followed by the addition of 20 mg mL−1 PEGDA as crosslinker. The amount of PEGDA equals to 25% of the total volume of Gel-SH and HA-SH. Four formulations of hydrogels were prepared, with Gel-SH to HA-SH ratios of 1:1, 2:1, 3:1, and 4:1. The rheological properties of hydrogels were examined using an ARES G2 rheometer (TA Instruments, New Castle, DE) equipped with a 25 mm stainless steel parallel plate geometry, using a 0.5 mm gap height. Dynamic oscillatory strain amplitude sweep measurements were performed with a constant strain of 1% and frequency of 1 Hz. After completion of the initial time sweep, a dynamic frequency sweep (0.1–100 rad s−1, 1% strain) was applied. Each set of experiments was performed in triplicate at 37 °C, with samples protected in a closed environment to avoid evaporation.
In vitro CEST MRI.
In vitro CEST MRI was carried out at 37 °C on an 11.7 T Bruker Avance system (Bruker Biosciences, Billerica, MA) using a 15 mm birdcage transmit/receive coil. CEST images were acquired using a continuous wave saturation pules of 4 s as preparation, followed by a Rapid Acquisition with Relaxation Enhancement (RARE) readout. A Quantitation of Exchange using Saturation Power (QUESP) dataset[24] was acquired using saturation pulses of B1 = 1.2, 2.4, 3.6, 4.7, 5.9, and, 7.2 μT. Saturation offsets were incremented from −6 to +6 ppm with a 0.2 ppm step size. Other imaging parameters were: slice thickness=1 mm, repetition time (TR)=6000 ms, TE (echo time)=5 ms, matrix size=64×64, field of view (FOV)=17×10 mm, RARE factor=32. All data were processed using custom-written scripts in Matlab (MathWorks, Natick, MA). CEST contrast was calculated as MTRasym = (S−Δω – S+Δω)/S0, where S-Δω, S+Δω, and S0 represent the water signal with saturation frequency offsets at –Δω, +Δω, and without saturation, respectively.
Assessment of cell survival.
mGRPs were derived from mid-gestation (E13) transgenic mice as previously described,[25] except that cells were dissected from the fetal forebrain tissue. Cells were expanded in maintenance medium composing of serum-free Dulbecco’s modified Eagle’s-F12 medium (Life Technologies, Grand Island, NY) supplemented with bovine serum albumin (Sigma, St. Louis, MO), basic fibroblast growth factor (Cell Signaling Technology, Danvers, MA), B-27 (Life Technologies), and N-2 supplement (Life Technologies). Cultures were maintained in a humidified atmosphere of 5% CO2 at 37 °C. For cell scaffolding, mGRPs were pelleted and suspended in precursor solution (Gel-SH and HA-SH) followed by addition of PEGDA. The cell density was 1×10⁷ cells mL−1. 10 μL of scaffolded mGRPs were cast into a 5 mm diameter and 0.5 mm thickness silicone mold. Cell medium was replaced every other day. To determine cell viability, a live/dead assay was performed. After 24 h incubation, hydrogels containing mGRPs were washed with PBS and subsequently stained using a Live/Dead cell staining kit (BioVision, Milpitas, CA). Fluorescent images were taken using a Zeiss Apotome 2 fluorescence microscope. The percentage of live and dead cells was quantified using ImageJ software (NIH, Bethesda, MD). Cell proliferation was measured using a cell counting kit-8 (CCK-8, Dojindo Molecular Technologies, Rockville, MD) according to the manufacturer’s instructions.
In vitro hydrogel degradation studies.
A 4:1 ratio of Gel-SH:HA-SH hydrogel was incubated with 1 mg mL−1 collagenase (Clostridium histolyticum type IV, Sigma, St. Louis, MO) at 37 °C. CEST MRI and NIR imaging was performed on day 1, 3, 7, 10, and 14 post-digestion. For each time point, the collagenase solution was first removed and the hydrogel was then washed with PBS twice for 5 min. CEST MRI and MTRasym maps were collected at 3.6 ppm using a saturation power of 3.6 μT, using the in vitro CEST imaging parameters described above. Following each measurement, fresh collagenase solution was added to the samples for the next measurement. The degradation rate was calculated by normalizing MTRasym values to day 0.
For NIR imaging, Gel-SH and HA-SH were first incubated overnight at 4 °C with 5%/1mM IRDye 800-CW maleimide and 5%/1 mM 680-LT maleimide (both from LI-COR Biosciences, Lincoln, NE), respectively. Composite hydrogels were then synthesized by mixing the labeled Gel-SH and HA-SH with PEGDA as described above. Prior to imaging, the hydrogel was rinsed twice with PBS to remove the degraded residues. NIR images were obtained using a Pearl Trilogy Small Animal Imaging System (LI-COR Biosciences).
Animal surgery.
All animal procedures were carried out under an approved IACUC protocol. The 4:1 composite hydrogel, labeled with the two NIR dyes as described above, was injected into the brain striatum (AP=0; ML=2.0; DV=3.0 mm) of immunodeficient, rag2−/− mice (n=4, male, 8–12 weeks old, Taconic Farms, Hudson, NY). Mice were anesthetized with 1–2% isoflurane and placed in a stereotaxic device (Stoelting Co., Wood Dale, IL). 3 μL of the hydrogel was injected at a rate of 0.5 μL min−1 using a Hamilton microsyringe. The start of the injection procedure was 5 min after the initial mixture of the three gel precursors. After completing the injection, the needle was kept in place for 2 min and then slowly withdrawn to minimize backflow.
Monitoring of hydrogel degradation in vivo.
CEST MRI was performed on isoflurane-anesthetized animals using an 11.7 T horizontal bore Bruker Biospec scanner. A RARE sequence was used with the following parameters: B1=3.6 μT with offset sampling from −5.5 to 5.5 ppm (0.225 ppm steps), saturation pulse=2.5 s, slice thickness=1 mm, TR=5500 ms, TE=3.7 ms, matrix size=96×64, FOV=17×16 mm, RARE factor=16. MTRasym values were calculated as described above. In vivo NIR imaging was performed using the same Pearl Trilogy Small Animal Imaging System described above. Mice were shaved to minimize autofluorescence background.
Immunofluorescence staining.
After the last imaging time point (42 days), the animals were transcardially perfused with 5% sucrose followed by 4% paraformaldehyde. The brains were dissected and cryopreserved in 30% sucrose in PBS, and then cut into 30 μm sections. For immunofluorescence staining, sections were first blocked with 5% BSA in 0.1% Triton X-100 (Sigma, St. Louis, MO) for 1 h prior to overnight incubation at 4 °C with primary antibodies, rabbit anti-GFAP (1:250, Dako, Santa Clara, CA) and rabbit anti-Iba1 (1:250, Wako, Japan). Sections were then incubated with the secondary antibody anti-rabbit Alexa-fluor 594 (1:250, Invitrogen, Carlsbad, CA) for 2 h. Immunofluorescence images were acquired using a Zeiss Apotome 2 fluorescent microscope.
Prussian blue staining.
For Prussian blue staining, sections were fixed with 4% glutaraldehyde for 10 min. After washing with double-distilled H2O 3 times, sections were incubated with Perls’ reagent for 30 min in the dark. Perls’ reagent was prepared by dissolving 1 g potassium ferrocyanide (Sigma, St. Louis, MO) in 42 mL ddH2O followed by adding 8 mL of 37.5% HCl. Sections were then counterstained with eosin for 40 seconds. Sequential sections were also stained with H&E. Microscopic images were acquired using a Zeiss Apotome 2 fluorescent microscope.
Statistical analysis.
Data are presented as mean ± standard deviation and were analyzed using one-way analysis of variance (ANOVA) for multiple comparisons with Tukey’s post hoc test. A two-tailed Student’s t-test was used for comparison between two groups. A p<0.05 was considered statistically significant.
Supplementary Material
Acknowledgements
This work is supported by NIH R01EB023647, MSCRFD-3899, and MSCRFF-4250.
Footnotes
Supporting Information
Supporting Information is available from the Wiley Online Library or from the author.
Confiict of Interest
The authors declare no confiict of interest.
References
- [1].Burdick Jason A., Mauck Robert L., Gerecht S, Cell Stem Cell 2016, 18, 13. [DOI] [PubMed] [Google Scholar]
- [2].a) Orive G, Anitua E, Pedraz JL, Emerich DF, Nature Reviews Neuroscience 2009, 10, 682; [DOI] [PubMed] [Google Scholar]; b) Lee AS, Inayathullah M, Lijkwan MA, Zhao X, Sun W, Park S, Hong WX, Parekh MB, Malkovskiy AV, Lau E, Qin X, Pothineni VR, Sanchez-Freire V, Zhang WY, Kooreman NG, Ebert AD, Chan CKF, Nguyen PK, Rajadas J, Wu JC, Nature Biomedical Engineering 2018, 2, 104. [DOI] [PMC free article] [PubMed] [Google Scholar]
- [3].a) Liang Y, Walczak P, Bulte JW, Biomaterials 2013, 34, 5521; [DOI] [PMC free article] [PubMed] [Google Scholar]; b) Elisseeff J, Nat Mater 2008, 7, 271. [DOI] [PubMed] [Google Scholar]
- [4].Aguado BA, Mulyasasmita W, Su J, Lampe KJ, Heilshorn SC, Tissue Engineering Part A 2011, 18, 806. [DOI] [PMC free article] [PubMed] [Google Scholar]
- [5].Tondera C, Wieduwild R, Röder E, Werner C, Zhang Y, Pietzsch J, Advanced Functional Materials 2017, 27, 1605189. [Google Scholar]
- [6].Khetan S, Guvendiren M, Legant WR, Cohen DM, Chen CS, Burdick JA, Nature Materials 2013, 12, 458. [DOI] [PMC free article] [PubMed] [Google Scholar]
- [7].a) Appel AA, Anastasio MA, Larson JC, Brey EM, Biomaterials 2013, 34, 6615; [DOI] [PMC free article] [PubMed] [Google Scholar]; b) Jin T, Nicholls FJ, Crum WR, Ghuman H, Badylak SF, Modo M, Biomaterials 2017, 113, 176. [DOI] [PMC free article] [PubMed] [Google Scholar]
- [8].Zhang Y, Rossi F, Papa S, Violatto MB, Bigini P, Sorbona M, Redaelli F, Veglianese P, Hilborn J, Ossipov DA, Acta Biomaterialia 2016, 30, 188. [DOI] [PubMed] [Google Scholar]
- [9].Wang L, Li B, Xu F, Li Y, Xu Z, Wei D, Feng Y, Wang Y, Jia D, Zhou Y, Biomaterials 2017, 145, 192. [DOI] [PubMed] [Google Scholar]
- [10].a) Mohandas G, Oskolkov N, McMahon MT, Walczak P, Janowski M, Acta Neurobiol Exp (Wars) 2014, 74, 188; [DOI] [PubMed] [Google Scholar]; b) Appel AA, Larson JC, Jiang B, Zhong Z, Anastasio MA, Brey EM, Ann Biomed Eng 2016, 44, 773. [DOI] [PMC free article] [PubMed] [Google Scholar]
- [11].a) Szulc DA, Cheng HM, Macromol Biosci 2019, 19, e1800330; [DOI] [PubMed] [Google Scholar]; b) Hu S, Zhou Y, Zhao Y, Xu Y, Zhang F, Gu N, Ma J, Reynolds MA, Xia Y, Xu HHK, J Tissue Eng Regen Med 2018, 12, e2085; [DOI] [PubMed] [Google Scholar]; c) Liu J, Wang K, Luan J, Wen Z, Wang L, Liu Z, Wu G, Zhuo R, J. Mater. Chem. B 2016, 4, 1343; [DOI] [PubMed] [Google Scholar]; d) Mertens ME, Hermann A, Buhren A, Olde-Damink L, Mockel D, Gremse F, Ehling J, Kiessling F, Lammers T, Adv Funct Mater 2014, 24, 754; [DOI] [PMC free article] [PubMed] [Google Scholar]; e) Pinney JR, Melkus G, Cerchiari A, Hawkins J, Desai TA, ACS Appl Mater Interfaces 2014, 6, 14477; [DOI] [PMC free article] [PubMed] [Google Scholar]; f) Chen Z, Yan C, Yan S, Liu Q, Hou M, Xu Y, Guo R, Theranostics 2018, 8, 1146. [DOI] [PMC free article] [PubMed] [Google Scholar]
- [12].a) Piejko M, Walczak P, Li X, Bulte JWM, Janowski M, Mol Imaging Biol 2019, DOI: 10.1007/s11307-019-01341-6; [DOI] [PMC free article] [PubMed] [Google Scholar]; b) Yang X, Sun Y, Kootala S, Hilborn J, Heerschap A, Ossipov D, Carbohydr Polym 2014, 110, 95. [DOI] [PubMed] [Google Scholar]
- [13].Liang Y, Bar-Shir A, Song X, Gilad AA, Walczak P, Bulte JW, Biomaterials 2015, 42, 144. [DOI] [PMC free article] [PubMed] [Google Scholar]
- [14].Ruoslahti E, Glycobiology 1996, 6, 489. [DOI] [PubMed] [Google Scholar]
- [15].Reilly GC, Engler AJ, Journal of Biomechanics 2010, 43, 55. [DOI] [PubMed] [Google Scholar]
- [16].Hollister SJ, Nature Materials 2005, 4, 518. [DOI] [PubMed] [Google Scholar]
- [17].Schmidt JJ, Rowley J, Kong HJ, Journal of Biomedical Materials Research Part A 2008, 87A, 1113. [DOI] [PubMed] [Google Scholar]
- [18].Kharkar PM, Kiick KL, Kloxin AM, Chemical Society Reviews 2013, 42, 7335. [DOI] [PMC free article] [PubMed] [Google Scholar]
- [19].Engler AJ, Sen S, Sweeney HL, Discher DE, Cell 2006, 126, 677. [DOI] [PubMed] [Google Scholar]
- [20].Jablonska A, Shea DJ, Cao S, Bulte JWM, Janowski M, Konstantopoulos K, Walczak P, Journal of Cerebral Blood Flow & Metabolism 2017, 38, 835. [DOI] [PMC free article] [PubMed] [Google Scholar]
- [21].a) Lepore AC, O’Donnell J, Kim AS, Williams T, Tuteja A, Rao MS, Kelley LL, Campanelli JT, Maragakis NJ, PLOS ONE 2011, 6, e25968; [DOI] [PMC free article] [PubMed] [Google Scholar]; b) Papadeas ST, Kraig SE, Banion C, Lepore AC, Maragakis NJ, Proceedings of the National Academy of Sciences 2011, 108, 17803; [DOI] [PMC free article] [PubMed] [Google Scholar]; c) Richard JP, Hussain U, Gross S, Taga A, Kouser M, Almad A, Campanelli JT, Bulte JWM, Maragakis NJ, Stem Cells Transl Med 2019, 8, 355. [DOI] [PMC free article] [PubMed] [Google Scholar]
- [22].Lyczek A, Arnold A, Zhang J, Campanelli JT, Janowski M, Bulte JW, Walczak P, Exp Neurol 2017, 291, 74. [DOI] [PMC free article] [PubMed] [Google Scholar]
- [23].Banerjee A, Arha M, Choudhary S, Ashton RS, Bhatia SR, Schaffer DV, Kane RS, Biomaterials 2009, 30, 4695. [DOI] [PMC free article] [PubMed] [Google Scholar]
- [24].McMahon MT, Gilad AA, Zhou J, Sun PZ, Bulte JW, van Zijl PC, Magn Reson Med 2006, 55, 836. [DOI] [PMC free article] [PubMed] [Google Scholar]
- [25].Phillips AW, Falahati S, DeSilva R, Shats I, Marx J, Arauz E, Kerr DA, Rothstein JD, Johnston MV, Fatemi A, JoVE 2012, DOI: doi: 10.3791/3462e3462. [DOI] [PMC free article] [PubMed] [Google Scholar]
Associated Data
This section collects any data citations, data availability statements, or supplementary materials included in this article.


