

Abstract
Exosomes are attractive nucleic-acid carriers because of their favourable pharmacokinetic and immunological properties and of their ability to penetrate physiological barriers that are impermissible to synthetic drug-delivery vehicles. However, inserting exogenous nucleic acids, especially large messenger RNAs (mRNAs), into cell-secreted exosomes leads to low yields. Here, we report a cellular-nanoporation method for the production of large quantities of exosomes containing therapeutic mRNAs and targeting peptides. We transfected various source cells with plasmid DNAs, and stimulated the cells with a focal and transient electrical stimulus that promotes the release of exosomes carrying transcribed mRNAs and targeting peptides. Compared to bulk electroporation and to other exosome-production strategies, cellular nanoporation produced up to 50-fold more exosomes and more than a 103-fold increase in exosomal mRNA transcripts, even from cells with low basal levels of exosome secretion. In orthotopic PTEN-deficient glioma mouse models, mRNA-containing exosomes restored tumour-suppressor function, enhanced tumour-growth inhibition, and increased animal survival. Cellular nanoporation may enable the use of exosomes as a universal nucleic-acid carrier for applications requiring transcriptional manipulation.
Nucleic-acid therapeutics hold great potential for treating multiple human diseases. However, a major limitation for nucleic-acid-based therapies is the inefficient delivery of relatively large and negatively charged molecules into cells and tissues of interests. A variety of techniques have been developed over the years for in vivo gene delivery, including viral vectors1, 2 and synthetic nanocarriers (e.g. liposomal and polymeric nanoparticles).3 However, these strategies suffer from potential concerns related to toxicity and immunogenicity, manufacturing issues such as quality control and high cost, and the inability to deliver the cargo across specialized physiological barriers such as the blood-brain barrier (BBB).4–7 Recently, cell-secreted extracellular vesicles (EVs), such as exosomes, have emerged as promising carriers for nucleic acid-based therapeutics.8–10 These secreted extracellular vesicles are biocompatible, measure 40~150 nm in diameter, and intrinsically express transmembrane and membrane-anchored proteins. The presence of these proteins prolongs blood circulation, promotes tissue-directed delivery and facilitates cellular uptake of encapsulated exosomal contents.9, 11 Despite their many advantages, the application of exosomes in gene delivery has been limited because producing sufficient quantities for in vivo use is technically challenging for several reasons.8–10, 12, 13 First, only a limited number of cell sources have been found to secrete sufficient amount of exosomes required for clinical translation.8–10 Second, to generate clinical doses of exosomes, large numbers of cell cultures must be incubated for days, followed by purification and loading of nucleic acids before the final gene-containing exosomes can be obtained. Although post-insertion of small interference RNA (siRNA) and shRNA plasmids into exosomes by conventional bulk electroporation (BEP) has demonstrated greater therapeutic efficacy than synthetic nanocarriers in suppressing oncogenic targets in preclinical pancreatic cancer models,9 inserting large nucleic acids into nano-sized exosomes remains technically challenging and maybe limited to exosomes from specific cell types.14 Although strategies to biologically modify cell sources to promote the encapsulation of RNA in exosomes have been proposed,15,16 inducing the release of a large quantity of exosomes loaded with desired nucleotide transcripts from multiple nucleated cell sources without genetic modification has not been accomplished. Here, we investigate a non-genetic strategy to efficiently incorporate a high abundance of messenger RNAs (mRNAs) into exosomes for targeted transcriptional manipulation and therapy.
Results
Quantification of cellular nanoporation (CNP) generated EVs.
We developed a CNP biochip to stimulate cells to produce and release exosomes containing nucleotide sequences of interest including mRNA, microRNA and shRNA. The system allows a monolayer of source cells such as mouse embryonic fibroblasts (MEFs) and dendritic cells (DCs) to be cultured over the chip surface, which contains an array of nanochannels (Fig. 1a). The nanochannels (~500 nm in diameter) enable the passage of transient electrical pulses to shuttle DNA plasmids from the buffer into the attached cells (Fig. 1a).17, 18 Adding 6-kbp Achaete-Scute Complex Like-1 (Ascl1), 7-kbp Pou Domain Class 3 Transcription factor 2 (Pou3f2 or Brn2) and 9-kbp Myelin Transcription Factor 1 Like (Myt1l) plasmids into the buffer, resulted in a CNP yield with a >50-fold increase in secreted extracellular vesicle (EVs) as compared to bulk electroporation with vesicle size distribution similar to other conventional techniques (Fig. 1b, Fig. S1a–b). In contrast, EV-production methods that rely on global cellular stress responses such as starvation, hypoxia, and heat treatment, resulted in only a moderate EV release (Fig. 1c). CNP-induced EV secretion was highly robust and independent of cell sources or transfection vectors (Fig. 1d, Fig. S1c–d). Kinetic analyses further showed that EV release peaked at 8 hours after CNP-induction, with continued secretion noted over 24 hours (Fig. 1e). The extent of EV secretion was able to be controlled by adjusting the voltage across the nanochannels. We observed an increase in the number of EVs released as voltage was increased from 100 to 150 V, until a plateau was reached at 200 V (Fig. 1f). We also found that ambient temperature is another variable that influenced CNP triggered EV secretion, as cells prepared at 37°C released more EVs than cells prepared at 4°C (Fig. S1e). To assess the internal nucleic acid content of released EVs, we first performed agarose gel analysis of RNAs collected from EVs after source cells underwent CNP with PTEN plasmid. We found that a higher number of intact PTEN mRNAs were contained in the EVs in the CNP/PTEN group as compared with the CNP/PBS group (Fig. 1g), with a 55.5 ± 9.2% of total large RNA comprised of intact PTEN mRNA by weight. Quantitative reverse transcription polymerase chain reaction (qRT-PCR) of the full length PTEN mRNA further confirmed that 40.5± 13.7% of the total RNAs is intact PTEN mRNA, demonstrating that mRNAs or miRNAs complementary to the plasmid DNAs encapsulated within the EVs were 103-fold higher in CNP treated cells than BEP or Lipo groups (Fig. 1h, Fig. S1f–h). Additionally, the complementary mRNAs extracted from CNP generated EVs maintained their ability to encode polypeptides for protein synthesis (Fig. S1i). When multiple plasmid DNAs were used in CNP, the levels of complementary mRNAs were found to gradually increase, with the largest transcript, Myt1l, taking the longest time (16h) to reach the peak concentration (Fig. 1i), likely due to the longer time required for transcribing lengthy nucleic acid sequences.
Fig. 1 |. CNP generates large quantities of extracellular vesicles (EVs) loaded with transcribed mRNAs.
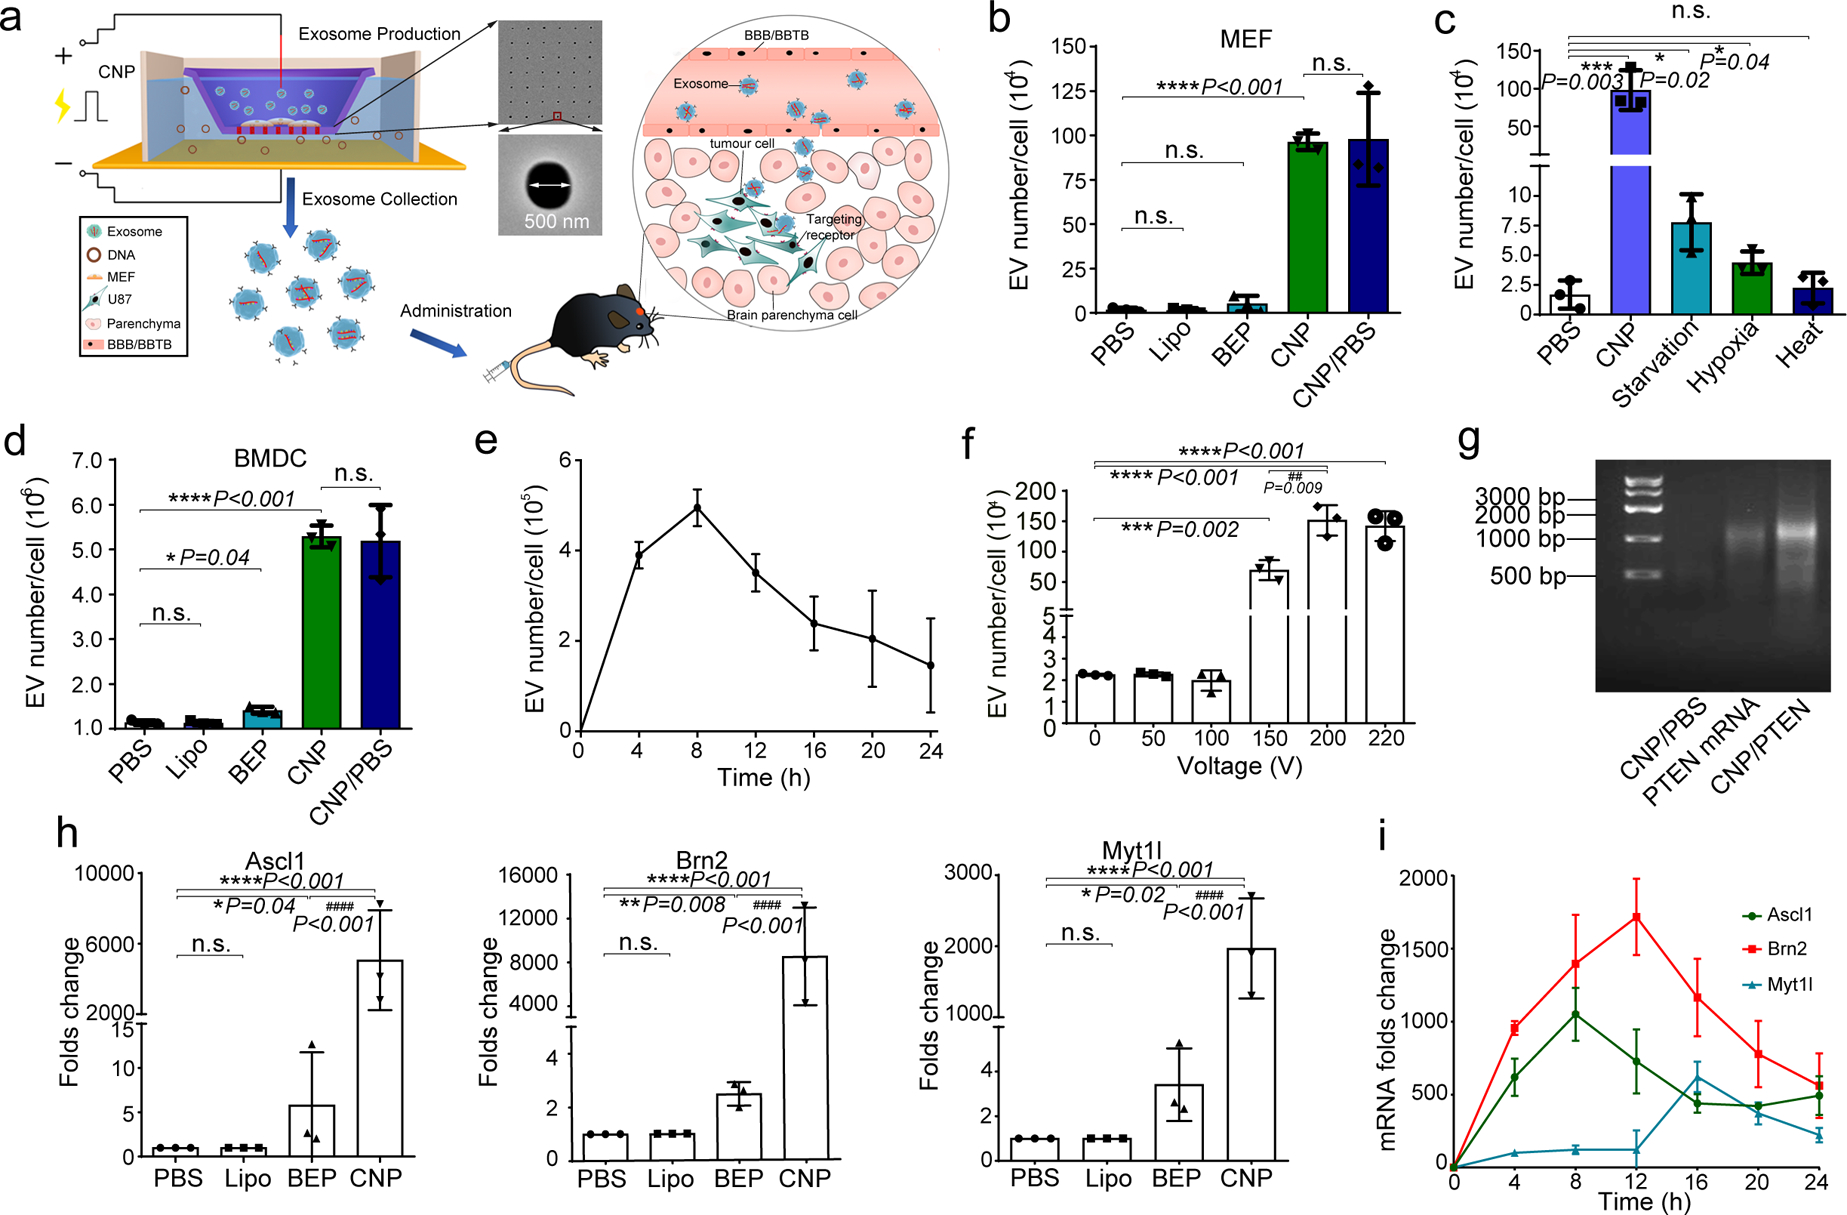
a. Schematic representation of CNP generated EVs for targeted nucleic acid delivery. Left: The CNP system consists of a nanochannel array (red rectangles), with each channel measuring 500 nm in diameter (top inset). DNA plasmids added in buffer enter attached cells through nanochannels under transient electrical pulses. Attached cells subsequently release large quantities of exosomes containing transcribed mRNA that can be collected for tumour-targeted delivery via blood-brain barrier (BBB) and blood-brain tumour barrier (BBTB) (Right). b. EV number per cell produced by un-treated MEFs in PBS buffer (PBS), MEFs after treatment with Ascl1/Brn2/Myt1l (A/B/M) plasmids transfected with lipofectamine 2000 (Lipo), bulk electroporation (BEP), cellular nanoelectroporation (CNP), and CNP with only PBS buffer (CNP/PBS). c. Comparison of EV release by CNP versus traditional methods of stress-induced EV release, including starvation, hypoxia and heat treatment. Starvation: MEF cells were cultured in DEMEM without FBS; Hypoxia: MEF cells were cultured in a hypoxia chamber at 1%O2/5% CO2 at 37°C humidified environment; Heat: MEF cells were cultured at 42°C for 2h and then transferred to 37°C with normal cell culture conditions. d. EV number per cell produced by mouse bone marrow-derived dendritic cells (BMDCs) in different treatment groups, including PBS, Lipo, BEP, CNP, and CNP/PBS groups. e. Exosome release from CNP-transfected MEFs peaks around 8 hours post-CNP. f. DLS measurements of exosome concentration in MEFs by CNP at various voltages ranging from 0 to 220 V. Results show that the exosome number does not increase when the voltage is increased from 200 to 220 V. g. Agarose gel analysis of EV-mRNAs collected from EVs after CNP. CNP/PBS: Total RNAs harvested from 107 MEFs after CNP with only PBS buffer; PTEN mRNA: 200 ng synthesized PTEN mRNA; CNP/PTEN: Total RNAs (~1.0 μg) harvested from 107 MEFs after CNP with PTEN plasmid. h. qPCR of A, B, and M mRNA reveals that exosomes produced by CNP contain much larger quantities of transcribed mRNAs than exosomes produced by other methods. i. qPCR of EV A, B and M mRNA from CNP-transfected MEFs (in culture medium replaced every 4h for 24h) shows that the largest transcript takes the longest amount of time to reach peak concentration. All data are from three independent experiments and are presented as mean ± s.e.m., two-sided Student’s t-test was performed for the comparison (b, c, d, f, h).
Extracellular vesicular mRNA loading.
To better understand the distribution of transcribed mRNA in different EV subgroups, we separated exosomes from microvesicles (MV) by standard multi-step ultracentrifugation (Fig. s1j-k).9, 19 Exosome markers (CD9, CD63, and Tsg101) and MV marker (Arf6) were detected by Western blot in exosomes and MVs, respectively (Fig. 2a).20–22 We found that most (>75%) of the EV RNA from 108 CNP transfected MEFs was within exosomes rather than in MVs (Fig. 2b), and the average weight ratio of large RNA/protein for exosomes was 1 μg/20 μg. This contrasts with non-detectable large RNA from MEFs without CNP treatment for the same number of exosomes. Purification of exosomes by Optiprep™ gradient ultracentrifugation confirmed that most of the RNAs are concentrated in fractions 5–7 which correspond to the exosome fractions (Fig. S1l). However, the recovery efficiency by this method was far lower than multi-step ultracentrifugation (Fig. S1m). CryoTEM revealed that exosomes generated by CNP treated MEFs with plasmid DNA contained many nucleic acids, while those from untreated MEFs appeared empty (Fig. 2c). Similar results were obtained in bone marrow-derived dendritic cells (BMDCs) as an independent cell source (Fig. S1n). Finally, qRT-PCR showed that most of the transcribed mRNAs were encapsulated inside exosomes rather than in MVs (Fig. 2d), and that these mRNAs maintained the ability to encode polypeptides for protein synthesis (Fig. 2e).
Fig. 2 |. Exosomes, rather than microvesicles (MVs), contain functionally transcribed mRNAs after CNP transfection.
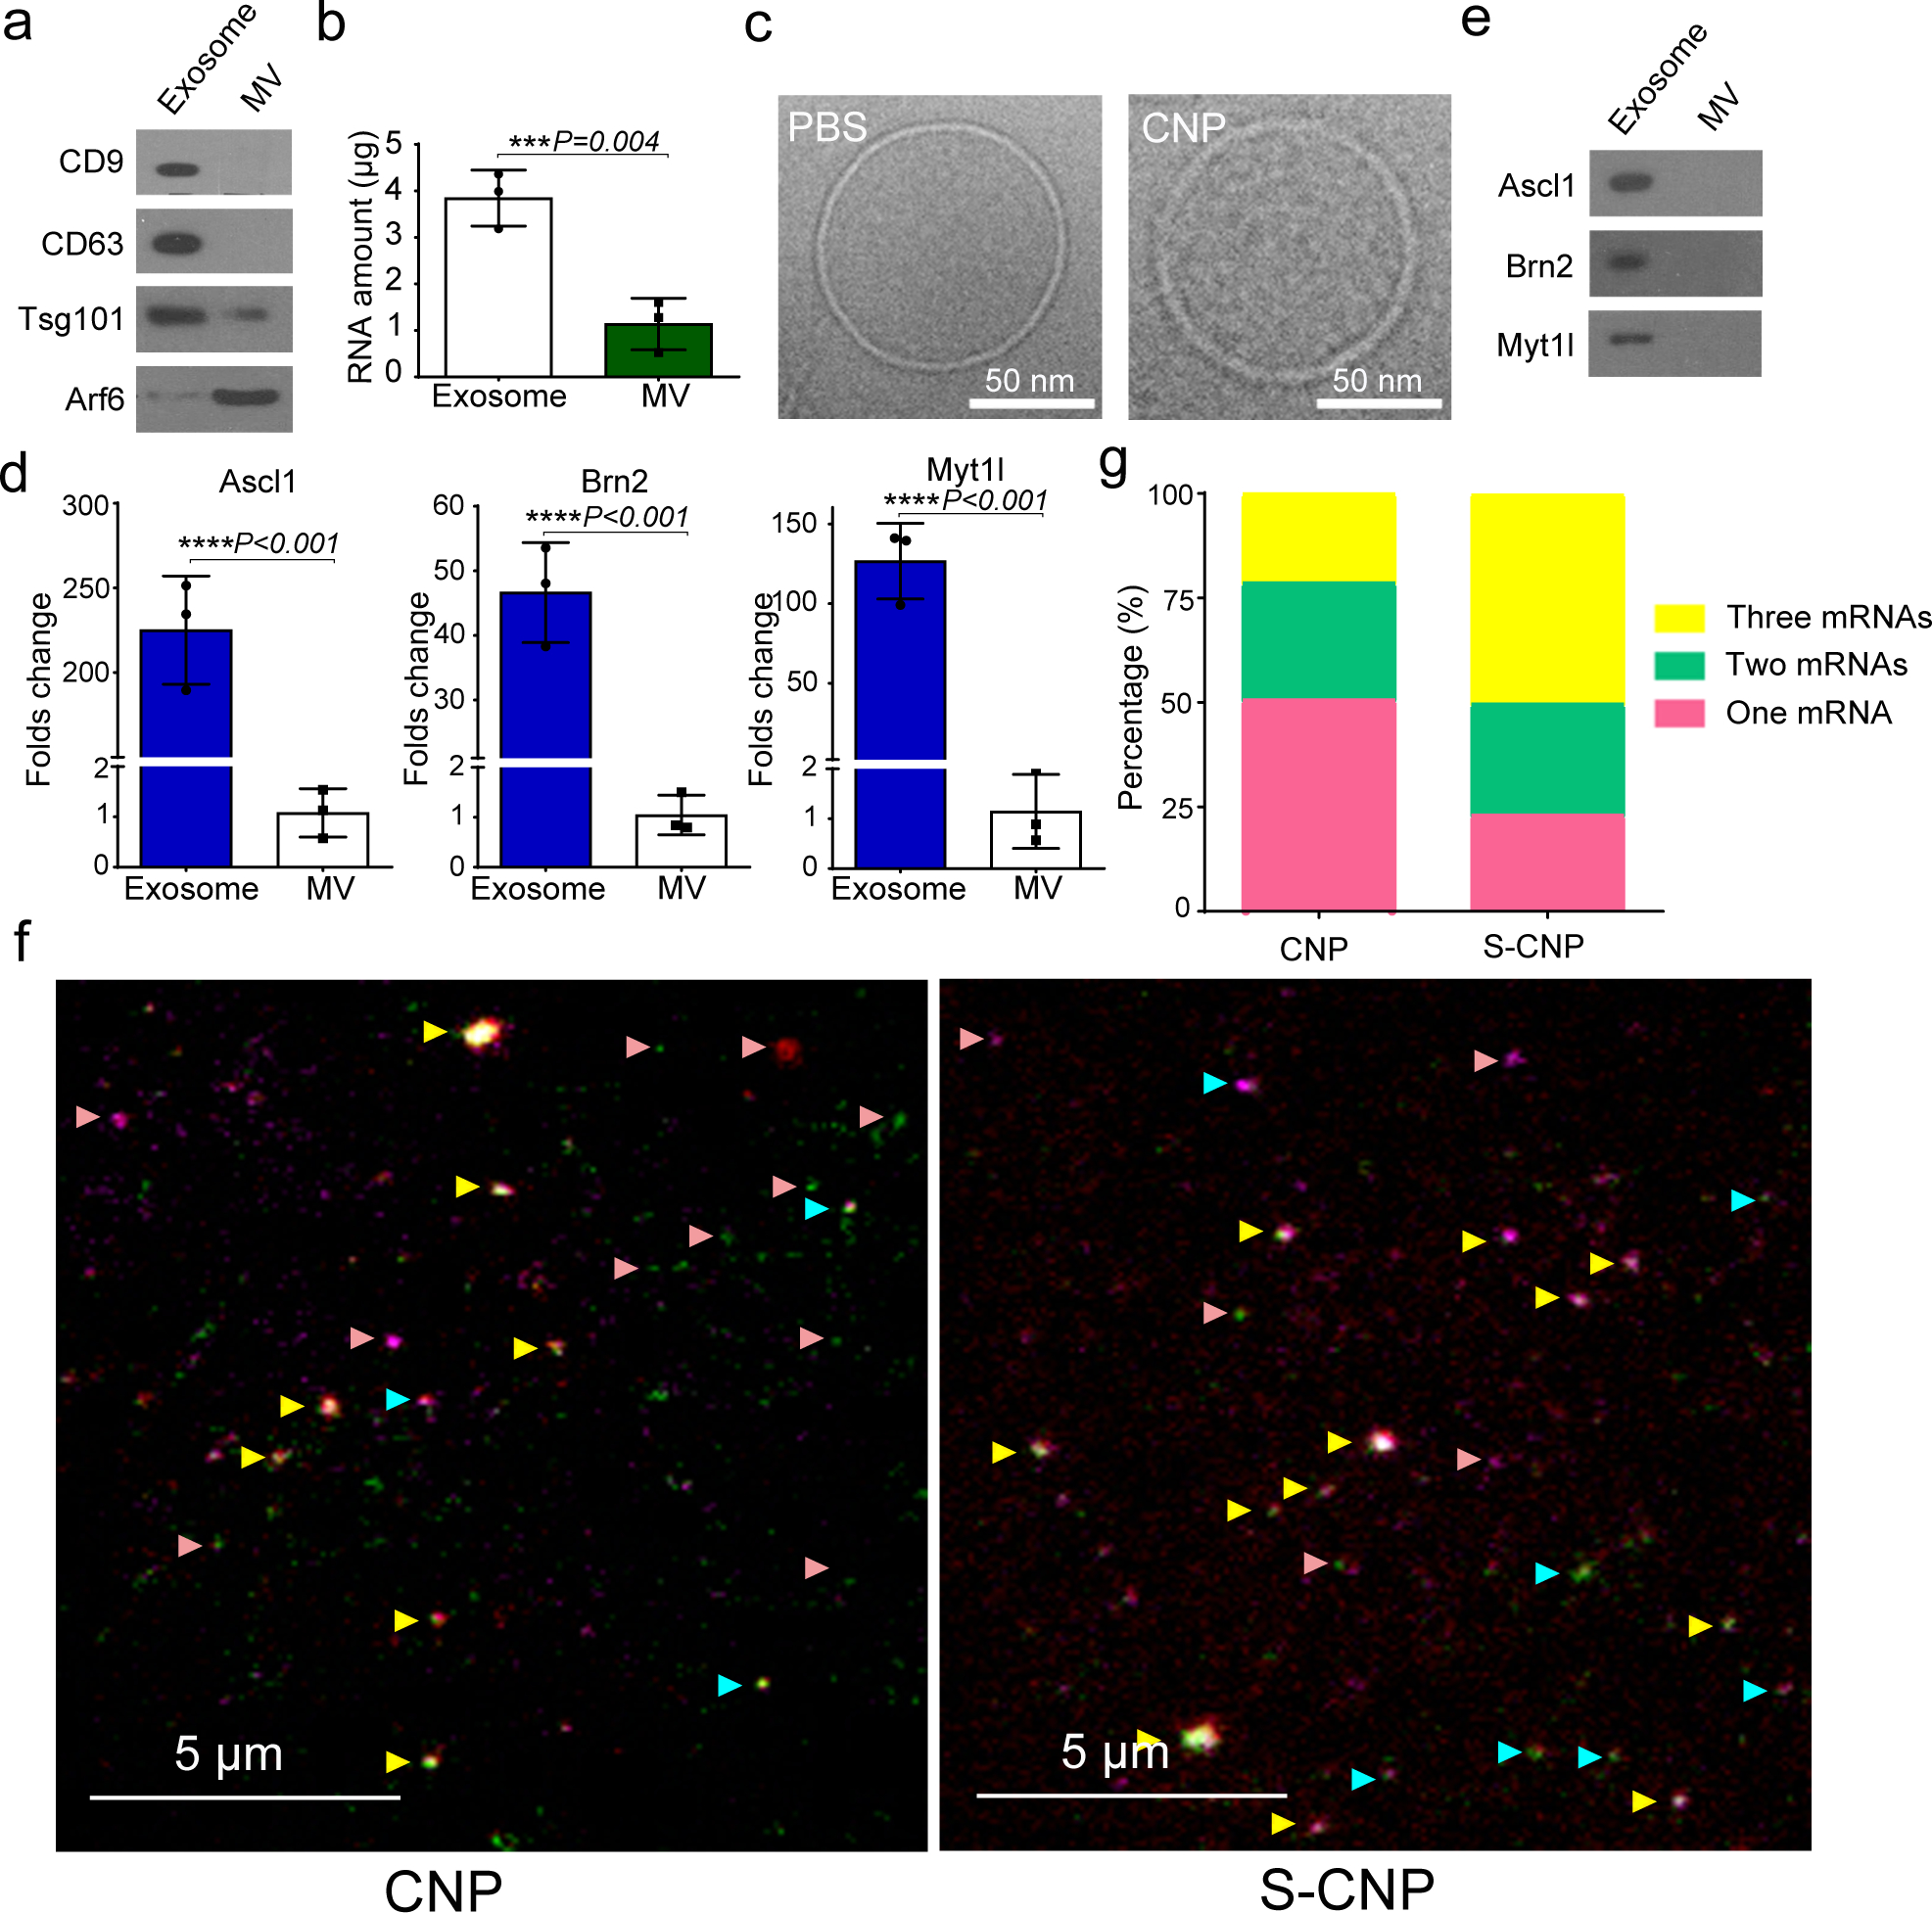
a. Detection of exosome markers (CD9, CD63, and Tsg101) and MV marker (Arf6) in the same amount (20 μg protein) of exosomes and MVs by Western blot. b. RNA amount encapsulated in exosomes vs. encapsulated in MVs produced by 108 CNP-transfected MEFs as measured by Nanodrop, indicating that most RNA is contained in exosomes, not MVs. c. Cryo-TEM images of exosomes from PBS group (PBS) and CNP group (CNP) show no differences in the appearance of exosomes obtained from these two groups, but exosomes from the CNP group contain higher RNA content. d. qPCR of A, B and M mRNA from exosomes and MVs shows that most of the transcribed mRNAs are contained in exosomes. e. In vitro protein translation from mRNAs extracted from exosomes and MVs secreted by CNP-transfected MEFs. f. Representative TIRF images of TLN assay in CNP and S-CNP groups show that S-CNP can optimize the loading of different mRNAs into individual exosomes. Green dot: Ascl1 mRNA, red dots: Brn2 mRNA, purple dots: Myt1l mRNA, pink arrow: exosomes with 1 mRNA, turquoise arrow: exosomes with 2 mRNAs, yellow arrow: exosomes with 3 mRNAs. g. Percentage of exosomes with different RNAs in CNP and S-CNP groups. One hundred images in each group were chosen for statistical analysis. All the other data are from three independent experiments and are presented as mean ± s.e.m., two-sided Student’s t-test was performed for the comparison (b, d).
To further quantify the potential variability of mRNA loading within individual exosomes, we utilized a tethered lipoplex nanoparticle (TLN) assay (Fig. S2a) in which cationic lipoplex nanoparticles containing a specific molecular beacon (MB) were tethered to a glass coverslip, and negatively charged exosomes were captured individually by nanoparticles using electrostatic interactions.23, 24 The hybridization of mRNA inside the exosome with the MB inside the nanoparticles produced a fluorescent signal, which was captured by total internal refraction fluorescence (TIRF) microscopy to quantify the mRNA content. We found that, after CNP transfection with 3 distinct DNA plasmids (A, B and M), approximately 50% of the captured exosomes contained only one transcript, 25% contained two mRNAs, and 25% included all three mRNA sequences (Fig. 2f–g). We increased this multiplexed loading by using a sequential CNP (S-CNP) technique (Fig. 2f–g), through which different plasmids were delivered separately according to their peak-time (Fig. 1i). We found that S-CNP greatly increased multiple mRNA loadings into individual exosomes by more than 50%.
Comparison of CNP and BEP for therapeutic exosomes.
The primary difference between CNP and existing BEP techniques is that CNP encapsulates endogenously transcribed RNAs into exosomes, whereas BEP delivers exogenous nucleotides into pre-isolated exosomes. To compare the efficiency of the two approaches, we first delivered miR-128 and CD63-GFP plasmids into MEFs using CNP to generate GFP-labeled exosomes containing miR-128, and we mixed free miR-128 with pre-isolated empty exosomes for BEP insertion. We used microRNA as nucleic acid cargo because BEP can effectively insert small nucleic acid sequences into exosomes. To compare the amount of miR-128 within exosomes prepared by CNP and BEP, we designed a tethered lipoplex nanoparticle (TLN) biochip containing Cy5-miR128 molecular beacons to capture negatively charged exosomes, enabling the fusion of the two vesicles. The subsequent hybridization of miR-128 molecules and Cy5-miR128 molecular beacons results in the emission of red fluorescence that can be captured by TIRF microscopy (Fig. S2b). Although both CNP and BEP produced ~80% exosomes containing miR-128, the concentration of miR-128 within CNP exosomes was much higher than BEP (Fig. S2c-e). Moreover, unlike BEP, CNP was able to efficiently produce exosomes containing large mRNAs (Fig. S3a–c), as CNP-secreted exosomes contained >100 times more Brn2 mRNA than exosomes generated from BEP insertion (Fig. S3d).
Mechanisms of CNP-induced exosome secretion.
To investigate the cellular mechanisms underlying CNP-triggered exosome release, we first examined structural changes within the cell following CNP exposure. We found that CNP significantly increased the formation of multivesicular bodies (MVBs) within MEFs (Fig. 3a). When CD63-GFP plasmid was delivered to MEFs by CNP, a large number of GFP-positive MVBs formed within 4 hours after induction (Fig. 3b and Data Video 1a–c). Transmission electron microscopy (TEM) further revealed a ~2-fold increase in MVBs and an ~8-fold increase in interluminal vesicles (ILVs) in MEFs after CNP treatment (Fig. 3c–e). We also noted a corresponding increase in the expression of proteins involved in exosome biogenesis (Fig. 3f). Because CNP relies on delivering focal electric fields across the source cell’s plasma membrane, damages at the point of contact are likely to occur. We found that a large number of pores in the plasma membrane facing the basal surface were formed initially, followed by a gradual increase (slower than cells subjected to BEP) in fluorescence across the apical surface of the cell, suggesting that CNP causes small pores to form beyond the point of contact with the nanochannels (Fig. 4a, Data Video 2a–c). Interestingly, the cell membrane nanopores closed within 2 minutes post electroporation, likely indicating a recovery process repaired the membrane damages (Fig. 4b–c). Because a higher intracellular calcium ion level has been reported to promote exosome release25, 26, we next investigated whether the influx of calcium ions through these nanopores after CNP resulted in higher levels of exosome secretion. Indeed, we found increased exosome release after CNP when we increased Ca2+ in the extracellular space, with a corresponding increase in intracellular Ca2+ (Fig. 4d–f). Adding a calcium chelator, EGTA, largely blocked the calcium ion increase inside the cells and inhibited exosome release caused by CNP (Fig. 4g–h), suggesting that the intracellular increase of Ca2+ is likely an initiating factor for inducing exosome secretion by CNP (Fig. 4i).
Fig. 3 |. CNP induced multivesicular bodies (MVBs) formation.
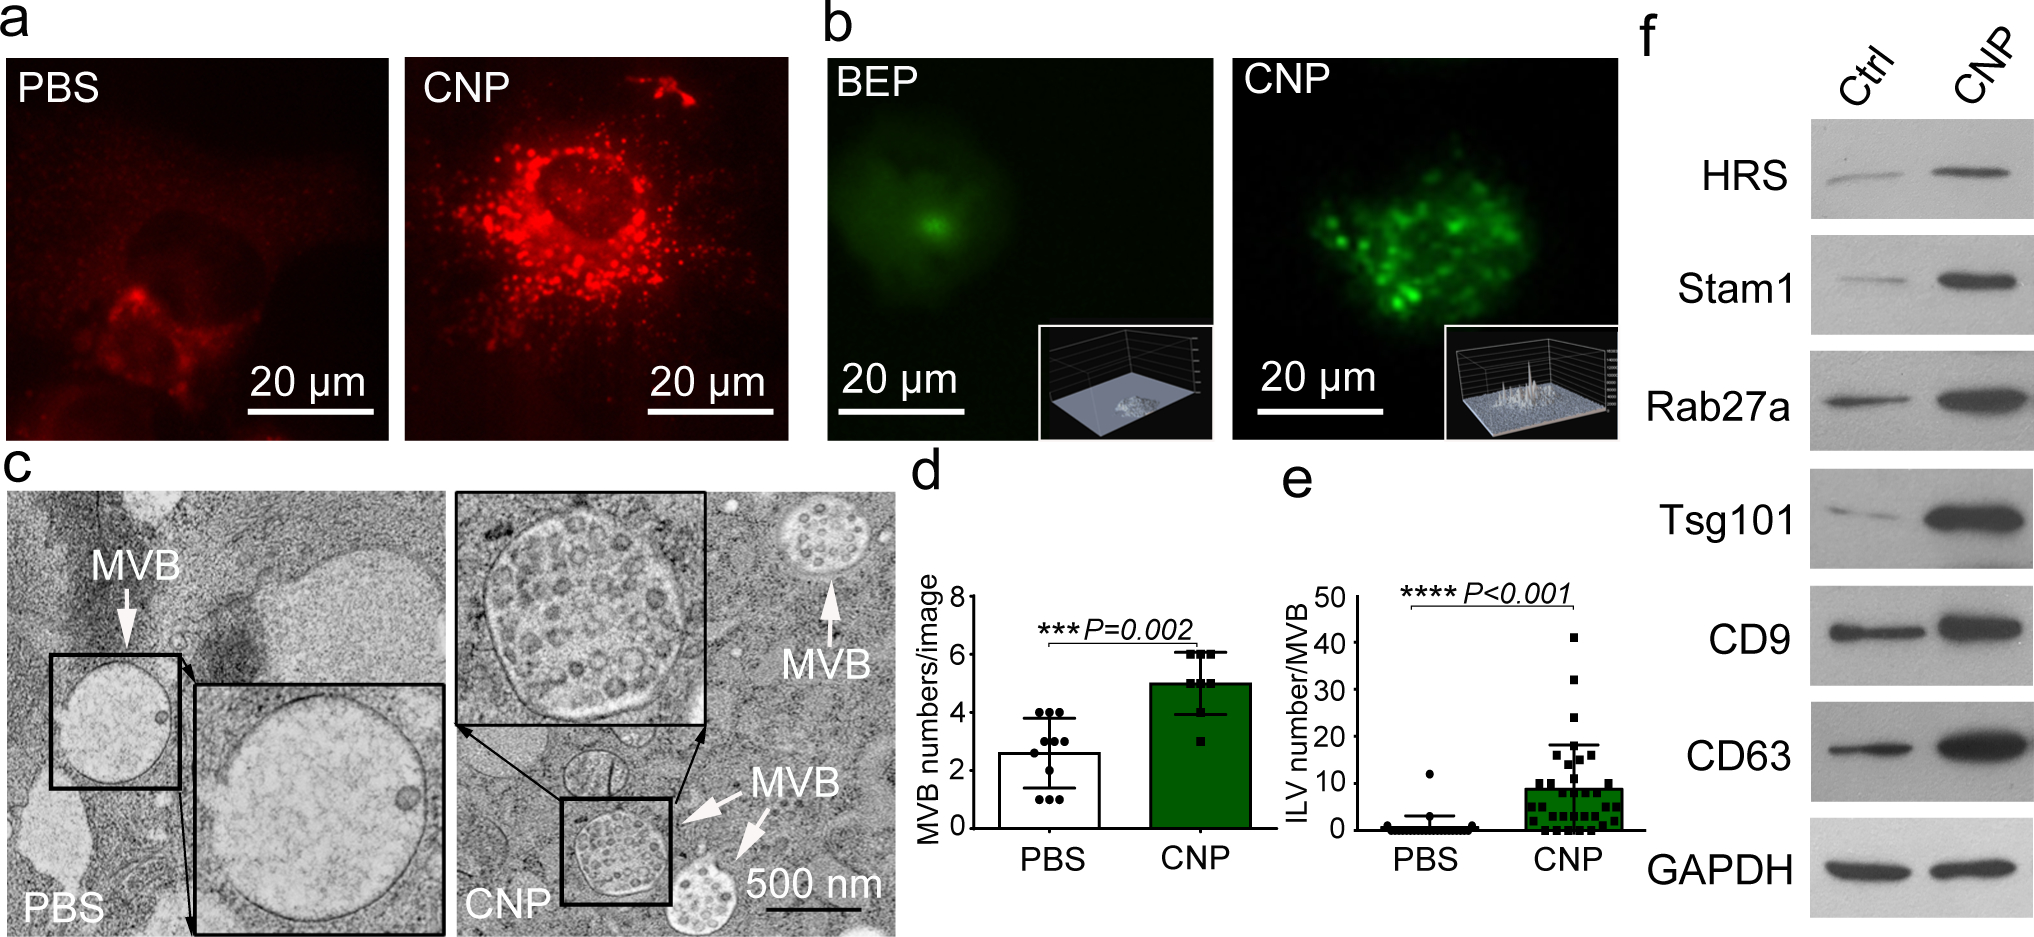
a. Epi-fluorescence images show increased intracellular vesicle formation in MEFs with CNP/PBS stimulation as measured by red fluorescence spots from PKH26 dye. b. CNP/PBS-porated MEFs (CNP) increased the number of multivesicular bodies (MVBs) containing CD63-GFP as compared to BEP. Insets: 3D intensity profiles in which peaks represent bright spots in images indicating active MVB formation. c. Transmission electron microscopy (TEM) images of MEFs with or without CNP/PBS stimulation contain different quantities of MVBs and interluminal vesicles (ILVs). Quantification of MVBs (d) and ILVs (e) in MEFs with or without CNP/PBS stimulation. n=20 TEM images for each group, and two-sided Student’s t-test was performed for the comparison. f. Western blot shows that proteins implicated in exosome biogenesis are increased after CNP.
Fig. 4 |. CNP-induced exosome secretion is associated with Ca2+ ion influx after CNP.
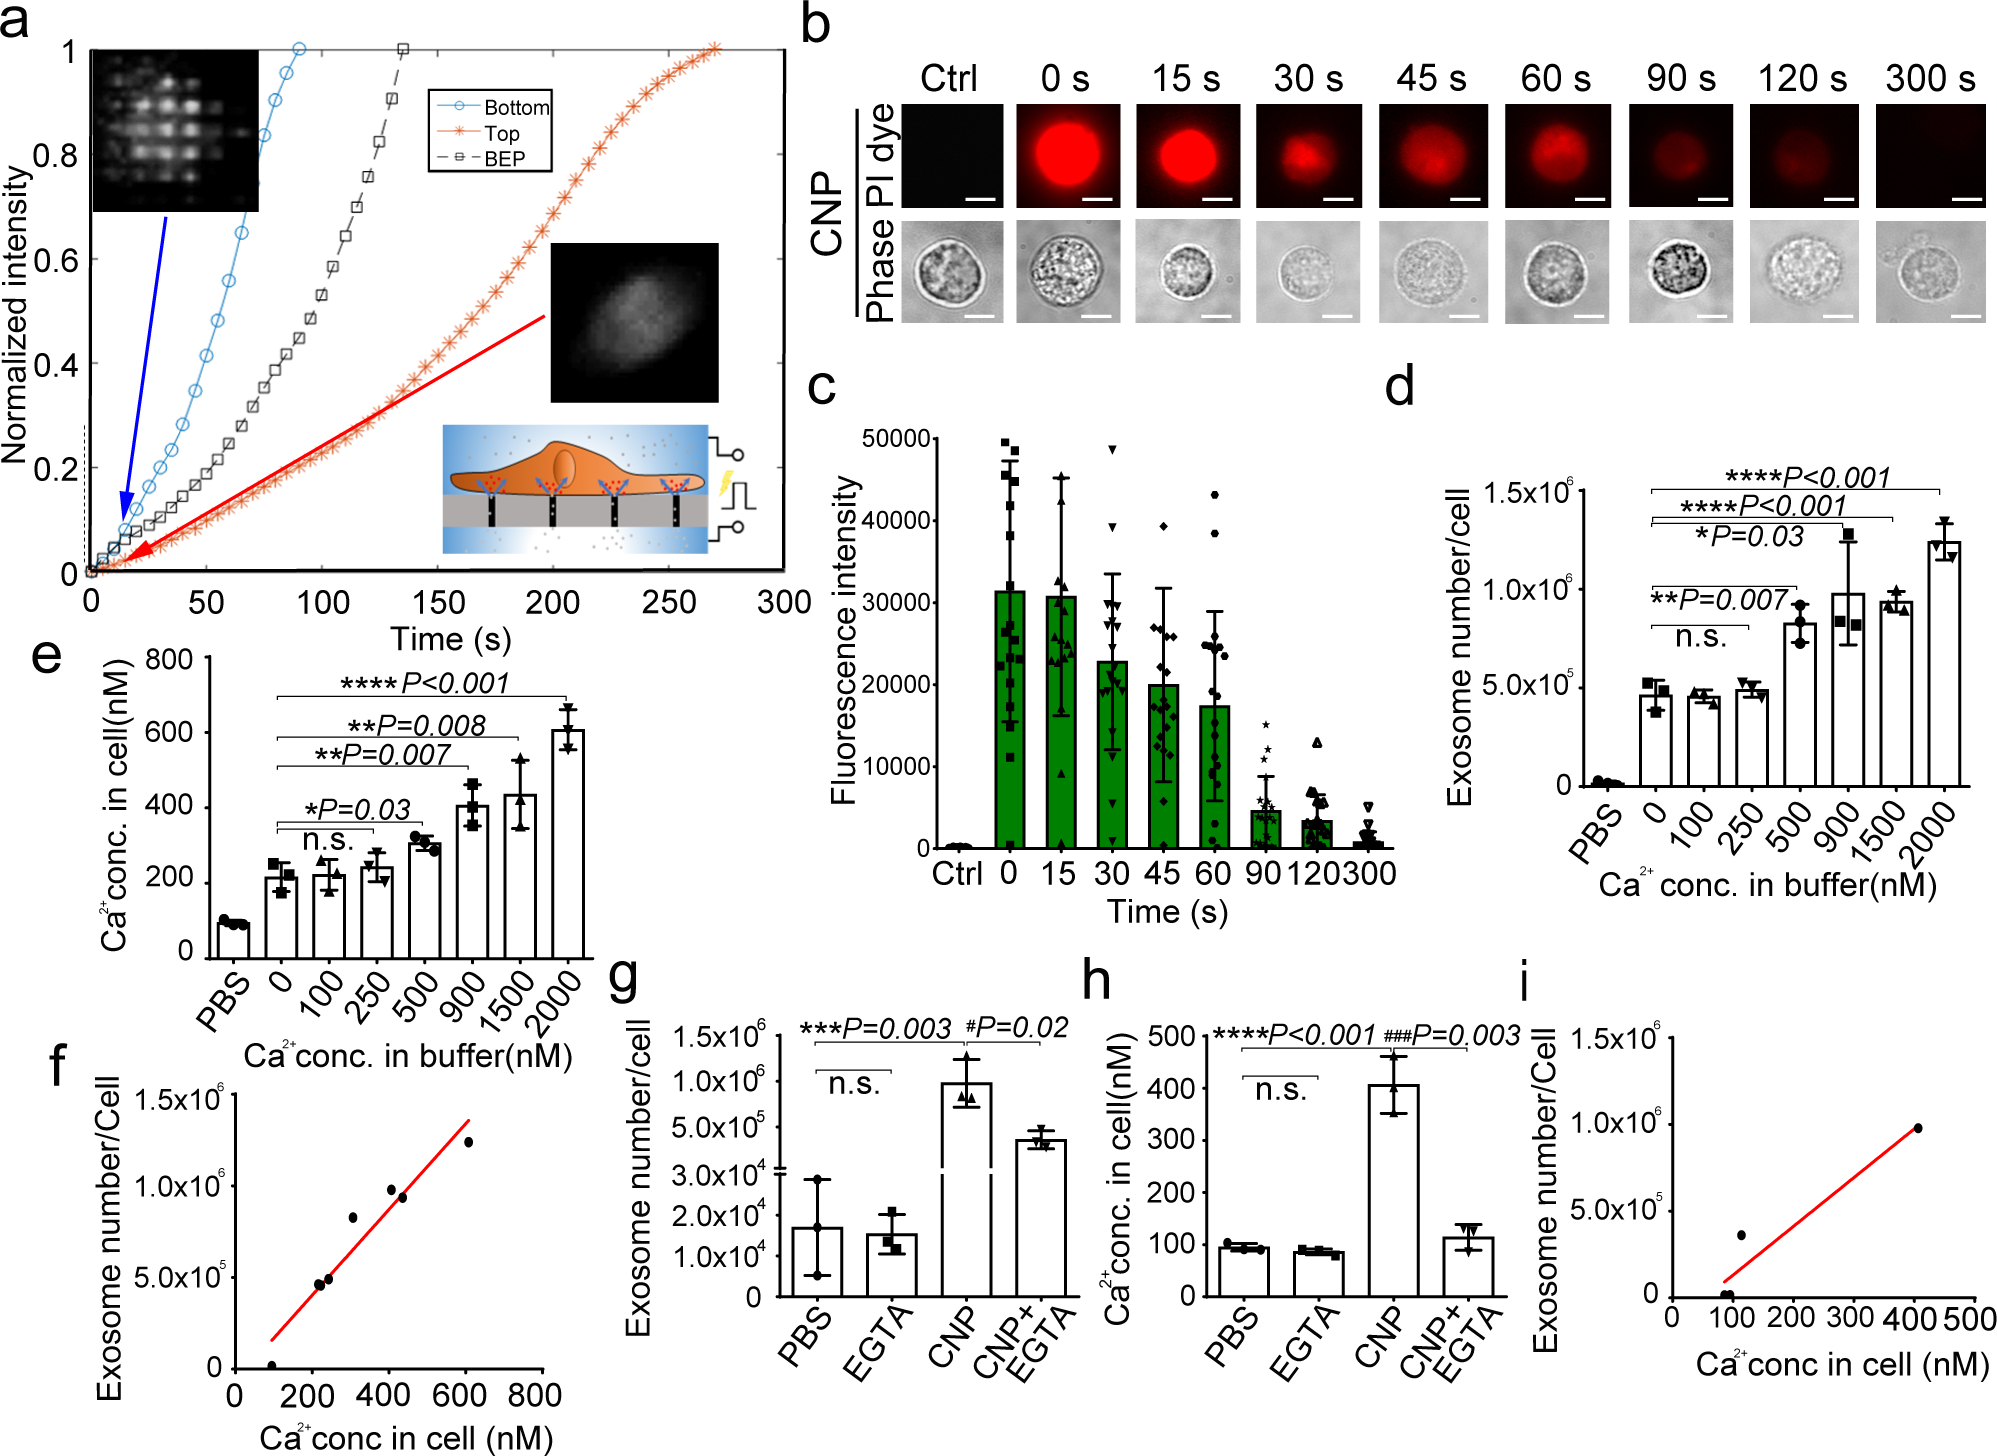
a. Longitudinal fluorescence intensity measurement of propidium iodide (PI) diffusion across membrane pores in BEP- and CNP-porated MEFs with PBS buffer. Rapid increase in PI intensity at the attached surface of the cell (top insert) indicates formation of an array of large pores, whereas a much slower PI increase at the contralateral cell surface (bottom insert) indicates formation of smaller pores. BEP-porated MEFs show an intermediate increase in PI intensity. b. Fluorescence images of cells after CNP indicate that membrane pores formed during CNP close between 1 to 2 minutes after transfection. PI is applied to the cells at indicated time points after CNP. c. Fluorescence intensity measurement of cells further confirms membrane pores close within 2 minutes following CNP. n=20 cells for each group. d. Exosome number per cell produced by MEFs at various calcium ion concentrations after CNP. e. Intracellular calcium ion concentration after CNP at various calcium ion concentrations in buffer. f. Correlation of exosome release with intracellular calcium ion concentration after CNP. g. Exosome number per cell produced by MEF at various calcium ion concentrations after CNP with the presence of calcium chelator, EGTA. h. Calcium ion concentration inside the cells after CNP at various calcium ion concentrations in buffer with the presence of EGTA. i. Correlation of exosome release with intracellular calcium ion concentration after CNP with the presence of EGTA. All the other data are from three independent experiments and are presented as mean ± s.e.m., two-sided Student’s t-test was performed for the comparison (d, e, g, h).
We next assessed whether stress responses within source cells contributes to increased exosome formation after CNP treatment. Thermal shock, through the increased production of heat-shock proteins (HSPs), has been shown to stimulate exosome biogenesis. Numerical simulation showed that transient (<1s) increases in temperature approaching 60°C around the nanochannel exit can occur during CNP transfection (Fig. 5a, Fig S4a–b). This temperature rise is focally oriented in the cell surface around the nanochannel exit (Fig 5b–d, Data Video 3). As expected, CNP substantially increased the expression of HSPs in cells, and adding HSP inhibitors significantly suppressed exosome secretion (Fig. 5e–f), suggesting that heat-shock response is critical for CNP-mediated exosome production. Since HSPs can regulate P53 activity,27 which in turn regulates exosome production through TSAP6,27–30 we next evaluated whether elevating HSPs via CNP promotes exosome production through the P53-TSAP6 signaling pathway. Accordingly, we found that P53 and TSAP6 expression levels were upregulated following CNP (Fig. 5g), and TSAP6 expression was not changed in a P53 stable-knockdown MEF cell line (MEF P53−/−) (Fig. 5g). Furthermore, we did not notice increased exosome release in P53−/− MEF cells after CNP (Fig. 5h). It is worth noting that, despite the upregulation of P53, CNP did not result in significant cell death (Fig. S4c) and did not induce source cells to undergo apoptosis (Fig. S4d-e). These results suggest that heat-shock responses in the setting of CNP-induced focal thermal stress promote the activation of P53-TSAP6 signaling, leading to increased exosome production as a part of the cellular recovery process (Fig. 5i).
Fig. 5 |. CNP increases exosome release through HSP-P53-TASP6 signaling pathway.
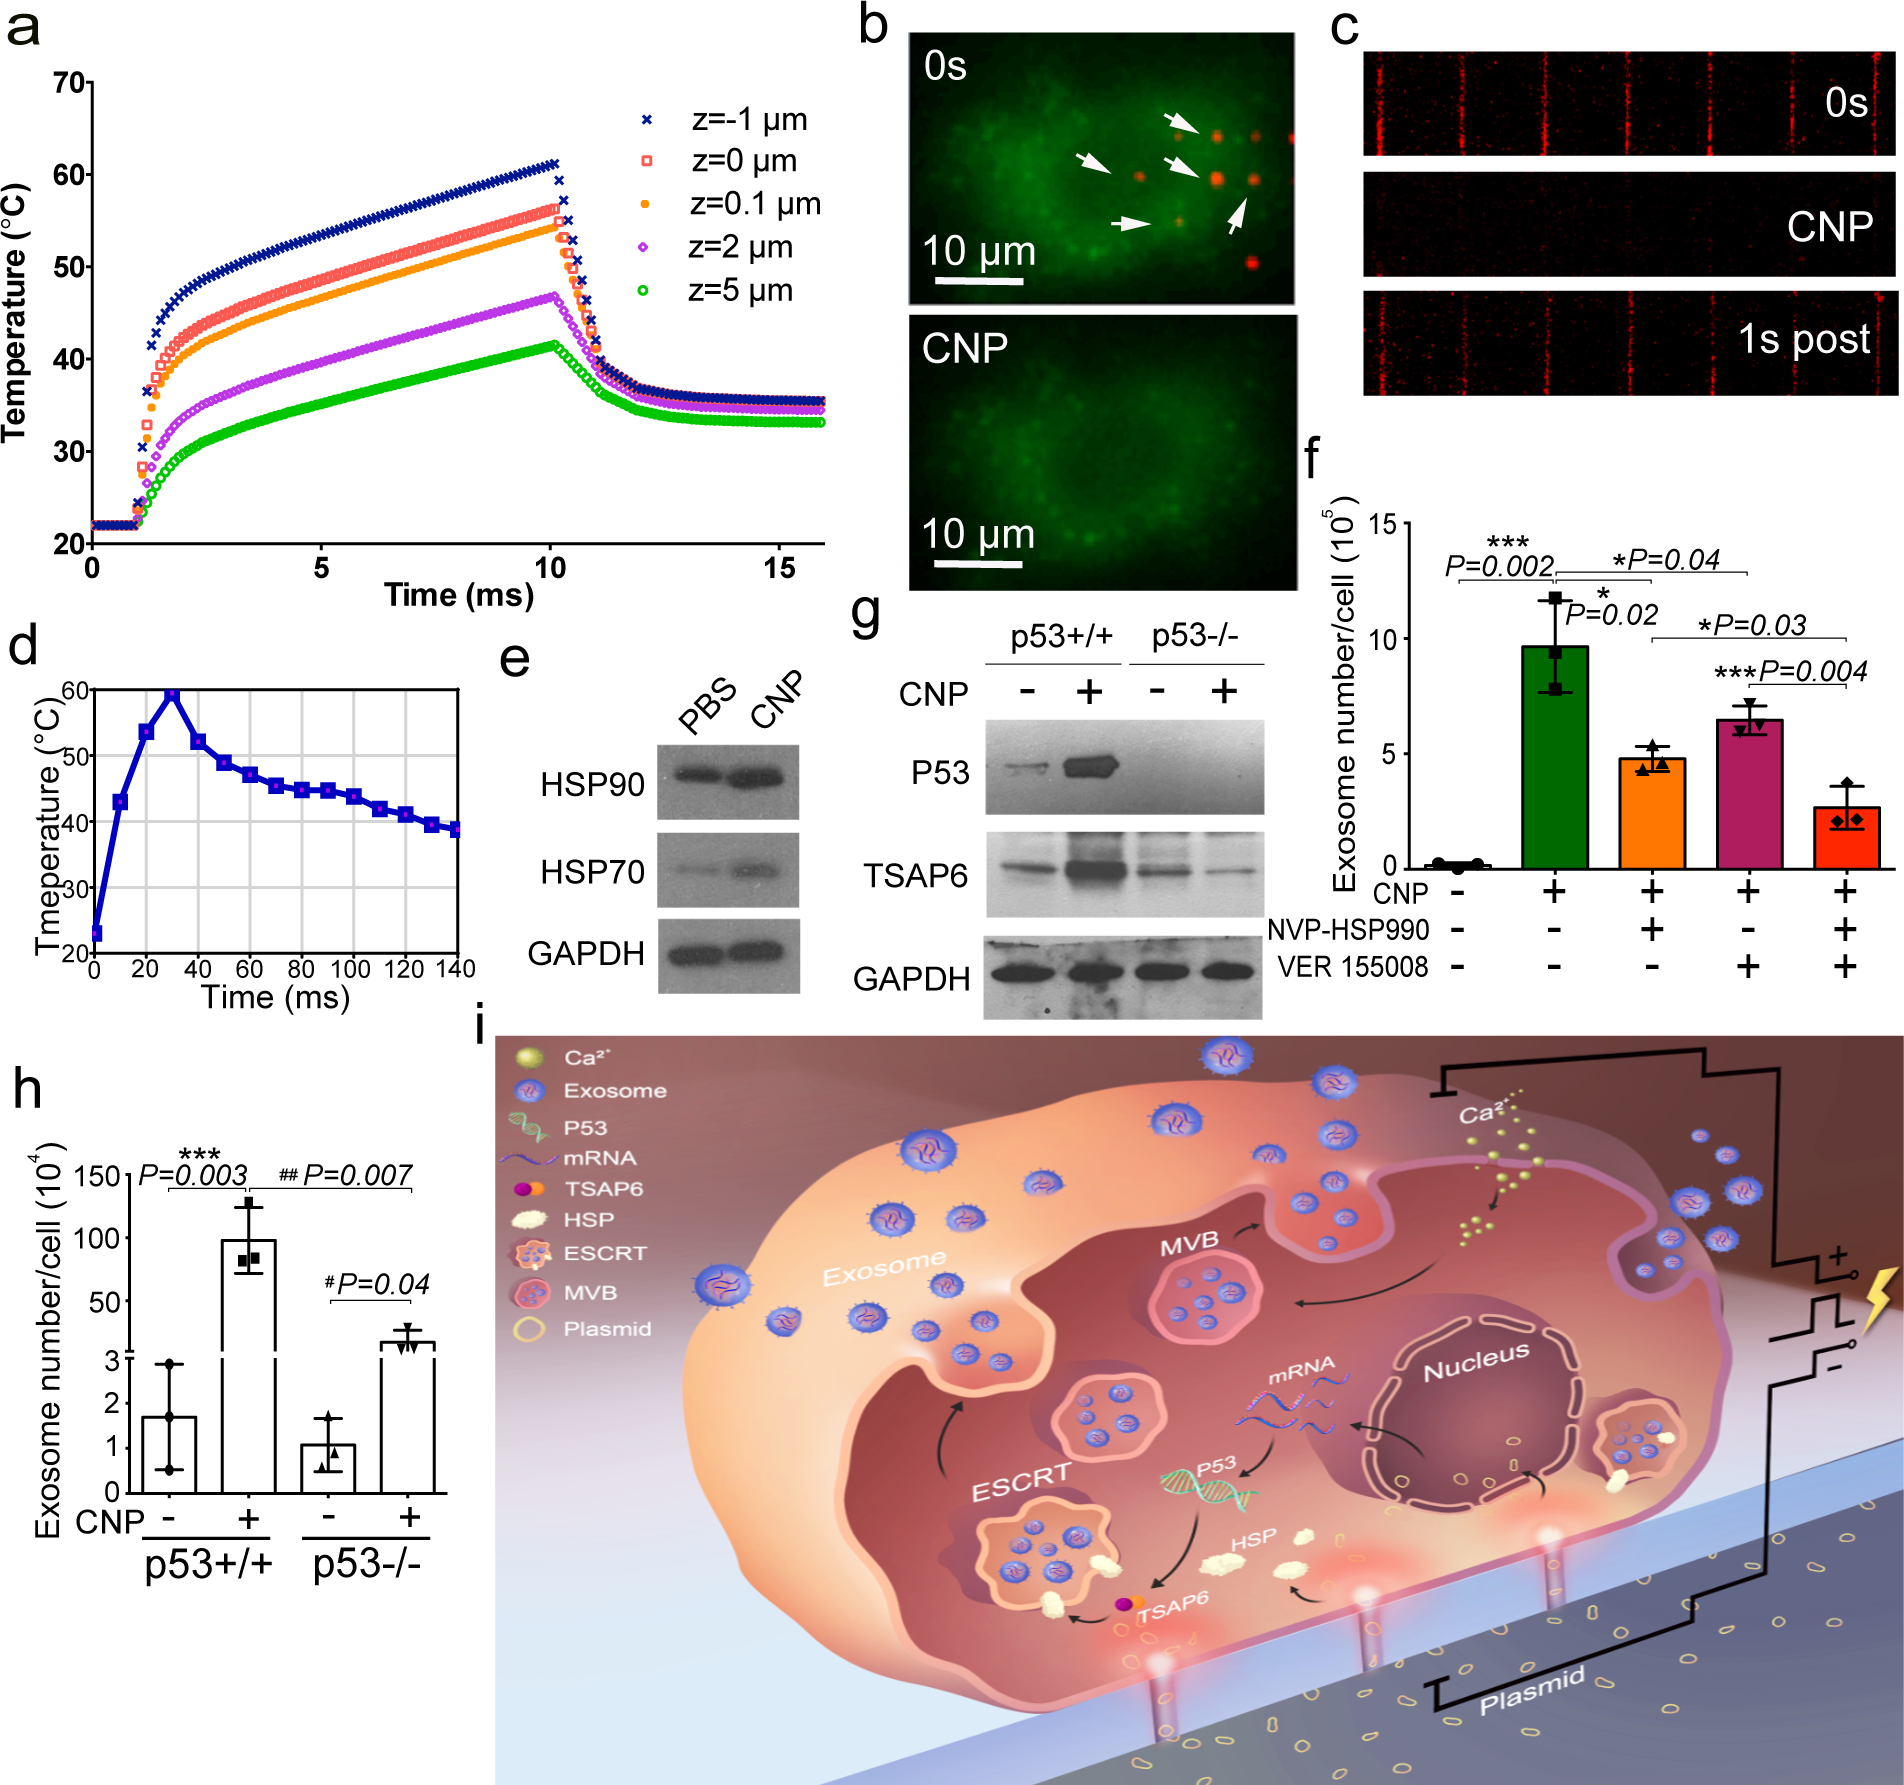
a. Simulated temperature changes at 5 chosen locations. A 200 V and 10 ms pulse created a localized “hot spot” in the nanochannel outlet with a power density of ~1 × 10¹⁴ W/m3 and a peak temperature up to 60°C from ambient temperature. Once the pulse ended, the ”hot spot” vanished rapidly due to the extremely small volume of the heated fluid inside the nanochannel (Vnanochannel ≈ 1 × 10⁻¹² cm3) compared to the bulk solution outside the nanochannel (Vbulk ≈ 0.1 cm3). b. Top-down images of MEFs (green) attaching to the CNP device surface. Prior to CNP transfection (0s), red dots show nanochannel locations and room temperature. CNP electric pulse (CNP) sharply increases temperature at the nanochannel/cell surface interface. c. Cross-section view of nanochannels shows temperature changes within the nanochannels before (0s), during and after (1s) a CNP pulse. d. Temperature at the cell-nanochannel interface transiently (<1s) increases to ~60°C. e. Western blot of HSP90 and HSP70 from un-treated (PBS) and CNP/PBS-stimulated (CNP) MEFs. f. Dynamic light scattering (DLS) measurements of exosome concentrations of 108 CNP-stimulated MEFs with or without HSP inhibitors show that HSP70 and HSP90 are critical to the production of exosomes. NVPHSP990: HSP90 inhibitor; VER155008: HSP70 inhibitor. g. Western blot results show that CNP increases the P53 and TSAP6 protein expression in P53 WT MEFs, but it does not affect the P53 or TSAP6 protein expression in p53−/− MEFs. h. Dynamic light scattering (DLS) measurements of exosome concentrations show that knockdown of P53 can partially block exosome release after CNP. i. Schematic of a proposed mechanism for how CNP triggers exosome release in CNP-transfected cells. Data are from three independent experiments and are presented as mean ± s.e.m. Two-sided Student’s t-test was performed for the comparison.
Functional and pharmacokinetic evaluation of CNP generated exosomes.
To evaluate the clinical utility of mRNA-exosomes, we targeted the commonly mutated tumour suppressor gene PTEN in a PTEN-deficient human U87 and a murine GL261 glioma model. To achieve glioma targeting capabilities, we first cloned glioma-targeting peptides into the N-terminal of CD47, a transmembrane protein abundant on the surface of exosomes (Fig. 6a). Two different peptides, a CDX peptide (FKESWREARGTRIERG) for U87 targeting, and a CREKA for GL261 targeting, and a FLAG epitope, were inserted separately into the N-terminal of CD47. Because the topology of CD47 on exosomes was unclear, we performed a pulldown assay using anti-FLAG beads to confirm that the N-terminal of CD47 is localized to the external exosomal surface (Fig. 6b). Adding the targeting peptides dramatically increased the CD47-exosome (Exo-T) uptake in U87 and GL261 cells, as well as translation of the PTEN protein (Fig. 6c–f, Fig. S4f, S5a–d). Staining of endocytic markers revealed that the Exo-T co-localized strongly with transferrin (Fig. 6g, Fig. S5e). Inhibiting clathrin-mediated endocytosis significantly reduced the cellular uptake of exosomes (Fig. 6h, Fig. S5f), suggesting that Exo-T entry into target cells is likely mediated by clathrin-mediated endocytosis. Exo-T inhibited tumour cell proliferation and exhibited minimal cellular toxicity (Fig. 6i–j, Fig. S5g–h).
Fig. 6 |. In vitro study of CNP-generated exosomes for gene therapy and immunogenicity evaluation in mice.
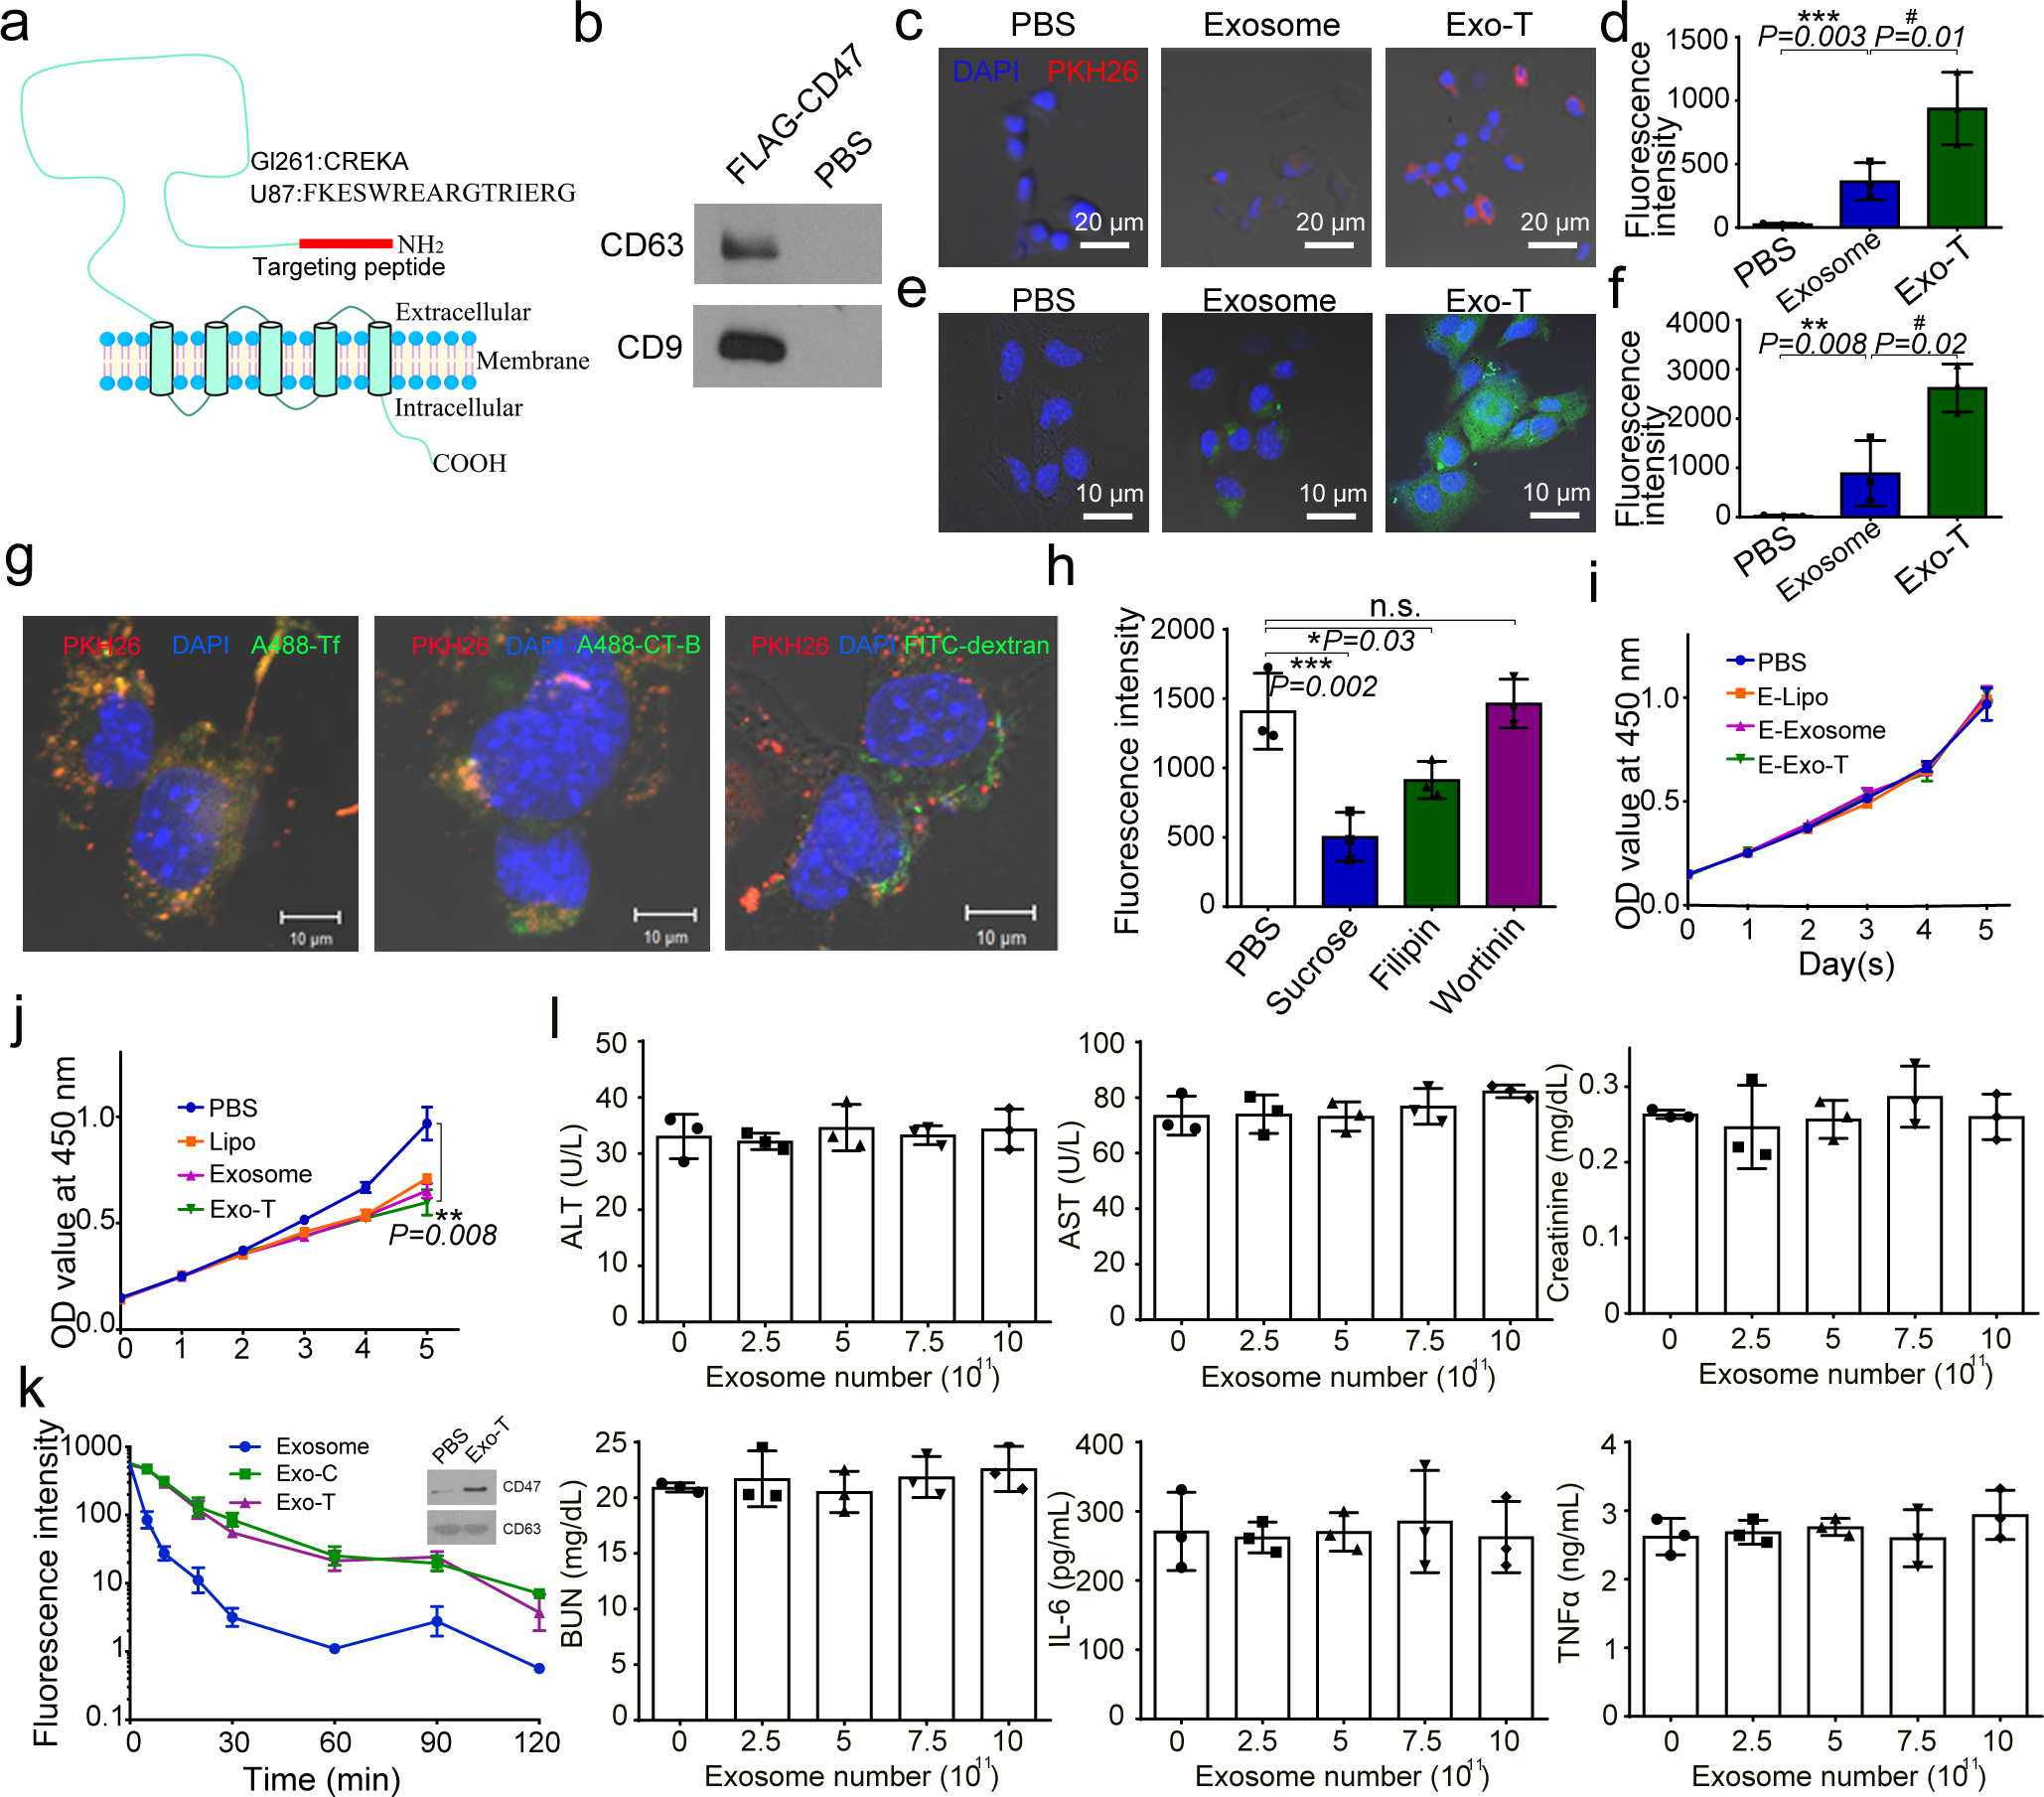
a. Schematic representation of GBM targeting peptide cloned into the N-terminal of CD47 transmembrane protein. b. Western blots of exosome pulldown assay show that FLAG beads can pull down the N-terminal cloned FLAG-CD47, suggesting that the N-terminal of CD47 is outside of the exosomes. c. Increased uptake of CNP-generated exosomes coated with a brain tumour targeting peptide linked to CD47 by glioma (GL261) cells. Exosome: uncoated exosomes. Exo-T: exosomes generated from CNP stimulated BMDCs transfected with CREKA-CD47 plasmid. d. Fluorescence intensity of PKH26-labeled Exo-T taken up by GL261 as assessed by flow cytometry further confirms that Exo-T has the best uptake in GL261 cells. e. Representative confocal microscopy images of PTEN staining in GL261 cells 24h after PBS, exosome or Exo-T treatments. f. Flow cytometry measurement of fluorescence intensity of PTEN staining 24 hours after incubating GL261 with exosomes shows that the Exo-T group has stronger PTEN protein expression. g. Representative immunostaining images of co-localization of PKH26-labeled Exo-T vesicles (red) with different endocytosis markers (green). Results indicate that most Exo-Ts are co-localized with A488-Tf, suggesting that Exo-Ts are mainly taken up through clathrin-dependent endocytosis. A488-Tf: Clathrin-dependent endocytosis marker; A488-CT-B: Caveolae-dependent endocytosis marker; and FITC-dextran: Macropinocytosis marker. h. Fluorescence intensity of PKH26-labeled Exo-T taken up by GL261 under different inhibition conditions by flow cytometry further confirms that Exo-Ts are primarily taken up through clathrin-dependent endocytosis. Sucrose: Clathrin-dependent endocytosis inhibitor; Filipin: Caveolae-dependent endocytosis inhibitor; and Wortinin: Macropinocytosis inhibitor. i. GL261 cell viability treated by empty lipofectamine (E-Lipo), exosome and Exo-T suggests good biocompatibility of the Exo-T. j. GL261 cell viability treated by lipofectamine, exosome and Exo-T containing PTEN mRNA. k. Circulatory half-life of systemically administered PKH26-labeled exosomes in mice. Overexpression of CD47 protein greatly extends the circulatory half-life of exosomes, which is not affected by the insertion of CREKA peptide. Exo-C: exosomes from CNP/CD47 plasmid-transfected BMDCs. Exo-T: exosomes from CNP/CREKA-CD47 plasmid-transfected BMDCs. Inset: Confirmation of CD47 protein expression in exosomes from BMDCs transfected with CREKA-CD47 plasmid. l. AST, ALT, creatinine, BUN, IL6 and TNFα levels measured by ELISA with administration of different doses of CREKA-CD47 targeted exosomes (Exo-Ts). All the data are from three independent experiments and are presented as mean ± s.e.m., two-sided Student’s t-test was performed for the comparison (d, f, h, i, j, k, l).
To investigate Exo-T’s potential for in vivo applications, we first evaluated its pharmacokinetic properties. CD47 was strongly expressed on the exosome surface after cells were transfected with CD47 plasmid (Fig. 6k, upper panel). The overexpression of CD47 on the exosome surface increased the in vivo circulatory half-life of Exo-T by 3-fold, while the addition of targeting peptide did not have any obvious effects on CD47 function (Fig. 6k). Immunogenicity results showed that Exo-T has no obvious in vivo toxicity or immunogenicity in mice at the different dosages and time points (2h, 8h, and 24h) tested (Fig. 6l, Fig. S5i).
In vivo therapeutic efficacy of Exo-T in preclinical models of glioma.
To assess the therapeutic potential of Exo-T in PTEN-deficient glioma models, we intravenously injected Exo-T into orthotopically implanted human U87 glioma-bearing immunodeficient mice. Exo-T exhibited significantly better tumour accumulation than non-targeted exosomes (exosome) or TurboFect (Turbo) nanoparticles, (Fig. 7a). To further evaluate the in vivo biodistribution of Exo-Ts within the tumour interstitium, we systemically administered PKH26-labelled Exo-T, exosome, and Turbo in tumour bearing mice and imaged with intravital fluorescence microscopy. We observed a strong PKH fluorescence within the tumour stroma 4 hours after administering Exo-Ts, but not exosomes or TurbFect nanoparticles (Fig. 7b–c, Fig. S6a–b). Evaluation of systemic distributions further revealed a marked reduction in hepatic and splenic accumulation of Exo-Ts (Fig. 7d–e). U87 mice treated with Exo-Ts demonstrated significantly inhibited tumour growth (Fig. 7f–g) and prolonged survival with a median survival of 49 days, as compared to 37 days for non-targeted exosomes (Fig. 7h). Evaluation of residual tumour tissue from both groups revealed that both PTEN mRNA and protein levels were up-regulated after Exo-T treatment (Fig. S7a–b). Immunohistochemical staining results further confirmed that Exo-T treatment restored PTEN expression and inhibited tumour cell proliferation with no direct effect on other tissues examined (Fig. 7i–k, Fig. S7c–o).
Fig. 7 |. In vivo therapeutic efficacy of CNP-generated exosomes in a U87 orthotopic glioma model.
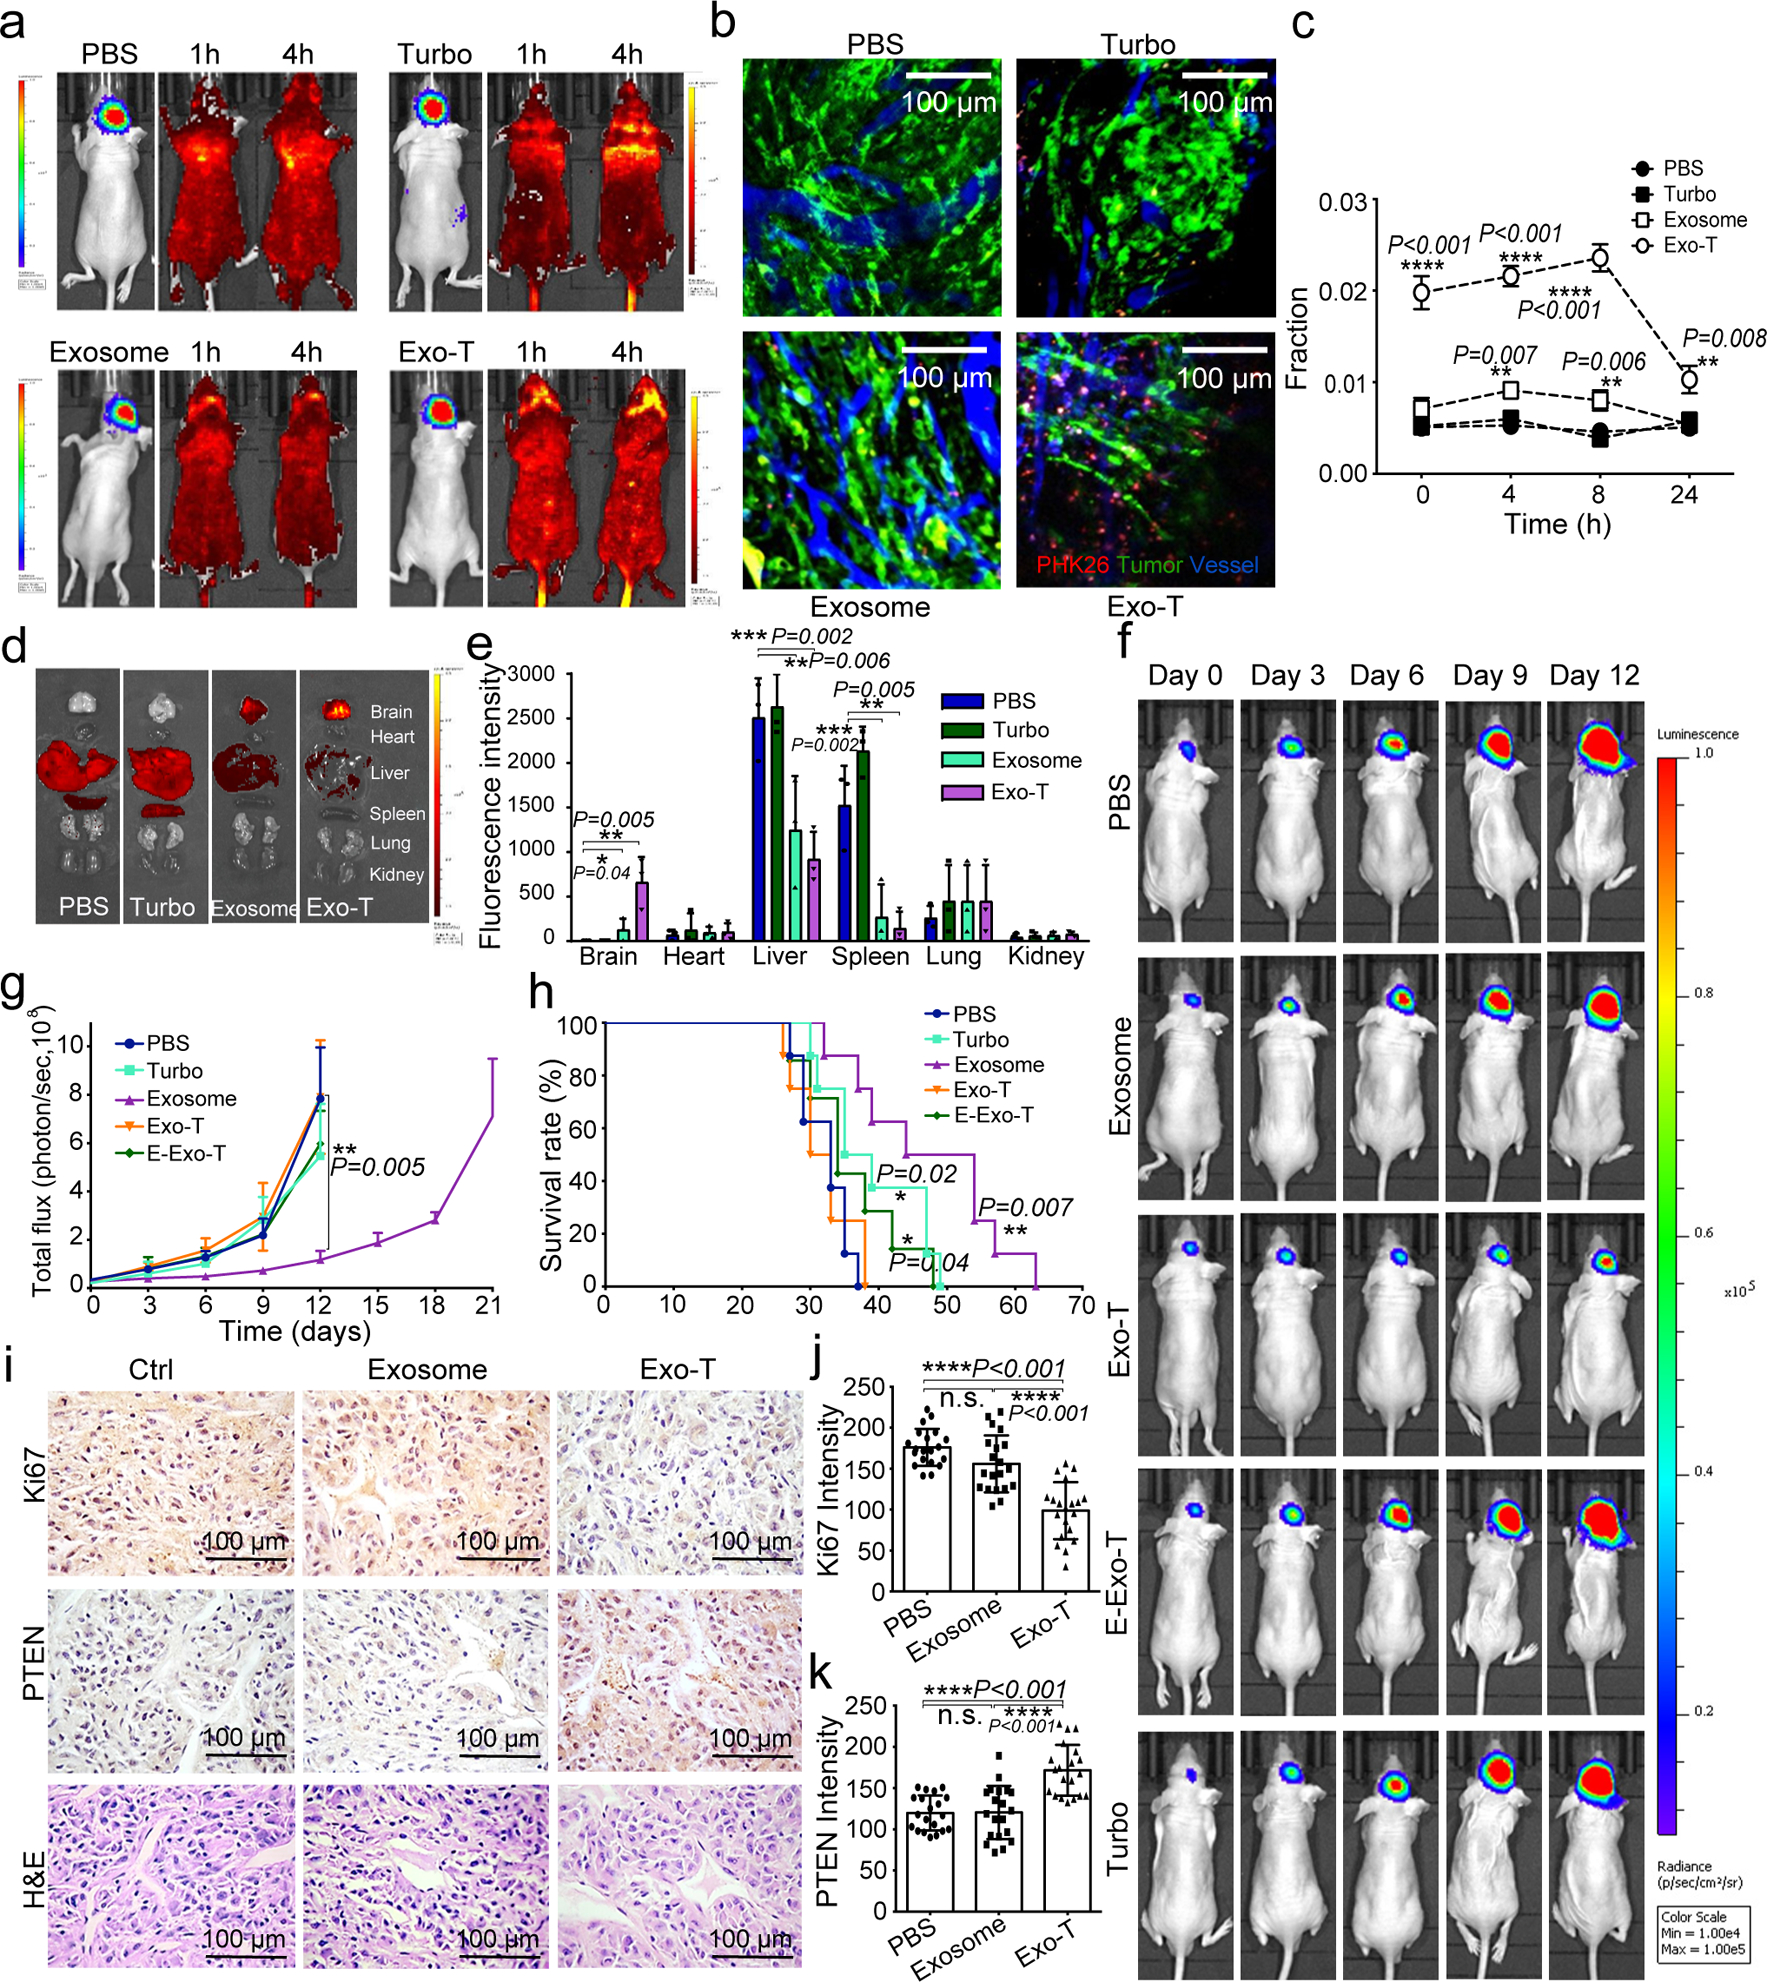
a. In vivo imaging showing preferential accumulation of PKH-26 labeled Exo-T within orthotopically implanted U87 tumours in nude mice. The targeted delivery of Exo-T into brain tumours is also confirmed by intravital fluorescence microscopy (b) which shows significantly increased accumulation of Exo-T within the tumour stroma as compared with uncoated exosomes (exosome) or TurboFect nanoparticles (Turbo). c. Quantification of exosome intensity in the tumour site at various time points. Ten images per animal with 3 mice per group. d,e. Tissue distribution analyses show that Exo-T exhibits increased brain targeting with low hepatic and splenic accumulation. f,g. Tumour growth inhibition by PBS, PTEN mRNA containing exosomes (exosome), Exo-T, empty Exo-T (E-Exo-T), or TurboFect nanoparticles (Turbo) treatment via tail vein injection. n=3 mice per group. h. PTEN mRNA Exo-T extends the survival of mice with U87 glioma (p<0.001, Log-rank test after Bonferroni correction). n=8 mice per group. i. PTEN, Ki67 and H&E staining of residual GBM tumour tissue with different treatments shows that Exo-T restores the PTEN expression and inhibits cell proliferation in tumour tissue. j. Ki67 intensity measurement of IHC images by ImageJ software. k. PTEN intensity measurement of IHC images by ImageJ software. Data are from three independent experiments unless otherwise stated and are presented as mean ± s.e.m. All the data are from three independent experiments and are presented as mean ± s.e.m., two-sided Student’s t-test was performed for the comparison (c, e, g, h, j, k).
We next investigated the therapeutic efficacy of Exo-Ts in an immune-competent PTEN-deficient GL261 glioma model. Exo-T again exhibited better tumour accumulation than non-targeted exosomes (exosome) or PEG-liposomes (Liposome) (Fig. 8a). To further evaluate the in vivo biodistribution of Exo-Ts within the tumour interstitium, we systemically administered PKH26-labelled Exo-T, exosome, and PEG-liposome in tumour bearing mice and imaged with intravital fluorescence microscopy. We observed a strong PKH fluorescence within the tumour stroma 4 hours after administrating Exo-Ts, but not for the exosome or liposome nanoparticle cohorts (Fig. 8b–c). Ex vivo results showed that the majority of exosomes were taken up by brain tumour cells, whereas normal brain cells showed minimal exosome uptake following administration (Fig. 8d). Evaluation of systemic distribution further revealed a marked reduction in hepatic and splenic accumulation of Exo-Ts (Fig. 8e–f). GL261 mice treated with Exo-Ts demonstrated significantly inhibited tumour growth (Fig. 8g–h) and experienced prolonged survival with a median survival of 45 days, as compared to 31 days for non-targeted exosomes (Fig. 8i). Evaluation of residual tumour tissue from both groups revealed that both PTEN mRNA and proteins levels were up-regulated after Exo-T treatment (Fig. 8j–k). Immunohistochemical staining results further confirmed that Exo-T treatment restored PTEN expression and inhibited tumour cell proliferation with no direct effect on other tissues examined (Fig. 8l–n,Fig. S8a–m).
Fig. 8 |. In vivo therapeutic efficacy of CNP-generated exosomes in a GL261 orthotopic glioma model.
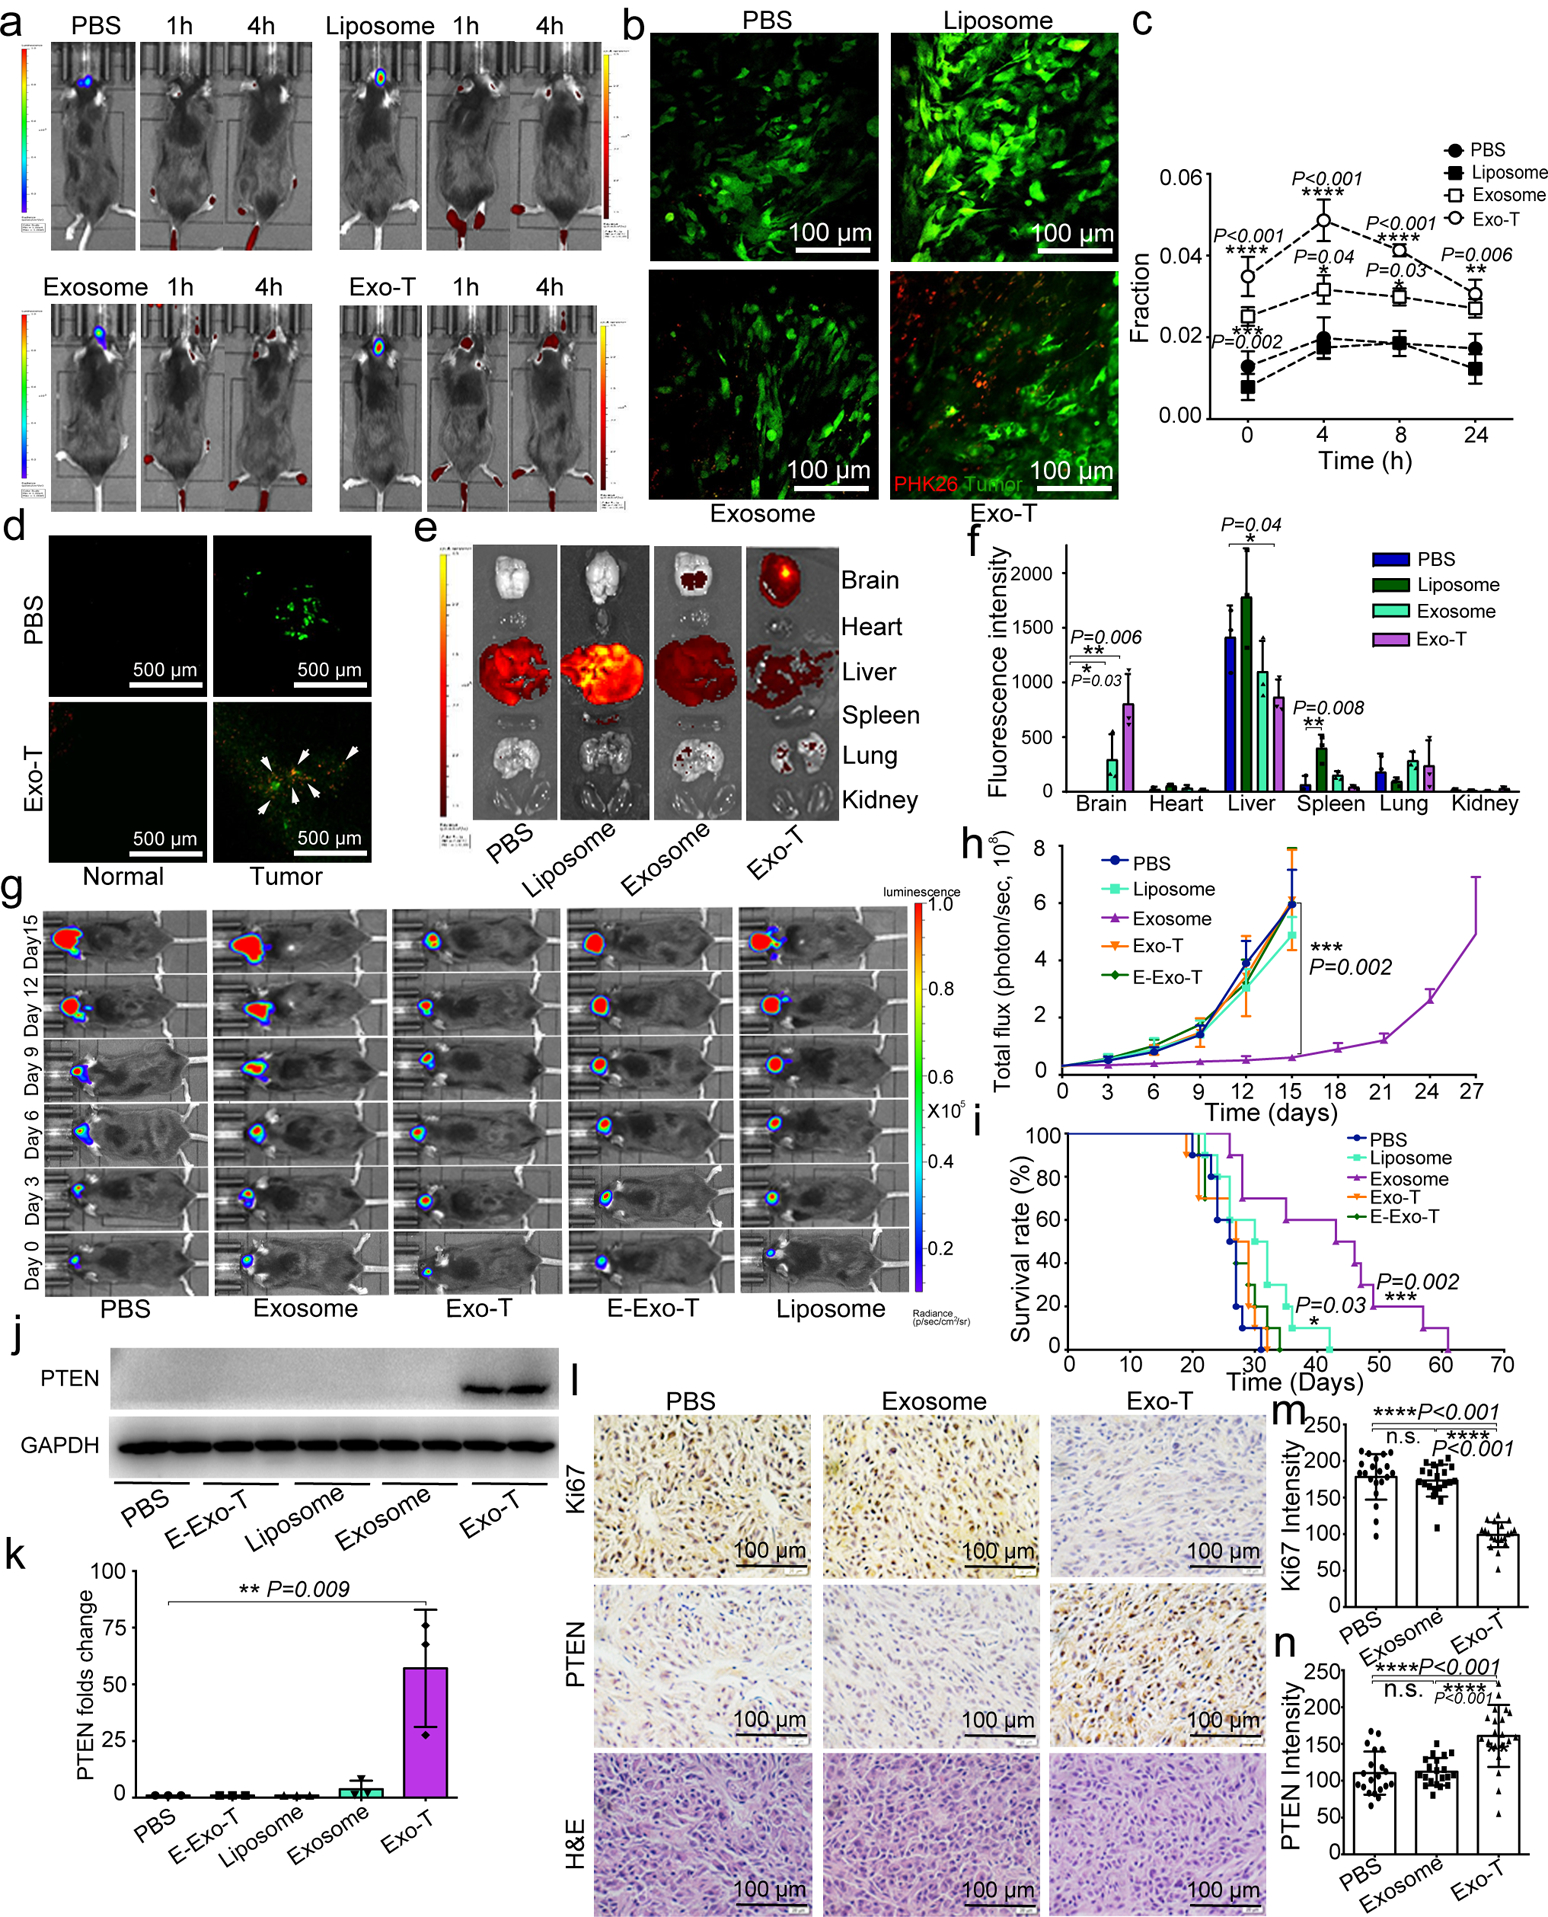
a. In vivo imaging showing preferential accumulation of PKH-26 labeled Exo-T within orthotopically implanted GL261 tumours in C57BL/6 mice. The targeted delivery of Exo-T into brain tumours is also confirmed by intravital fluorescence microscopy (b), which shows significantly increased accumulation of Exo-T within the tumour stroma as compared with uncoated exosomes (exosome) or PEG-liposome nanoparticles (Liposome). c. Quantification of exosome intensity in the tumour site at various time points. d. Distribution of PBS (Top row) and Exo-T (Bottom row) conjugated with PHK26 within normal tissue area and tumour area; scale bar: 500 μm. e, f. Tissue distribution analyses show that Exo-T exhibits increased brain targeting with low hepatic and splenic accumulation. g. h. Tumour growth inhibition by PBS, PTEN mRNA containing exosomes (exosome), Exo-T, empty Exo-T (E-Exo-T), or PEG-liposome nanoparticles (Liposome) treatment via tail vein injection. n=3 mice per group. i. PTEN mRNA Exo-T extends the survival of mice with GL261 glioma (p<0.001, Log-rank test after Bonferroni correction). n=8 mice per group. j, k. Western blots (j) and qPCR (k) of PTEN protein and mRNA levels respectively in GBM tumours, suggest the restoration of both PTEN protein and mRNA expression in PTEN-null GL261 GBM tumours. n=3 mice per group. l. PTEN, Ki67 and H&E staining of residual GBM tumour tissue with different treatments shows that Exo-T restores PTEN expression and inhibits cell proliferation in tumour tissue. m. Ki67 intensity measurement of IHC images by ImageJ software. n. PTEN intensity measurement of IHC images by ImageJ software. Data are from three independent experiments unless otherwise stated and are presented as mean ± s.e.m. Two-sided Student’s t-test was performed for the comparison (c, f, h, i, k, m, n).
Discussion
Exosomes have recently emerged as a promising system to deliver nucleic acids to treat malignant tumours.9, 31 However, the ability to produce large quantities of exosomes containing an abundance of endogenously-transcribed mRNAs remains a major challenge. Our study demonstrates that through using a cellular nanoporation technique, we can achieve large-scale production of exosomes containing endogenously transcribed mRNA from a variety of cellular sources. Unlike other cell electroporation and stress inducing strategies, the controlled focal generation of transient membrane pores using nanochannels enables simultaneous delivery of plasmid DNA into source cells, which would not be possible with the simple administration of growth factors or cytokines. Because the induction of membrane pores by the nanochannels is critical for stimulating cellular exosomal release, we investigated different nanochannel sizes, ranging from 100 to 1000 nm. We found that for cells with diameters of approximately 10~20 μm, nanochannels within this size range are sufficient for plasmid delivery. When the channel diameter is larger than 1 μm, cell transfection mechanisms change because a much lower electric voltage (<50 V) is needed to avoid excessive cellular death. However, at such a low voltage, the delivery of plasmids becomes highly inefficient. For the current study, our choice of a nanochannel with a diameter of 500 nm was based on its ability to sufficiently deliver plasmid DNA into the cells, without inducing cellular injuries that diminish the overall electroporation efficiency.
Our results also suggest a mechanism by which cellular intrinsic processes can promote exosome generation and subsequent secretion in response to external stress. We found that focal cell membrane injuries and local heating from CNP resulted in upregulated HSPs and elevated intracellular [Ca2+], leading to the formation of a large number of intracellular vesicles. These vesicles are released as secreted exosomes, which can be induced to contain therapeutic RNAs after plasmid DNA delivery. Although the precise molecular and cellular mechanisms involved in heightened exosomal production is still a topic of investigation, it likely involves the influx of [Ca2+], which along with P53-TSAP6 activation as a part of the HSP response, promotes increased exosome production and subsequent secretion. At the present time, it is unclear whether this process of exosome production and secretion is unique to CNP or whether it is applicable to other cell stress inducing strategies. Nevertheless, our results suggest that a properly controlled CNP approach is not only effective for intracellular nucleic-acid delivery, but more importantly, it also stimulates intrinsic cellular adaptive processes to produce exosomes for therapeutic use. It is also worth noting that we observed a minimum cell death or activation of apoptosis pathways with CNP, despite an increase in P53 expression. This may be explained by the transient and localized heat shock response at the nanopore site during CNP transfection. Further investigation may shed the light on the precise molecular mechanisms involved in CNP-mediated exosome production and cell recovery processes through heat shock protein signaling.
One concern relating to the utilization of source cells to intrinsically encapsulate transcribed mRNA into secreted exosomes is mRNA loading efficiency. Previous studies have shown that the vast majority of RNAs within secreted exosomes are miRNAs and ncRNAs.32–34 It has also been revealed that most exosomes contain fragments of rRNAs and mRNAs, but not their intact forms.19, 35 Consistent with these findings, we observed that exosomes isolated from MEFs under normal physiological conditions contained minimal intact mRNA copies, with >99% of the exosomal RNAs having a size of less than 500 KD. We estimated that on average, one intact mRNA can be found within every 103 exosomes produced endogenously without external stimulation. In the setting of CNP treatment, the same source cells produced 2–10 intact mRNAs per exosome, which corresponds to a 2,000 to 10,000-fold increase in loading efficiency. Currently, techniques such as step ultracentrifugation, density gradient purification and ultrafiltration have been developed to isolate exosomes from cell culture medium.36 In our study, we first tested both step ultracentrifugation and Optiprep™ density gradient purification methods to purify exosomes. The mRNA recovery ratio for Optiprep™ density gradient purification is only about 10–20% of step ultracentrifugation, although we did observe a more concentrated RNA collection in the exosome fraction (Fraction 5–7). Moreover, chemicals involved in the separation process may be left behind.37 Therefore, given the similar mRNA rates, we selected step ultracentrifugation in our therapeutic models.
Despite the interest in using EVs as a nanocarrier for nucleic acid, exosome-based mRNA delivery remains a major challenge due to crude electroporation-based packaging methods and difficulty in mass production of EVs. Although certain large mRNA transcripts such as Cas9 mRNA have been successfully electroporated into EVs from erythrocytes, this approach suffers from low EV-loading efficiency and particle aggregation during electroporation.14 Further, whether such method is applicable to exosomes collected from nucleated cell sources is unclear. Alternatively, packing RNAs in EVs can be accomplished by inserting a sequence encoding a specific peptide that is incorporated into EVs and capable of binding to target mRNA.15, 16 However, such techniques are highly complex and require genetic modification of cells or individual constructs to be made for each target mRNA.15, 16 By comparison, the CNP method as demonstrated in this study does not require any modifications to the source cells or target mRNA/protein sequences with minimal post-secretion processing of collected EVs required as compared to post-insertion electroporation.
When administered in vivo, therapeutic exosomes exhibit long circulatory half-lives with minimal cytotoxicity, and most importantly, can penetrate through physiological barriers within the body that often restrict the access of other synthetic nanocarriers. In this study, we showed that mRNA-containing exosomes can restore tumour suppressor function in orthotopically implanted PTEN-deficient brain gliomas, resulting in tumour growth inhibition and prolonged animal survival. Because CNP utilizes focused electrical stimulation of source cells for increased exosome production, endogenous mRNA transcription and packaging, it greatly simplifies the entire process of therapeutic exosome production compared to conventional post-insertion strategies. Currently, a single CNP cycle lasting 2–3 days can generate ~1012 therapeutic exosomes per 1cm x 1cm chip with ~106 cells, which is sufficient for preclinical in vivo studies when multiple chips are used. For clinical translation, it is essential to develop high-throughput cell transfection and exosome production processes is essential. Larger CNP chips that can transfect more cells and microfluidics-enhanced CNP processes to reduce cycle time are currently under development with the goal of precisely controlling scale-up production with reproducible results. Additionally, the optimal cell sources for generation of therapeutic exosomes are still unclear. We demonstrated that CNP is robust in producing therapeutic exosomes from multiple source cell types. The next step would require evaluation of multiple allogeneic and autologous cell sources that can be easily retrieved from patients. Finally, the logistics involved in manufacturing clinical-grade therapeutic exosomes under scalable Current Good Manufacturing Practice (CGMP) conditions need to be carefully planned.38, 39Early phase clinical trials employing therapeutic exosomes produced using conventional electroporation methods such as BEP for siRNA delivery ( NCT03608631) and for other therapeutic applications ( NCT02565264, NCT03384433, NCT02594345) are already underway. Our results further support the translational potential of therapeutic exosomes and provide a simple strategy to expand their use in transcriptional manipulation for clinical applications.
Methods
Cell culture.
Mouse embryonic fibroblasts (MEFs) were purchased from Millipore. MEFs were cultured in Dulbecco’s Modified Eagle’s Medium (DMEM) (Thermo Fisher Scientific) containing 10% heat-inactivated Fetal Bovine Serum (FBS) (Catalog number: 10438034 Thermo Fisher Scientific) and 1% Non-Essential Amino acid (NEAA) (Catalog number: 11140050, Thermo Fisher Scientific). Human glioma U87-MG and HEK 293T cell lines from ATCC were cultured in DMEM supplemented with 10 mmol/L HEPES, 10% FBS and 1% penicillin/streptomycin at 37°C in humidified conditions equilibrated with 5% CO2.
Plasmids preparation.
Achaete-Scute Complex Like-1 (Ascl1), Pou Domain Class 3 Transcription factor 2 (Pou3f2 or Brn2) and Myelin Transcription Factor 1 Like (Myt1l) were synthesized as described previously40. PTEN, CD47, CD63-GFP and miR-128 plasmids were purchased from Origene. Primers designed to encode CDX (FKESWREARGTRIERG)41 ,CREKA42, and FLAG tag were used to introduce the ligands into the N-terminal of CD47.
Isolation of monocytes from mouse bone marrow.
Four to twelve week old C57BL/6 mice were sacrificed by cervical dislocation and disinfected in 70% ethanol for 5 minutes. Femurs and tibiae were removed and purified under sterile conditions. The intact bones were then washed with PBS, and both ends were cut with scissors. Bone marrow was rinsed out with RPMI-1640 medium using a 0.45 mm diameter needle. The cells were collected by centrifugation at 1,000 rpm for 5 minutes. The Tris-NH4Cl red blood cell lysis buffer was added to the cell pellet to remove the red blood cells. The cell suspension was further centrifuged at 1,000 rpm for 5 minutes to collect the monocytes.
Induced culture of bone marrow-derived DCs (BMDCs).
Isolated monocytes were cultured in RPMI-1640 medium supplemented with 10% FBS at 37°C in an incubator containing 5% CO2. The culture medium was supplemented with 20 ng/ml GM-CSF and 10 ng/ml IL-4. Non-adherent cells were removed 12 hours after culturing and replaced with fresh complete medium containing GM-CSF and IL-4. At day 7, the loosely adherent cells were harvested by gently pipetting the medium against the flask. The cells were plated into CNP chips for additional incubation with lipopolysaccharide for 24 hours.43, 44
Liposome preparation.
The PTEN mRNA containing PEG-liposome (PEG-liposome based In Vivo Transfection Reagent, Altogen Biosystem) was prepared as per the manufacturer’s instruction. Briefly, 100 μg of synthesized PTEN mRNA was diluted in 100 μl RNase free water. The diluted mRNA solution was mixed with 50 μl Transfection Reagent in a sterile tube and incubated at room temperature for 15 minutes. Ten microliters of Transfection Enhancer Reagent were added, and the mixture was incubated at room temperature for 5 minutes. A 5% glucose (w/v) sterile solution was used to adjust the final injection volume to 0.4 ml per mouse. The mRNA dosage in liposome and exosome groups was 40 μg/kg.
Cell transfection.
For CNP, a single layer of MEFs, MSCs, DCs, or HEK- 293T cells (~200,000 cells) was spread on a 1 cm x 1 cm 3D CNP silicon chip surface for overnight cell incubation. Plasmids pre-loaded in PBS buffer were injected into individual cells via nanochannels (~500 nm diameter and 5 μm spacing) using a 200 V electric field for 5 pulses at 10 ms/pulse with a 0.1 second interval. Various electroporation conditions were tested for best choice. BEP (Neon Transfection System, Thermo Fisher Scientific), Gene Gun (PDS-1000/He™ System, Bio-Rad) and Lipofectamine 2000 transfections were conducted according to manufacturers’ instructions. Ascl1/Brn2/Myt1l plasmids at a weight ratio of 2/1/1 and a concentration of 100 ng/mL in PBS buffer, according to the protocol in literature,40 were pre-mixed for transfection. Cell transfection of PTEN, miR-128, CD47, CDX-CD47, CREKA-CD47 and CD63-GFP plasmids followed the same procedure.
Collection and purification of EVs secreted by donor cells.
Cells were cultured in culture medium containing serum. Before transfection, the cell culture medium containing serum was removed. The cells were washed with PBS three times and cultured in serum-free cell culture medium for 48 hours after CNP. For qRT-PCR, EVs were collected from cell culture supernatants using ExoQuick™(SBI) precipitation by simple centrifugation at 1500g for 10 minutes as per manufacturer’s instruction. For EV particle measurements by dynamic light scattering goniometry (DLS) and NanoSight™, in vitro cell transfection and in vivo animal experiments, EVs were collected from cell culture supernatants by serial centrifugation and ultracentrifugation as described in the literature.45, 46 Briefly, cell culture supernatant was centrifuged at 2000g for 10 minutes to remove the cell debris. This was followed by additional centrifugation at 10,000g for 30 minutes to remove the microvesicles. The final exosomes fraction was pelleted after ultracentrifugation at 100,000g for 2 hours.
OptiPrep™ density gradient purification.
Exosomes were purified using an OptiPrep™ density gradient ultracentrifugation.36 Briefly, different concentrations of iodixanol solutions (40%, 20%, 10%, and 5%, w/v) were prepared by diluting the OptiPrep stock solution with 0.25 M sucrose/10 mM Tris buffer. A discontinuous iodixanol gradient was formed by layering 3 ml each of 40%, 20% and 10% iodixanol solutions, followed by 2.5 ml 5% iodixanol solution. Crude exosomes samples were laid on top of the solution and centrifuged at 100,000g for 16 hours in a SW Ti40 rotor at 4°C. The superficial fraction (1 ml) was collected and diluted in ice cold PBS to a final volume of 12 ml followed by further centrifugation at 100,000g for 2 hours at 4°C to pellet the exosomes.
Three-dimensional CNP biochip fabrication.
Nanochannel array devices were fabricated based on <100> double-polished 10 cm wafers (UniversityWafer, Inc. Item#2345). Briefly, a thin layer of Shipley 1813 photoresist was first spin-coated on the silicon wafers at 3,000 RPM after HMDS prime processing. Nanopore openings on the photoresist were patterned using projection lithography (GCA 6100C stepper (l-line)). A deep reactive ion etching (DRIE) technique, “Bosch Process”, was utilized to etch a high-aspect-ratio (>20:1) nanochannel array (10 μm deep). An alternating sequence of etching gas SF6 and sidewall passivation gas C4F8 was set using optimized parameters. Microchannel reservoirs on the other side of the wafers were generated using a similar process combining photolithography and DRIE. Processed wafers were cleaned in piranha cleaning (120°C, 10 min) before they were diced into 1 cm x 1 cm pieces. The PDMS spacers were made from a pre-polymer/curing agent mixture (Sylgard 184, Dow Corning) (10:1 weight ratio) cured at room temperature for 3 days. The PDMS and silicon surfaces were pre-treated with oxygen plasma (PTS oxygen plasma system) to secure a tight bonding. A thin film of gold was deposited on a glass slide (Denton DV-502A) as a bottom electrode. A gold rod was used as the top electrode.
Sorting of exosomes and microvesicles from total EVs.
Microvesicles were sorted from total EV by centrifugation at 10,000 g for 30 minutes. The supernatant was further centrifuged at 100,000 g for 2 hours to collect smaller exosomes, as described in the protocol reported in the literature.45, 46
EV size measurements by DLS and NanoSight™.
Size distributions of EVs were determined using a DLS goniometer (BI-200SM Goniometer, Brookhaven Instruments.). Absolute numbers of exosomes and microvesicles secreted per cell were quantified by NanoSight™ using the same number of living donor cells after transfection for comparison.
Agarose gel assay.
Samples were loaded onto a 1% (w/v) agarose gel containing 0.5% μg/ml ethidium bromide. Electrophoresis was performed at 100 V for 30 minutes. The gel was imaged under UV light on an ImageMaster VDS (Pharmacia, Sweden).
qRT-PCR of EV-containing RNA expression levels.
The expression of Ascl1, Brn2, Myt1l and PTEN mRNAs and miR-128 in EVs was measured using qRT-PCR following the manufacturer’s recommended protocol. Briefly, total RNAs were obtained using TRIzol reagent according to manufacturer’s instructions (Invitrogen). Reverse transcription of equal amounts of RNA was carried out using first-strand cDNA synthesis kit (Invitrogen) with random hexamers as primers. The expression of genes was measured using the CYBR green PCR Master Mix (ABI). All experiments were performed in triplicate. For measuring full-length PTEN mRNA, the annealing temperature was set at 60°C and extension time was set at 72 seconds. Synthesized PTEN mRNA was used to construct the standard curve. The concentrations used were 0.0001, 0.001, 0.01, 0.1, 1, and 10 ng/μl. The primer sequences used were as follows: Ascl1(mouse), forward: 5’-TGGTGTCTGAACCTAAGCCC-3’, and reverse: 5’-GTCCGAGAACTGACGTTGCT-3’; Myt1l(mouse), forward: 5’-CCTATGAGGACCAGTCTCC-3’, and reverse: 5’-GACATGGCTGTCACTGGAT-3’; Brn2 (mouse), forward: 5’-GACACGCCGACCTCAGAC-3’, and reverse: 5’-GATCCGCCTCTGCTTGAAT-3’; GAPDH (mouse), forward: 5’-GGGAAATTCAACGGCACAGT-3’ and reverse: 5’-AGATGGTGATGGGCTTCCC-3’; PTEN, forward: 5’-CAAGATGATGTTTGAAACTATTCCAATG-3’, and reverse: 5’-CCTTTAGCTGGCAGACCACAA-3’; PTEN (full length), forward: 5’-ATGACAGCCATCATCAAAGAGATC-3’, and reverse: 5’-TCAGACTTTTGTAATTTGTGTATGCTG’; and GAPDH, forward: 5’-GACAGTCAGCCGCATCTTCT-3’, and reverse: 5’-TTAAAAGCAGCCCTGGTGAC-3’.
In vitro protein translation.
Total RNA (1 μg) from each transfection method was applied for in vitro protein translation using Rabbit Reticulocyte Lysate System (Promega) according to manufacturer’s instruction. After the translation procedure was accomplished, samples were separated by SDS-PAGE and the proteins were detected with various antibodies as shown in the Western blotting plot.
Transmission electron microscopy (TEM).
Cells for TEM analysis were collected 4 hours after CNP transfection, re-suspended in 20% BSA in PBS, and then placed into a 200 μM deep hat and frozen at high pressure using a Leica EM PACT2. Frozen samples were then freeze-substituted in 1% osmium tetroxide and 0.1% uranyl acetate in acetone using Kent McDonald’s quick method in a cold block.47 The samples were then held in a Styrofoam block for 3h. After the samples reached 0 °C, they were moved to a hood and stayed there for 12h. The samples were then warmed to 25 °C at the rate of ~ 5 °C/h and stayed at 25 °C for 12h. The samples were washed twice in acetone and once in propylene oxide (PO) for 15 minutes each. Samples were infiltrated with EMbed-812 resin (EMS Cat#14120) mixed 1:2, 1:1, and 2:1 with PO for 2 hours each and left in 2:1 resin to PO mixture overnight rotating at room temperature in the hood. The samples were then placed into EMbed-812 for 2~4 hours and placed into TAAB capsules with labels and fresh resin, orientated with specimen carrier/cells (if still in hat) facing up and placed into 65°C oven for overnight. Sections were taken between 75 and 90 nm, picked up on formvar/Carbon coated 100 mesh Cu grids, then contrast stained for 30 seconds in 3.5% UrAcetate and 50% acetone followed by staining in 0.2% lead citrate for 3~4 minutes. Samples were observed in the JEOL JEM-1400 120kV and photos were taken using a Gatan Orius 2k x 4k digital camera.
Cryo-TEM.
For cryo-electron microscopy, 3 μl of EV sample was applied to a glow-discharged 300-mesh R2.0/2.0 Quantifoil grid. The grid was blotted by Whatman #1 filtration paper and rapidly frozen in liquid ethane using a Vitrobot IV plunger (FEI). Micrographs were recorded on a 4k×4k CCD camera (Gatan) at a magnification of 59,000×, a dose of 20 electrons/Å2, and a defocus of 5 μm in a FEI Tecnai F30 electron microscope operated at 300 kV.
Cell membrane damage evaluated by cell uptake of propidium iodide (PI) dye.
CNP-induced transient cell membrane damage was quantified by diffusion-based cell uptake of PI dye (Invitrogen, Cat#P3566) and subsequent fluorescent signal. MEFs were transfected by CNP with a 200 V, 20 ms electric pulse. PI dye was immediately added in either the top (cell side) or the bottom reservoir. On-chip time-lapse epi-fluorescence live cell imaging was conducted using an inverted microscope system (Eclipse Ti-E, Nikon) equipped with an EMCCD camera (Evolve, Photometrics). BEP of MEFs was also performed as a control following the electric field conditions suggested by the supplier’s manual (Neon Transfection System, Thermo Fisher Scientific).
Measurement of intracellular calcium concentration.
Cells were incubated with 10 μM Fura2-Am at 37 °C for 1 hour. The extracellular dye was washed away with PBS, and cells were resuspended in complete RPMI medium to a density of 1 × 10⁶ cells/ml. The fluorescence changes after the CNP were recorded in a Hitachi F-2000 fluorescence spectrophotometer. All experiments were protected from light and completed within 2 hours.
Temperature measurement during CNP.
Temperature rise by joule heating during CNP was measured using a temperature-sensitive fluorescent dye, Rhodamine B (Thermo Fisher Scientific, Cat#AC419000010) as described previously.48 To prevent fluorescent dye diffusion, sodium alginate solution was added to calcium chloride powder to form calcium alginate gel to suppress the dye diffusion during CNP.
FEM heat transfer simulation during CNP.
The temperature field near a nanochannel was simulated using the COMSOL® Multiphysics 5.0. (COMSOL Inc.) “heat transfer in fluids” module, by solving the governing equation where ρ: density cp: heat capacity u: flow rate k: thermal conductivity; Initial temperature=22°C. The nanochannel is regarded as a pulsed heat source with a power density Qnc=P/V≈1014 W/m3. The simulated data were exported to MATLAB (MathWorks) for analysis.
EV pulldown assay.
Protein-A Sepharose beads (Sigma) were incubated with 2 mg/ml BSA/PBS solution at 4°C overnight. The beads were subsequently washed with cold PBS three times. Rabbit anti-FLAG antibody was incubated with beads at 4°C for 4 hours, then washed three times with cold PBS. Purified EVs were incubated with the beads overnight. After washing, the beads were eluted in 0.1% SDS and 20 μl of the supernatant was used for the polyacrylamide gel.
EV cellular uptake assay.
EVs were labeled with PKH67 and incubated with 60,000 U87-MG cells in a 24-well plate at 37°C for 4 hours prior to treatment. After incubation, cells were rinsed three times with cold PBS and fixed in 4% paraformaldehyde solution. The cell fluorescence intensity was analyzed using a Beckman Coulter EPICS XL flow cytometer. A minimum of 10,000 events were collected for each cell sample under LIST mode.
Confocal microscopy.
Transferrin AlexaFluor 488 (TF-A488), Cholera toxin subunit B AlexaFluor 488 conjugate (CT-B-A488) (Invitrogen, USA) and FITC-dextran (Sigma-Aldrich) were used to label different endocytosis pathways. TF-A488, CT-B-AF488 and FITC-dextran were diluted to 0.1 mg/ml, 5 mg/ml, and 0.005 mg/ml, respectively, and incubated with U87-MG cells for 1 hour. Cells were then incubated with PKH26 (2 μM) (Sigma-Aldrich) stained EV for 4 hours, washed twice with ice cold PBS, and fixed with formaldehyde (4%)/PBS for 30 minutes. Cell nuclei were stained with DAPI with gold coating solution, and the fluorescence was visualized and recorded on a Laser Scanning Confocal Microscope (LSM710, Carl Zeiss, Germany). All images were analyzed using a background subtraction method offline.
Tethered lipoplex nanoparticle (TLN) biochip assay and total internal reflection fluorescence (TIRF) imaging.
EVs were tested using a tethered lipoplex nanoparticle (TLN) biochip on a total internal reflection fluorescence (TIRF) microscope (Nikon Eclipse Ti Inverted Microscope System), following the same procedures described elsewhere24. Briefly, a molecular beacon (MB) for the RNA target was encapsulated in cationic liposomal nanoparticles. These cationic lipoplex nanoparticles were tethered on a glass slide, which captured negatively charged EVs by electrical static interactions to form a larger nanoscale complex. This lipoplex-EV fusion led to mixing of RNAs and MBs within the nanoscale confinement near the biochip interface. TIRF microscopy was used to measure the fluorescence signals within a 300 nm range of the focal plane interface, which is where the tethered liposomal nanoparticles locate.
MTS assay.
U87-MG cells were seeded at a density of 5000 cells/well in a 96-well plate 24 hours prior to transfection. Cells were washed three times with serum-free medium and incubated with EVs. At 48 hours post-transfection, the medium was replaced with fresh cell culture medium. Cell viability was then analyzed by MTS assay per manufacturer’s instructions. Briefly, 20 μl of the MTS reagent (Promega) was added to each well. After incubation of the microplate in a humidified atmosphere (5% CO2, 37°C) for 2h, the spectrophotometrical absorbance was measured using a microplate reader. The measurement wavelength was set at 490 nm. Cell survival was presented as a percentage of the untreated control.
Animals.
Six-to eight weeks old BALB/C-nu and C57BL/6 mice were purchased from Shanghai Slack Laboratory Animals Co., Ltd. and Beijing Weitong Lihua Experimental Animal Technology Co., Ltd. Animal certification numbers were SCXK (Shanghai) 2012–0002, SCXK (Shanghai) 2017–0005 and SCXK (Jilin) 2016–0011. Animals were kept in isolator cages in a pathogen-free facility. All animal experiments were approved by the Scientific Investigation Board of Science & Technology of Jilin Province and Animal Ethics Committee of the School of Life Sciences of Jilin University (No. 2016SY1002). All experimental procedures were conducted in accordance with the Guidelines on Humane Treatment of Laboratory Animals and procedures for the care and use of laboratory animals.
Cell apoptosis assay.
1×10⁴ MEF cells underwent CNP transfection and were harvested after 24 hours. Treatment of non-CNP MEF cells with 0.5 mM hydrogen peroxide was used as a positive control. All cells were washed twice with pre-cooled PBS and apoptosis was measured using the Annexin V-FITC Apoptosis Detection Kit (Invitrogen) according to the manufacturer’s protocol. Briefly, the washed cells were re-suspended in 195 μl binding buffer and mixed with 5 μl of Annexin V-FITC at room temperature for 10 min. The cells were then centrifuged down at 1000g for 5 minutes and washed with binding buffer. The suspended cell solutions were then mixed with 10 μl propidium iodide (20 μg/ml) for 10 min in the dark. The stained cells were analyzed by flow cytometer (EPICS XL, Beckman Coulter) using FL1 (FITC) and FL3 (ECD) channels, respectively. A total of 10,000 cell counts were collected per sample.
Western blotting.
Electrophoresis of protein samples was performed in 10% SDS-polyacrylamide gels transferred onto a PVDF membrane. The membranes were blocked with 5% nonfat milk in Tris-buffered saline solution (TBS, 150 mM NaCl, 20 mM Tris-HCl, pH = 7.4) and incubated with primary antibodies in TBS, 0.05% Tween 20, overnight at 4 °C. After washing, the blots were reacted with secondary antibodies for 45 minutes and developed using the enhanced chemiluminescence (ECL) detection system. Anti-Calnexin rabbit polyclonal antibody (Cat.#. AF5362), anti-GAPDH rabbit polyclonal antibody (Cat.#. AF7021) were purchased from Affinity Biosciences. Anti-Cytochrome C mouse monoclonal antibody (Cat.#. ab110325), anti-Ascl1 rabbit polyclonal antibody (Cat.#. ab74065), anti-Brn-2 rabbit polyclonal antibody (Cat. #. ab137469), anti-Myt1l rabbit polyclonal antibody (Cat. #. ab139732), anti-CD9 rabbit polyclonal antibody (Cat. #. ab92726), anti-CD63 rabbit polyclonal antibody (Cat. #. ab217345), anti-TSG101 rabbit polyclonal antibody (Cat. #. ab30871), anti-P53 mouse monoclonal antibody (Cat. #. ab26), anti-TSAP6 rabbit polyclonal antibody (Cat. #. ab151566) were purchased from Abcam. Anti-PTEN rabbit polyclonal antibody (Cat.#. 95525) was obtained from Cell Signaling. Anti-Rab27a sheep polyclonal antibody (Cat. #. PA5–47907) was purchased from Thermo Fisher.
In vivo toxicity and Immunogenicity assays.
In vivo toxicity assay measuring ALT, AST, BUN, and creatinine in the serum of wild type C57BL/6 mice after systemic delivery of EVs was performed using the detection kit per manufacturer’s instructions (Roche). Serum levels of IL-6 and TNFα in mice after injecting EVs were measured by the IL-6 and TNFα ELISA kits (Thermo Fisher Scientific), respectively.
Animal surgery and tumour implantation.
Mice (BALB/c-nu or C57BL/6 6–8 weeks old, male) were anesthetized by intraperitoneal injection of 10% chloral hydrate and immobilized in the stereotactic apparatus. After anesthesia, dexamethasone (2 mg/kg) and buprenorphine (0.2 mg/kg) were subcutaneously administered to reduce inflammation and pain. The head was shaved and the skull exposed. A circular craniotomy (diameter: 3~4 mm) was performed with a surgical drill above the somatosensory cortex. Tumour cells (1×10⁸, U87-Luc tumour cells for BALB/c-nu mice, GL261-Luc tumour cells for C57BL/6 mice) were pressure injected into the cortex approximately 800 μm below the surface with a 32-gauge needle using micromanipulators at a rate of 0.1 μl/min using the following coordinates (the position of the injection is the caudate nucleus): 0.5 mm anterior and 1.5 mm lateral to the bregma, at a depth of 3.0 mm from the brain surface. Following implantation, a round glass coverslip (diameter: 5 mm) was glued onto the surrounding craniectomy site and then further fixed with a dental cement. Body temperature was monitored by a rectal probe and maintained at 37°C by a heating blanket (Homeothermic blanket systems, Harvard Apparatus). Dexamethasone (s.c., 2 mg/kg) and buprenorphine (s.c., 0.2 mg/kg) were administered once daily for one week to reduce post-surgical inflammation and pain. The animals were first imaged 14 days after tumour implantation and experiments were performed only if the physiological variables remained within normal limits.
IVIS imaging.
BALB/C-nu or C57BL/6 mice were used to study the in vivo targeting and biodistribution of exosomes separately. Fourteen days after tumour implantation (1×10⁸, U87-Luc tumour cells for BALB/c-nu mice, GL261-Luc tumour cells for C57BL/6 mice), the tumour was confirmed under fluorescence microscopy. PKH26-labeled Exos, Exo-Ts and TurboFect in vivo transfection (Turbo) or PEG-liposome were injected intravenously through the tail vein. One hour and 4 hours post-injection, the mice were anesthetized by 10% chloral hydrate and recorded by IVIS Spectrum (PerkinElmer, Waltham, America). After 4 hours, the mice were sacrificed, and major organs, including the brain, liver, lung, spleen, heart and kidney were collected. The fluorescence signals of PKH26 were captured and analyzed.
Two-photon imaging.
Mice (BALB/c-nu or C57BL/6, 6–8 weeks old, male) were anesthetized by the intraperitoneal injection of 3% chloral hydrate and immobilized in the custom-made stereotactic apparatus under the objective. Saline, nanoparticles (NPs) and EVs were mixed with PKH26 linker kits (Sigma-Aldrich) in a ratio of 1:1, and the mixture was immediately injected intravenously into the four different groups: PBS, NPs (Turbo for BALB/c-nu mice and Liposome for C57BL/6 mice), exosomes and Exo-Ts; (n=3 per group). The upright laser scanning microscope (BX61WI, Olympus) attached to a Ti: sapphire pulsed laser system (80 MHz repetition rate, <100 fs pulse width, Spectra Physics) and software (Prairie view 5.4, Bruker) was used to track and measure the distribution of saline, NPs and EVs within the tumour area at different times after injection: 1h, 4h, 8h, and 24h. 20x water immersion (NA, 1.00; WD, 2 mm, Olympus), and 40x water-immersion objectives (NA 0.80, WD; 3.3 mm, Olympus) were chosen for fluorescence imaging in vivo., 890-nm irradiation wavelength was used to excite U87-Luc (or Gl261-Luc) and PKH26 red fluorescence, and emission light was differentiated and collected with 525/50 and 595/500 filters, respectively. The average laser power for imaging was less than 50 mW.
In vivo tumor treatment assays.
Ten days after implantation, establishment of intracranial tumours was confirmed using bioluminescence imaging. The mice were randomly divided into five groups, treated with saline, Exo, Exo-T, E Exo-T, or Turbo (or Liposome). Treatments were administered via the tail vein injections once every three days at a dose of 1012 exosomes. Exosomes from MEFs were used for the U87 animal model and exosomes from BMDCs were used for the GL261 animal model. The fluorescence signals of luciferase were captured and analyzed at 3, 6, 9, and 12days. The survival time of each mouse in each group was recorded and survival curve was drawn using Kaplan-Meier method.
Histology and Immunohistochemistry (IHC) analysis.
All slides were deparaffinized in xylene for 10 minutes three times and rehydrated through graded ethanol. Antigen retrieval and immunostaining was performed as described previously22 using a Vector M.O.M. Basic Kit. Briefly, antigen retrieval was carried out using 10 mM citrate buffer (pH = 6.0). Slides were incubated in 0.3% hydrogen peroxide for 30 minutes to quench the activity of endogenous horseradish peroxidase and then blocked with TBST/5% normal goat serum. The primary antibody against PTEN or Ki-67 was used at 1:1000 dilution. We performed histological analyses on the other normal organs, including liver, lung, heart, spleen, and kidney, using H&E staining. The intensities of PTEN and Ki67 in various groups were analyzed using Image J software as previously described.49
Statistical analysis.
Data are shown as mean ± s.e.m. of triplicates unless otherwise indicated. Statistical analysis was performed using a two-tailed Student’s t-test or one-way ANOVA with post-hoc tests, as appropriate. A P-value less than 0.05 was designated statistically significant. Statistical analysis was performed with GraphPad Prism 7 software. No animals were excluded from the analysis.
Reporting summary.
Further information on research design is available in the Nature Research Reporting Summary linked to this article.
Supplementary Material
Acknowledgements
This work was partially supported by the National Science Foundation of US (EEC-0914790) (L.J.L), the National Natural Science Foundation of China (No. 81502999) (L.T.), (No. 81773758) (T.L.), the National Heart, Lung, and Blood Institute (R01HL132355) (J.O.), the National Institute of Neurological Disorders and Stroke Grant (R01 NS104315) (B.Y.S.K.), the Cancer Prevention and Research Institute of Texas CPRIT RR180017 (W.J.), the American Brain Tumor Association (DG1900021), and the National Cancer Institute (K08 CA241070) (W.J.). We would like to acknowledge Mr. John Perrino (Stanford University) for TEM imaging, which was supported, in part, by the National Center for Research Resources (1S10RR026780-01). This work’s contents are solely the responsibility of the authors and do not necessarily represent the official views of the NCRR or the National Institutes of Health. The authors thank Mr. Dave Hollingshead at Nanotech West Lab, the Ohio State University for assisting with CNP device fabrication, Dr. Xinrui Huang (Department of Biophysics, Peking University) for providing critical help on Cryo-TEM imaging, and Dr. Fanchao Meng (School of Life Sciences, Jilin University) for exosome preparation and confocal microscopy. We would also like to thank Dr. Ai Lin Chun of Science Storylab and Dr. Jonathan Feinberg of UT Southwestern Medical Center for their editorial services.
Footnotes
Data availability. The datasets generated and analysed during the study are publicly available at http://osf.io/byahe (Open Science Framework) and can also be requested from the corresponding authors.
Competing interests
The authors declare no competing interests.
Publisher’s note: Springer Nature remains neutral with regard to jurisdictional claims in published maps and institutional affiliations.
References
- 1.Fraietta JA et al. Disruption of TET2 promotes the therapeutic efficacy of CD19-targeted T cells. Nature 558, 307–312 (2018). [DOI] [PMC free article] [PubMed] [Google Scholar]
- 2.Borducchi EN et al. Ad26/MVA therapeutic vaccination with TLR7 stimulation in SIV-infected rhesus monkeys. Nature 540, 284–287 (2016). [DOI] [PMC free article] [PubMed] [Google Scholar]
- 3.Dickson D UK scientists test liposome gene therapy technique. Nature 365, 4 (1993). [DOI] [PubMed] [Google Scholar]
- 4.Lam FC et al. Enhanced efficacy of combined temozolomide and bromodomain inhibitor therapy for gliomas using targeted nanoparticles. Nature communications 9, 1991 (2018). [DOI] [PMC free article] [PubMed] [Google Scholar]
- 5.Sun T et al. Closed-loop control of targeted ultrasound drug delivery across the blood-brain/tumor barriers in a rat glioma model. Proceedings of the National Academy of Sciences of the United States of America 114, E10281–E10290 (2017). [DOI] [PMC free article] [PubMed] [Google Scholar]
- 6.Singh A et al. Multifunctional Photonics Nanoparticles for Crossing the Blood-Brain Barrier and Effecting Optically Trackable Brain Theranostics. Advanced functional materials 26, 7057–7066 (2016). [DOI] [PMC free article] [PubMed] [Google Scholar]
- 7.Erel-Akbaba G et al. Radiation-Induced Targeted Nanoparticle-Based Gene Delivery for Brain Tumor Therapy. ACS nano 13, 4028–4040 (2019). [DOI] [PMC free article] [PubMed] [Google Scholar]
- 8.Alvarez-Erviti L et al. Delivery of siRNA to the mouse brain by systemic injection of targeted exosomes. Nature biotechnology 29, 341–345 (2011). [DOI] [PubMed] [Google Scholar]
- 9.Kamerkar S et al. Exosomes facilitate therapeutic targeting of oncogenic KRAS in pancreatic cancer. Nature 546, 498–503 (2017). [DOI] [PMC free article] [PubMed] [Google Scholar]
- 10.Andaloussi SE, Mager I, Breakefield XO & Wood MJ Extracellular vesicles: biology and emerging therapeutic opportunities. Nature reviews. Drug discovery 12, 347–357 (2013). [DOI] [PubMed] [Google Scholar]
- 11.Squadrito ML, Cianciaruso C, Hansen SK & De Palma M EVIR: chimeric receptors that enhance dendritic cell cross-dressing with tumor antigens. Nature methods 15, 183–186 (2018). [DOI] [PMC free article] [PubMed] [Google Scholar]
- 12.Yeo RW et al. Mesenchymal stem cell: an efficient mass producer of exosomes for drug delivery. Advanced drug delivery reviews 65, 336–341 (2013). [DOI] [PubMed] [Google Scholar]
- 13.Stewart MP et al. In vitro and ex vivo strategies for intracellular delivery. Nature 538, 183–192 (2016). [DOI] [PubMed] [Google Scholar]
- 14.Usman WM et al. Efficient RNA drug delivery using red blood cell extracellular vesicles. Nature communications 9 (2018). [DOI] [PMC free article] [PubMed] [Google Scholar]
- 15.Kojima R et al. Designer exosomes produced by implanted cells intracerebrally deliver therapeutic cargo for Parkinson’s disease treatment. Nature communications 9 (2018). [DOI] [PMC free article] [PubMed] [Google Scholar]
- 16.Wang Q et al. ARMMs as a versatile platform for intracellular delivery of macromolecules. Nature communications 9 (2018). [DOI] [PMC free article] [PubMed] [Google Scholar]
- 17.Boukany PE et al. Nanochannel electroporation delivers precise amounts of biomolecules into living cells. Nature nanotechnology 6, 747–754 (2011). [DOI] [PubMed] [Google Scholar]
- 18.Gallego-Perez D et al. Topical tissue nano-transfection mediates non-viral stroma reprogramming and rescue. Nature nanotechnology 12, 974–979 (2017). [DOI] [PMC free article] [PubMed] [Google Scholar]
- 19.Valadi H et al. Exosome-mediated transfer of mRNAs and microRNAs is a novel mechanism of genetic exchange between cells. Nature cell biology 9, 654–659 (2007). [DOI] [PubMed] [Google Scholar]
- 20.Tricarico C, Clancy J & D’Souza-Schorey C Biology and biogenesis of shed microvesicles. Small GTPases 8, 220–232 (2017). [DOI] [PMC free article] [PubMed] [Google Scholar]
- 21.Khushman M et al. Exosomal Markers (CD63 and CD9) Expression Pattern Using Immunohistochemistry in Resected Malignant and Nonmalignant Pancreatic Specimens. Pancreas 46, 782788 (2017). [DOI] [PMC free article] [PubMed] [Google Scholar]
- 22.Yang Z et al. Functional exosome-mimic for delivery of siRNA to cancer: in vitro and in vivo evaluation. Journal of controlled release : official journal of the Controlled Release Society 243, 160–171 (2016). [DOI] [PubMed] [Google Scholar]
- 23.Sako Y, Minoghchi S & Yanagida T Single-molecule imaging of EGFR signalling on the surface of living cells. Nature cell biology 2, 168–172 (2000). [DOI] [PubMed] [Google Scholar]
- 24.Lee LJ et al. Extracellular mRNA Detected by Tethered Lipoplex Nanoparticle Biochip for Lung Adenocarcinoma Detection. American journal of respiratory and critical care medicine 193, 1431–1433 (2016). [DOI] [PMC free article] [PubMed] [Google Scholar]
- 25.Savina A, Furlan M, Vidal M & Colombo MI Exosome release is regulated by a calcium-dependent mechanism in K562 cells. The Journal of biological chemistry 278, 20083–20090 (2003). [DOI] [PubMed] [Google Scholar]
- 26.Messenger SW, Woo SS, Sun Z & Martin TFJ A Ca2+-stimulated exosome release pathway in cancer cells is regulated by Munc13–4. The Journal of Cell Biology 217, 2877–2890 (2018). [DOI] [PMC free article] [PubMed] [Google Scholar]
- 27.Muller L, Schaupp A, Walerych D, Wegele H & Buchner J Hsp90 regulates the activity of wild type p53 under physiological and elevated temperatures. The Journal of biological chemistry 279, 48846–48854 (2004). [DOI] [PubMed] [Google Scholar]
- 28.Walerych D et al. Hsp70 molecular chaperones are required to support p53 tumor suppressor activity under stress conditions. Oncogene 28, 4284–4294 (2009). [DOI] [PubMed] [Google Scholar]
- 29.Yu X, Harris SL & Levine AJ The Regulation of Exosome Secretion: a Novel Function of the p53 Protein. Cancer Research 66, 4795–4801 (2006). [DOI] [PubMed] [Google Scholar]
- 30.Lespagnol A et al. Exosome secretion, including the DNA damage-induced p53-dependent secretory pathway, is severely compromised in TSAP6/Steap3-null mice. Cell Death & Differentiation 15, 1723–1733 (2008). [DOI] [PubMed] [Google Scholar]
- 31.Ricklefs FL et al. Immune evasion mediated by PD-L1 on glioblastoma-derived extracellular vesicles. Science advances 4, eaar2766 (2018). [DOI] [PMC free article] [PubMed] [Google Scholar]
- 32.Zhang Y et al. Hypothalamic stem cells control ageing speed partly through exosomal miRNAs. Nature 548, 52–57 (2017). [DOI] [PMC free article] [PubMed] [Google Scholar]
- 33.Zhang L et al. Microenvironment-induced PTEN loss by exosomal microRNA primes brain metastasis outgrowth. Nature 527, 100–104 (2015). [DOI] [PMC free article] [PubMed] [Google Scholar]
- 34.Hergenreider E et al. Atheroprotective communication between endothelial cells and smooth muscle cells through miRNAs. Nature cell biology 14, 249–256 (2012). [DOI] [PubMed] [Google Scholar]
- 35.Wei Z et al. Coding and noncoding landscape of extracellular RNA released by human glioma stem cells. Nature communications 8, 1145 (2017). [DOI] [PMC free article] [PubMed] [Google Scholar]
- 36.Lobb RJ et al. Optimized exosome isolation protocol for cell culture supernatant and human plasma. Journal of Extracellular Vesicles 4, 27031 (2015). [DOI] [PMC free article] [PubMed] [Google Scholar]
- 37.Lee D et al. Protective effect of α-mangostin against iodixanol-induced apoptotic damage in LLC-PK1 cells. Bioorganic & Medicinal Chemistry Letters 26, 3806–3809 (2016). [DOI] [PubMed] [Google Scholar]
- 38.Mendt M et al. Generation and testing of clinical-grade exosomes for pancreatic cancer. JCI Insight 3 (2018). [DOI] [PMC free article] [PubMed] [Google Scholar]
- 39.Kao C-Y & Papoutsakis ET Extracellular vesicles: exosomes, microparticles, their parts, and their targets to enable their biomanufacturing and clinical applications. Current Opinion in Biotechnology 60, 89–98 (2019). [DOI] [PubMed] [Google Scholar]
- 40.Gallego-Perez D et al. Deterministic transfection drives efficient nonviral reprogramming and uncovers reprogramming barriers. Nanomedicine : nanotechnology, biology, and medicine 12, 399–409 (2016). [DOI] [PMC free article] [PubMed] [Google Scholar]
- 41.Wei X et al. A D-peptide ligand of nicotine acetylcholine receptors for brain-targeted drug delivery. Angewandte Chemie 54, 3023–3027 (2015). [DOI] [PubMed] [Google Scholar]
- 42.Chung EJ et al. Fibrin-binding, peptide amphiphile micelles for targeting glioblastoma. Biomaterials 35, 1249–1256 (2014). [DOI] [PMC free article] [PubMed] [Google Scholar]
- 43.Wang W, li J, Wu K, Azhati B & Rexiati M Culture and Identification of Mouse Bone MarrowDerived Dendritic Cells and Their Capability to Induce T Lymphocyte Proliferation. Medical Science Monitor 22, 244–250 (2016). [DOI] [PMC free article] [PubMed] [Google Scholar]
- 44.Lutz MB et al. An advanced culture method for generating large quantities of highly pure dendritic cells from mouse bone marrow. Journal of immunological methods 223, 77–92 (1999). [DOI] [PubMed] [Google Scholar]
- 45.Thery C, Amigorena S, Raposo G & Clayton A Isolation and characterization of exosomes from cell culture supernatants and biological fluids. Curr Protoc Cell Biol Chapter 3, Unit 3 22 (2006). [DOI] [PubMed] [Google Scholar]
- 46.Kowal J et al. Proteomic comparison defines novel markers to characterize heterogeneous populations of extracellular vesicle subtypes. Proceedings of the National Academy of Sciences of the United States of America 113, E968–977 (2016). [DOI] [PMC free article] [PubMed] [Google Scholar]
- 47.Xu Y et al. Microscopic structure of the polymer-induced liquid precursor for calcium carbonate. Nature communications 9, 2582 (2018). [DOI] [PMC free article] [PubMed] [Google Scholar]
- 48.Ross D, Gaitan M & Locascio LE Temperature measurement in microfluidic systems using a temperature-dependent fluorescent dye. Anal Chem 73, 4117–4123 (2001). [DOI] [PubMed] [Google Scholar]
- 49.Mane DR, Kale AD & Belaldavar C Validation of immunoexpression of tenascin-C in oral precancerous and cancerous tissues using ImageJ analysis with novel immunohistochemistry profiler plugin: An immunohistochemical quantitative analysis. Journal of oral and maxillofacial pathology : JOMFP 21, 211–217 (2017). [DOI] [PMC free article] [PubMed] [Google Scholar]
Associated Data
This section collects any data citations, data availability statements, or supplementary materials included in this article.