

Abstract
BACKGROUND
The hospital industry has consolidated substantially during the past two decades and at an accelerated pace since 2010. Multiple studies have shown that hospital mergers have led to higher prices for commercially insured patients, but research about effects on quality of care is limited.
METHODS
Using Medicare claims and Hospital Compare data from 2007 through 2016 on performance on four measures of quality of care (a composite of clinical-process measures, a composite of patient-experience measures, mortality, and the rate of readmission after discharge) and data on hospital mergers and acquisitions occurring from 2009 through 2013, we conducted difference-in-differences analyses comparing changes in the performance of acquired hospitals from the time before acquisition to the time after acquisition with concurrent changes for control hospitals that did not have a change in ownership.
RESULTS
The study sample included 246 acquired hospitals and 1986 control hospitals. Being acquired was associated with a modest differential decline in performance on the patient-experience measure (adjusted differential change, −0.17 SD; 95% confidence interval [CI], −0.26 to −0.07; P = 0.002; the change was analogous to a fall from the 50th to the 41st percentile) and no significant differential change in 30-day readmission rates (−0.10 percentage points; 95% CI, −0.53 to 0.34; P = 0.72) or in 30-day mortality (−0.03 percentage points; 95% CI, −0.20 to 0.14; P = 0.72). Acquired hospitals had a significant differential improvement in performance on the clinical-process measure (0.22 SD; 95% CI, 0.05 to 0.38; P = 0.03), but this could not be attributed conclusively to a change in ownership because differential improvement occurred before acquisition.
CONCLUSIONS
Hospital acquisition by another hospital or hospital system was associated with modestly worse patient experiences and no significant changes in readmission or mortality rates. Effects on process measures of quality were inconclusive. (Funded by the Agency for Healthcare Research and Quality.)
During the past two decades, the hospital industry has consolidated substantially in the United States, including a surge in mergers and acquisitions beginning in 2010.1,2 Multiple studies have shown that consolidation of the hospital market has led to higher negotiated prices with private insurers,3–6 but less is known about the effects on quality of care.
Conceptually, hospital mergers and acquisitions could lead to improvements or deterioration in quality of care.7,8 For instance, acquiring hospitals might transfer managerial, clinical, or operational expertise to the hospitals that they acquire. Or, greater scale that is achieved by a merger might improve clinical outcomes (e.g., through volume-outcome effects). Conversely, diseconomies of scale (e.g., bureaucracy) could divert resources away from investments to improve care, and consolidation could weaken competitive pressures for hospitals to provide high-quality care to attract patients or be included in insurer networks.
Previous studies have generally shown that hospitalized patients have better outcomes in more competitive hospital markets than in less competitive markets.8–12 A few studies of specific acquisitions in the 1990s and early 2000s showed unchanged or declining performance among acquired or merged hospitals on outcome measures such as mortality, readmissions, and complications, but most did not account for changes in regional determinants of quality such as local economic conditions, population characteristics, or quality-improvement initiatives by payers or collaboratives.13–18
Moreover, little is known about the effects of the more recent wave of hospital acquisitions on quality of care; these effects may be different owing to changes in the health care marketplace. First, as providers have consolidated, more recent transactions have involved larger health systems, which may have different postacquisition quality-improvement initiatives. Second, payment reforms that were enacted by the Affordable Care Act have increased the payoff from quality improvement and have accordingly been used to posit new gains from mergers and acquisitions, although empirical evidence raises questions regarding whether providers have consolidated to participate in new payment models.19 Third, information about hospital quality has become more readily available, possibly leading to enhanced quality-based competition and increased market share for high-performing hospitals; thus, weakening of competition may now be more consequential.
Using a difference-in-differences design and data from 2007 through 2016, we compared changes in performance on process, outcome, and patient-experience measures among hospitals acquired by another hospital or system from 2009 through 2013 with changes in performance among other (control) hospitals in the same states that did not have a change in ownership and were otherwise unlikely to be affected by the transactions.
Methods
STUDY POPULATION
We used 2007 to 2016 data from Irving Levin Associates on hospital mergers and acquisitions.1 For each transaction, we determined consummation dates (if different from announcement dates) from Web searches and used the categorization by Irving Levin Associates of involved hospitals as acquirers or acquired. We used a database of health systems that was constructed from several sources, including Provider Enrollment, Chain, and Ownership System and Internal Revenue Service data, to determine whether involved hospitals were part of systems and to identify member hospitals. (For details on the study population, quality measures, and the statistical analysis, see the Supplementary Appendix, available with the full text of this article at NEJM.org.) We focused on transactions consummated in the years 2009 through 2013 to analyze performance on a consistent set of measures for 2 or 3 years before and 3 or 4 years after the transaction year. We used transaction data from the full period of 2007 through 2016 to remove other hospitals acquired in 2007 and 2008 or 2014 through 2016 from the control group (detailed below). Because data on process measures were not consistently available after 2014, we limited analysis of those measures to transactions in 2009 through 2011.
Our study sample included short-term acute care hospitals with at least 25 beds and at least 100 fee-for-service Medicare admissions in each year for which performance data were available. Because data were, by definition, present for hospitals involved in transactions at least until the transaction year, for each performance measure we excluded hospitals with missing data in pretransaction years to establish consistent inclusion criteria for acquired and control hospitals (Table S1 in the Supplementary Appendix).
The primary treatment group included hospitals acquired during the period of 2009 through 2013 (including all members of acquired systems). The control group included all other hospitals that were not acquired in the period of 2007 through 2016, were not located within 5 miles of an acquired hospital (i.e., potential local competitors), and were not acquirers located in the same state as the hospitals that they acquired (i.e., in-state acquirers). We excluded local competitors and in-state acquirers from the control group to reduce potential bias from effects of diminished local competition for patients or diminished system-level competition for inclusion in insurers’ state hospital networks. (The latter effects from commercial negotiations could spill over onto care in Medicare.) In secondary analyses, we estimated the effects of acquisitions on the performance of local competitors and in-state acquirers.
We performed two subgroup analyses to evaluate whether acquisition effects were different for hospitals acquired by a hospital (or system) in the same state (61% of acquisitions) or for hospitals acquired by a hospital (or system) with high or low quality, which we defined as performance in the top or bottom quartile in the year before acquisition. Previous research has shown that acquirers are able to increase prices after same-state acquisitions20; if there is also quality competition among systems for inclusion in insurer networks, same-state transactions may cause quality to deteriorate. Conversely, acquisition by higher-performing acquirers might yield improvements.
STUDY VARIABLES
Quality Measures
Using publicly available data from Medicare Hospital Compare,21 we assessed hospital performance on clinical-process and patient-experience measures. The process measures included seven measures related to cardiac, pneumonia, and perioperative care that were consistently reported from 2007 through 2014 (Table S2). The patient-experience measures included five items from the Hospital Consumer Assessment of Healthcare Providers and Systems survey that were aggregated to the hospital level and consistently reported from 2007 through 2016 (Table S3). For each hospital in each year, we computed a composite score for the clinical-process measures and for the patient-experience measures equal to the average of z scores for each component measure with nonmissing data.
The composite measures constituted two of four prespecified primary outcomes. The other two primary outcomes were the all-cause rate of readmission within 30 days after discharge and the rate of death within 30 days after admission.
Hospital and Patient Characteristics
Using data from the Centers for Medicare and Medicaid Services Provider of Services file, we assessed the following hospital characteristics at baseline: size (number of beds), teaching status, ownership type, and location in a rural area (yes or no). Using admission-level data derived from Medicare claims and Master Beneficiary Summary Files, we computed hospital and year-specific means for total admissions for Medicare patients and the following characteristics of admitted patients: age, sex, race or ethnic group (percent non-Hispanic white), disability as the original reason for Medicare eligibility, dual eligibility for Medicare and Medicaid, Medicare diagnosis-related group payment weight,22 and number of conditions recorded in the Chronic Conditions Data Warehouse.23
STATISTICAL ANALYSIS
We used linear regression to estimate the extent to which post-transaction changes in performance for acquired hospitals differed from concurrent changes for control hospitals in the same state. Specifically, we modeled hospital performance on each outcome during the study period as a function of hospital indicators (to control for time-invariant hospital predictors of performance), the hospital-level case-mix variables described above (to control for changes in measurable patient characteristics), indicators for each state-by-year combination (to control for state-specific trends), a term to remove the transaction year from the estimation (treating it as a transition year), and terms estimating the differential change in performance for acquired hospitals from the pretransaction period to each post-transaction year. For a given post-transaction year, the differential change represents the difference between the observed performance for acquired hospitals and their expected performance if the pretransaction difference had remained unchanged in the post-transaction period (i.e., the estimated effect of acquisition). Equivalently, the model compared the average difference between acquired hospitals and control hospitals during the pretransaction period with the difference in each post-transaction year.
Because performance data were not available beyond the third post-transaction year for transactions in 2013, and because acquisition effects could grow over time, we prespecified differential changes in the third post-transaction year as our primary outcomes. We adjusted for testing of the four primary outcomes using the Hochberg procedure.24 In all analyses, we weighted observations according to the baseline bed count at each hospital. We used robust variance estimation to account for clustering within states.
We prespecified analyses to assess the plausibility of the key assumption of our difference-in-differences analysis — that the pretransaction difference between control hospitals and acquired hospitals would have remained constant in the absence of the acquisitions. First, we compared changes in outcomes between acquired hospitals and control hospitals during the pretransaction period. A significant differential change from the pretransaction period to the post-transaction period would not be clearly attributable to the transaction if a differential change in the pretransaction period presented evidence of an alternative explanation. Second, we tested for differential changes from the pretransaction period to the post-transaction period in the characteristics of patients served by acquired hospitals as compared with control hospitals, and we compared estimates of acquisition effects with and without adjustment for patient characteristics. Similar changes and minimal effects of adjustment would reduce concern regarding confounding effects of acquisitions on the mix of patients served by hospitals. In secondary analyses, we substituted local competitors or in-state acquirers for acquired hospitals in the analysis to estimate potential effects on these groups of nonacquired hospitals.
Results
STUDY SAMPLE
Our primary analysis included 246 hospitals acquired in 198 transactions and 1986 control hospitals (total, 2232 hospitals). Before acquisition, acquired hospitals were less likely than control hospitals to be publicly owned or located in a rural area but were similar in other measured characteristics (Table 1). From the pretransaction period to the third post-transaction year, differential changes in the characteristics of patients at acquired hospitals as compared with control hospitals were small (Table 2).
Table 1.
Hospital Characteristics at Baseline.*
| Characteristic | Control Hospitals (N = 1986) |
Acquired Hospitals (N = 246) |
Difference (95% CI) |
|---|---|---|---|
| Mean no. of beds | 238 | 233 | 5.2 (−21.7 to 32.0) |
| Teaching institution (%)† | 11.4 | 11.8 | −0.4 (−4.6 to 3.9)‡ |
| For profit (%) | 15.8 | 13.4 | 2.4 (−2.4 to 7.2)‡ |
| Public (%) | 23.2 | 11.4 | 11.8 (6.4 to 17.3)‡ |
| Urban (%)§ | 70.6 | 78.5 | −7.8 (−13.8 to −1.8)‡ |
| Mean no. of Medicare admissions¶ | 3201 | 2989 | 212 (−163 to 587) |
Hospital characteristics were assessed in 2008, except for urban location (assessed in 2011, when it first became available in the Centers for Medicare and Medicaid Services [CMS] Provider of Services data). CI denotes confidence interval.
Data are based on CMS Provider of Services data categorizing hospitals as having a teaching mission if they had a major affiliation with a medical school.
The difference is in percentage points.
Data are based on CMS Provider of Services data characterizing the county of the hospital as urban or rural.
Shown are total traditional Medicare admissions computed from Medicare claims data. See the Supplementary Appendix for discussion of changes in hospital admissions over time.
Table 2.
Differences in Patient Characteristics between Acquired and Control Hospitals, before and after Acquisition.*
| Characteristic | Mean in Control Hospitals† | Pretransaction Difference between Acquired and Control Hospitals (95% CI)‡ | Differential Change from Pretransaction Period to Third Post-Transaction Year (95% CI)§ |
|---|---|---|---|
| Age (yr) | 72.5 | −0.14 (−0.77 to 0.49) | −0.13 (−0.32 to −0.07) |
| Female sex (%) | 55.4 | 0.15 (−0.76 to 1.05) | −0.11 (−0.49 to 0.26) |
| Non-Hispanic white race or ethnic group (%)¶ | 75.2 | −1.90 (−4.76 to 0.96) | −0.33 (−0.72 to 0.06) |
| Dually enrolled in Medicaid (%) | 30.7 | 2.08 (0.15 to 4.00) | 0.27 (−0.53 to 1.08) |
| Disability as original reason for Medicare eligibility (%) | 33.6 | 1.17 (−0.62 to 2.95) | 0.27 (−0.27 to 0.80) |
| Chronic conditions (no.)‖ | 8.2 | 0.05 (−0.08 to 0.18) | −0.01 (−0.05 to 0.03) |
| DRG payment weight** | 1.6 | −0.02 (−0.04 to 0.01) | 0.00 (−0.02 to 0.02) |
Hospital-level observations were weighted according to count of hospital beds. Pretransaction differences and differential changes were adjusted for hospital, year, and state-by-year fixed effects. Pretransaction differences and differential changes in female sex, non-Hispanic white race or ethnic group, dual enrollment in Medicaid, and disability as the original reason for Medicare eligibility are in percentage points.
The mean of patient characteristics for control hospitals was calculated in 2011 (i.e., at the midpoint of the study period).
Pretransaction differences reflect the mean for acquired hospitals minus the mean for control hospitals. For example, the mean age of patients was 0.14 years lower in acquired hospitals than in control hospitals.
Negative values for differential change indicate that the change from the pretransaction period to the third post-transaction year for acquired hospitals was less than the change for control hospitals. For example, the mean age differentially decreased by 0.13 years in acquired hospitals relative to control hospitals.
Race and ethnic group were determined from Medicare enrollment files with the use of the Research Triangle Institute-modified race code.
The number of a patient’s chronic conditions was computed from data in the Chronic Conditions Data Warehouse.
Shown is the average diagnosis-related group (DRG) payment weight for the admissions at each hospital computed from claims.
PRETRANSACTION TRENDS
During the pretransaction period, trends in patient experiences and mortality rates did not differ significantly between acquired hospitals and control hospitals. Trends in readmission rates also did not differ significantly after an initial differential improvement among acquired hospitals, but relative to the control hospitals, performance on clinical-process measures at acquired hospitals differentially improved progressively during the pretransaction years (Fig. 1 and Tables S4 and S5).
Figure 1. Differences in Performance between Acquired Hospitals and Control Hospitals before and after Acquisition.
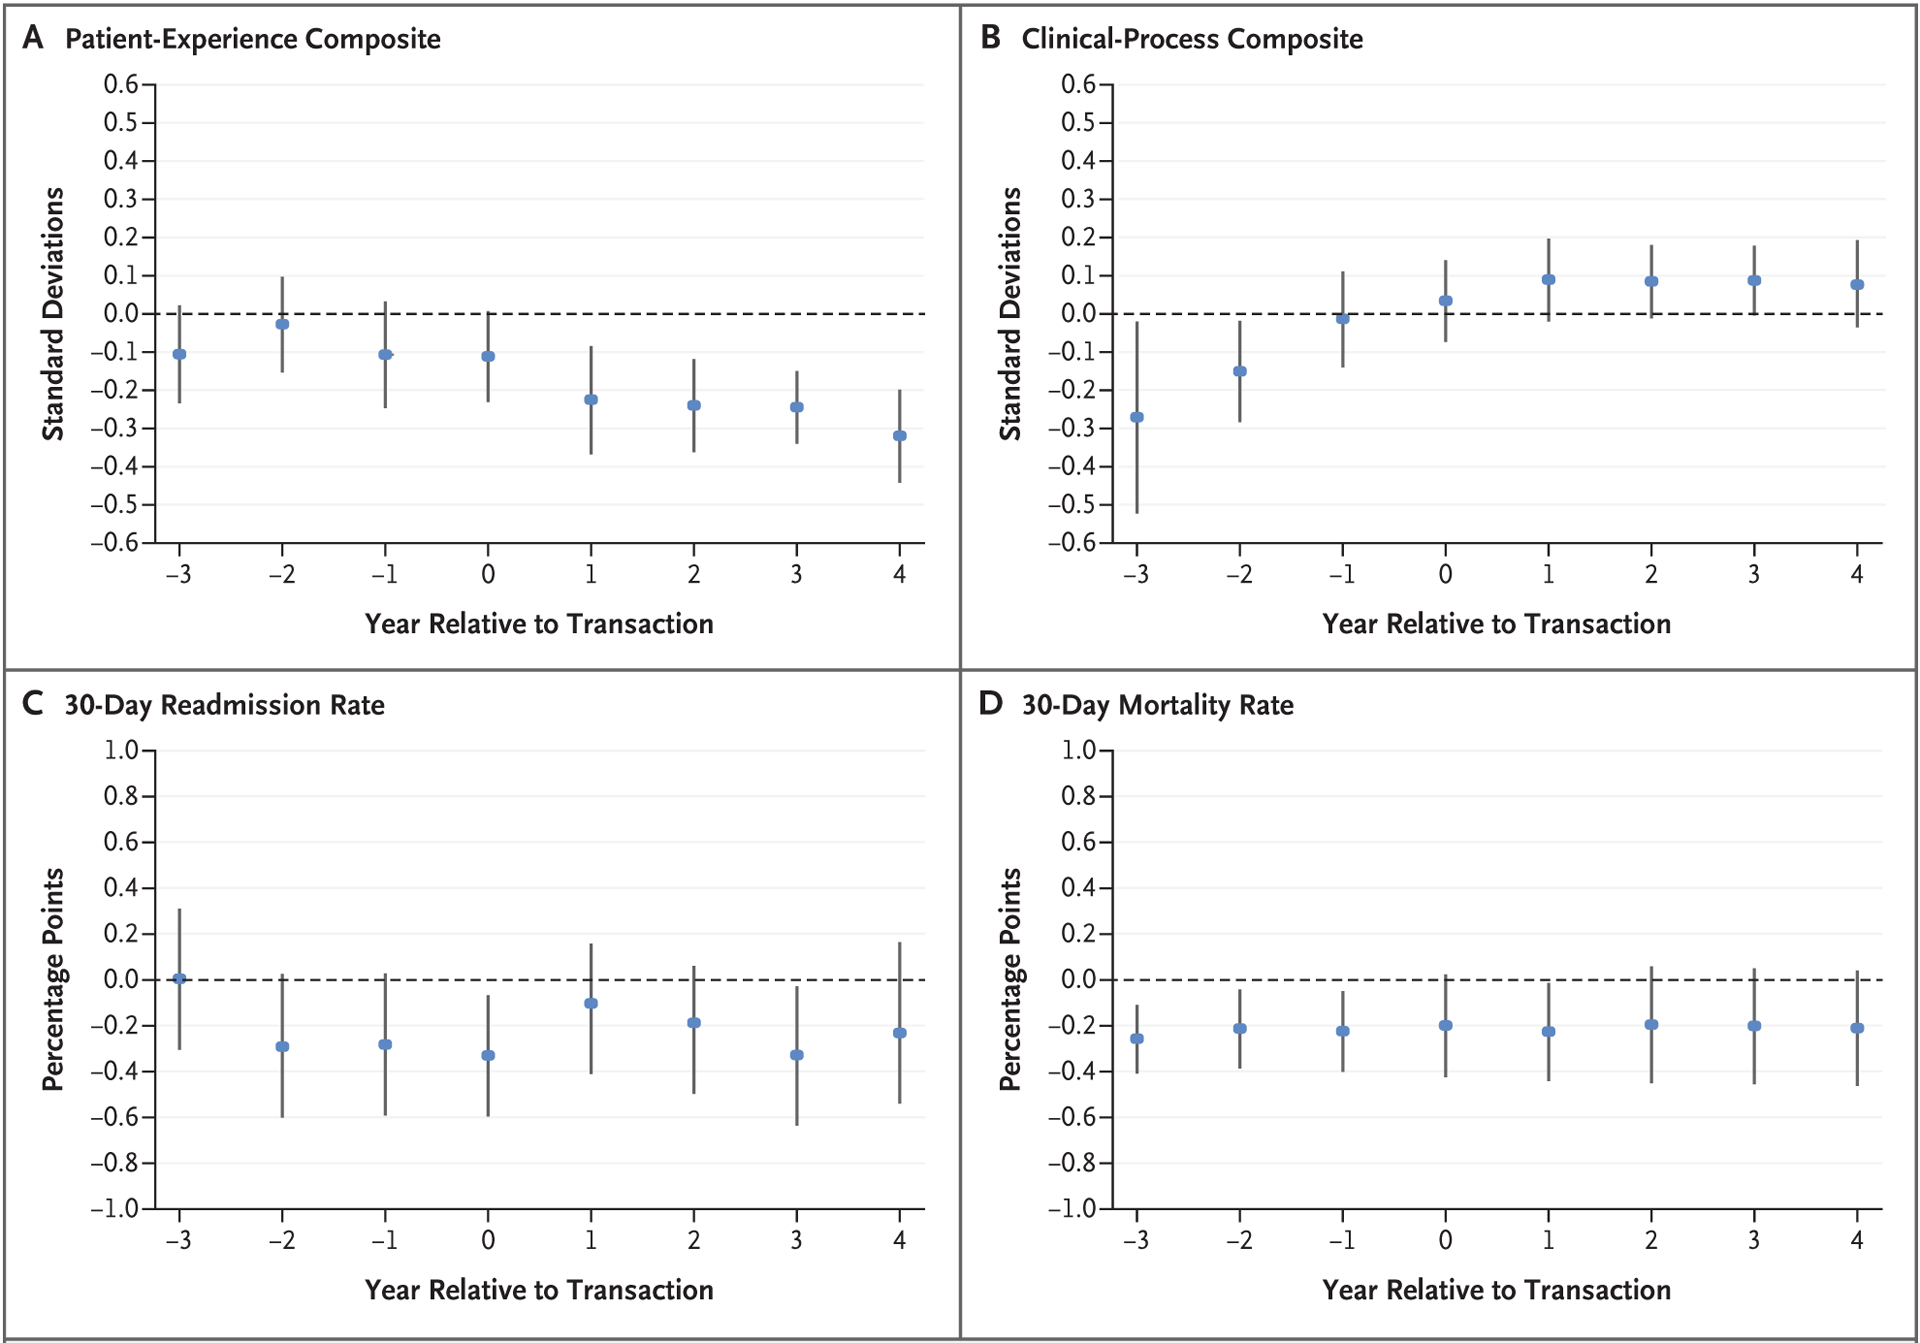
The difference in adjusted performance between acquired hospitals and control hospitals is plotted for each year relative to the transaction year, with error bars denoting 95% confidence intervals.
DIFFERENTIAL CHANGES IN PERFORMANCE ASSOCIATED WITH ACQUISITION
Acquisition was associated with a progressive differential decline in performance on the patient-experience measure during the post-transaction period (Fig. 1 and Table S6). By the third post-transaction year (Table 3), the adjusted differential change in the composite score was −0.17 SD (95% confidence interval [CI], −0.26 to −0.07; P = 0.002). This decline is analogous to a fall from the 50th percentile to the 41st percentile in the distribution of performance among control hospitals and was consistent across the component measures of the patient-experience composite (Table S7).
Table 3.
Differential Changes in Performance 3 Years Post-Transaction for Acquired Hospitals as Compared with Control Hospitals.*
| Performance Measure | No. of Hospital-Yr | Mean in Control Hospitals† | Pretransaction Difference between Acquired and Control Hospitals (95% CI)‡ | Differential Change from Pretransaction Period to Third Post-Transaction Year (95% CI) | P Value§ |
|---|---|---|---|---|---|
| standard deviations | |||||
| Patient-experience composite | 24,435 | — | −0.12 (−0.24 to −0.01) | −0.17 (−0.26 to −0.07)¶ | 0.002 |
| Clinical-process composite | 18,734 | — | −0.17 (−0.32 to −0.02) | 0.22 (0.05 to 0.38) | 0.03 |
| percent | percentage points | ||||
| Rate of death within 30 days after admission | 25,999 | 6.49±1.31 | −0.17 (−0.36 to 0.03) | 0.03 (−0.20 to 0.14) | 0.72 |
| Rate of readmission within 30 days after discharge | 25,999 | 16.56±2.41 | −0.23 (−0.63 to 0.16) | −0.10 (−0.53 to 0.34) | 0.72 |
Plus-minus values are means ±SD. Hospital-level observations were weighted according to count of hospital beds measured in the year before the transaction for acquired hospitals and in 2011 for control hospitals. Pretransaction differences and differential changes were adjusted for patient characteristics and hospital, year, state-by-year, and hospital-characteristic-by-year fixed effects.
Means in control hospitals were calculated in 2011. Means for z scores across all hospitals are equal to zero by design; thus, mean z scores for control hospitals are close to zero, not informative, and not reported. See Tables S2 and S3 for 2008 means of raw scores for each item.
Negative values for pretransaction differences between acquired hospitals and control hospitals indicate that acquired hospitals had lower performance than control hospitals in the pretransaction period.
P values have been adjusted for multiple comparisons. See Table S10 for details.
A 0.17-SD decrease in the patient-experience measure is analogous to a fall from the 50th to the 41st percentile in the performance distribution of control hospitals.
Acquisition was not associated with significant differential changes in 30-day readmission or mortality rates by the third post-transaction year (Fig. 1 and Table 3). Performance on clinical-process measures by acquired hospitals differentially improved from the pretransaction period to the third post-transaction year (adjusted differential change in the composite score, 0.22 SD; 95% CI, 0.05 to 0.38; P = 0.03), but this finding is inconclusive because the differential improvement occurred almost entirely during the pretransaction period (Fig. 1 and Tables S4 and S5).
SENSITIVITY, SUBGROUP, AND SECONDARY ANALYSES
Estimates were similar with and without adjustment for patient characteristics or weighting according to hospital size (Tables S8 and S9). Subgroup analyses suggested that the differential decline in performance on the patient-experience measure was driven largely by acquisitions involving acquirers with low baseline performance (Table S11). Estimated effects of acquisition by in-state acquirers were similar to our main results (Table S12). In secondary analyses, transactions were not associated with differential changes in performance among 391 in-state acquirers or 142 local competitors on any measure except for a postacquisition decline in performance on process measures among in-state acquirers (Tables S13 and S14).
DISCUSSION
Hospital mergers and acquisitions from 2009 through 2013 were associated with modest deterioration in performance on patient-experience measures and no detectable changes in readmission or mortality rates at acquired hospitals. Effects on performance on clinical-process measures at acquired hospitals were inconclusive. Taken together, these findings provide no evidence of quality improvement attributable to changes in ownership. Our findings corroborate and expand on previous research on hospital mergers and acquisitions in the 1990s and early 2000s and are consistent with a recent finding that increased concentration of the hospital market has been associated with worsening patient experiences.25
The modest decline in performance on the patient-experience measure among acquired hospitals was not a continuation of preexisting trends, was not explained by changes in the patient populations at hospitals, and is consistent with expectations that some acquired hospitals face less competition after acquisition. Because patient experiences, by definition, constitute aspects of quality that are observable to patients, they may be particularly affected by weakened competitive pressures for hospitals to attract patients. By comparison, hospital performance on clinical-process measures or on outcomes such as readmission rates may be less observable to patients and thus less sensitive to the competitive landscape.26
However, we did not find evidence of spillover effects on patient-experience measures at nearby rival hospitals or evidence of a decline in performance among hospitals that acquired hospitals in the same state, as might be expected if acquisitions reduced system-level competition to be included in insurer networks on the basis of quality of care. Nevertheless, we cannot rule out reduced local competition from merging rivals as the cause of diminished performance on patient-experience measures at acquired hospitals, even if other nearby hospitals were unaffected.
Other subgroup analyses — although exploratory — suggest that management or staffing practices that may have been responsible for worse patient experiences at low-performing acquirers may have spread to acquired hospitals. Evidence of acquisitions facilitating the diffusion of poor quality, however, does not rule out mechanisms related to hospital market structure. For example, name recognition of dominant hospital systems might allow erosion of dimensions of quality among member hospitals without compromising patient demand. We did not find a symmetric benefit from acquisitions by high-quality acquirers.
Another potential explanation for the decline in performance on patient-experience measures is a diversion of resources toward integration. However, such integration costs would presumably be transient, and we found steady declines in performance on patient-experience measures over a period of 4 post-transaction years. Ultimately, we could not isolate the mechanisms explaining our results.
From the pretransaction period to the post-transaction period, performance on clinical-process measures differentially improved among acquired hospitals, but this improvement cannot be interpreted conclusively as merger-induced because substantial differential improvement occurred before acquisition. One potential explanation is that other determinants of process improvement (e.g., public reporting) had a greater effect on acquired hospitals because they had lower initial scores on process measures and were thus less subject to ceiling effects (hospital performance on process measures was close to the maximum).
The improvements in performance on process measures are additionally challenging to interpret because measurement of the provision of specific treatments or services — unlike patient-reported experiences and outcomes such as mortality — is susceptible to changes in provider reporting or documentation that might follow from changes in management or reimbursement.27 Moreover, improved performance on process measures may not translate into improved clinical outcomes.28
Our study had several limitations. First, our results reflect average effects of mergers and acquisitions, which might obscure the benefits or harms of some transactions. Second, we could not rule out the possibility of spillover effects of mergers and acquisitions on control hospitals, which would attenuate estimates of acquisition effects. However, our control group excluded nearby hospitals and in-state acquirers, we detected no effects of transactions on these groups, and remaining control hospitals located in the same state as an acquired hospital would be expected to be less affected by weakened competition. Third, we did not attempt to quantify the relative competitive significance of each transaction and thus could not ascertain whether quality reductions were larger when merging hospitals were stronger premerger rivals.
Fourth, although we examined a broad set of quality measures, we were unable to study all dimensions of quality. Fifth, difference-in-differences analyses in which exposure to treatment is voluntary are subject to potential selection bias. In our study, the quality of care at hospitals that were acquired may have deteriorated (or improved) more than at control hospitals in the absence of acquisition. Deteriorating (or improving) quality may have even motivated acquisition in some cases. However, we would have expected such selection to manifest in the pretransaction period. With the exception of the process measures, we did not find evidence of differences in pretransaction trends that would suggest alternative explanations for our results.
Hospital mergers and acquisitions were associated with modest deterioration in patient experiences, small and nonsignificant changes in readmission and mortality rates, and inconclusive effects on performance on clinical-process measures. These findings challenge arguments that hospital consolidation, which is known to increase prices, also improves quality.
Supplementary Material
Acknowledgments
Supported by a grant (U19HS024072) from the Agency for Healthcare Research and Quality.
Footnotes
Disclosure forms provided by the authors are available with the full text of this article at NEJM.org.
The content of this article is solely the responsibility of the authors and does not necessarily represent the official views of the Agency for Healthcare Research and Quality.
REFERENCES
- 1.Health care services acquisition report. Norwalk, CT: Irving Levin Associates, 2007–2016. (https://www.levinassociates.com/). [Google Scholar]
- 2.Fulton BD. Health care market concentration trends in the United States: evidence and policy responses. Health Aff (Millwood) 2017; 36: 1530–8. [DOI] [PubMed] [Google Scholar]
- 3.The impact of hospital consolidation — update. Princeton, NJ: Robert Wood Johnson Foundation, June 2012. [Google Scholar]
- 4.Gaynor M, Ho K, Town RJ. The industrial organization of health-care markets. J Econ Lit 2015; 53: 235–84. [Google Scholar]
- 5.Cooper Z, Craig SV, Gaynor M, Van Reenen J. The price ain’t right? Hospital prices and health spending on the privately insured. Q J Econ 2019; 134: 51–107. [DOI] [PMC free article] [PubMed] [Google Scholar]
- 6.Dafny L. Estimation and identification of merger effects: an application to hospital mergers. J Law Econ 2009; 52: 523–50. [Google Scholar]
- 7.Dafny LS, Lee TH. The good merger. N Engl J Med 2015; 372: 2077–9. [DOI] [PubMed] [Google Scholar]
- 8.Bloom N, Propper C, Seiler S, Van Reenen J. The impact of competition on management quality: evidence from public hospitals. Rev Econ Stud 2015; 82: 457–89. [Google Scholar]
- 9.Kessler DP, McClellan MB. Is hospital competition socially wasteful? Q J Econ 2000; 115: 577–615. [Google Scholar]
- 10.Cutler DM, Huckman RS, Kolstad JT. Input constraints and the efficiency of entry: lessons from cardiac surgery. Am Econ J Econ Policy 2010; 2: 51–76. [Google Scholar]
- 11.Cooper Z, Gibbons S, Jones S, McGuire A. Does hospital competition save lives? Evidence from the English NHS patient choice reforms. Econ J (London) 2011; 121: F228–F26. [DOI] [PMC free article] [PubMed] [Google Scholar]
- 12.Gaynor M, Moreno-Serra R, Propper C. Death by market power: reform, competition, and patient outcomes in the National Health Service. Am Econ J Econ Policy 2013; 5: 134–66. [Google Scholar]
- 13.Ho V, Hamilton BH. Hospital mergers and acquisitions: does market consolidation harm patients? J Health Econ 2000; 19: 767–91. [DOI] [PubMed] [Google Scholar]
- 14.Mutter RL, Romano PS, Wong HS. The effects of US hospital consolidations on hospital quality. Int J Econ Bus 2011; 18: 109–26. [Google Scholar]
- 15.Hayford TB. The impact of hospital mergers on treatment intensity and health outcomes. Health Serv Res 2012; 47: 1008–29. [DOI] [PMC free article] [PubMed] [Google Scholar]
- 16.Capps CS. The quality effects of hospital mergers. Washington, DC: Department of Justice, Antitrust Division, 2005. [Google Scholar]
- 17.Romano PS, Balan DJ. A retrospective analysis of the clinical quality effects of the acquisition of Highland Park Hospital by Evanston Northwestern Healthcare. Int J Econ Bus 2011; 18: 45–64. [Google Scholar]
- 18.Neprash HT, McWilliams JM. Provider consolidation and potential efficiency gains: a review of theory and evidence. Antitrust Law J 2019; 82: 551–78. [Google Scholar]
- 19.Neprash HT, Chernew ME, McWilliams JM. Little evidence exists to support the expectation that providers would consolidate to enter new payment models. Health Aff (Millwood) 2017;36:346–54. [DOI] [PMC free article] [PubMed] [Google Scholar]
- 20.Dafny L, Ho K, Lee RS. The price effects of cross-market mergers: theory and evidence from the hospital industry. Rand J Econ 2019;50:286–325. [Google Scholar]
- 21.Medicare.gov. Hospital Compare data-sets. Baltimore: Centers for Medicare & Medicaid Services; (https://data.medicare.gov/data/hospital-compare). [Google Scholar]
- 22.Case mix index. Baltimore: Centers for Medicare & Medicaid Services, 2019. (https://www.cms.gov/Medicare/Medicare-Fee-for-Service-Payment/AcuteInpatientPPS/Acute-Inpatient-Files-for-Download-Items/CMS022630html). [Google Scholar]
- 23.Chronic Conditions Data Warehouse (CCW). Baltimore: Centers for Medicare & Medicaid Services, 2019. (https://www.ccwdata.org/web/guest/home/). [Google Scholar]
- 24.Sankoh AJ, Huque MF, Dubey SD. Some comments on frequently used multiple endpoint adjustment methods in clinical trials. Stat Med 1997; 16: 2529–42. [DOI] [PubMed] [Google Scholar]
- 25.Short MN, Ho V. Weighing the effects of vertical integration versus market concentration on hospital quality. Med Care Res Rev 2019. February 9 (Epub ahead of print). [DOI] [PMC free article] [PubMed] [Google Scholar]
- 26.Dafny L, Dranove D. Do report cards tell consumers anything they don’t know already? The case of Medicare HMOs. Rand J Econ 2008; 39: 790–821. [DOI] [PubMed] [Google Scholar]
- 27.Minchin M, Roland M, Richardson J, Rowark S, Guthrie B. Quality of care in the United Kingdom after removal of financial incentives. N Engl J Med 2018; 379: 948–57. [DOI] [PubMed] [Google Scholar]
- 28.Trivedi AN, Zaslavsky AM, Schneider EC, Ayanian JZ. Trends in the quality of care and racial disparities in Medicare managed care. N Engl J Med 2005; 353: 692–700. [DOI] [PubMed] [Google Scholar]
Associated Data
This section collects any data citations, data availability statements, or supplementary materials included in this article.