Abstract
LINE-1 retrotransposons are overexpressed in more than half of human cancers. We identified a colorectal cancer wherein a fast-growing tumor subclone downregulated LINE-1, prompting us to examine how LINE-1 expression affects cell growth. We find that non-transformed cells undergo a TP53-dependent growth arrest and activate interferon signaling in response to LINE-1. TP53 inhibition allows LINE-1(+) cells to grow, and genome wide knockout screens show that these cells require replication-coupled DNA repair pathways, replication stress signaling, and replication fork restart factors. Our findings demonstrate that LINE-1 expression creates specific molecular vulnerabilities and reveal a retrotransposition-replication conflict that may be an important determinant of cancer growth.
Keywords: mobile genetic element, Fanconi Anemia, WRN, BLM, HUSH, CRISPR-Cas9
Introduction
Long INterspersed Element 1 (LINE-1, L1) is the only functional, protein-coding retrotransposon in humans. LINE-1 is transcribed as a bicistronic RNA which encodes an RNA binding protein, open reading frame 1 protein (ORF1p), and an endonuclease (EN) and reverse transcriptase (RT), ORF2p1-3. Retrotransposition - the ‘copy-and-paste’ mechanism wherein an ‘active’ or ‘hot’ LINE-1 generates de novo insertions of itself - is a mutagenic process that cells limit by suppressing LINE-1 transcription via DNA methylation4,5 and other mechanisms.
Many studies have focused on host factors that alter retrotransposition efficiency or on the functional effects of acquired LINE-1 insertions; fewer have focused on cellular effects of LINE-1 expression6-10. LINE-1 is known to be toxic, but the mechanisms underlying its toxicity are unclear. ORF2p appears to incite DNA double-strand breaks (DSBs) in some systems8, although it is thought to function as a single-strand nickase in retrotransposition11. Despite its toxicity, LINE-1 promoter hypomethylation and protein expression are hallmarks of human cancers12,13 and retrotransposition is commonplace in these diseases14-26. This paradox reflects a lack of understanding surrounding LINE-1 toxicity and how malignant cells tolerate LINE-1 expression.
Here, we describe a case of colon cancer with an aggressive tumor subclone that shut down LINE-1 expression concurrent with its accelerated growth. This prompted us to explore how LINE-1 impacts cell fitness. We find that LINE-1 triggers a p53-mediated G1 arrest and an interferon response in non-transformed cells. In TP53-deficient cells, we conducted knockout screens to identify genes that affect the fitness of LINE-1(+) cells. These studies show that LINE-1(+) cells rely on replication-coupled DNA repair pathways, replication stress signaling responses, and replication fork restart factors for growth. We find that LINE-1 expression activates the Fanconi Anemia pathway, induces markers of replication stress, and sensitizes cells to mitomycin C. Accordingly, we propose a model for LINE-1 toxicity wherein LINE-1 retrotransposition conflicts with DNA replication.
Results
Heterogeneous LINE-1 expression in colon cancer
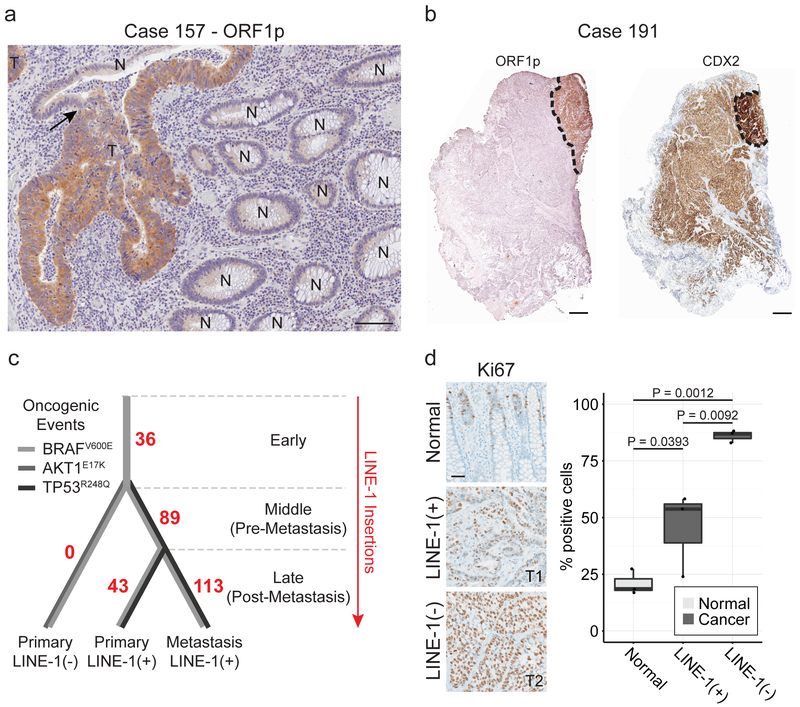
We assessed 22 colorectal cancers (CRC) for ORF1p expression by immunohistochemistry. All were positive, with varied ORF1p staining intensity; immunoreactivity was limited to cancerous epithelium and not found in adjacent normal (Fig. 1a)12. One tumor showed dichotomous ORF1p expression, containing a well-differentiated LINE-1(+) sector and an adjacent, poorly differentiated (CDX2-dim), LINE-1(−) sector (Fig. 1b). A metastatic site of disease closely resembled the former. To evaluate whether these two tumor regions were clonally related or independently derived, we genotyped driver point mutations and somatically-acquired LINE-1 insertions to create a phylogenetic map (Fig. 1c and Extended Data Fig. 1). We found that the LINE-1(+) and LINE-1(−) parts of the primary tumor both share a BRAFV600E mutation as well as numerous somatically-acquired LINE-1 insertions incurred before retrotransposition ceased in the LINE-1(−) component (Extended Data Fig. 1c). The LINE-1(−) clone has a markedly increased proliferation index (Fig. 1d). Thus, the LINE-1(−) section derives from a LINE-1(+) lineage, and loss of LINE-1 expression is associated with an enhanced growth rate.
Figure 1. Heterogeneous LINE-1 expression in colon cancer.
(a) ORF1p immunohistochemistry stain of formalin-fixed paraffin-embedded (FFPE) colon cancer tissue. LINE-1 immunostaining is seen in tumor (T) and not in normal colonic epithelium (N). The arrow indicates a transition from normal to tumor within a gland. Scale bar = 50 μm. (b) Immunohistochemistry stain of FFPE colon cancer tissue from patient case 191. Left, low magnification of ORF1p intensely-positive and negative tumor sectors. Right, low magnification of CDX2, a colon epithelium marker. LINE-1(+) cells express higher CDX2 and are gland-forming whereas LINE-1(−) cells express lower CDX2 and do not form glands. Scale bars = 500 μm. (c) Phylogenetic tree of the tumor subclones in case 191 based on TIP-seq and known tumor driver alleles. The number of de novo LINE insertions is indicated along the line edges (red). We genotyped by Sanger sequencing known tumor driver alleles and found an AKT1E17K mutation in the CDX2-dim cells and a TP53R248Q mutation in CDX2-high cells (both primary and metastatic sites). All tumor specimens possessed a BRAFV600E allele regardless of LINE-1 expression status. The color of the lines indicates the presence or absence of known tumor driver alleles. (d) Ki67 quantification of normal epithelium, LINE-1(+) glandular cancer, and LINE-1(−) solid cancer in case 191. The percent of positive cells was calculated as the number of Ki67+ nuclei divided by the total number of epithelial cell nuclei. Three independent high-powered fields were counted per tissue morphology, and results were compared with ANOVA and two-sided T tests. Scale bar = 100 μm.
The p53-p21 pathway restricts growth of LINE-1(+) cells
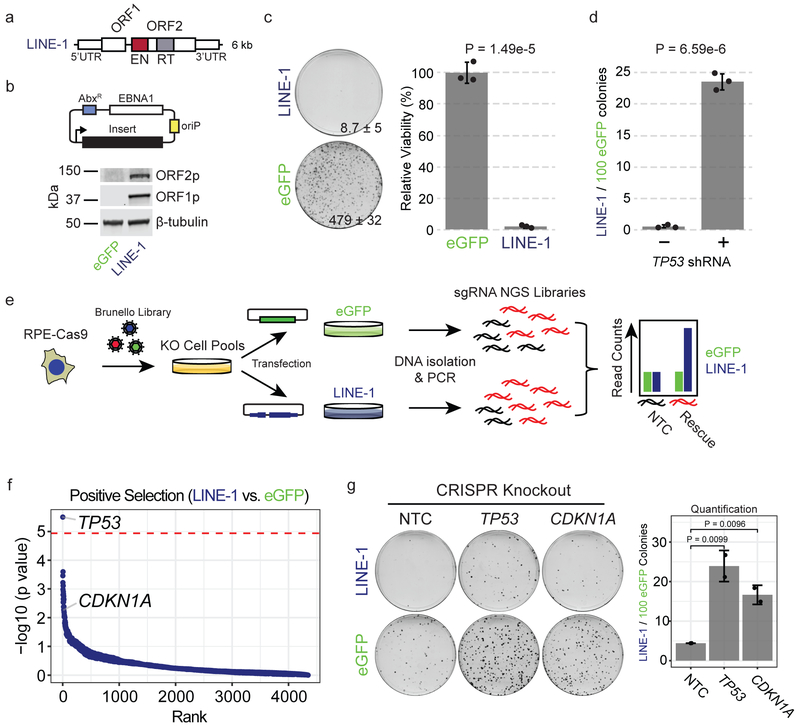
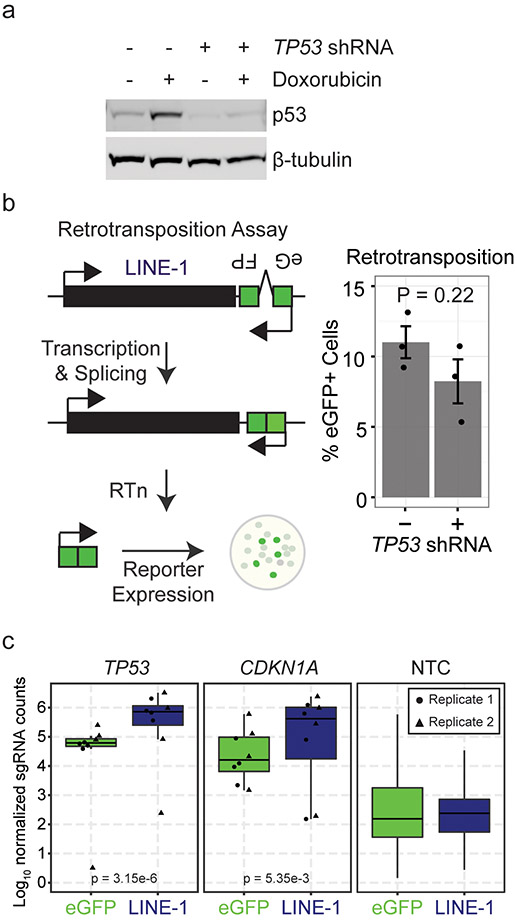
To identify growth determinants of LINE-1(+) cells, we developed an ectopic expression system in telomerase-immortalized retinal pigment epithelium-1 (RPE) cells, genetically-stable diploid cells with intact p53 and DNA damage responses (Fig. 2a-b). LINE-1 expression markedly inhibited RPE clonogenic growth 98.2% compared to eGFP control (Fig. 2c). TP53 loss-of-function mutations clinically correlate with LINE-1 activity12,25,27, so we compared clonogenic growth of RPE cells expressing LINE-1 or eGFP (LINE-1 / 100 eGFP colonies) with and without TP53 knockdown (Fig. 2d and Extended Data Fig. 2a). TP53 knockdown rescued LINE-1(+) cells 42.3-fold but did fully restore to LINE-1(+) cells the clonogenic potential of controls. To test whether TP53 function affects retrotransposition efficiency in this system, we used a reporter assay to compare LINE-1 insertion frequencies in control and TP53 knockdown cells but found no significant difference (Extended Data Fig. 2b). Thus, TP53 restricts growth of these cells but not retrotransposition potential.
Figure 2. LINE-1 inhibits cell growth in RPE by activating the p53-p21 pathway.
(a) LINE-1 sequence. The 5’ untranslated region (UTR) is a CpG-rich RNA polymerase II promoter. Open reading frame (ORF) 1 and ORF2 are separated by a 63 bp linker sequence. ORF2 has endonuclease (EN, red) and reverse transcriptase (RT, gray) domains. (b) Above, episomal pCEP4 mammalian expression vector for eGFP (pDA083) or LINE-1 (pDA077). AbxR = antibiotic selection marker, EBNA1 = Epstein-Barr Nuclear Antigen 1, oriP = EBNA-1 replication origin. Below, western blot of ORF1p and ORF2p from RPE cells transfected with each plasmid. Uncropped blot is shown in Supplementary Data 1. (c) Clonogenic assay (day 12). Cells are transfected with eGFP (pDA083) or LINE-1 (pDA077). Representative plates with number of colonies indicated ± SD. Quantification to the right is normalized to eGFP-expressing cells set at 100%, with n=3 independent experiments. P value calculated by two-sided unpaired T test. (d) Clonogenic assay (day 12). Cells are treated with lentivirus encoding TP53 shRNA (+) or control vector (−). Data presented as the rate of LINE-1 per 100 eGFP colonies ± SEM, n=3 independent experiments. P value obtained by unpaired two-sided T test. (e) Positive Selection CRISPR-Cas9 knockout screen workflow using the Brunello CRISPR knockout library. RPE-Cas9 = RPE cells constitutively expressing Cas9 protein. KO = knockout. sgRNA = single-guide RNA. NGS = Next-Generation Sequencing. NTC = Non-targeting-control. (f) Screen enrichment rank vs. significance values of gene knockouts that rescue growth of LINE-1(+) cells. The red line is the FWER-adjusted genome-wide significance level. Low ranks indicate rescue of LINE-1(+) cells. (g) CRISPR knockout of TP53 or CDKN1A significantly rescue growth of RPE compared to non-targeting-control (NTC). Representative plates with all data presented as LINE-1 / 100 eGFP colonies ± SEM. n=2 biological replicates. P value obtained by unpaired one-sided T test.
We next performed a genome-wide CRISPR knockout screen to identify knockouts that rescue growth of LINE-1(+) cells (Fig. 2e and Methods). Single-guide RNAs (sgRNAs) targeting TP53 were the only ones to significantly enhance cell fitness (Fig. 2f and Extended Data Fig. 2c). Guides targeting CDKN1A (p21), a TP53-dependent growth arrest effector and retrotransposition suppressor28, were enriched but did not reach genome-wide significance (Figure 2F and Extended Data Fig. 2c). Guide RNAs targeting other genes downstream of TP53 did not tolerize cells to LINE-1 expression. To validate these findings, we transduced two individual sgRNAs targeting TP53, CDKN1A, or non-targeting controls (NTC) in RPE cells expressing Cas9, and found that each knockout rescued growth of LINE-1(+) cells (Fig. 2g). These data demonstrate that LINE-1 expression causes a p53-p21-dependent growth arrest.
LINE-1 induces p53-mediated G1 arrest and an interferon response
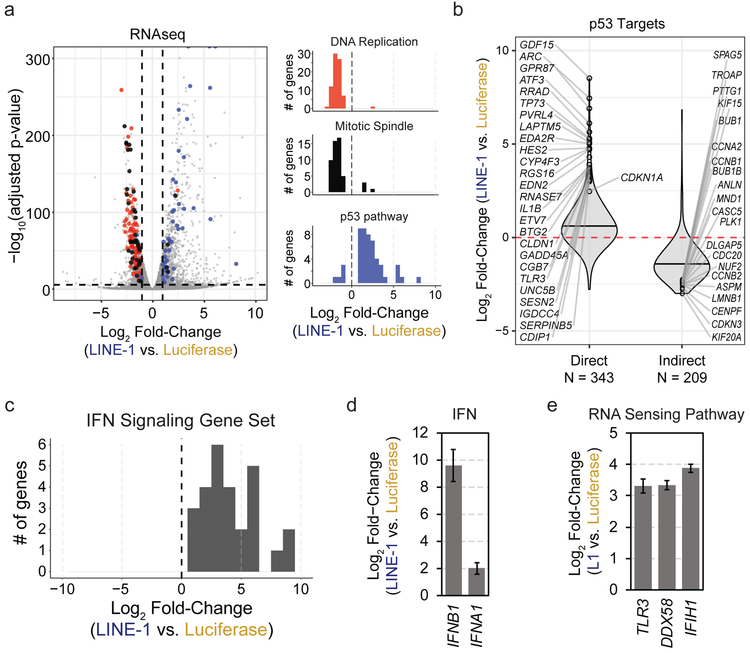
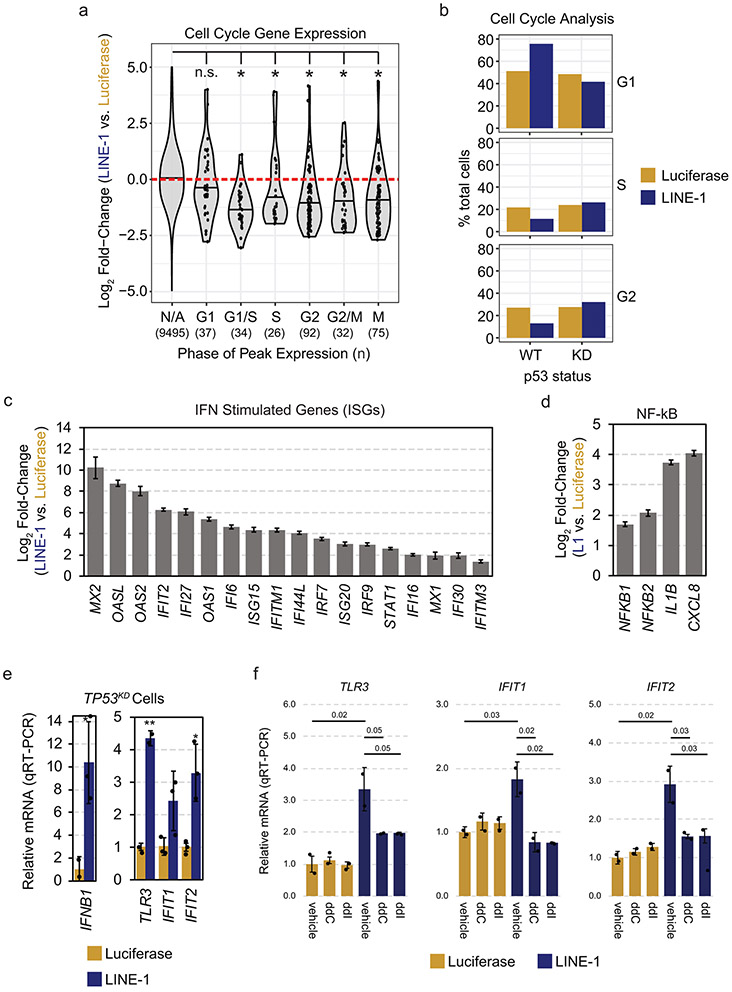
To characterize this further, we performed RNAseq in RPE cells encoding a doxycycline-inducible (Tet-On) codon-optimized LINE-1 (ORFeus) or luciferase control. In total, 2,261 genes were differentially expressed by more than 2-fold and met Bonferroni-corrected significance (Fig. 3a). Gene set enrichment analysis revealed upregulation of the p53 pathway, and downregulation of cell cycle progression genes (Fig. 3a, Extended Data Fig. 3a, and Supplementary Table 1). Genes possessing p53 regulatory elements (“direct targets”) including CDKN1A (p21) were upregulated in LINE-1(+) cells (p < 2.2 × 10⁻¹⁶) and genes repressed via p21 (“indirect targets”) were downregulated (p < 2.2 × 10⁻¹⁶) (Fig. 3b). We confirmed by flow cytometry that LINE-1(+) cells accumulated in G1 in a LINE- and TP53-dependent manner (Extended Data Fig. 3b). LINE-1 expression increases apoptotic effector RNAs PMAIP1 (NOXA) and BBC3 (PUMA), but not caspase 3 activation by western blot (data not shown); Genes associated with the senescence associated secretory phenotype (SASP)29 were not significantly upregulated (data not shown). These findings are consistent with LINE-1 inducing a p53-mediated G1 cell cycle arrest.
Figure 3. LINE-1 activates a p53 and IFN response.
(a) Left: Volcano plot of differentially expressed genes. Vertical dashed lines indicate fold-change of −1 or 1 (log2) and the horizontal dashed line indicates a FWER-controlled p-value of 0.05. Right: histograms of gene set enrichment analysis results. Gene set names are indicated above each plot. The number of genes is indicated on the y-axis and the x-axis indicates differential expression bins. Individual genes comprising these datasets are highlighted in the volcano plot according to the colors of the bars in the histograms. Data derived from n=3 independent replicates. (b) Violin plots illustrating differential expression of p53 transcriptional targets. Direct and indirect target genes are curated from published reports (see Methods References). Horizontal bars mark median values. The number of genes in each group are indicated below the plot. (c) Histogram of gene set enrichment results of interferon (IFN) signaling genes. The number of genes is indicated on the y-axis and the x-axis indicates differential expression. (d) Relative fold-change of interferon B1 (IFNB1) and A1 (IFNA1) in LINE-1(+) compared to luciferase(+) cells measured by RNAseq. Error bars indicate SEM. (e) RNAseq analysis revealed upregulation of the RNA sensing pathway involving Toll-like receptor 3 (TLR3), RIG-I (DDX58), and MDA5 (IFIH1) in LINE-1(+) cells. Error bars indicate SEM.
Most (63.6%) of the gene sets upregulated by LINE-1 expression reflect interferon (IFN) signaling (Fig. 3c and Supplementary Table 1) and IFN stimulated genes (Extended Data Fig. 3c), consistent with prior reports30-34. This appears driven by IFN beta 1 (IFNB1) and the dsRNA sensing pathway TLR3, DDX58 (RIG-I), and IFIH1 (MDA5) (Fig. 3d-e). cGAS-STING is not expressed in these cells. LINE-1 also induces nuclear factor kappa-B (NF-kB) - an immune signaling transcription factor that can be activated by the RNA-sensing pathway35 - and NF-kB transcriptional targets, including the pro-inflammatory cytokines interleukin-1 beta (IL-1B) and CXCL8 (Extended Data Fig. 3d). LINE-1 expression in TP53-knockdown cells similarly induces expression of IFNB1 and interferon-inducible genes including TLR3, IFIT1 and IFIT2 (Extended Data Fig. 3e), indicating the response is p53-independent. In contrast, addition of nucleoside reverse transcriptase inhibitors known to act on LINE-1, zalcitabine (ddC) or didanosine (ddI)36, attenuated the IFN response (Extended Data Fig. 3f). Thus, LINE-1 expression induces an IFN response which may contribute to its inhibitory effects on cell growth independent of p53.
Mapping LINE-1 fitness interactions in TP53-deficient cells
We next hypothesized that p53-deficient, LINE-1(+) cells may rely on specific pathways to suppress LINE-1 toxicity. Their loss would be synthetic lethal with LINE-1 expression, and they would be potential therapeutic targets for LINE-1(+) cancers.
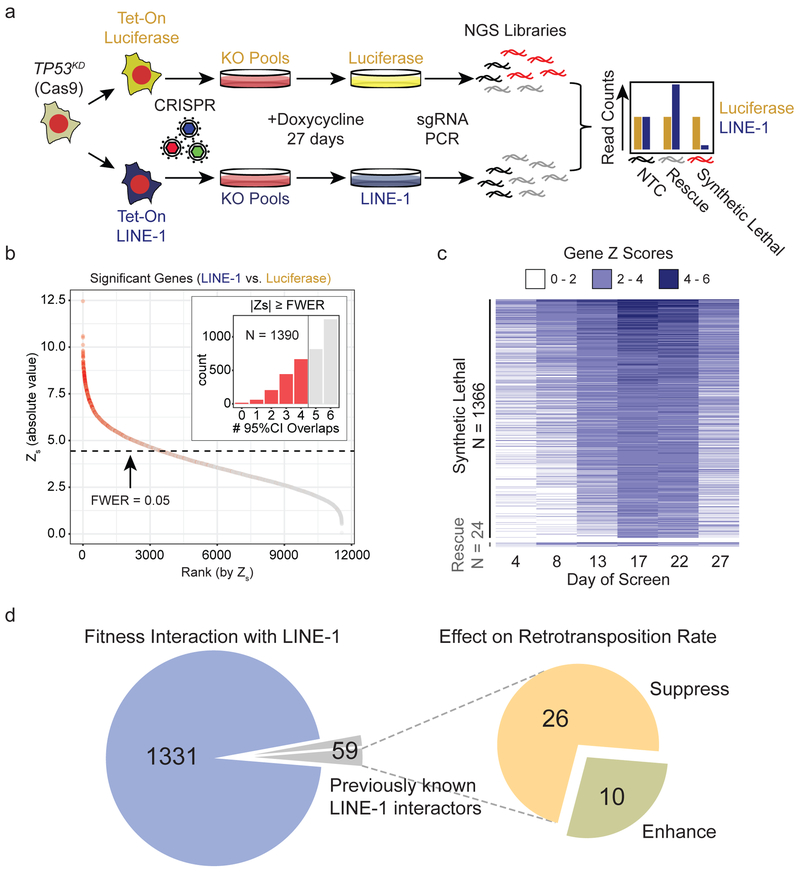
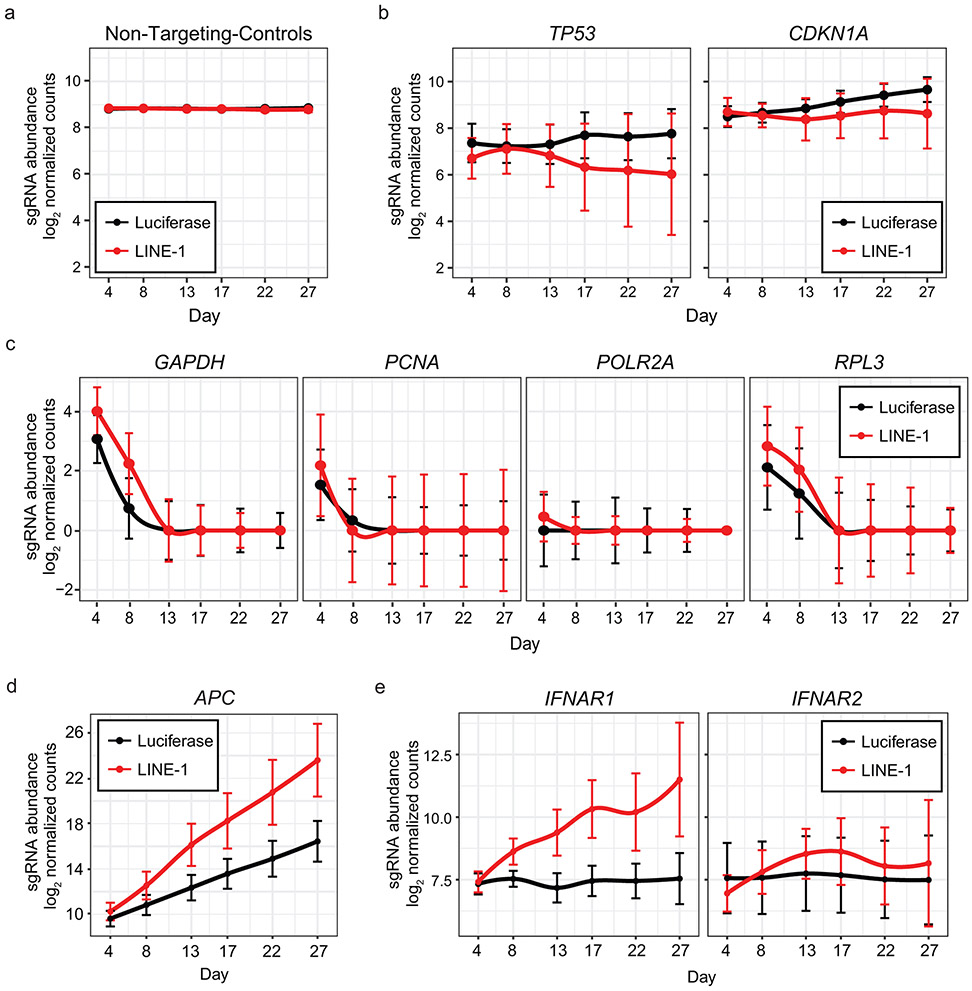
To identify these pathways, we conducted a knockout screen in TP53-deficient (TP53KD) RPE-Cas9 cells with Tet-On transgenes encoding codon-optimized LINE-1 or luciferase (Fig. 4a). We generated knockout cell pools in triplicate and expressed LINE-1 or luciferase for 27 days, sampling the populations for sgRNA representation every 4-5 days. Knockouts that become more highly represented in LINE-1(+) cells relative to luciferase(+) controls indicate a positive growth interaction, whereas those that are lost indicate a synthetic lethal interaction. Non-targeting-control (NTC) sgRNAs were equally represented in LINE-1(+) and luciferase(+) cells (Extended Data Fig. 4a). TP53 and CDKN1A knockouts exhibited null interactions in LINE-1(+) and luciferase(+) cells (Extended Data Fig. 4b), confirming that TP53 knockdown effectively inhibited its function and that any p21 growth effects are p53-dependent. As expected, sgRNAs targeting essential genes were depleted from both LINE-1(+) and luciferase(+) populations (Extended Data Fig. 4c).
Figure 4. Mapping LINE-1 fitness interactions in TP53-deficient cells.
(a) TP53KD cells are RPE-Cas9 cells stably transduced with shRNA to knockdown p53 and then engineered to express luciferase (pDA094) or codon-optimized LINE-1 (pDA095) in a doxycycline-inducible manner (Tet-On). Tet-On cells were transduced with the Brunello CRISPR KO library at a multiplicity of infection of 0.3 and puromycin-selected for 8 days before inducing expression of LINE-1 or luciferase for 27 days. Cell pools were sampled at 4-5 day intervals and analyzed for sgRNA representation with MAGeCK. Count data are normalized to reads that align to 1,000 built-in non-targeting-control (NTC) sgRNAs (black). NGS = Next Generation Sequencing. KO = Knockout. (b) Genes shown as rank ordered plot of Stauffer Z scores (Zs) with a family-wise error rate (FWER) of 0.05. Inset indicates the number of 95% confidence interval overlaps over all time points between LINE-1 and luciferase groups among gene knockouts that meet the FWER threshold (red) versus those that do not (gray). (c) Heatmap of 1,390 significant genes depicting the Z scores over time, ranked by Zs. There are 1,366 synthetic lethal interactions and 24 rescue interactions. Most knockouts achieved detectable effects by 17-22 days into the screen, evidenced by increasing gene Z scores during these time points. (d) Overlap of genes with LINE-1 fitness interactions observed in the present study with genes previously known to interact with LINE-1 proteins physically or by modifying retrotransposition. Previously known LINE-1 interactors were identified by Liu et al., 2018, Moldovan et al., 2015, Taylor et al., 2013, and Goodier et al., 2013.
We found 1,390 gene knockouts with significant fitness interactions (Fig. 4b and Supplementary Table 2). Only 24 rescued LINE-1(+) cell growth. Knockout of the APC tumor suppressor is among these (Extended Data Fig. 4d), which is notable since TP53 and APC mutations frequently co-occur in colorectal cancer37 and LINE-1 has mutated APC in colon cancers22,38. IFNAR1 (IFN receptor) knockout also enhanced cell growth (Extended Data Fig. 4e), highlighting that LINE-1-associated IFN activation suppresses cell growth independently of p53. In contrast, most genes identified in this screen (n=1,366) demonstrate synthetic lethal interactions in LINE-1(+) cells within 3 weeks of sustained expression (Fig. 4c).
We asked whether genes known to alter LINE-1 retrotransposition efficiency5 or that encode proteins that physically interact with ORF1p or ORF2p39-42 were enriched for fitness interactions (Fig. 4d and Supplementary Table 3). Of these 239 genes, 59 (24.7%) were identified in our fitness screen, compared to 12.0% (1,390/11,564) of all genes tested, a 2.05-fold enrichment (χ2 = 8.4 × 10⁻⁹). The majority, 58 of 59 (98.3%), demonstrated synthetic lethal interactions. Of the 59 genes, 10 enhance retrotransposition, 26 suppress retrotransposition, and 25 encode physical interactors. However, these 59 genes only account for 4.2% of genes identified in our study, indicating that most fitness interactors are distinct from host genes that regulate retrotransposition. We conclude that specific gene knockouts cause synthetic lethality in LINE-1(+) cells. Relatively few knockouts act independently of p53 to enhance growth of LINE-1(+) cells, and only a minor proportion of fitness interactors are known to influence retrotransposition.
We performed an overrepresentation analysis on all significant fitness interactors and found a 1.4-fold enrichment of genes encoding nuclear proteins (χ2 = 6.61 × 10⁻²¹; 50.1% of significant genes compared to 35.2% of genes in the library, see Methods). We found 41 gene ontology (GO) terms with a false-discovery rate (FDR) <0.05 (Supplementary Table 4). The top enriched term was mRNA processing (FDR = 2.29×10⁻¹⁰); we also found terms related to maintenance of genome integrity, including DNA repair (FDR = 4.47×10⁻⁷) and DNA replication (FDR = 0.01), and chromatin-related gene sets, including histone modification (FDR = 3.07×10⁻⁸) and regulation of chromatin organization (FDR = 0.001).
HUSH complex loss increases LINE-1 transgene expression
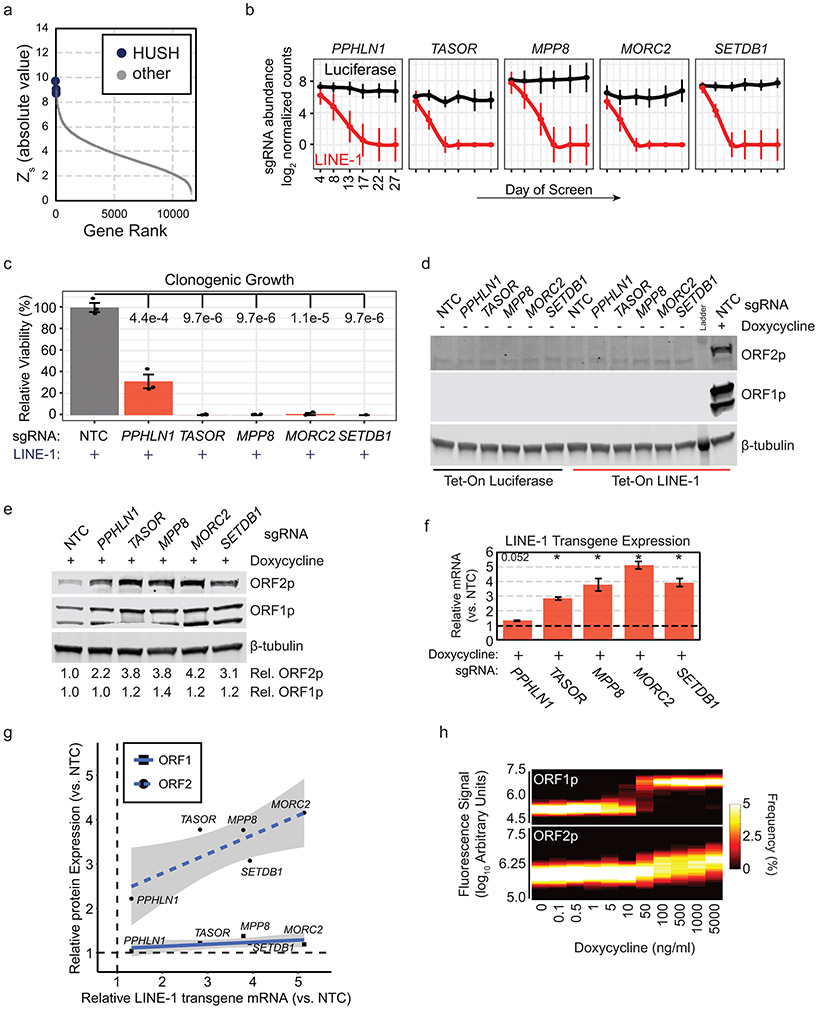
Human silencing hub (HUSH) knockouts produced pronounced LINE-1 synthetic lethal interactions which we validated by single gene knockout clonogenic growth studies (Extended Data Fig. 5a-c). HUSH is an epigenetic repressor complex that targets transgenic DNA sequences including lentivirus insertions43 and endogenous LINE-1 loci5,44. Thus, we tested whether HUSH loss increases LINE-1 expression, either from endogenous LINE-1 loci or from the codon-optimized transgene. We did not detect ORF1p or ORF2p in no-doxycycline controls (Extended Data Fig. 5d), indicating that HUSH mutant RPE cells do not upregulate endogenous LINE-1 proteins. In doxycycline-treated cells with the LINE-1 transgene, ORF1p, ORF2p, and transgene mRNA expression increased with HUSH knockout (Extended Data Fig. 5d-f) and ORF2p protein level linearly correlated with transgene mRNA level (2-4 fold increase, Extended Data Fig. 5g). ORF2p expression could be similarly increased in HUSH-intact cells transfected with Tet-On LINE-1 plasmid treated with higher doses of doxycycline (Extended Data Fig. 5h), and this is highly cytotoxic. We conclude that the synthetic lethal effect of HUSH mutants is caused by enhanced expression of the LINE-1 transgene. We note that high levels of ORF2p expression overwhelm the survival advantage conferred by TP53 deficiency.
RNA Processing Gene Knockouts Sensitize Cells to LINE-1 Expression
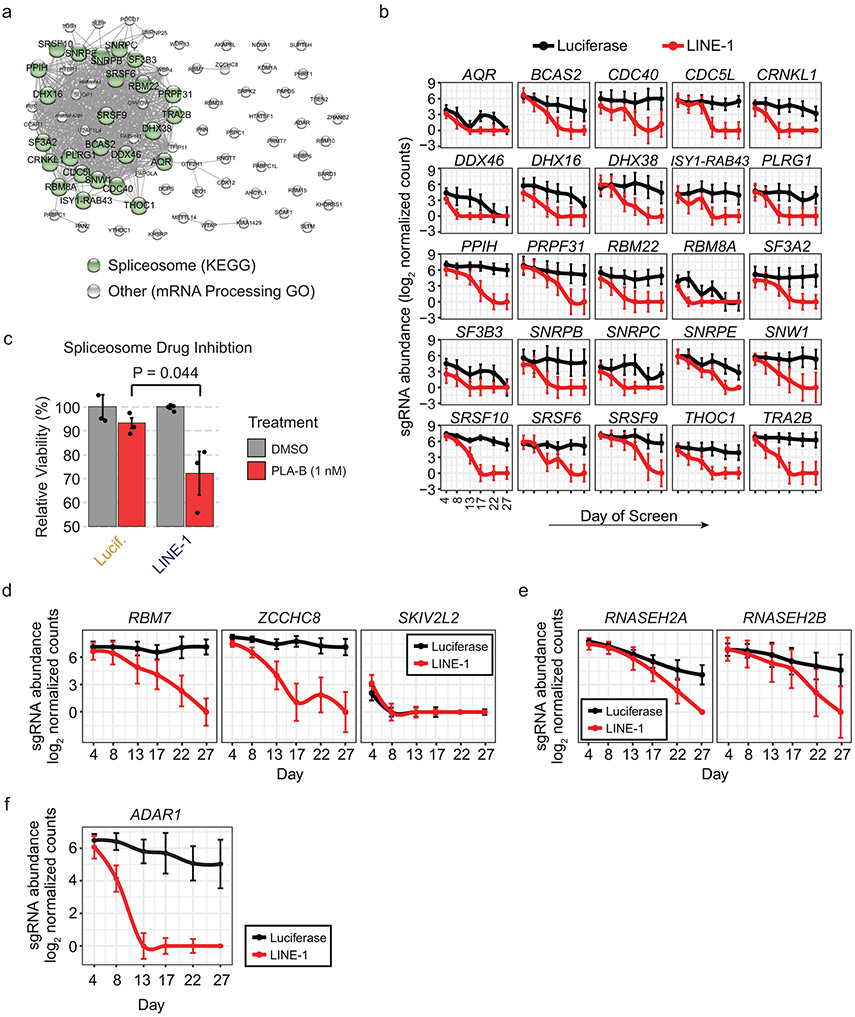
The GO term mRNA processing encompasses 81 genes demonstrating fitness interactions in LINE-1(+) cells; these genes are enriched for spliceosome components (P = 2.24 × 10⁻³⁴) and knockouts of these are synthetic lethal in LINE-1(+) cells (Extended Data Fig. 6a-b). We validated this effect by treating cells with the splicing inhibitor pladienolide B (PLA-B), which acts on the essential gene SF3B1 (splicing factor 3b subunit 1), a component of the U2 snRNP. At a PLA-B dose that reduced luciferase(+) clonogenic growth by 6.8%, LINE-1(+) cells grew 27.8% fewer colonies, a 4.1-fold increased sensitivity to PLA-B (P = 0.044, Extended Data Fig. 6c). We analyzed RNAseq data from LINE-1(+) RPE and did not observe alternatively spliced isoforms of the LINE-1 transgene (data not shown), indicating that these gene knockouts likely impact cell growth through an indirect mechanism rather than by directly processing the LINE-1 RNA. Notably, cells subjected to DNA damage also are sensitized to loss of spliceosome components45.
We found pronounced synthetic lethal interactions caused by knockouts of genes encoding the nuclear exosome targeting (NEXT) complex, which degrades intronic RNAs and processed transcripts46. Two of the three complex members demonstrate synthetic lethal interactions (RBM7 and ZCCHC8) whereas the third (SKIV2L2) is an essential gene (Extended Data Fig. 6d). Similarly, RNASEH2 knockout is synthetic lethal in LINE-1(+) cells (Extended Data Fig. 6e). RNASEH2 facilitates retrotransposition by degrading LINE-1 RNA from RNA-DNA hybrids after reverse transcription occurs47. Thus, when RNASEH2 is lost, this precludes LINE-1 retrotransposition and enhances toxicity.
Finally, we find that LINE-1(+) cells require the dsRNA adenosine (A) to inosine (I) editing enzyme ADAR1 (Extended Data Fig. 6f), as do cancer cell lines with high expression of interferon stimulated genes48.
Fanconi Anemia Proteins Suppress LINE-1 Toxicity
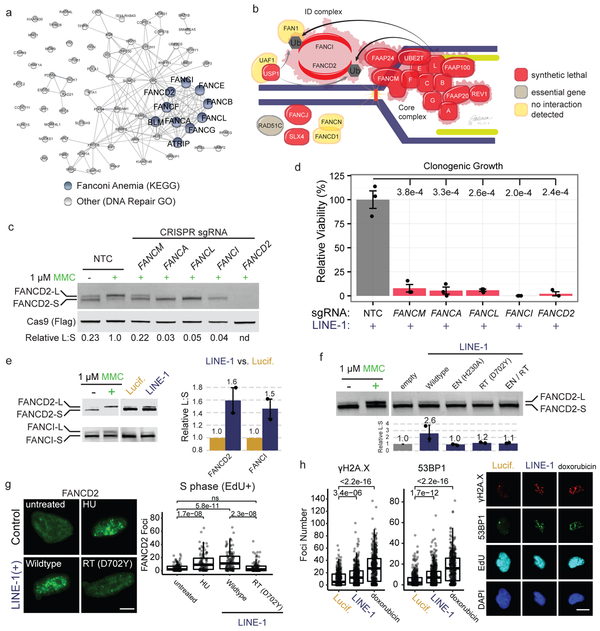
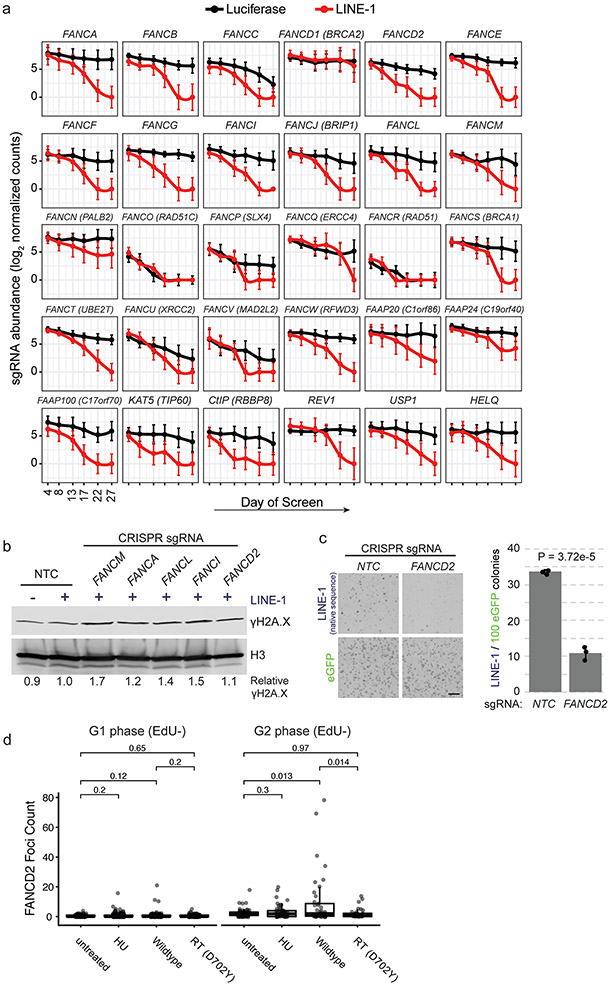
DNA repair genes that suppress LINE-1 toxicity were enriched for Fanconi Anemia (FA)-BRCA1 pathway components (P = 7.65 × 10⁻¹³, Fig. 5a). The FA pathway is critical for resolving DNA interstrand crosslinks and transcriptional R-loops that interfere with progression of DNA replication49. Knockout of the majority (83%) of the genes known to cause FA and several related genes50 exhibited synthetic lethal interactions with LINE-1 (Fig. 5b and Extended Data Fig. 7a), including BRCA1 (FANCS). We chose five genes to validate based on their functions in the pathway: FANCM, a helicase and branch translocase that has high affinity for stalled replication forks and RNA:DNA hybrids; FANCA, which is required for FA “core complex” assembly; FANCL, the E3 ubiquitin ligase that activates the downstream effectors of the “ID Complex,” FANCI and FANCD2. We confirmed knockout efficacy by measuring mitomycin C (MMC)-induced FANCD2 monoubiquitination (FANCD2-Ub) (Fig. 5c). MMC induced FANCD2-Ub in NTC-treated cells but not in the FA knockouts. These FA-deficient mutants were selectively sensitive to LINE-1 expression compared to NTCs (Fig. 5d) and displayed slight increases in chromatin-bound γH2A.X compared to NTC-treated LINE-1(+) cells (1.1-1.7 fold, Extended Data Fig. 7b). Expression of native LINE-1 sequence is also synthetic lethal in FANCD2-knockout cells compared to NTC controls (Extended Data Fig. 7c).
Figure 5. The Fanconi Anemia (FA) pathway is essential in p53-deficient cells.
(a) Network of 75 DNA repair genes identified in the screen is enriched for Fanconi anemia genes (blue nodes). Edges indicate known physical interactions. (b) Model of FA complexes responding to a DNA lesion (vertical line) encountered by a replication fork (blue line, genomic DNA; green line, nascent DNA). Genes are color coded based on the performance of their knockouts. (c) Western blot of FANCD2 response to 24-hour treatment with 1 μg/ml mitomycin C (MMC). Cells are treated with FA member sgRNAs or non-targeting-control (NTC). FANCD2 monoubiquitination assessed as the ratio of FANCD2-L (long) to FANCD2-S (short) band intensities (relative L:S ratio) graphed relative to NTC, MMC-treated cells. nd = not determined. (d) Clonogenic growth assay of LINE-1(+) RPE cells with sgRNAs targeting the same genes as in (C). n=3 independent experiments. P value calculated with a one-sided T test. (e) Representative western blot of FANCD2 and FANCI following 72 hour expression of LINE-1 or luciferase in RPE. MMC treatment reveals L (monoubiquitinated) and S (non-ubiquitinated) protein bands. Quantification at right of n=2 independent experiments ± SEM.. (f) Representative western blot of FANCD2 following 72 hour expression of wildtype or mutant LINE-1 in HeLa cells. Quantification below of n=2 independent experiments ± SEM. Effect of wildtype LINE-1 as assessed by ANOVA (p = 0.0143). (g) Left, representative images of FANCD2 foci (green) in EdU+ nuclei. Scale bar = 6 μm. Right, quantification of FANCD2 foci in EdU+ HeLa cells. Number of cells per group: untreated, n=134; HU, n=105; wildtype, n=109; RT (D702Y), n=101. HU = hydroxyurea. RT = reverse transcriptase. ns = not significant. (h) Left, γH2A.X and 53BP1 focus quantification in EdU+ TP53KD cells. Number of cells per group: Lucif., n=326; LINE-1, n=358; doxorubicin, n=431. Two-sided T tests were used for statistical comparisons in panels g and h. Right, representative images of γH2A.X (red), 53BP1 (green), EdU (cyan), and DAPI (blue). Scale bar = 12 μm. Uncropped blot images of panels c, e and f are shown in Supplementary Data 1.
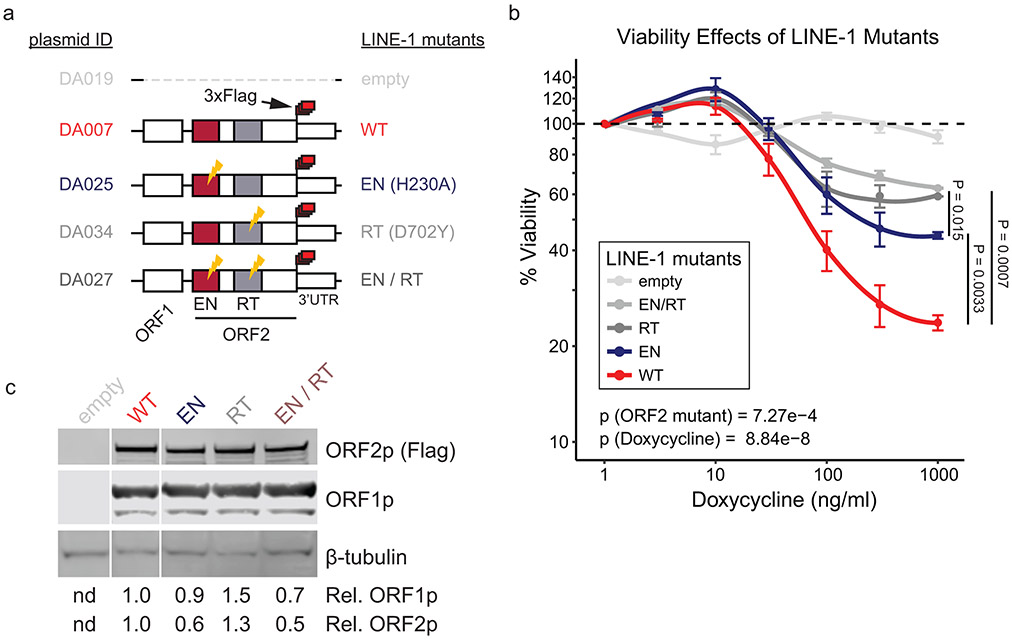
Based on these data and reports that FA proteins suppress retrotransposition5, we hypothesized that the FA pathway is activated by LINE-1. To test this, we measured monoubiquitination of FA effector proteins FANCD2 and FANCI and found 1.6- and 1.5-fold increases, respectively, with LINE-1 expression (Fig. 5e). Importantly, LINE-1 cytotoxicity has been previously reported to depend on endonuclease (EN) and reverse transcriptase (RT) activities8-10, and we confirmed that expression of LINE-1 with inactivating EN and RT mutations is less toxic than wildtype (WT) LINE-1 (Extended Data Fig. 8). To dissect whether the enzymatic activities of LINE-1 are necessary for FA activation, we measured FANCD2 monoubquitination in HeLa cells expressing WT LINE-1 or mutants lacking EN activity and/or RT activity. Whereas WT LINE-1 increased FANCD2-Ub (2.6-fold), both EN- (H230A) and RT- (D702Y) inactivating mutations2,51 did not (Fig. 5f). We next assessed FA activation by enumerating FANCD2 nuclear foci. We expressed WT or RT mutant LINE-1 and quantified FANCD2 nuclear foci in randomly-imaged, EdU-labeled cells. Both hydroxyurea (HU) treatment and LINE-1 expression increased the number of FANCD2 foci in S phase (EdU+) cells (p = 1.7 × 10⁻⁸ and 5.8 × 10⁻¹¹, respectively, Fig. 5g) but not in G1/G2 (EdU-) phase (Extended Data Fig. 7d). The LINE-1 RT mutant did not induce FANCD2 foci formation. Together, these data demonstrate that LINE-1 activates the FA complex and replication-coupled DNA repair. By contrast, LINE-1 EN and RT mutants do not have this effect, suggesting that the LINE-1 retrotransposition intermediate is crucial to the process.
To evaluate DNA damage associated with LINE-1 expression, we measured γH2A.X and 53BP1 nuclear foci. We found that LINE-1(+) cells have transient increases in numbers of γH2A.X and 53BP1 foci as compared to control cells (p = 3.4 × 10⁻⁶ and 1.7 × 10⁻¹², respectively, Fig. 5h). These increases are detectable in S phase and resolve by G2 whereas doxorubicin-induced DNA damage foci continue to accumulate (data not shown). This pattern is more consistent with LINE-1-induced replication stress52,53 than with a large burden of persistent, dsDNA breaks.
Retrotransposition-Replication Conflict Underpins LINE-1 Toxicity
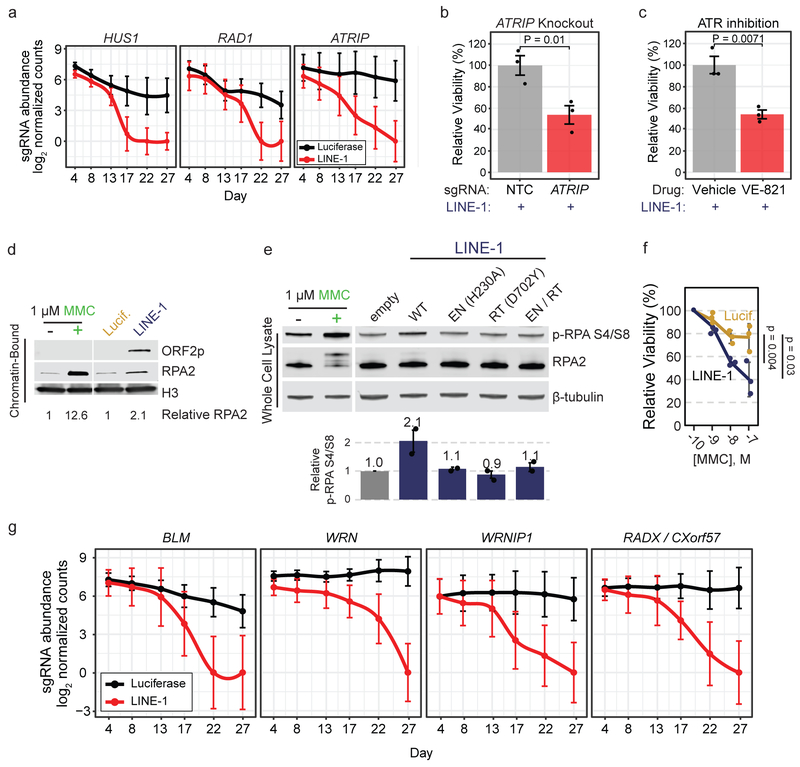
We next explored interactions between LINE-1 retrotransposition and DNA replication using our fitness screen data. Stalled replication forks activate signaling pathways involving ATR (Ataxia Telangiectasia and Rad3-Related) and ATRIP (ATR-interacting protein), as well as the tripartite RAD9, HUS1, RAD1 (9-1-1) complex. ATR and RAD9 are essential, but genes encoding all non-essential components of these complexes (ATRIP, HUS1, and RAD1) are synthetic lethal LINE-1 interactors (Fig. 6a). We validated that ATRIP knockout cells exhibited heightened sensitivity to LINE-1 expression (Fig. 6b); they also failed to sufficiently activate FANCD2 upon MMC-induced DNA damage (data not shown). Similarly, ATR inhibition with VE-821 sensitized cells to LINE-1 (Fig. 6c) at a dose that had no effect on viability in luciferase(+) cells (data not shown). Thus, compromising replication stress signaling is synthetic lethal in LINE-1(+) cells, potentially related to the role of ATR-ATRIP signaling in activating the FA pathway54,55.
Figure 6. LINE-1 activity induces replication stress.
(a) Median count of sgRNAs targeting replication stress signaling genes ATRIP and the 9-1-1 complex (HUS1 and RAD1) during the screen. Error bars indicate 95% confidence intervals. (b) Clonogenic assay of LINE-1(+) RPE cells (induced with 1 μg/ml doxycycline) with CRISPR-knockout of ATRIP compared to non-targeting-control (NTC). Error bars indicate SEM, n=3 independent experiments. P value is calculated with an unpaired two-sided T test. (c) Clonogenic assay of LINE-1(+) RPE cells (induced with 1 μg/ml doxycycline) with drug inhibition of ATR kinase by 1 μM VE-821 compared to vehicle (DMSO). Error bars indicate SEM, n=3 independent experiments. P value is calculated with an unpaired two-sided T test. (d) Western blot of RPA2 occupancy on chromatin induced by LINE-1 compared to luciferase control after 72 hours of expression in RPE. Chromatin-bound protein lysates were used. 1 μM MMC was used as a control to verify that these cells respond to replication stress. (e) Western blot of p-RPA S4/S8 after 72 hours of wildtype or mutant LINE-1 expression in HeLa cells. Relative signal intensity for n=2 independent experiments ±SEM is quantified. 1 μM MMC was used as a replication stress control and produces a gel shift in total RPA2 that is more subtly produced by WT LINE-1, which is the the hyperphosphorylated protein. Statistical significance is assessed by ANOVA (p = 0.0007). (f) MMC dose-response clonogenic assay of LINE-1(+) cells or control. Molar concentration indicated on x-axis. Data are plotted as the mean viability relative to 100 pM ±SD, n=3 independent experiments. Two-sided T tests were used to compare relative viability at each dose. (g) Median count of sgRNAs targeting fork protection (RADX) and fork restart (BLM, WRN, WRNIP1) genes. Median values are depicted with 95% Confidence Intervals. Uncropped blot images of panels d and e are shown in Supplementary Data 1.
We next assayed for signs of replication fork stall. Stalled replication forks accumulate ssDNA coated by RPA, a heterotrimer comprised of RPA1, RPA2 and RPA3, to protect genomic DNA from nucleases56. We isolated chromatin-bound protein fractions from cells treated with MMC or expressing LINE-1 or luciferase and found that both MMC treatment and LINE-1 expression induced chromatin-bound RPA2 (Fig. 6d). These data show replication stress occurring in a LINE-dependent manner. We next asked whether LINE-1-associated replication stress depends on ORF2p enzymatic activity. We expressed WT or mutant LINE-1 from Tet-On plasmids in HeLa cells and measured p-RPA S4/S8, a phosphorylation modification placed on RPA during replication stress. WT LINE-1 significantly induced p-RPA S4/S8 by 2.1-fold (p = 0.0007), whereas EN- and RT-inactivating mutations did not (Fig. 6e). These data indicate that ORF2p must nick DNA and reverse transcribe in order to induce replication stress, highlighting the importance of the retrotransposition intermediate in these events. Moreover, LINE-1(+) cells were 1.9-fold more sensitive to mitomycin C (MMC) as compared to luciferase-expressing controls (Fig. 6f). Together, these data indicate that LINE-1 retrotransposition induces replication stress and sensitizes cells to compounds that increase demands on replication-coupled DNA repair.
Several key processes occur downstream of replication stress signaling, including: (i.) fork reversal, (i.e., translocation of the replication fork away from the lesion and resection by nucleases including ZRANB3, SMARCAL1, and HLTF), (ii.) fork protection from excess degradation by nucleases, and (iii.) fork restart57. Fork reversal genes do not score in our screen, whereas the fork protection factor RADX and proteins that are important for fork restart—including Bloom helicase (BLM), Werner helicase (WRN) and WRN interacting protein 1 (WRNIP1)—are LINE-1 synthetic lethal interactors (Fig. 6g). Fork restart additionally requires the removal of RPA from the ssDNA. To this end, we note that knockout of RFWD3, an FA member whose E3 ubiquitin ligase activity regulates RPA unloading from chromatin58, produces synthetic lethality (Extended Data Fig. 7a). These findings indicate that replication fork protection and restart, but not reversal, are essential for LINE-1 cell growth.
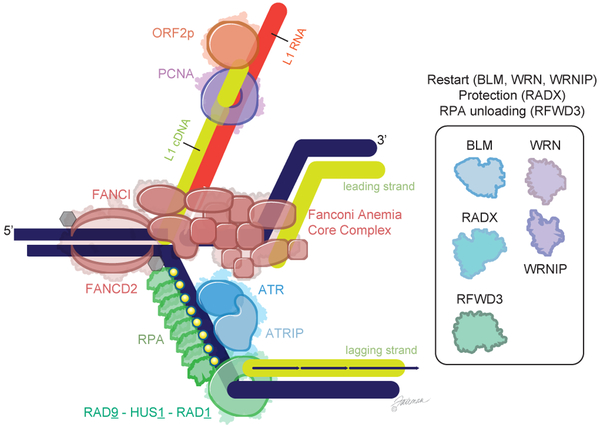
Taken together, these data are consistent with a model wherein LINE-1 retrotransposition intermediates cause replication stress (Fig. 7). LINE-1(+) cells rely on FA-mediated DNA repair, replication stress signaling, and fork restart pathways for growth.
Figure 7. Model of LINE-1-induced replication stress.
Collision of a replication fork, comprised of genomic DNA (dark blue) and newly synthesized DNA (green), with a LINE-1 insertion intermediate—an RNA:DNA hybrid made of LINE-1 mRNA (red) and LINE-1 cDNA (green). The LINE-1 insertion intermediate is recognized by the Fanconi Anemia pathway core complex and recruits and activates FANCD2 and FANCI, which are then monoubiquitinated. The stalled fork leads to an accumulation of RPA, which recruits ATR-ATRIP and the 9-1-1 (RAD9-HUS1-RAD1) complex, key replication stress signaling proteins. These coordinate the cell response to the replication stress, including phosphorylation of RPA. Failure to resolve this collision reduces cell fitness. A similar conflict could occur upstream of the lagging strand as well.
Discussion
LINE-1 expression slows cell growth yet is a hallmark of many human cancers. Here, we used in vitro LINE-1 expression systems, gene expression profiling, and CRISPR-Cas9 gene knockout screening to characterize cellular responses to LINE-1 expression. We find that LINE-1 expression in non-transformed cells triggers p53-p21 mediated G1 arrest. Along with studies that place p53 as an upstream repressor of LINE-1 expression, our findings explain associations between LINE-1 expression and TP53 loss in human cancers12,25,27. Interestingly, while TP53 loss promotes cell growth absent LINE-159, we find LINE-1 enhances the relative growth advantage conferred by TP53 mutation, raising the possibility that LINE-1 expression early in tumorigenesis may select for TP53 mutations. This may be relevant in ovarian cancer where LINE-1 expression and fixation of p53 mutations appear to be essentially concordant events in serous tubal intraepithelial carcinoma (STIC) precursor lesions60,61. Similarly, with implications for colon cancer development, we find LINE-1 enhances growth advantages conferred by APC mutation in p53-deficient cells. APC loss is an early event in these malignancies that can be antedated by LINE-1 expression and retrotransposition22,38.
TP53 loss in turn tolerizes cells to LINE-1 expression. Based on a genome-wide CRISPR knockout screen, though, we find that LINE-1 expression confers specific molecular requirements for cell growth in a TP53-deficient background. LINE-1(+) cells rely on RNA processing machinery, including complexes that degrade RNA and spliceosome components. The former may directly act on retrotransposition intermediates47. Compromised splicing may lead to the accumulation of dsRNA and exacerbate interferon responses to LINE-1 expression, or to an excess of transcriptional R-loops on chromatin that pose barriers to DNA replication62.
Most significantly, our data indicate that retrotransposition conflicts with DNA replication. This model was suggested by the reliance of LINE-1(+), p53-deficient cells on replication-coupled DNA repair pathways mediated by FA-BRCA. All FA complex components show synthetic lethal interactions with LINE-1 expression in our experimental system. Further, we demonstrate that the FA complex assembles in S phase of the cell cycle in a manner that depends on LINE-1 enzymatic activity. Consistent with the importance of FA in reducing LINE-1 lesions, tumors that frequently express LINE-1 tend to amplify FA genes12,49. Similarly, we find LINE-1(+) cells have unique requirements for replication stress signaling pathways (ATRIP, 9-1-1 complex components), replication fork protection (RADX), and fork restart factors (BLM and WRN helicases). We corroborate these genetic interactions biochemically by showing LINE-1 ORF2p enzymatic activities induce replication stress. Importantly, both EN and RT activities are required to observe FA pathway activation as well as replication stress responses. Based on what is known about target-primed reverse transcription (TPRT), this observation suggests that that the branched LINE-1 insertion intermediate structures create physical blockades to replication fork progression.
This model is further substantiated by independent, orthogonal observations in our field. In in vitro experimental systems, there is a predilection for de novo LINE-1 insertions to occur in S phase63. Moreover, recent studies mapping LINE-1 insertion sites in vitro64,65 and in vivo in a wide variety of human cancers66 indicate non-random distributions of insertions with respect to DNA replication timing. Finally, FA and BRCA1 inhibit LINE-1 retrotransposition, as has been shown by Wysocka5 and Boeke67. These findings indicate that retrotransposition is occurring in association with DNA replication, and that replication-coupled DNA repair pathways are likely reducing retrotransposition intermediates. Loss of these repair pathways enhances both retrotransposition and LINE-1-associated toxicity.
We propose that the most crucial retrotransposition intermediates are found in unreplicated, double-strand DNA positioned to collide with replication forks. It is possible that multiple intermediates form in each cell, and that most are normally reduced by FA repair or other mechanisms rather than resolved into new genomic insertions. Considering that LINE-1 is aberrantly expressed in half of human cancers12 and many malignancies acquire between tens and thousands of somatic LINE-1 insertions14-21,23,26, retrotransposition potentially represents a significant source of endogenous replication stress and genomic instability in these malignancies.
Our findings underscore that limits on LINE-1 expression are required in order to preserve cell growth, and indeed we began our study based on evidence of one tumor that lost LINE-1 expression and subsequently grew faster. Moreover, we provide the first evidence of unique molecular vulnerabilities in LINE-1(+) cells, which has significant implications for translational cancer research. From a therapeutic perspective, it is possible that LINE-1(+) cancers will have characteristic drug sensitivities; for example, LINE-1 ORF2p expression and retrotransposition may prove a biomarker for tumors that respond to DNA damaging agents, or inhibitors of ATR68 or WRN helicase69. We also demonstrate that LINE-1 promotes a type I interferon (IFN) response, suggesting roles for LINE-1 in sensitivities to immunotherapies or ADAR inhibition48,70. Experiments in disease-specific model systems that recapitulate chronic LINE-1 exposure are needed to address these possibilities.
Methods
Experimental model and subject details
Cell lines
We used Tet-On 3G HEK293 cells (ClonTech), Tet-On HEK293T (from JD Boeke40), Tet-On 3G Hela (ClonTech), HEK293FT (AJ Holland), hTERT-RPE1puroS (from AJ Holland71), and hTERT-RPE1puroS-Cas9 (from AJ Holland71). RPE cells have been authenticated by STR profiling. Cells were grown in DMEM (293, HeLa) or DMEM/F12 with 1.5% sodium bicarbonate (RPE) with 10% Tetracycline-free Fetal Bovine Serum (Takara Bio USA). Cells were cultured at 37C, 5% CO2. Antibiotic selection was performed with puromycin (1 μg/ml), G418 (400 μg/ml), or blasticidin (10 μg/ml). Doxycycline was used at 1 μg/ml unless otherwise stated. Cells were tested and mycoplasma negative.
TP53KD Generation
For shRNA growth experiments, TP53WT RPE-Cas9 cells were transduced with pOT-p53-shRNA-TagRFP72 or pSicoR-mCh_empty, then transfected with LINE-1 or eGFP plasmids. To generate monoclonal knockout cells, RPE-Cas9 cells were transduced with pOT-p53-shRNA-TagRFP lentivirus and single RFP+ cells were sorted by a FACS Aria into 96-well plates. Monoclonal cell lines were screened for p53 knockdown by western blot in cells treated with 200 ng/ml doxorubicin.
Tet-On RPE Generation
TP53WT or TP53KD cells were transfected with sleeping beauty transposase plasmid (pCMV(CAT)T7-SB100) and a donor plasmid containing Tet-inducible codon-optimized LINE-1 (ORFeus) or Luciferase (pDA091, pDA093, pDA094, pDA095) following published guidelines73. Cells were selected in G418 for 1 week, then sorted into 96-well plates by fluorescence. Monoclones were screened for luciferase induction with the ONE-Glo assay (Promega, Madison, WI) or ORF1p protein induction by western blot.
Method Details
Viability Assessments
Viability was determined by clonogenic growth or CellTiter-Glo assay (Promega, Madison, WI). WT RPE were assessed by clonogenic growth by transfecting 1e5 cells with 2 μg eGFP (pDA083) or 3 μg LINE-1 (pDA077) plasmid to achieve equimolar ratios. Cells were split to 10cm growth dishes and selected with G418 24 hours later. In Tet-On assays, 500 cells were plated and doxycycline was added to activate transgene expression. For MMC sensitivity experiments, cells were treated with 100 pM, 1 nM, 10 nM, and 100 nM for 24 hours on day 2 after plating. In VE-821 sensitivity, cells were treated with 1 μM drug or DMSO vehicle throughout the duration of the experiment. For assays in CRISPR knockout cells, knockout cell pools were generated by infecting TP53KD Tet-On RPE cells with lentivirus encoding either non-targeting control or a gene targeting guide and selecting with puromycin for 1 week (see supplementary Table 6 for guide sequences). For all assays, after 10-14 days of L1 or control expression, colonies were washed with PBS and fixed (6% gluteraldehyde, 0.5% crystal violet) for 10 minutes. Plates were rinsed in water and airdried, then imaged on a flatbed scanner. Colonies with >50 cells were counted.
A similar procedure was used for clonogenic assays in 293 cells, except that 1e5 cells were transfected with LINE-1 (pDA056) and blasticidin-selected, then 500 cells were plated on poly-D-lysine (Sigma) coated plates and LINE-1 was induced with 1 μg/ml doxycycline before colony fixation. Growth was quantified based on % plate confluence using ImageJ.
CellTiter-Glo assays were performed in 293T cells transfected with LINE-1 (pDA007), LINE-1 ORF2 H230A (pDA025), LINE-1 ORF2 D702Y (pDA034), LINE-1 ORF2 H230A/D702Y (pDA027), or empty vector (pDA019). 8,000 cells were plated per well and treated with doxycycline (0-1000 ng/ml) for 72 hours. CellTiter reagents were then added and luminescence was measured using a Glomax Multi+ Detection System (Promega, Madison, WI).
CRISPR Knockout Screening
We used the Brunello GPP pooled CRISPR knockout library packaged into lentivirus for screening74. The library comprises 76,441 gRNAs targeting 19,114 genes, with 4 sgRNAs per gene. TP53WT-Cas9 cells were transduced at 100-fold library representation at a multiplicity of infection (MOI) of 0.2, in duplicate. TP53KD-Cas9 with LINE-1 or luciferase transgenes were transduced at 100-fold library representation at an MOI of 0.3, in triplicate. Knockout pools were puromycin-selected for 8 days. TP53WT-Cas9 cells were transfected with LINE-1 (pDA077) or eGFP (pDA083) at 150-fold library representation and assayed for library representation at day 19. TP53KD-Cas9 cells were started at 500-fold library representation and maintained at 200-fold representation during passages through day 27. For TP53KD-Cas9 screens, cells were continuously doxycycline-treated and sampled every 4-5 days. Cells were lysed (50 mM Tris, 50 mM EDTA, 1% SDS, pH 8), incubated with RNase A and Proteinase K, and DNA was extracted by isopropanol precipitation. DNA concentrations were measured by Nanodrop. Library preparation was performed with a 1-step PCR by Q5 Hot-start polymerase master mix (cat# M0494, NEB, Ipswich, MA (98C for 30 seconds; 24 cycles: 98C for 5 seconds, 68C for 30 seconds, 72C for 30 seconds; 72C for 2 minutes; hold at 10C). See supplementary Table 6 for primer sequences. Barcoded libraries were quantified using the NEB Library Quant Kit and mixed to obtain equal coverage, then sequenced with single-end 75 base reads on an Illumina NextSeq 500.
Samples were demultiplexed and 20 bp CRISPR sgRNA sequences were aligned to the Brunello reference index using Bowtie75, allowing no mismatches. We restricted our analysis to genes with FPKM > 1 in RPE cells76. Read count data was analyzed to quantify knockout cell proportions with MAGeCK software v0.5.6 or v0.5.777 with the following key parameters: --norm-method control, --additional-rra-parameters '--permutation 10000 --min-percentage-goodsgrna 0.6'. Gene pvalues from MAGeCK were converted into Z scores and combined by Stouffer’s method (); i = gene ID, n = total number of timepoints in which gene i was identified. We filtered this list by limiting the number of overlapping 95% confidence intervals among timepoints to fewer than 5. Gene knockouts with differential fitness effects on LINE-1(+) cells as compared to control were analyzed for overrepresentation of GO terms using Webgestalt78. Individual GO categories were then analyzed in StringDB79 to generate network plots. To determine enrichment of genes encoding nuclear proteins, we used a Chi-square test following the null hypothesis that only 35.2% of genes should encode nuclear proteins based on the genetic composition of the Brunello library. Analysis of HUSH complex genes was pursued based on knowledge of the LINE-1 literature, as this complex is not annotated in current gene sets.
RNAseq analysis
LINE-1 or luciferase was induced for 3 days with 1 μg/ml doxycycline and RNA was collected with the Quick-RNA Microprep kit (Zymo). Libraries were prepared with the TruSeq stranded mRNA library preparation kit (Illumina). Paired-end 150bp reads were obtained on an Illumina HiSeq4000. Demultiplexed libraries were aligned to hg38 using STAR v2.4.5. Quantification and differential expression analysis was performed using the HTseq and DESeq2 packages in R. For gene set enrichment analysis, we isolated genes with ∣log2Fold-Change∣ > 1 and p-adjusted < 1.8e-6 and used GSEA software v2.0 from the Broad Institute against Hallmark, Biocarta, KEGG, and Reactome genesets v6.2. We used log2 Fold-Change values to perform a pre-ranked analysis. Direct and indirect target genes are curated from published reports80,81. Cell cycle phase genes were curated from CycleBase 3.082.
Western blots
Cells were lysed in RIPA buffer with protease/phosphatase inhibitor (cat# 5872, Cell Signaling Technology, Danvers, MA) or Laemmli Sample Buffer (cat# 1610747, Biorad, Hercules, CA) by sonication. PAGE was carried out with manufacturer-recommended buffers on 4-20% or 7.5% Mini TGX Gels (Biorad), NuPAGE 4-12% BisTris gels, or NuPAGE 3-8% Tris-Acetate gels (Thermo). Semi-dry transfers were carried out for Biorad gels or NuPAGE BisTris gels at 2.5A for 5-15 minutes using the Trans-Blot-Turbo (Biorad). Wet transfers were carried out for Tris-Acetate gels at 30V overnight. All blocking was performed with Odyssey Blocking Buffer (Licor). Primary antibodies were incubated with membranes overnight at 4C, then infrared-conjugated secondaries (Licor) were added 1:10,000 and imaged on a Licor Odyssey Scanner. Quantifications were carried out using Image Studio v4.0. Blots were stripped with Reblot Plus Strong Solution (Millipore Sigma). A list of antibodies used can be found in the Supplementary Methods Key Reagents table.
Cloning
Plasmids used in this study are listed in Supplementary Table 5. The mammalian expression vector pCEP4 (Invitrogen) was modified to possess a 2nd or 3rd Generation Tet-inducible promoter (ClonTech) by Gibson assembly. LINE-1 sequences were inserted into the vector backbone by Gibson assembly with PCR amplicons of endogenous LINE-1 sequence (LINE-1 RP) or ORFeus codon-optimized sequence83. Control pCEP4 vectors encoded either eGFP or lacked expression inserts. LINE-1 point mutant constructs were also created by amplification and Gibson assembly. For sleeping-beauty integrated LINE-1, ORFeus codon-optimized LINE-1 was cloned into the donor vector pSBtet-RN or pSBtet-GN84 by Gibson assembly. Briefly, pSBtet-RN or GN was digested with SfiI and DraIII, gel purified and assembled with PCR-amplified LINE-1 (primers SB-ORFeus-5 and SB-ORFeus-3 in Supplementary Table 6) using the HiFi 2X Assembly Master Mix (NEB, Ipswich, MA).
Single-gene CRISPR Knockout Cell Generation
To validate screen hits, 20bp CRISPR sgRNAs were cloned into the pLentiGuide-Puro vector digested with BstBI restriction enzyme as previously described85 and the plasmids packaged into lentivirus. We selected sgRNAs that were enriched in the screens. See Supplementary Table 6 for sgRNA sequences. Cells were incubated with lentiviral supernatants supplemented with 10 μg/ml polybrene for 24 hours, then selected with puromycin for 1 week, and used in downstream clonogenic assays and western blots.
Transfection
293 and Hela cells were transfected with Fugene HD reagent (Promega, Madison, WI) following standard protocols. RPE cells were transfected using midi- or maxi- prepped plasmid DNA with Viafect reagent (Promega, Madison, WI) at a DNA:Viafect ratio of 1:3.
Lentivirus packaging
293FT cells were transfected with Fugene HD (Promega, Madison, WI) following the manufacturer’s recommendations. Insert vector was added to packaging plasmids pMD.G and psVAX2 at a ratio of 3:4:1 by mass. Media was changed after 24 hours and 48 hours and viral supernatants were collected and filtered through 0.45 um filters. For screen libraries, complex lentivirus pools were packaged by a similar method by Applied Biological Materials Inc. (Richmond, BC, Canada).
Retrotransposition reporter assay
We used an eGFP reporter assay to measure retrotransposition86. 2e5 RPE cells were transfected with 2 ug LINE-1 reporter plasmids (MT525, JM111) or 2 ug eGFP plasmid and selected with 1 μg/ml puromycin for 12 days. Cells were trypsinized and resuspended in cytometry buffer (Hanks Balanced Salt Solution, no phenol red, 1% FBS, 1 mM EDTA) at a concentration of ~1e6 cells / mL, then analyzed on a BD Accuri C6 Flow Cytometer. Singlets were gated on SSC-A/SSC-H and FSC-A/FSC-H, then eGFP thresholds were set such that untransfected cells showed 0.1% eGFP+ cells. We normalized the %GFP+ cells in experimental groups to %GFP+ in eGFP-controls.
Nucleoside Reverse Transcriptase Inhibitor Treatments for qRT-PCR
250,000 Tet-On TP53KD cells expressing Luciferase or LINE-1 were plated in T25 flasks with 1 ng/mL doxycycline added and treated with 5 μM zalcitabine (ddC) or 5 μM didanosine (ddI) for 72 hours. Cells were lysed and RNA were extracted using Quick-RNA MicroPrep kit (Zymo Research).
qRT-PCR
cDNA was generated using the iScript kit (Biorad, Hercules, CA) following RNA extraction using the Quick-RNA Microprep kit (Zymo). Primers were designed using Primer3 and tested against cDNA to ensure single bands were generated in the PCR. Real-time PCR was performed for 40 cycles (98C × 15 seconds, 60C × 30 seconds) using SSOAdvanced 2X Master mix (Biorad) on the MyIQ cycler (Biorad). Fold-change expression was determined by the 2−ΔΔCt method. See Supplementary Table 6 for primer sequences.
Immunofluorescence Imaging
HEK293T cells were transfected with doxycycline-inducible LINE-1 plasmid (pDA055) and stably-selected with hygromycin for 2 weeks. 5,000 cells were plated in a black 96-well, glass-bottom plate (Corning, cat#3603), treated with doxycycline (0 to 5,000 ng/mL, 24 hours), fixed (3% paraformaldehyde, 10 minutes), permeabilized (0.5% Triton X-100/PBS-Glycine, 3 minutes), and blocked (1% BSA/PBS-Glycine, 30 minutes). Primary antibodies: ORF1p and FLAG, both at 1:500 dilution; Hoechst 33342 (1:50 dilution, Sigma) for nuclear DNA; and HCS CellMask deep red cytoplasmic stain (1:20000 dilution, Invitrogen). Secondary antibodies: anti-rabbit Alexa Fluor 488 (1:200, Invitrogen) and anti-mouse Alexa Fluor 568 (1:200, Invitrogen). Imaging performed with a TE300 epifluorescent microscope (Nikon, Melville, NY) with a motorized stage and excitation/emission filters (Prior). Images acquired with a DS-QiMc camera at low magnification (20X Plan Fluor lens; 0.285 μm/pixel, Nikon) using Nikon Elements software (Nikon). Twenty-five images were acquired per sample in a 5×5 grid (1.88 mm2). Images analyzed using a custom MATLAB software87 to segment single cells using the HCS CellMask stain and nuclei using Hoechst 33342. Accurate cell segmentation was manually verified to create a subset of 100 single cells in which ORF1p and ORF2p signal strengths were measured as the total intensity within each segmented cell for each fluorescence channel.
Nuclear Foci Quantification
We used either Tet-On TP53KD cells expressing Luciferase or LINE-1 or HeLa cells transfected with doxycycline-inducible LINE-1 plasmids (pDA007, pDA025, pDA027, pDA033, pDA019) and stably-selected with puromycin for 1-2 weeks. Positive controls were treated with either 6mM hydroxyurea for 4 hours or 200ng/mL doxorubicin for 2 hours. 100,000 cells were plated on cover slips and treated with 1000 ng/ml doxycycline for 72 hours. EdU was added for 2 hours and cells were pre-treated with 0.5% Triton X-100 for 5 min, fixed with 3.7% paraformaldehyde for 10 minutes, then permeabilized with 0.5% NP-40 for 10 minutes. EdU Click-iT reaction (ThermoFisher) was performed following manufacturer’s instructions. Slides were blocked (1% BSA/PBS-Glycine, 30 minutes) and incubated with polyclonal rabbit FANCD2 (1:1000, Novus Biologicals), rabbit 53BP1 (1:500, Novus Biologicals), or mouse γH2A.X (1:1000, Millipore) for 1 hour at room temperature and then anti-rabbit Alexa Fluor 488 for FANCD2 (1:200, ThermoFisher) and anti-rabbit Alexa Fluor 488 (1:2000, ThermoFisher) and anti-mouse Alexa Fluor 555 (1:2000, ThermoFisher) for 53BP1 and γH2A.X, respectively. Slides were imaged at low magnification with the same equipment as described above with key methodological differences. Randomly-selected nuclei (>200 per sample) were imaged at high magnification. Foci were quantified using a previously published method in MATLAB88. We categorized cells as S phase (EdU+) or G1/G2 phase (EdU-) and excluded cells with sub-2n DNA content (dying cells). We compared foci counts using unpaired two-sided T-tests.
Transposon Insertion Sequencing (TIP-seq) and PCR validations
Tissues for TIP-seq were acquired as flash-frozen de-identified surgical specimens. Small sections of each frozen tissue sample were isolated and TIP-seq was performed as previously described18,23,89. Briefly, 10 μg of DNA was digested with AseI, BspHI, BstYI, HindIII, NcoI, or PstI (NEB). Vectorettes matching the sticky ends were ligated and touchdown PCR was run with an L1PA1-specific primer (5′-AGATATACCTAATGCTAGATGACACA-3′) and ExTaq HS polymerase (Takara Bio; Shiga, Japan). We combined six PCR reactions for each sample and purified the DNA for sequencing library preparation shearing amplicons to an average size of 300 bp. We then performed end-repair, dA-tailing and index-specific adaptor ligation steps according to Illumina's TruSeq DNA Sample Prep v4 kit protocol (Illumina; San Diego, CA). Using 2% Size-Select E-gels (Life Technologies; Carlsbad, CA), we size-selected our adaptor-ligated DNA at approximately 450 bp before performing a final PCR amplification. After purifying the PCR amplified libraries, we submitted them for quality control and Illumina HiSeq4000 150-bp paired-end sequencing at the NYU Genome Technology Center. Insertions were called using TIPseqHunterV223 after alignments to hg19. We validated insertions by designing PCR primers with Primer3 and amplifying the insertions. We performed genotyping PCR reactions using 1 ng input DNA of both flash-frozen surgical specimens and DNA obtained from formalin-fixed paraffin embedded tissue using the QIAamp DNA FFPE Tissue Kit (Qiagen).
Quantification and Statistical Analysis
In CRISPR KO screens and RNAseq analyses, statistical testing was included in the software packages (MAGeCK, DESeq2, WebGestalt, GSEA, StringDB). For all other analyses, appropriate statistical tests were performed using R, which is indicated in figure legends. Tests were typically unpaired and included both one- and two-sided T tests or ANOVA depending on the a priori hypothesis.
Reporting Summary
Further information on experimental design is available in the Nature Research Reporting Summary linked to this article.
Data Availability Statement
MAGeCK-normalized sgRNA read counts from CRISPR KO screens and RNAseq counts and differential expression values have been deposited in the GEO database under accession number GSE119999. Source data for 2b, 5c, 5e, 5f, 6d, and 6e are available online.
Requests for resources and reagents should be directed to and will be fulfilled by Kathleen H. Burns (kburns@jhmi.edu). Select plasmids created in the Burns Lab can be accessed at Addgene (https://www.addgene.org/Kathleen_Burns/).
Extended Data
Extended Data Fig. 1. LINE-1 heterogeneity in colon cancer.
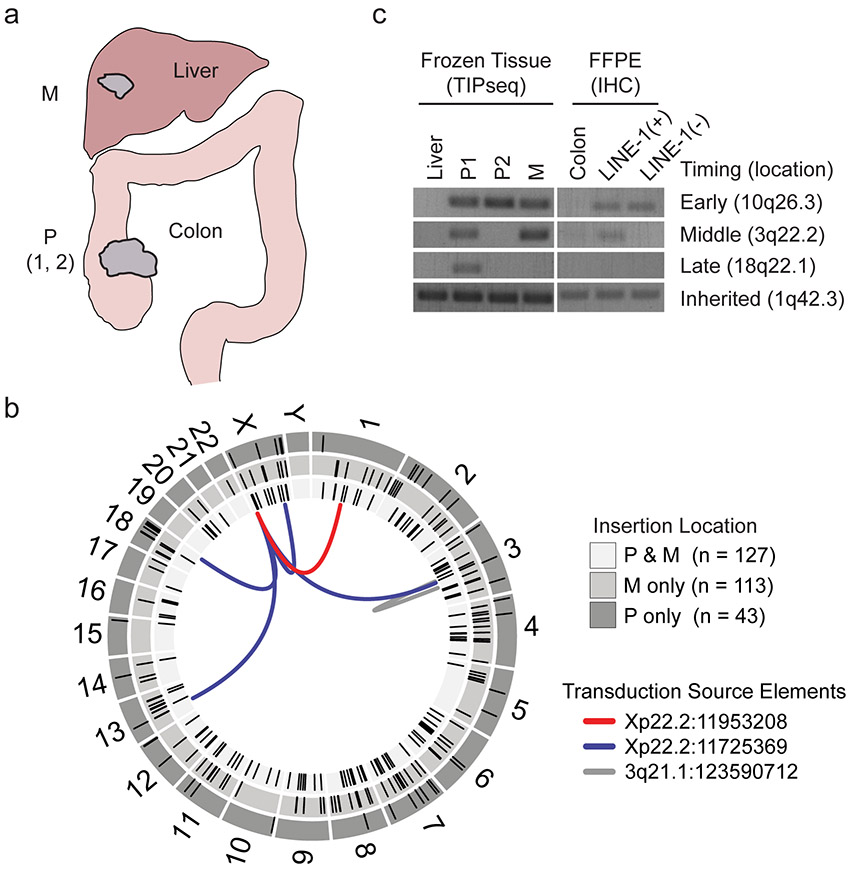
(a) Tissues collected for transposon insertion profiling by sequencing (TIP-seq) mapping of tumor-specific LINE insertions. Fresh frozen tissue was collected from two sites in the primary tumor in the colon and one site in the metastatic tumor in the liver. Normal tissue was collected from the liver. The liver metastasis exhibited ORF1p immunoreactivity as well (data not shown). (b) Circos plot detailing TIP-seq results and whether insertions were found in the primary (P only), metastasis (M only) or in both (P & M). In the validation process, we identified 11 3’ transduction events, 6 of which mapped to two LINE-1 sequences on Xp22.2 and one on 3q21.1 that are known to be highly active tumor alleles. As expected, the majority of this tumor’s de novo insertions were intronic or intergenic and not near known tumor suppressors or oncogenes. (c) We genotyped the insertions using hemi-specific PCR in genomic DNA obtained from dissected histology slides and compared to the allele’s presence in bulk frozen tissue used for TIP-seq. In all samples, we detected an inherited LINE-1 on 1q42.3, indicating that our PCR conditions were sufficient to detect LINE-1 elements. An early de novo insertion on 10q26.3 was found in all frozen tissue samples (primary and metastasis) and both CDX2-high and CDX2-dim slide-dissected samples. An insertion on 3q22.2 is present in the primary tumor subclonally and in the metastasis and therefore occurred before metastasis but after dedifferentiation of the CDX2-dim clone. An insertion on 18q22.1 occurred after metastasis to the liver had occurred, since it was found in the primary CDX2-high clone and not in the metastasis.
Extended Data Fig. 2. LINE-1 effects on cell growth and retrotransposition.
(a) Demonstration of effective TP53 knockdown. RPE cells were treated with TP53 shRNA lentivirus (DA079) or control lentivirus (DA081). The Western blot shows the p53 response to treatment with the DNA intercalator doxorubicin (200 ng/ml for 24 hours). (b) Left, the retrotransposition reporter assay. LINE-1 is expressed from a plasmid with an antisense eGFP in the 3’UTR that is interrupted by a sense intron. During transcription, the intron is spliced, reconstituting the coding potential of the eGFP reporter. The eGFP reporter carries with it a CMV promoter and is inserted into the genome by LINE-1. Expression of eGFP from the genome allows for fluorescence-based quantification of retrotransposition rate by flow cytometry. Right, reporter assay performed in RPE with TP53 knockdown or control ±SEM, n=3 independent experiments. P value was calculated by two-sided T test. (c) Normalized median read counts of sgRNAs targeting TP53 and CDKN1A in cells expressing either LINE-1 (navy blue) or eGFP (green) control compared to non-targeting-controls (NTC). Individual sgRNAs are indicated by circles or triangles. Results from two biological replicates are depicted.
Extended Data Fig. 3. LINE-1 RNAseq analysis.
(a) Genes regulated by cell cycle were curated from CycleBase v3.081 and differential expression values were plotted. S, G2, and M phase genes were significantly downregulated in LINE-1(+) cells. Unpaired two-sided T tests were used for statistical testing. N/A = not applicable. *p-values vs. N/A: G1 = not significant (n.s.), G1/S = 1.7e-9, S = 1.5e-2, G2 = 2.1e-13, G2/M = 5.2e-6, M = 3.4e-10. (b) Flow cytometry was used to assess cell cycle by quantifying DNA content using a PI DNA stain in Tet-On LINE-1 or Tet-On luciferase cells induced with 1 μg/ml doxycycline for 48 hours. LINE-1(+) cells with wildtype (WT) p53 accumulated in G1 phase (2n DNA copy number), whereas TP53 knockdown (KD) resulted in more even cell cycle proportions. These data are from one experiment. (c) Relative fold-change of interferon-stimulated genes in LINE-1 compared to luciferase-expressing cells measured by RNAseq. Error bars indicate SEM. (d) RNAseq analysis revealed upregulation of NF-kB and several target genes in LINE-1(+) cells. Error bars indicate SEM. (e) Differential expression of IFNB1 (right) and interferon-stimulated genes (left) in p53-knockdown cells expressing LINE-1 or luciferase for 72 hours. Measured by qRT-PCR. Error bars indicate SD, n=3 biological replicates. * p < 0.05, ** p < 0.001. (f) Differential expression of TLR3, IFIT1, and IFIT2 with the addition of 5μM zalcitabine (ddC) or 5μM didanosine (ddI) in p53-knockdown cells expressing LINE-1 or luciferase for 72 hours. Measured by qRT-PCR, n=3 independent experiments. P values indicated within the plots.
Extended Data Fig. 4. TP53-Knockdown Screen Supplement.
(a) Behavior of non-targeting-control sgRNAs in the screen over time. Data points indicate the median sgRNA count per replicate and error bars the 95% confidence interval. (b) Behavior of TP53- and CDNK1A-targeting sgRNAs. Median values are depicted with 95% Confidence Intervals. There is no appreciable change in TP53 sgRNA representation between LINE-1(+) and luciferase control cells, indicating loss of p53 function due to the shRNA. CDNK1A sgRNAs do not differ between groups as well, suggesting that CDKN1A effects are contingent on p53 function. (c) Examples of essential gene knockouts that deplete from both LINE-1(+) and luciferase(+) cells. Median values are depicted with 95% Confidence Intervals. (d) Knockout of APC provides a growth advantage to LINE-1(+) cells. Median values are depicted with 95% Confidence Intervals. (e) Knockout of the interferon alpha and beta receptor subunit 1 (IFNAR1) but not subunit 2 (IFNAR2) provides a growth advantage in LINE-1(+) cells. Median values are depicted with 95% Confidence Intervals.
Extended Data Fig. 5. HUSH knockout is synthetic lethal due to derepression of the LINE-1 transgene.
(a) Gene screen ranks by Zs scores. HUSH genes are in blue. (b) HUSH complex sgRNA performance during the screen. All knockouts drop out early from LINE-1(+) cells (red) and do not affect growth of luciferase(+) cells (black). Median values are depicted with 95% Confidence Intervals. (c) 12-day clonogenic growth assay in cells expressing LINE-1 (doxycycline-induced) with targeted knockouts of HUSH components compared to non-targeting-control (NTC). n=3 independent experiments. Error bars indicate ±SEM. P values calculated by one-sided T test. (d) Western blot comparing ORF1p and ORF2p expression in HUSH knockout cells or non-target-controls (NTC) that have not been treated with doxycycline compared to NTC with 24 hours of 1 μg/ml doxycycline treatment. ORF1p and ORF2p protein expression are only detected in NTC-treated cells with doxycycline added to the culture media. The double banding pattern for ORF1p is consistently seen with codon-optimized LINE-1. (e) Western blot comparing ORF1p and ORF2p expression 24 hours after 1 μg/ml doxycycline treatment in HUSH knockouts compared to NTC. The ORF2p antibody cannot distinguish between endogenous or transgenic LINE-1 expression. (f) qRT-PCR analysis of LINE-1 transgene expression in HUSH knockouts compared to NTC (induced with 1 μg/ml doxycycline). Because the LINE-1 transgene is codon-optimized, qRT-PCR is specific for the transgene and does not amplify endogenous LINE-1 sequences. *p < 0.001. (g) Linear regression plot of LINE-1 transgene expression and ORF1p and ORF2p protein expression in HUSH knockouts compared to NTC. Shaded area indicates 95% confidence interval for regression line. Both ORF1p and ORF2p increase in expression with higher transgene mRNA expression, although the increase in ORF1p is minimal compared to that observed with ORF2p. (h) Heatmap of immunofluorescence imaging depicting the proportion of cells expressing ORF1p and ORF2p at different levels in HEK293T cells expressing Tet-On LINE-1 (pDA055) at increasing doses of doxycycline.
Extended Data Fig. 6. RNA processing gene knockouts sensitize cells to LINE-1.
(a) StringDB network plot of the 81 mRNA processing genes identified by this screen. Edges indicate known protein-protein interactions. This network is enriched for spliceosome machinery (green nodes). (b) Screen behavior of significant genes belonging to the spliceosome KEGG GO term. Median sgRNA counts are depicted with 95% Confidence Intervals. (c) Clonogenic assay (12 days) comparing growth of luciferase(+) and LINE-1(+) cells (induced with 1 μg/ml doxycycline) treated with 1 nM pladienolide B (PLA-B) or vehicle (DMSO). n=3 independent experiments. Error bars indicate SEM. P value calculated by unpaired one-sided T test. (d) Behavior of nuclear exosome complex genes in the screen. Median values are depicted with 95% Confidence Intervals. (e) Behavior of RNASEH2 component sgRNAs in the screen. Median values are depicted with 95% Confidence Intervals. (f) Behavior of ADAR1 sgRNAs in the screen. Median values are depicted with 95% Confidence Intervals.
Extended Data Fig. 7. The Fanconi Anemia Pathway is required for growth of LINE-1(+) cells.
(a) Behavior of sgRNAs targeting Fanconi Anemia pathway genes in the screen. Median values are depicted with 95% Confidence Intervals. (b) Western blot of DNA damage marker γH2A.X in chromatin-bound protein fractions of LINE-1(+) cells with or without perturbations to the FA pathway. H3 was used as loading control. γH2A.X levels were quantified and graphed relative to NTC-treated, LINE-1(+) cells. (c) Clonogenic assay (day 10). TP53KD cells constitutively expressing Cas9 are treated with lentivirus encoding non-targeting-control (NTC) or FANCD2 sgRNA and then transfected with eGFP (pDA083) or the native LINE-1 sequence L1RP (pDA077). Left, representative images of colonies. Scale bar = 1 cm. Right, data are presented as the rate of LINE-1 per 100 eGFP colonies ± SD to control for transfection efficiency across samples, n=3 independent experiments. P value obtained by unpaired two-sided T test. (d) Quantification of FANCD2 foci in G1 and G2 phase (EdU-) HeLa cells. Number of cells per group: G1 untreated (n=104), G1 HU (n=352), G1 wildtype LINE-1 (n=186), G1 RT (D702Y) (n=138), G2 untreated (n=60), G2 HU (n=58), G2 wildtype LINE-1 (n=42), G2 RT (D702Y) (n=32). Two-sided T tests were used for statistical comparisons. HU = hydroxyurea. RT = reverse transcriptase. ns = not significant.
Extended Data Fig. 8. Viability assays with LINE-1 mutants.
(a) Tet-On constructs for wildtype and mutant LINE-1 expression. (b) Viability of HEK293T cells after 4 days expressing LINE-1 or a mutant at increasing doxycycline doses. A multivariate ANOVA (Viability ~ ORF2 * doxycycline) was performed in R to calculate p values for ORF2 mutant status and doxycycline dose. Tests of viability differences among ORF2 mutants were further performed using two-sided T tests at the 1000 ng/ml doxycycline dose. N=6 replicates per doxycycline dose. (c) Western blot of ORF1p and ORF2p 24 hours after inducing protein expression with 1000 ng/ml doxycycline.
Supplementary Material
Acknowledgements
Human Brunello CRISPR knockout pooled library was a gift from David Root and John Doench (Addgene #73178). pSBtet-RN and pSBtet-GN were gifts from Eric Kowarz (Addgene plasmid #60501 and #60503). pCMV(CAT)T7-SB100 was a gift from Zsuzsanna Izsvak (Addgene plasmid #34879). JM111 was a gift from Haig Kazazian. pSicoR-mCh_empty was a gift from Miguel Ramalho-Santos (Addgene #219070). LentiGuide-Puro was a gift from Feng Zhang (Addgene #52963). We thank Jessica Gucwa at the Sidney Kimmel Flow Cytometry Core and the staff of the NYU Genome Technology center. We thank Joel S. Bader for his statistical expertise. We thank Bilal A. Bari, Robert M. Hughes, Bert Vogelstein, John V. Moran, and Haig H. Kazazian for helpful discussion and review of the manuscript. We thank Jeni Fairman of the Department of Art as Applied to Medicine at JHUSOM for illustrations. This study was funded by F30CA221175 (D.A.), P50GM107632 (K.H.B., J.D.B., D.F.), U54CA210173 (P.W.), and the Sol Goldman Pancreatic Research Center (K.H.B., R.H.H.).
Footnotes
Competing Interests
The authors declare no competing interests.
References
- 1.Mathias SL, Scott AF, Kazazian HH Jr., Boeke JD & Gabriel A Reverse transcriptase encoded by a human transposable element. Science 254, 1808–10 (1991). [DOI] [PubMed] [Google Scholar]
- 2.Feng Q, Moran JV, Kazazian HH Jr. & Boeke JD Human L1 retrotransposon encodes a conserved endonuclease required for retrotransposition. Cell 87, 905–16 (1996). [DOI] [PubMed] [Google Scholar]
- 3.Hohjoh H & Singer MF Cytoplasmic ribonucleoprotein complexes containing human LINE-1 protein and RNA. EMBO J 15, 630–9 (1996). [PMC free article] [PubMed] [Google Scholar]
- 4.Woodcock DM, Lawler CB, Linsenmeyer ME, Doherty JP & Warren WD Asymmetric methylation in the hypermethylated CpG promoter region of the human L1 retrotransposon. J Biol Chem 272, 7810–6 (1997). [DOI] [PubMed] [Google Scholar]
- 5.Liu N et al. Selective silencing of euchromatic L1s revealed by genome-wide screens for L1 regulators. Nature 553, 228–232 (2018). [DOI] [PMC free article] [PubMed] [Google Scholar]
- 6.Haoudi A, Semmes OJ, Mason JM & Cannon RE Retrotransposition-Competent Human LINE-1 Induces Apoptosis in Cancer Cells With Intact p53. J Biomed Biotechnol 2004, 185–194 (2004). [DOI] [PMC free article] [PubMed] [Google Scholar]
- 7.Belgnaoui SM, Gosden RG, Semmes OJ & Haoudi A Human LINE-1 retrotransposon induces DNA damage and apoptosis in cancer cells. Cancer Cell Int 6, 13 (2006). [DOI] [PMC free article] [PubMed] [Google Scholar]
- 8.Gasior SL, Wakeman TP, Xu B & Deininger PL The human LINE-1 retrotransposon creates DNA double-strand breaks. J Mol Biol 357, 1383–93 (2006). [DOI] [PMC free article] [PubMed] [Google Scholar]
- 9.Wallace NA, Belancio VP & Deininger PL L1 mobile element expression causes multiple types of toxicity. Gene 419, 75–81 (2008). [DOI] [PMC free article] [PubMed] [Google Scholar]
- 10.Kines KJ et al. The endonuclease domain of the LINE-1 ORF2 protein can tolerate multiple mutations. Mob DNA 7, 8 (2016). [DOI] [PMC free article] [PubMed] [Google Scholar]
- 11.Luan DD, Korman MH, Jakubczak JL & Eickbush TH Reverse transcription of R2Bm RNA is primed by a nick at the chromosomal target site: a mechanism for non-LTR retrotransposition. Cell 72, 595–605 (1993). [DOI] [PubMed] [Google Scholar]
- 12.Rodic N et al. Long interspersed element-1 protein expression is a hallmark of many human cancers. Am J Pathol 184, 1280–6 (2014). [DOI] [PMC free article] [PubMed] [Google Scholar]
- 13.Ardeljan D, Taylor MS, Ting DT & Burns KH The Human Long Interspersed Element-1 Retrotransposon: An Emerging Biomarker of Neoplasia. Clin Chem 63, 816–822 (2017). [DOI] [PMC free article] [PubMed] [Google Scholar]
- 14.Iskow RC et al. Natural mutagenesis of human genomes by endogenous retrotransposons. Cell 141, 1253–61 (2010). [DOI] [PMC free article] [PubMed] [Google Scholar]
- 15.Lee E et al. Landscape of somatic retrotransposition in human cancers. Science 337, 967–71 (2012). [DOI] [PMC free article] [PubMed] [Google Scholar]
- 16.Shukla R et al. Endogenous retrotransposition activates oncogenic pathways in hepatocellular carcinoma. Cell 153, 101–11 (2013). [DOI] [PMC free article] [PubMed] [Google Scholar]
- 17.Tubio JMC et al. Mobile DNA in cancer. Extensive transduction of nonrepetitive DNA mediated by L1 retrotransposition in cancer genomes. Science 345, 1251343 (2014). [DOI] [PMC free article] [PubMed] [Google Scholar]
- 18.Rodic N et al. Retrotransposon insertions in the clonal evolution of pancreatic ductal adenocarcinoma. Nat Med 21, 1060–4 (2015). [DOI] [PMC free article] [PubMed] [Google Scholar]
- 19.Ewing AD et al. Widespread somatic L1 retrotransposition occurs early during gastrointestinal cancer evolution. Genome Res 25, 1536–45 (2015). [DOI] [PMC free article] [PubMed] [Google Scholar]
- 20.Doucet-O'Hare TT et al. LINE-1 expression and retrotransposition in Barrett's esophagus and esophageal carcinoma. Proc Natl Acad Sci U S A 112, E4894–900 (2015). [DOI] [PMC free article] [PubMed] [Google Scholar]
- 21.Doucet-O'Hare TT et al. Somatically Acquired LINE-1 Insertions in Normal Esophagus Undergo Clonal Expansion in Esophageal Squamous Cell Carcinoma. Hum Mutat 37, 942–54 (2016). [DOI] [PMC free article] [PubMed] [Google Scholar]
- 22.Scott EC et al. A hot L1 retrotransposon evades somatic repression and initiates human colorectal cancer. Genome Res 26, 745–55 (2016). [DOI] [PMC free article] [PubMed] [Google Scholar]
- 23.Tang Z et al. Human transposon insertion profiling: Analysis, visualization and identification of somatic LINE-1 insertions in ovarian cancer. Proc Natl Acad Sci U S A 114, E733–E740 (2017). [DOI] [PMC free article] [PubMed] [Google Scholar]
- 24.Burns KH Transposable elements in cancer. Nat Rev Cancer 17, 415–424 (2017). [DOI] [PubMed] [Google Scholar]
- 25.Jung H, Choi JK & Lee EA Immune signatures correlate with L1 retrotransposition in gastrointestinal cancers. Genome Res (2018). [DOI] [PMC free article] [PubMed] [Google Scholar]
- 26.Schauer SN et al. L1 retrotransposition is a common feature of mammalian hepatocarcinogenesis. Genome Res 28, 639–653 (2018). [DOI] [PMC free article] [PubMed] [Google Scholar]
- 27.Wylie A et al. p53 genes function to restrain mobile elements. Genes Dev 30, 64–77 (2016). [DOI] [PMC free article] [PubMed] [Google Scholar]
- 28.Kawano K et al. HIV-1 Vpr and p21 restrict LINE-1 mobility. Nucleic Acids Res 46, 8454–8470 (2018). [DOI] [PMC free article] [PubMed] [Google Scholar]
- 29.Ruscetti M et al. NK cell-mediated cytotoxicity contributes to tumor control by a cytostatic drug combination. Science 362, 1416–1422 (2018). [DOI] [PMC free article] [PubMed] [Google Scholar]
- 30.Yu Q et al. Type I interferon controls propagation of long interspersed element-1. J Biol Chem 290, 10191–9 (2015). [DOI] [PMC free article] [PubMed] [Google Scholar]
- 31.Bregnard C et al. Upregulated LINE-1 Activity in the Fanconi Anemia Cancer Susceptibility Syndrome Leads to Spontaneous Pro-inflammatory Cytokine Production. EBioMedicine 8, 184–194 (2016). [DOI] [PMC free article] [PubMed] [Google Scholar]
- 32.De Cecco M et al. L1 drives IFN in senescent cells and promotes age-associated inflammation. Nature 566, 73–78 (2019). [DOI] [PMC free article] [PubMed] [Google Scholar]
- 33.Thomas CA et al. Modeling of TREX1-Dependent Autoimmune Disease using Human Stem Cells Highlights L1 Accumulation as a Source of Neuroinflammation. Cell Stem Cell 21, 319–331 e8 (2017). [DOI] [PMC free article] [PubMed] [Google Scholar]
- 34.Simon M et al. LINE1 Derepression in Aged Wild-Type and SIRT6-Deficient Mice Drives Inflammation. Cell Metab 29, 871–885 e5 (2019). [DOI] [PMC free article] [PubMed] [Google Scholar]
- 35.Pfeffer LM The role of nuclear factor kappaB in the interferon response. J Interferon Cytokine Res 31, 553–9 (2011). [DOI] [PMC free article] [PubMed] [Google Scholar]
- 36.Dai L, Huang Q & Boeke JD Effect of reverse transcriptase inhibitors on LINE-1 and Ty1 reverse transcriptase activities and on LINE-1 retrotransposition. BMC Biochem 12, 18 (2011). [DOI] [PMC free article] [PubMed] [Google Scholar]
- 37.Smith G et al. Mutations in APC, Kirsten-ras, and p53--alternative genetic pathways to colorectal cancer. Proc Natl Acad Sci U S A 99, 9433–8 (2002). [DOI] [PMC free article] [PubMed] [Google Scholar]
- 38.Miki Y et al. Disruption of the APC gene by a retrotransposal insertion of L1 sequence in a colon cancer. Cancer Res 52, 643–5 (1992). [PubMed] [Google Scholar]
- 39.Goodier JL, Cheung LE & Kazazian HH Jr. Mapping the LINE1 ORF1 protein interactome reveals associated inhibitors of human retrotransposition. Nucleic Acids Res 41, 7401–19 (2013). [DOI] [PMC free article] [PubMed] [Google Scholar]
- 40.Taylor MS et al. Affinity proteomics reveals human host factors implicated in discrete stages of LINE-1 retrotransposition. Cell 155, 1034–48 (2013). [DOI] [PMC free article] [PubMed] [Google Scholar]
- 41.Moldovan JB & Moran JV The Zinc-Finger Antiviral Protein ZAP Inhibits LINE and Alu Retrotransposition. PLoS Genet 11, e1005121 (2015). [DOI] [PMC free article] [PubMed] [Google Scholar]
- 42.Taylor MS et al. Dissection of affinity captured LINE-1 macromolecular complexes. Elife 7(2018). [DOI] [PMC free article] [PubMed] [Google Scholar]
- 43.Tchasovnikarova IA et al. GENE SILENCING. Epigenetic silencing by the HUSH complex mediates position-effect variegation in human cells. Science 348, 1481–1485 (2015). [DOI] [PMC free article] [PubMed] [Google Scholar]
- 44.Robbez-Masson L et al. The HUSH complex cooperates with TRIM28 to repress young retrotransposons and new genes. Genome Res 28, 836–845 (2018). [DOI] [PMC free article] [PubMed] [Google Scholar]
- 45.Adamson B, Smogorzewska A, Sigoillot FD, King RW & Elledge SJ A genome-wide homologous recombination screen identifies the RNA-binding protein RBMX as a component of the DNA-damage response. Nat Cell Biol 14, 318–28 (2012). [DOI] [PMC free article] [PubMed] [Google Scholar]
- 46.Lubas M et al. Interaction profiling identifies the human nuclear exosome targeting complex. Mol Cell 43, 624–37 (2011). [DOI] [PubMed] [Google Scholar]
- 47.Benitez-Guijarro M et al. RNase H2, mutated in Aicardi-Goutieres syndrome, promotes LINE-1 retrotransposition. EMBO J (2018). [DOI] [PMC free article] [PubMed] [Google Scholar]
- 48.Gannon HS et al. Identification of ADAR1 adenosine deaminase dependency in a subset of cancer cells. Nat Commun 9, 5450 (2018). [DOI] [PMC free article] [PubMed] [Google Scholar]
- 49.Nalepa G & Clapp DW Fanconi anaemia and cancer: an intricate relationship. Nat Rev Cancer 18, 168–185 (2018). [DOI] [PubMed] [Google Scholar]
- 50.Richardson CD et al. CRISPR-Cas9 genome editing in human cells occurs via the Fanconi anemia pathway. Nat Genet 50, 1132–1139 (2018). [DOI] [PubMed] [Google Scholar]
- 51.Moran JV et al. High frequency retrotransposition in cultured mammalian cells. Cell 87, 917–27 (1996). [DOI] [PubMed] [Google Scholar]
- 52.Ward IM & Chen J Histone H2AX is phosphorylated in an ATR-dependent manner in response to replicational stress. J Biol Chem 276, 47759–62 (2001). [DOI] [PubMed] [Google Scholar]
- 53.Her J, Ray C, Altshuler J, Zheng H & Bunting SF 53BP1 Mediates ATR-Chk1 Signaling and Protects Replication Forks under Conditions of Replication Stress. Mol Cell Biol 38(2018). [DOI] [PMC free article] [PubMed] [Google Scholar]
- 54.Shigechi T et al. ATR-ATRIP kinase complex triggers activation of the Fanconi anemia DNA repair pathway. Cancer Res 72, 1149–56 (2012). [DOI] [PubMed] [Google Scholar]
- 55.Cortez D, Guntuku S, Qin J & Elledge SJ ATR and ATRIP: partners in checkpoint signaling. Science 294, 1713–6 (2001). [DOI] [PubMed] [Google Scholar]
- 56.Cimprich KA & Cortez D ATR: an essential regulator of genome integrity. Nat Rev Mol Cell Biol 9, 616–27 (2008). [DOI] [PMC free article] [PubMed] [Google Scholar]
- 57.Bhat KP & Cortez D RPA and RAD51: fork reversal, fork protection, and genome stability. Nat Struct Mol Biol 25, 446–453 (2018). [DOI] [PMC free article] [PubMed] [Google Scholar]
- 58.Feeney L et al. RPA-Mediated Recruitment of the E3 Ligase RFWD3 Is Vital for Interstrand Crosslink Repair and Human Health. Mol Cell 66, 610–621 e4 (2017). [DOI] [PMC free article] [PubMed] [Google Scholar]
- 59.Haapaniemi E, Botla S, Persson J, Schmierer B & Taipale J CRISPR-Cas9 genome editing induces a p53-mediated DNA damage response. Nat Med (2018). [DOI] [PubMed] [Google Scholar]
- 60.Pisanic TR 2nd, et al. Long Interspersed Element 1 Retrotransposons Become Deregulated during the Development of Ovarian Cancer Precursor Lesions. Am J Pathol (2018). [DOI] [PMC free article] [PubMed] [Google Scholar]
- 61.Zhouchunyang X et al. Expression of L1 retrotransposon open reading frame protein 1 (L1ORF1p) in gynecologic cancers. Hum Pathol (2019). [DOI] [PubMed] [Google Scholar]
- 62.Hamperl S & Cimprich KA Conflict Resolution in the Genome: How Transcription and Replication Make It Work. Cell 167, 1455–1467 (2016). [DOI] [PMC free article] [PubMed] [Google Scholar]
- 63.Mita P et al. LINE-1 protein localization and functional dynamics during the cell cycle. Elife 7(2018). [DOI] [PMC free article] [PubMed] [Google Scholar]
- 64.Flasch DA et al. Genome-wide de novo L1 Retrotransposition Connects Endonuclease Activity with Replication. Cell 177, 837–851 e28 (2019). [DOI] [PMC free article] [PubMed] [Google Scholar]
- 65.Sultana T et al. The Landscape of L1 Retrotransposons in the Human Genome Is Shaped by Pre-insertion Sequence Biases and Post-insertion Selection. Mol Cell 74, 555–570 e7 (2019). [DOI] [PubMed] [Google Scholar]
- 66.Rodriguez-Martin B et al. Pan-cancer analysis of whole genomes reveals driver rearrangements promoted by LINE-1 retrotransposition in human tumours. bioRxiv (2018). [Google Scholar]
- 67.Mita P et al. BRCA1 Mediated Homologous Recombination and S Phase DNA Repair Pathways Restrict LINE-1 Retrotransposition in Human Cells. Nature Structural and Molecular Biology (2020). [DOI] [PMC free article] [PubMed] [Google Scholar]
- 68.Lecona E & Fernandez-Capetillo O Targeting ATR in cancer. Nat Rev Cancer (2018). [DOI] [PubMed] [Google Scholar]
- 69.Chan EM et al. WRN helicase is a synthetic lethal target in microsatellite unstable cancers. Nature 568, 551–556 (2019). [DOI] [PMC free article] [PubMed] [Google Scholar]
- 70.Ishizuka JJ et al. Loss of ADAR1 in tumours overcomes resistance to immune checkpoint blockade. Nature 565, 43–48 (2019). [DOI] [PMC free article] [PubMed] [Google Scholar]
Methods-only References
- 71.Lambrus BG et al. A USP28-53BP1-p53-p21 signaling axis arrests growth after centrosome loss or prolonged mitosis. J Cell Biol 214, 143–53 (2016). [DOI] [PMC free article] [PubMed] [Google Scholar]
- 72.Lambrus BG et al. p53 protects against genome instability following centriole duplication failure. J Cell Biol 210, 63–77 (2015). [DOI] [PMC free article] [PubMed] [Google Scholar]
- 73.Grabundzija I et al. Comparative analysis of transposable element vector systems in human cells. Mol Ther 18, 1200–9 (2010). [DOI] [PMC free article] [PubMed] [Google Scholar]
- 74.Doench JG et al. Optimized sgRNA design to maximize activity and minimize off-target effects of CRISPR-Cas9. Nat Biotechnol 34, 184–191 (2016). [DOI] [PMC free article] [PubMed] [Google Scholar]
- 75.Langmead B, Trapnell C, Pop M & Salzberg SL Ultrafast and memory-efficient alignment of short DNA sequences to the human genome. Genome Biol 10, R25 (2009). [DOI] [PMC free article] [PubMed] [Google Scholar]
- 76.Hart T et al. High-Resolution CRISPR Screens Reveal Fitness Genes and Genotype-Specific Cancer Liabilities. Cell 163, 1515–26 (2015). [DOI] [PubMed] [Google Scholar]
- 77.Li W et al. MAGeCK enables robust identification of essential genes from genome-scale CRISPR/Cas9 knockout screens. Genome Biol 15, 554 (2014). [DOI] [PMC free article] [PubMed] [Google Scholar]
- 78.Wang J, Vasaikar S, Shi Z, Greer M & Zhang B WebGestalt 2017: a more comprehensive, powerful, flexible and interactive gene set enrichment analysis toolkit. Nucleic Acids Res 45, W130–W137 (2017). [DOI] [PMC free article] [PubMed] [Google Scholar]
- 79.Szklarczyk D et al. The STRING database in 2017: quality-controlled protein-protein association networks, made broadly accessible. Nucleic Acids Res 45, D362–D368 (2017). [DOI] [PMC free article] [PubMed] [Google Scholar]
- 80.Fischer M Census and evaluation of p53 target genes. Oncogene 36, 3943–3956 (2017). [DOI] [PMC free article] [PubMed] [Google Scholar]
- 81.Fischer M, Quaas M, Steiner L & Engeland K The p53-p21-DREAM-CDE/CHR pathway regulates G2/M cell cycle genes. Nucleic Acids Res 44, 164–74 (2016). [DOI] [PMC free article] [PubMed] [Google Scholar]
- 82.Santos A, Wernersson R & Jensen LJ Cyclebase 3.0: a multi-organism database on cell-cycle regulation and phenotypes. Nucleic Acids Res 43, D1140–4 (2015). [DOI] [PMC free article] [PubMed] [Google Scholar]
- 83.An W et al. Characterization of a synthetic human LINE-1 retrotransposon ORFeus-Hs. Mob DNA 2, 2 (2011). [DOI] [PMC free article] [PubMed] [Google Scholar]
- 84.Kowarz E, Loscher D & Marschalek R Optimized Sleeping Beauty transposons rapidly generate stable transgenic cell lines. Biotechnol J 10, 647–53 (2015). [DOI] [PubMed] [Google Scholar]
- 85.Sanjana NE, Shalem O & Zhang F Improved vectors and genome-wide libraries for CRISPR screening. Nat Methods 11, 783–784 (2014). [DOI] [PMC free article] [PubMed] [Google Scholar]
- 86.Ostertag EM, Prak ET, DeBerardinis RJ, Moran JV & Kazazian HH Jr. Determination of L1 retrotransposition kinetics in cultured cells. Nucleic Acids Res 28, 1418–23 (2000). [DOI] [PMC free article] [PubMed] [Google Scholar]
- 87.Wu PH et al. Evolution of cellular morpho-phenotypes in cancer metastasis. Sci Rep 5, 18437 (2015). [DOI] [PMC free article] [PubMed] [Google Scholar]
- 88.Wu PH, Hung SH, Ren T, Shih Ie M & Tseng Y Cell cycle-dependent alteration in NAC1 nuclear body dynamics and morphology. Phys Biol 8, 015005 (2011). [DOI] [PMC free article] [PubMed] [Google Scholar]
- 89.Steranka JP et al. Transposon insertion profiling by sequencing (TIPseq) for mapping LINE-1 insertions in the human genome. Mob DNA 10, 8 (2019). [DOI] [PMC free article] [PubMed] [Google Scholar]
Associated Data
This section collects any data citations, data availability statements, or supplementary materials included in this article.
Supplementary Materials
Data Availability Statement
MAGeCK-normalized sgRNA read counts from CRISPR KO screens and RNAseq counts and differential expression values have been deposited in the GEO database under accession number GSE119999. Source data for 2b, 5c, 5e, 5f, 6d, and 6e are available online.
Requests for resources and reagents should be directed to and will be fulfilled by Kathleen H. Burns (kburns@jhmi.edu). Select plasmids created in the Burns Lab can be accessed at Addgene (https://www.addgene.org/Kathleen_Burns/).


