

Abstract
Objective
To compare commercial insurance payments for outpatient total knee and hip replacement surgeries performed in hospital outpatient departments (HOPDs) and in ambulatory surgery centers (ASCs).
Data Sources
A large national claims database that contains information on actual prices paid to providers over the period 2014‐2017.
Data Collection
We identified all patients receiving total knee replacement surgery and total hip replacement surgery in HOPDs and in ASCs for each of the 4 years.
Study Design
For each year, we conducted descriptive and statistical patient‐level analyses of the facility component of payments to HOPDs and to ASCs.
Principal Findings
For each procedure and for each year, ASC payments exceeded HOPD payments by a wide margin; however, the gap across settings declined over time. In 2014, knee replacement payments to HOPDs (n = 67) were $6016 compared to $23 244 in ASCs (n = 68). By 2017, payments to HOPDs (n = 223) had grown to $10 060 compared to $18 234 in ASCs (n = 602). Similarly, for hip replacements, HOPD payments (n = 43) rose from $6980 in 2014 to $11 139 in 2017 (n = 206) and in ASCs fell from $28 485 in 2014 (n = 82) to $18 595 in 2017 (n = 465).
Conclusions
Results suggest that for total joint replacement, common perceptions of cost savings from transition of services from hospitals to ASCs may be misguided.
Keywords: ambulatory surgery centers, hospitals, joint replacement, outpatient, payments
What This Study Adds.
Ambulatory surgery centers (ASCs) comprise a rapidly growing sector of surgical service providers recognized as low‐cost alternatives to hospital outpatient departments (HOPDs).
Little is known about costs or commercial prices in ASCs relative to HOPDs.
This study used a large national database to compare commercial insurer payments to ASCs and HOPDs for total knee replacement and total hip replacement surgeries.
ASC payments exceeded HOPD payments by a wide margin suggesting that common perceptions about savings from transition of surgeries out of the hospital to ASCs may be misinformed
1. INTRODUCTION
Reorganization of health care delivery is a key factor in recent efforts to constrain the growing cost of health care in the United States. Surgery, a costly service utilized by tens of millions of Americans annually, is a case in point. With improvements in technology, more surgical procedures are being performed outside the traditional hospital inpatient setting at lower cost, and approximately 80 percent of surgeries now take place at outpatient sites.1 A large portion of these procedures are performed at ambulatory surgery centers (ASCs), a fast‐growing sector of freestanding facilities that provide specialized surgical services but do not provide for overnight stays.
A high‐cost surgical procedure that has been offered in hospital outpatient departments (HOPDs) for several years to commercially insured patients is total joint replacement. Both total knee arthroplasty (TKA) and total hip arthroplasty (THA) are growing in frequency in the United States,2 and recently, ASCs have begun offering these services. According to the Ambulatory Surgery Center Association, more than 200 ASCs were providing outpatient joint replacements in 2017, up from approximately 25 ASCs in 2014.3 As of January 2018, Medicare removed TKA from its inpatient only (IPO) list and began reimbursing for this procedure when performed in HOPDs. Many observers expect Medicare reimbursement for outpatient THA and Medicare coverage of both procedures in ASCs to follow.4
From a policy perspective, the appeal of ASCs relates to their function as a relatively low‐cost setting for provision of value‐based care. In addition to the cost advantage of not keeping patients overnight, ASC specialization fosters better‐tailored facility design, less operating room slack, and more efficient staffing management.5 Procedures performed in ASCs also take less time than the same procedures provided in HOPDs.6 However, because ASCs are not required to submit cost reports to CMS, the overall difference in cost of providing a surgical service in an ASC compared to providing the same service in an HOPD is generally unknown.
Cost efficiency is an important factor in accounting for growth of the ASC sector. However, financial performance is determined on both the cost and revenue sides and value in health care delivery relies on quality of care delivered at suitable prices. Some studies have measured commercial insurance payments to hospitals for TKA and THA, consistently finding that treatment in HOPDs translated into large cost savings to payers.7, 8, 9 However, there is little analysis of TKA or THA in ASCs, and none addressing payments for these services in ASCs relative to hospital HOPD or inpatient settings. One study did examine prices for common ASC procedures across specializations and found that ASCs specializing in orthopedic surgery received relatively high payments compared to those in other specializations for a common procedure, knee arthroscopy. Moreover, ASC payments for knee arthroscopy were comparable to HOPDs for the same service.10
Removal of TKA from the Medicare IPO list has stimulated interest in the HOPD and ASC settings for total joint replacement surgery. However, the majority of ASC revenues come from commercial insurers. This study examined the growing trend in outpatient TKA and THA among the privately insured, focusing on payments to HOPDs relative to ASCs, and in comparison with what Medicare pays HOPDs. Findings suggest that in the case of TKA and THA, common perceptions of health care delivery cost savings owing to transition to ASCs may be misguided.
2. STUDY DATA AND METHODS
2.1. Data
The main data source is MarketScan Commercial Claims and Encounters (MarketScan) obtained from Truven Health Analytics, a division of IBM Watson Health. MarketScan is a large national database containing comprehensive insurance claims for individuals covered by employer‐sponsored health insurance that has been shown to be reasonably representative of the US commercially insured population.11 Each annual release reports on tens of millions of unique patients. We also drew from CMS public use datasets to obtain annual measures of the Medicare Wage Index, which we used to adjust payments for geographic location.
2.2. Methods
We identified all TKA and THA patients treated in HOPDs and in ASCs for each of the years 2014‐2017 using Current Procedural Terminology (CPT) codes 27 447 (TKA) and 27 130 (THA). Procedures covered by Health Maintenance Organizations or Capitated/Partially Capitated Point of Service plans do not generate claims for reimbursement of prepaid capitated services; hence, we limited our analyses to patients covered under fee‐for‐service plan types. Unlike HOPDs, many of the ASCs in our samples were classified as out‐of‐network providers. Because payments out‐of‐network do not reflect the same negotiated discounts as payments to in‐network providers, we also restricted the samples to procedures that were paid to providers within network.
The primary variable of interest is total facility payment for the procedure, the actual allowed and transacted amount received by the HOPD or ASC. The facility payment includes both insurer and patient out‐of‐pocket components, but excludes professional fees. Because health care prices differ in part due to variation in local input prices faced by providers, to facilitate comparability across provider types we adjusted total facility payments geographically. We followed the method used in the Medicare Outpatient Prospective Payment System (OPPS) which adjusts the labor portion (approximately 60 percent) of each outpatient payment by the Medicare Wage Index according to the Metropolitan Statistical Area (MSA) in which the provider is located. We applied this process in reverse, converting facility payments to a level playing field analogous to Medicare outpatient payment rates prior to geographic adjustment.10 We excluded providers located in nonmetropolitan areas because these are not uniquely identifiable in the MarketScan data. These accounted for only 8.4 percent (THA, 2014) to 15.5 percent (TKA, 2017) of the observations of interest.
For each of the two procedures, we first examined the geographically adjusted total facility payment distributions by year, comparing provider types. Subsequently, we further adjusted for patient and insurance characteristics using regression analysis. For each procedure in each year, we estimated a generalized linear model (GLM) with a log link. We applied the modified Park test to determine the GLM distributional assumption.12 The test results were inconsistent across procedure/years, but results of the GLM models were not sensitive to the distributional assumption. Hence, we estimated all models using the gamma distribution, which is most often used in GLM cost estimations. The dependent variable was the total facility payment for the procedure including patient cost sharing. The independent variables included a binary variable indicating place of service (HOPD or ASC) and controlled for age, gender, and three plan types representing traditional, managed care, and consumer‐driven approaches to coverage: basic medical or comprehensive; preferred provider organization, exclusive provider organization, or noncapitated point of service; and consumer‐driven or high deductible health plan. The predicted values of total facility payments permitted us to conduct comparisons by provider type and over time, accounting for patient demographic and insurance product variation.
3. RESULTS
We examined the distributions of geographically adjusted total facility payments across provider type. Results for TKA are depicted in Figure 1. The figure displays three features of interest. First, we observe more procedures in each successive year in both facility types; however, there are nearly nine times as many procedures in ASCs in 2017 as in 2014, while in HOPDs there are approximately three times as many. Second, in each of the four years, payments to ASCs are much higher than payments to HOPDs, with no overlap of their respective interquartile ranges in any year. Third, ASC payments are essentially flat over the period but HOPD payments are rising.
Figure 1.
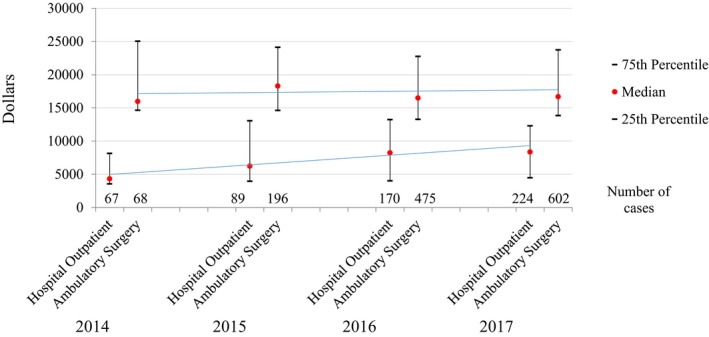
Total facility payment distributions for total knee replacement at hospital outpatient departments and ambulatory surgery centers, 2014‐2017. Authors’ analysis of the MarketScan Commercial Claims and Encounters database 2014‐2017. Trend line is ordinary least squares regression line on median values [Color figure can be viewed at http://wileyonlinelibrary.com]
Figure 2 shows the distributions comparing HOPD to ASC payments for THA. In this case, the numbers of procedures are growing at roughly the same rate in each provider type. Again, payments to ASCs are much higher than to HOPDs; however, we observe some overlap in their distributions in 2016 and in 2017. Finally, while the trend in payments to HOPDs is rising, there is a notable decline in payments to ASCs over the period.
Figure 2.
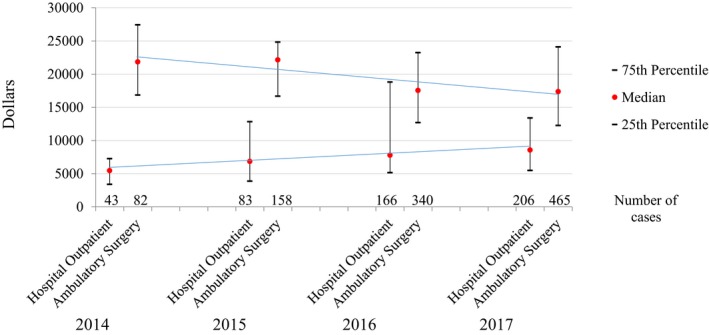
Total facility payment distributions for total hip replacement at hospital outpatient departments and ambulatory surgery centers, 2014‐2017. Authors' analysis of the MarketScan Commercial Claims and Encounters Database 2014‐2017. Trend line is ordinary least squares regression line on median values [Color figure can be viewed at http://wileyonlinelibrary.com]
Table 1 lists the geographically adjusted payments together with the patient out‐of‐pocket portion. Patient shares are generally higher for ASCs than for HOPDs for both procedures. We do not observe notable time trends.
Table 1.
Mean geographically adjusted total facility and patient payments to hospital outpatient departments and ambulatory surgery centers for total knee replacement and total hip replacement, 2014 to 2017
| 2014 | 2015 | 2016 | 2017 | |
|---|---|---|---|---|
| Total knee replacement: payments | ||||
| Hospital outpatient department | ||||
| Total payment ($) | 6001 | 9078 | 10 638 | 10 084 |
| Patient out‐of‐pocket ($) | 370 | 431 | 440 | 360 |
| Patient share (%) | 6.2 | 4.7 | 4.1 | 3.6 |
| Number of cases | 67 | 89 | 170 | 223 |
| Ambulatory surgery center | ||||
| Total payment | 23 302 | 22 651 | 18 423 | 18 218 |
| Patient out‐of‐pocket | 1360 | 1313 | 1341 | 1032 |
| Patient share (%) | 5.8 | 5.8 | 7.3 | 5.7 |
| Number of cases | 68 | 196 | 475 | 602 |
| Total hip replacement: payments | ||||
| Hospital outpatient department | ||||
| Total payment ($) | 7017 | 9195 | 11 252 | 11 211 |
| Patient out‐of‐pocket ($) | 342 | 584 | 767 | 529 |
| Patient share (%) | 4.9 | 6.4 | 6.8 | 4.7 |
| Number of cases | 43 | 82 | 166 | 206 |
| Ambulatory surgery center | ||||
| Total payment ($) | 28 405 | 24 896 | 18 178 | 18 543 |
| Patient out‐of‐pocket ($) | 2894 | 1362 | 1369 | 1384 |
| Patient share (%) | 10.2 | 5.5 | 7.5 | 7.5 |
| Number of cases | 82 | 158 | 340 | 464 |
Authors’ analysis of the MarketScan Commercial Claims and Encounters Database 2014‐2017. Payments reflect adjustment for geographic market.
In Table 2, we report the mean predicted values of total facility payments following adjustment for age, sex, and plan type by provider type, year, and procedure. The overall outcomes correspond to the descriptive results shown in the previous Figures. For both procedures, payments to ASCs exceed payments to HOPDs by a very wide margin in each year, although there is moderate convergence over time as payments to HOPDs rise. In 2014, ASC TKA payments are nearly four times higher than HOPD TKA payments. By 2017, however, ASCs payments are only 81 percent higher. Convergence of payments is similar for THA: in 2014 ASCs were paid over four times what HOPDs were paid, yet by 2017 that difference fell to 67 percent higher payments for ASCs.
Table 2.
Mean adjusted total facility payments to hospital outpatient departments and ambulatory surgery centers for total knee replacement and total hip replacement, 2014 to 2017
| Provider type | 2014 | 2015 | 2016 | 2017 | Annual growth rate |
|---|---|---|---|---|---|
| Total knee replacement: payment $ (number of cases) | |||||
| Hospital outpatient department | 6016 (67) | 9060 (89) | 10 560 (170) | 10 060 (223) | 18.7% |
| Ambulatory surgery center | 23 244 (68) | 22 675 (196) | 18 474 (475) | 18 234 (602) | −7.8% |
| Total hip replacement: payment $ (number of cases) | |||||
| Hospital outpatient department | 6980 (43) | 9168 (82) | 11 248 (166) | 11 139 (206) | 16.9% |
| Ambulatory surgery center | 28 485 (82) | 24 932 (158) | 18 180 (340) | 18 595 (465) | −13.3% |
Authors’ analysis of the MarketScan Commercial Claims and Encounters Database 2014‐2017. Payments reflect adjustment for geographic market, age, sex and plan type. Authors conducted t tests for differences in means of predicted values of payment across provider types. Assuming independent samples with unequal variances, the null hypothesis of equality of means was rejected at P < 0001 in each year for both knee replacement and hip replacement surgery.
4. DISCUSSION
Spurred by changes in technology, pressure from payers to lower costs, and an increasing volume of outpatient surgery, the number of Medicare‐certified ASCs has risen dramatically in recent years, from 3028 in 2000 to 5532 in 2016.13 ASCs are now the dominant provider of specific outpatient surgical procedures in the United States, exceeding the number of acute care hospitals.
Growth of the ASC sector has been an integral part of transition of care delivery outside the walls of the traditional hospital. ASCs have demonstrated numerous cost efficiencies and also have improved on convenience for patients undergoing surgical services. Nonetheless, ASCs have not been without their critics. Most ASCs are physician‐owned, and there has been ongoing concern over cherry‐picking of patients by physician‐owned limited services facilities.14, 15 Moreover, the Medicare Payment Advisory Commission (MedPAC) has expressed difficulty in determining ASC payment adequacy and has called for collecting cost data from ASCs for years.13
The recent decision by CMS to remove TKA from the IPO list has raised additional concerns. Many observers fear it will lead commercial payers to implement coverage policies that will drive surgeries increasingly toward ASCs, which might not be sufficiently prepared to manage unforeseen complexities.16 Medicare currently is reconsidering a recent decision to cover spine surgeries in ASCs following a number deaths resulting from postsurgical complications that the ASCs were not equipped to handle.17 Many hospital leaders also are alarmed over fear of losing substantial inpatient revenue from total joint replacement surgeries, one of their largest profit centers, to ASCs as has happened with other procedures in the past.18
The central finding of our study, that ASCs receive considerably higher payments for total joint replacement surgeries than do HOPDs, adds to existing concerns regarding ASCs. Assuming it is implausible that true production costs of total joint replacement in ASCs exceeds the costs of the same services in HOPDs by such a wide margin, a conceivable interpretation is that the higher prices received from commercial insurers are driving profitability and ASC expansion. While our results cannot confirm this, it is consistent with previous study of ASCs.10 However, we also found that the gap between ASC and HOPD payments declined over the period of our study, which mollifies concerns over high ASC prices. Provision of total joint replacement surgery in ASCs is relatively new, and we may be observing prices that are in an early period of adjustment to the market. Ongoing study of these trends will be important in future studies.
Over the relatively short period of time we examined, we also observed considerable growth in outpatient joint replacement among both provider types, especially for TKA. While our results are based on a limited number of cases, this finding potentially raises the additional concern that ASCs may spur more utilization of total joint replacement. An earlier study found the presence of an ASC to be associated with higher utilization of common outpatient procedures in the elderly. The authors were unclear on whether ASCs were meeting unmet clinical demand or spurring overutilization.19 This is another area where more research will be useful.
It is interesting to consider our findings in the context of what HOPDs receive for TKA services provided to Medicare beneficiaries. The CMS base rate plus 20 percent patient coinsurance (prior to geographic adjustment) as of January 2018 is $12 148.20 This rate is generally aligned with our findings for payment to HOPDs in the commercial sector (averaging $10 060 in 2017; Table 1) given the one‐year time lag and the fact that Medicare patients are on average more complex than the under age 65 population we examined. While CMS has not added TKA to the ASC Covered Procedures List, some observers expect CMS to do so in the future. Given that speculation, it also is worth noting that CMS currently reimburses ASCs at a legislated percentage of payments to HOPDs (approximately 60 percent) across all services on the ASC covered procedures list.13
There are limitations to consider. First, while we use a reasonably representative sample of the US commercially insured population based on age, gender, plan type, and region, we do not know whether this generalizability holds in our subsample of HOPDs and ASCs. MarketScan does not identify provider location so we were unable to examine market concentration, and it is possible that results were dominated by a small number of ASCs with excessive market strength. Moreover, the data are drawn exclusively from claims that were voluntarily contributed from employer‐based health plans. Finally, our sample sizes are relatively small, particularly in the earlier years of the study.
As total joint replacement continues to transition to outpatient settings, it also will be important to address questions that relate to relative quality and clinical outcomes. Because ASCs specialize in the procedures they perform, they may have an advantage in achieving better outcomes due to high volume of procedures and may in addition be better positioned to focus on patient experience. In 2014, CMS implemented a pay‐for‐reporting quality data program under which ASCs are required to report quality of care data for standardized measures in order to receive the full annual update to their ASC annual payment rate. These data will be valuable in future assessments of total joint replacement procedures in ASCs.
With an aging population, obesity‐induced stress on joints, and the desire of Americans to stay active, joint replacement surgeries will continue to be performed at higher rates and many of these will be performed in ASCs. Total joint replacement is a more complex surgery than procedures that ASCs have commonly performed in the past. Greater transparency of prices, cost, and quality will all be important contributors to better understanding the strengths and limitations of the transition of total joint replacement to ASCs.
CONFLICT OF INTEREST
No other disclosures.
Supporting information
ACKNOWLEDGMENT
Joint Acknowledgment/Disclosure Statement: This work was supported in part by the National Institute on Aging #R03‐AG062926‐01.
Carey K, Morgan JR. Payments for outpatient joint replacement surgery: A comparison of hospital outpatient departments and ambulatory surgery centers. Health Serv Res. 2020;55:218–223. 10.1111/1475-6773.13262
REFERENCES
- 1. Munnich EL, Parente ST. Returns to specialization: evidence from the outpatient surgery market. J Health Econ. 2018;57:147‐167. [DOI] [PubMed] [Google Scholar]
- 2. Inacio MCS, Paxton EW, Graves SE, Namba RS, Nemes S. Projected increase in total knee arthroplasty in the United States – an alternative projection model. Osteoarthritis Cartilage. 2017;25(11):1797‐1803. [DOI] [PubMed] [Google Scholar]
- 3. Advisory Board . Hospitals may lose total joint replacements to ambulatory providers. Here's what they're doing about it. 2017 Aug 10. https://www.advisory.com/daily-briefing/2017/08/10/joint-replacement. Accessed August 18, 2018.
- 4. Hirsch R. News Alert: CMS says OK to admit total knee replacements as inpatient. RAC Monitor. 2018 Jan 10. https://www.racmonitor.com/news-alert-cms-says-ok-to-admit-total-knee-replacements-as-inpatient. Accessed January 17, 2018.
- 5. Trentman TL, Mueller JT, Gray RJ, Pockaj BA, Simula DV. Outpatient surgery performed in an ambulatory surgery center versus a hospital: comparison of perioperative time intervals. Am J Surg. 2010;200(1):64‐67. [DOI] [PubMed] [Google Scholar]
- 6. Munnich EL, Parente ST. Procedures take less time at ambulatory surgery centers, keeping costs down. Health Aff. 2014;33(5):764‐769. [DOI] [PubMed] [Google Scholar]
- 7. Huang A, Ryu J, Dervin G. Cost savings of outpatient versus standard inpatient total knee arthroplasty. Can J Surg. 2017;60(1):57‐62. [DOI] [PMC free article] [PubMed] [Google Scholar]
- 8. Aynardi M, Post Z, Ong A, Orozco F, Sukin DC. Outpatient surgery as a means of cost reduction in total hip arthroplasty: a case‐control study. HSS J. 2014;10(3):252‐255. [DOI] [PMC free article] [PubMed] [Google Scholar]
- 9. Lovald ST, Ong KL, Malkani AL, et al. Complications, mortality, and costs for outpatient and short‐stay total knee arthroplasty patients in comparison to standard‐stay patients. J Arthroplasty. 2014;29(3):510‐515. [DOI] [PubMed] [Google Scholar]
- 10. Carey K. Price increases were much lower in ambulatory surgery centers than hospital outpatient departments in 2007–12. Health Aff. 2015;34(10):1738‐1744. [DOI] [PubMed] [Google Scholar]
- 11. Horny M, Morgan JR, Merker VL. Using medical claims for policy effectiveness surveillance: reimbursement and utilization of abdomen/pelvis computed tomography scans. Health Serv Res. 2015;50(6):1910‐1926. [DOI] [PMC free article] [PubMed] [Google Scholar]
- 12. Manning WG, Mullahy J. Estimating log models: to transform or not to transform? J Health Econ. 2001;20:461‐494. [DOI] [PubMed] [Google Scholar]
- 13. Medicare Payment Advisory Commission . Ambulatory Surgical Center Services. In: Report to the Congress March 2018. http://www.medpac.gov/docs/default-source/reports/mar18_medpac_ch5_sec.pdf?sfvrsn=0
- 14. Plotzke MR, Courtemanche C. Does procedure profitability impact whether an outpatient surgery is performed at an ambulatory surgery center or hospital? Health Econ. 2011;20(7):817‐830. [DOI] [PubMed] [Google Scholar]
- 15. Meyerhoefer CD, Colby MS, McFetridge JT. Patient mix in outpatient surgery settings and implications for Medicare payment policy. Med Care Res Rev. 2012;69(1):62‐82. [DOI] [PubMed] [Google Scholar]
- 16. Federal Register . 12/14/2017 Issue. Hospital Outpatient Prospective Payment and Ambulatory Surgical Center Payment Systems and Quality Reporting Programs. Page 59383 https://www.federalregister.gov/documents/2017/12/14://www.federalregister.gov/documents/2017/12/14. Accessed June 9, 2018. [PubMed]
- 17. Jewett C. Medicare reconsiders paying for seniors’ spine operations at surgery centers. Kaiser Health News. July 30, 2018. https://khn.org/news/medicare-reconsiders-paying-for-seniors-spine-operations-at-surgery-centers/?utm_campaign=KHN%253A%2520Topic-based%26utm_source=hs_email%26utm_medium=email%26utm_content=65250245%26_hsenc=p2ANqtz--C-9lAO99kcFBPgQGRhVygYyiQccljc9EcJO3MMr7N5b2hjKp6_TmF8QVGnaaUGL72rH89eoKJsgM_fwrnxmLMwm5ivA%26_hsmi=65250245. Accessed August 19, 2018.
- 18. Meyer H. Hospitals leery of CMS proposal to pay for joint replacements in ASCs. [Modern Healthcare]. August 5, 2017. https://www.modernhealthcare.com/article/20170805/NEWS/170809931/hospitals-leery-of-cms-proposal-to-pay-for-joint-replacements-in-ascs?_ptid=%7Bjcx%7DH4sIAAAAAAAAAI2QW2-CQBCF_8s-u2ZvwOqbLbQ1amu91fi2wKAbEZFd0LTpfy-Q2sakD523mecycz5QErHqI_sWBvzejrNYtRBudrCSsN52BBGGMGEYuJhKjFn2CHYcyiu3ka2lKrQKlhw9n7BXPKkJyhwqSSE3IsTpkhCmBu6gntOVC-GSw6FhiyCdnWw5q--M3-YUTG8ocEFotLqY9bKqCReQiSJ95jUxQrDQqXivSgTl1rFbXE6iRv_IPoxm93xvIBDnioLYjT075frIJg8b6hbO3bKXBnq26KEDrLffWt-Wfh3y0dnOp3QJ_TLVs3XmW0kWZmmHRSpQ670NjPXQaWNbjmq8N8BcuwLCItROt7Aal5RQf4ToM6bPIjsMrfLiNultFdPSwPFYAuZrWF8TppLbYr61PGkw1zusc8vWJv4BecBAAA
- 19. Hollenbeck BK, Hollingsworth JM, Dunn RL, Ye Z, Birkmeyer JD. Ambulatory surgery center market share and rates of outpatient surgery in the elderly. Surg Innov. 2010;17(4):340‐345. [DOI] [PubMed] [Google Scholar]
- 20. Centers for Medicare and Medicaid Services . Addendum A and Addendum B Updates. http://www.cms.gov/Medicare/Medicare-Fee-for-Service-Payment/HospitalOutpatientPPS/Addendum-A-and-Addendum-B-Updates.html. Accessed August 18, 2018.
Associated Data
This section collects any data citations, data availability statements, or supplementary materials included in this article.
Supplementary Materials