

Abstract
Objective
To test whether Medicaid expansion is associated with (a) a greater number of naloxone prescriptions dispensed and (b) a higher proportion of naloxone prescriptions paid by Medicaid.
Data Sources/Study Setting
We used the IQVIA National Prescription Audit to obtain data on per state per quarter naloxone prescription dispensing for the period 2011‐16.
Study Design
In this quasi‐experimental design study, the impact of Medicaid expansion on naloxone prescription dispensing was examined using difference‐in‐difference estimation models. State‐level covariates including pharmacy‐based naloxone laws (standing/protocol orders and direct authority to dispense naloxone), third‐party prescribing laws, opioid analgesic prescribing rates, opioid‐involved overdose death rates, and population size were controlled for in the analysis.
Principal Findings
Medicaid expansion was associated with 38 additional naloxone prescriptions dispensed per state per quarter compared to nonexpansion controls, on average (P = .030). Also, Medicaid expansion resulted in an average increase of 9.86 percent in the share of naloxone prescriptions paid by Medicaid per state per quarter (P < .001).
Conclusions
Our study found that Medicaid expansion increased naloxone availability. This finding suggests that it will be important to consider naloxone access when making federal‐ and state‐level decisions affecting Medicaid coverage.
Keywords: drug overdose, Medicaid, naloxone, opioid epidemic, Patient Protection and Affordable Care Act
What This Study Adds.
While laws and policies to increase naloxone access through retail pharmacies have been widely implemented across states (eg, third‐party prescribing or standing/protocol order), such laws may not address financial access to naloxone.
Medicaid expansion resulted in an average increase of 38 naloxone prescriptions per state‐quarter. Also, Medicaid expansion increased the Medicaid share of naloxone prescription payments by approximately 10 percent per state‐quarter.
Our findings suggest that Medicaid expansion increased financial access to naloxone, and naloxone access should be monitored going forward as Medicaid waivers are approved and implemented.
1. INTRODUCTION
The United States is in the midst of a devastating opioid‐involved overdose crisis evidenced by 130 deaths from an opioid overdose every day.1 In 2017 alone, there were over 47 000 opioid overdose deaths, which represents a nearly sixfold increase from 1999.2 Since 2015, more than half of all unintentional opioid overdose deaths involved heroin and synthetic illicit opioids.3, 4 In October 2017, the White House declared the opioid epidemic a public health emergency.5
In an effort to decrease opioid overdose deaths, a number of states have implemented laws and policies aimed at increasing naloxone access.6, 7, 8, 9, 10, 11, 12 Naloxone is an opioid receptor antagonist that can reverse an opioid overdose by temporarily displacing opioids from the opioid receptors and restoring breathing. Several studies have demonstrated that the number of naloxone prescriptions dispensed by retail pharmacies has increased since the enactment of naloxone access laws.13, 14, 15, 16 Pharmacists have become important providers of naloxone due to their accessibility17, 18 and because they can directly dispense naloxone through a standing order or other mechanisms that make naloxone prescriptions accessible without the patient having first visited a prescriber.8 As of July 2017, 49 states and the District of Columbia have enacted legal interventions authorizing pharmacists to dispense naloxone in such a manner.8
Previous studies show that Medicaid plays a critical role in providing access to treatment coverage for individuals with an opioid use disorder (OUD).19, 20, 21 According to data from the 2017 National Survey on Drug Use and Health (NSDUH), Medicaid covers the largest proportion of nonelderly adults diagnosed with OUD (38 percent). Moreover, among low‐income (<200 percent federal poverty level, FPL), nonelderly adults, Medicaid accounts for over half of the coverage (55 percent).22, 23 Using the Substance Abuse and Mental Health Services Administration (SAMHSA) Treatment Episode Data Set, Meinhofer and Witman showed that Medicaid expansion significantly increased opioid‐related admissions to specialty treatment facilities, in which outpatient medication‐assisted treatments (MAT) were often involved.21 Furthermore, Olfson et al24 reported an increase in insurance coverage among persons with OUD after Medicaid expansion. Therefore, we hypothesize that state Medicaid expansion may also have important life‐saving implications with respect to individuals' access to naloxone, as those with OUD have a greater risk of opioid overdose.25 As of September 2019, 37 states (including District of Columbia) have expanded Medicaid coverage, resulting in Medicaid eligibility for low‐income adults up to 138 percent of the FPL.26 Under the Affordable Care Act (ACA), the coverage for behavioral health services, including mental health care and substance use disorder treatments, is mandated for most expansion enrollees.27 Previously, based on data from the Medicaid Drug Rebate Program, Frank and Fry reported the positive impact of Medicaid expansion on access to naloxone.28 While their study focused on Medicaid‐paid naloxone prescriptions, we sought to estimate the impact of Medicaid expansion on naloxone prescriptions involving all payer types. To accomplish this, we had two primary hypotheses. We hypothesized that states adopting Medicaid expansion would dispense a higher volume of naloxone prescriptions and have a higher percent of naloxone prescriptions paid by Medicaid compared to states not adopting Medicaid expansion.
2. METHODS
2.1. Study design
This quasi‐experimental design study examined changes in the number of naloxone prescriptions dispensed and the percent of naloxone prescriptions paid by Medicaid from 2011 through 2016. Medicaid expansion provided natural comparison groups for the study. The unit of observation was state‐quarter. As this research did not involve human subjects, it was exempt from the University of Kentucky Institutional Review Board (IRB) review.
2.2. Variables and data sources
The study dependent variables included (a) the number of naloxone prescriptions dispensed per state per quarter‐year and (b) the percent of naloxone prescriptions paid by Medicaid per state per quarter‐year. Data for these variables were obtained from the IQVIA National Prescription Audit (NPA) for the years from 2011 to 2016. The NPA contains nationwide all‐payer prescription naloxone transactions in retail pharmacies, representing approximately 90 percent of all retail pharmacies in the United States.29 Using IQVIA's proprietary methodology, the data are weighted to approximate 100 percent of all dispensing transactions.29 The payment types included cash, commercial third party, Medicaid (fee for service and managed care), and Medicare Part D. When computing the percent of naloxone prescriptions paid by Medicaid (second dependent variable), if the denominator (number of naloxone prescription paid by all payment types) was less than 10, the data were suppressed to conserve reliability. Data on the number of naloxone prescriptions (first dependent variable) were not subject to suppression.
As the study focused on the impact of Medicaid expansion, states were categorized into expansion and nonexpansion groups based on data provided by the Henry J. Kaiser Family Foundation.26 The expansion group included 32 states (including the District of Columbia) that adopted Medicaid expansion as of December 2016, in which Medicaid coverage for low‐income adults was extended to 138 percent of the FPL. The nonexpansion group included 19 states that did not expand Medicaid during the observation period. Each state's expansion status and timing as defined for this study are shown in Appendix S1. Although some states (eg, Massachusetts) provided low‐income adults with extended Medicaid coverage prior to 2014, we considered the Medicaid expansion under the provisions of the ACA as the exposure of interest for this study.
Two opioid‐related covariates were included in the analysis to adjust for state‐specific variations in the underlying intensity of opioid use. First, the state opioid analgesic prescribing rate from the preceding year was included to capture prescription opioid use.29, 30 This variable was included based on the assumption that naloxone dispensing would be more frequent in states with a higher opioid prescribing rate. In fact, naloxone coprescribing for patients who receive a high dose of prescription opioids has been recommended by SAMHSA31 and the US Centers for Disease Control and Prevention (CDC).32 The data excluded cough and cold formulations containing opioids and buprenorphine products, which are typically used to treat OUD. Secondly, the unadjusted death rate involving opioids from the preceding year was included to control for population differences in prescription and illicit opioid use. Mortality data for US residents were obtained from the Multiple Causes of Death dataset on the CDC Wide‐ranging Online Data for Epidemiologic Research (WONDER), which is based on information from death certificates filed in 50 states and the District of Columbia.1 Drug overdose deaths involving opioids were identified using the International Classification of Diseases, Tenth Revision (ICD‐10) codes.33 Deaths with drug overdose as the underlying cause were first identified using ICD‐10 codes of X40‐X44 (unintentional), X60‐X64 (suicide), X85 (homicide), and Y10‐Y14 (undetermined intent). Of those, opioid‐related deaths were identified based on ICD‐10 codes of T40.0‐T40.4 and T40.6 (opioids), including those for heroin [T40.1], prescription opioids [T40.2‐40.3], and synthetic opioids, excluding methadone [T40.4].
State naloxone access laws were included as state‐specific health policy covariates. We focused on two particular provisions of naloxone access laws that were widely adopted during the observation period and that were intended to increase naloxone dispensing from retail pharmacies: (a) pharmacy‐based naloxone laws and (b) third‐party prescribing laws.34 In this study, pharmacy‐based naloxone laws referred to standing orders, protocol orders, and direct authority to dispense naloxone. Through these laws, a person at risk for opioid overdose can obtain naloxone from a retail pharmacy without first seeing a prescriber, and furthermore, these interventions were previously shown to decrease opioid‐related overdose deaths.35 Third‐party prescribing laws allow friends or family members of persons at risk for opioid overdose to receive naloxone prescriptions. Using state naloxone access law effective dates reported by the Prescription Drug Abuse Policy System (PDAPS) website and prior studies,8, 13, 36 we created two indicator variables to separately classify state‐quarters in which a pharmacy‐based naloxone law or a third‐party prescribing law was fully implemented. The quarter‐year for each naloxone access law implementation is shown in Appendix S1. In addition, we included an interaction term for the two indicator variables to examine the impact of implementing both policies as a policy “dosing” effect.
3. ANALYSIS
3.1. Descriptive analysis
National trends in (a) the annual rate of naloxone prescriptions dispensed per 100 000 and (b) the payer type as a share of all naloxone prescription transactions were estimated in all 50 states and the District of Columbia. The annual rate of naloxone prescription dispensing was visualized to allow comparisons between states, as well as between US Census Bureau regions (Northeast, Midwest, South, and West). Then, the trends between expansion states and nonexpansion states were compared.
3.2. Multivariate regression analysis
The impact of Medicaid expansion on naloxone prescription dispensing was estimated using a difference‐in‐difference (DD) approach. Separate models were estimated for both dependent variables. Specifically, a negative binomial regression model was fitted to estimate the number of naloxone prescriptions dispensed (as a count rather than a rate per 100 000), and an ordinary least square (OLS) regression model was fitted to estimate the percent of naloxone prescriptions paid by Medicaid. For estimating the number of naloxone prescriptions dispensed, we chose the negative binomial regression model because the dependent variable was overdispersed and it offered the best fit over other models such as a Poisson regression model or an OLS. To identify the best fit, we compared root‐mean‐square errors, for which the negative binomial model had the lowest value. Each regression model included state fixed effects, time fixed effects (quarter‐year), and population size in logarithmic scale, as well as the covariates listed above in Section 2. We used the log‐transformed population size to account for large differences in population sizes. From the negative binomial regression model, average marginal effects (AMEs) and p‐values were estimated. The AME of the interaction between a pharmacy‐based naloxone law and a third‐party prescribing was obtained using Stata postestimation commands, margins and lincom, which are appropriate for interpreting the interaction term in nonlinear models.37 From the OLS regression model, slope coefficients with associated p‐values were estimated. Standard errors were clustered at the state level.
We specified the DD estimator using a term of the interaction between an indicator for whether a state participated in Medicaid expansion and an indicator for whether an observed quarter‐year was in the postexpansion period in a given state. For example, Medicaid expansion became effect on August 15, 2014, in New Hampshire; thus, the coding of the postexpansion variable for New Hampshire turned from 0 to 1 from the fourth quarter of 2014. Timing of the postexpansion period for each state is shown in Appendix S1. The interpretation of the DD estimator coefficient depends on the assumption that changes in naloxone dispensing postexpansion would have been the same in expansion and nonexpansion states if the expansion had not occurred, holding other variables constant. The estimation of regression models using the pre‐expansion data satisfied this assumption; in that, interactions between the expansion indicator and quarter‐year dummy variables were not statistically significant at a 5 percent significance level (Appendix S2).
3.3. Supplementary analyses
Four sets of robustness and sensitivity models were estimated. First, we used year fixed effects instead of quarter fixed effect to examine the robustness of estimation. Second, we excluded the covariate of opioid prescribing rates from the regression analysis. In the main analysis, it was assumed that naloxone dispensing would be more frequent in states with higher opioid prescribing rates. However, to our knowledge, there is a lack of empirical evidence to support this relationship. For this reason, a sensitivity analysis was conducted to examine whether the findings of the study would be affected by opioid prescribing rate adjustments. Third, to estimate the direct impact of Medicaid expansion on the Medicaid population with respect to the number of naloxone prescriptions dispensed, we estimated a negative binomial regression model using data restricted to Medicaid‐paid naloxone prescriptions. In this model, we used the same DD approach used in the main model to estimate the impact of Medicaid expansion on the number of Medicaid‐paid prescriptions of naloxone. We controlled for naloxone access laws, opioid prescribing rates, opioid‐related death rates, state fixed effects, quarter‐year fixed effects, and the number of Medicaid enrollees in logarithmic scale. The number of Medicaid enrollees was computed using the percent of Medicaid enrollment reported by the Henry J. Kaiser Family Foundation.38 Fourth, we tested the sensitivity of the OLS model based on the data suppression criteria for computing the percent of naloxone prescriptions paid by Medicaid. We tested this by estimating separate OLS models by suppressing data when the number of all‐payer naloxone prescriptions was less than 7, 5, or 3. We also estimated the model without suppressing any data.
In addition, we conducted two supplementary analyses to assist in the interpretation of results. With respect to state‐specific health policy covariates, we analyzed regression models using a combined indicator of having either a pharmacy‐based naloxone law or a third‐party prescribing law, instead of including both laws as separate variables. Next, to explore the potential mechanism by which Medicaid expansion affects naloxone dispensing, we examined the association between the number of naloxone prescriptions dispensed and Medicaid enrollment as a percent of total population using a negative binomial regression model. All analyses were performed using Stata/SE version 13 (StataCorp).39
4. RESULTS
4.1. Naloxone prescription dispensing
4.1.1. National trends
The annual rate of all‐payer prescription naloxone transactions in the United States increased from 2011 to 2016 (Table 1). More specifically, prior to 2014, less than 1 naloxone prescription was dispensed per 100,000 persons in the United States (0.42, 0.41, and 0.51 per 100 000 in 2011, 2012, and 2013, respectively). The rate rapidly increased to 2.07 per 100 000 in 2014, 8.17 in 2015, and 41.47 in 2016. Compared to 2013, the naloxone dispensing rate increased by nearly two orders of magnitude in 2016. However, substantial variation was observed among states. State‐specific trends in naloxone prescription dispensing rates are shown in Appendix S3. For almost all years, Connecticut, Maryland, and New Mexico had the highest dispensing rates in their regions (Northeast, South, and West, respectively), and Nebraska, Arkansas, and Hawaii had the lowest dispensing rates in their regions (Midwest, South, and West, respectively). For example, during 2016, approximately 149 naloxone prescriptions were dispensed per 100 000 in New Mexico, while 3 naloxone prescriptions per 100 000 were dispensed in Hawaii. Also, on average, the Midwest region had a lower rate of naloxone dispensing compared to other geographic regions in the United States.
Table 1.
National trends in naloxone dispensing and payer type distribution (50 states and District of Columbia)
| Year | All‐payer total | Cash | Commercial | Medicaid FFS | Medicaid MCO | Medicare Part D | ||||||
|---|---|---|---|---|---|---|---|---|---|---|---|---|
| n | n per 100 000 | n | % | n | % | n | % | n | % | n | % | |
| 2011 | 1304 | 0.42 | 907 | 70 | 329 | 25 | 21 | 2 | 1 | 0 | 45 | 3 |
| 2012 | 1284 | 0.41 | 882 | 69 | 318 | 25 | 7 | 1 | 23 | 2 | 54 | 4 |
| 2013 | 1597 | 0.51 | 896 | 56 | 358 | 22 | 113 | 7 | 62 | 4 | 168 | 11 |
| 2014 | 6588 | 2.07 | 2158 | 33 | 2170 | 33 | 755 | 11 | 450 | 7 | 1054 | 16 |
| 2015 | 26 231 | 8.17 | 5303 | 20 | 9414 | 36 | 3815 | 15 | 2920 | 11 | 4778 | 18 |
| 2016 | 134 109 | 41.47 | 13 054 | 10 | 58 202 | 43 | 17 560 | 13 | 16 270 | 12 | 29 022 | 22 |
Abbreviation: SD, standard deviation.
4.1.2. Comparison by Medicaid expansion status
The unadjusted rate of naloxone dispensing per 100 000 persons was higher in expansion states than nonexpansion states (Figure 1). The trend began to show visible differences between two groups from the first quarter of 2014, during which Medicaid expansion in most expansion states began to roll out. In both groups, there was at least sevenfold increase from the first quarter of 2015 to the fourth quarter of 2016 in the rate of naloxone prescriptions dispensed.
Figure 1.
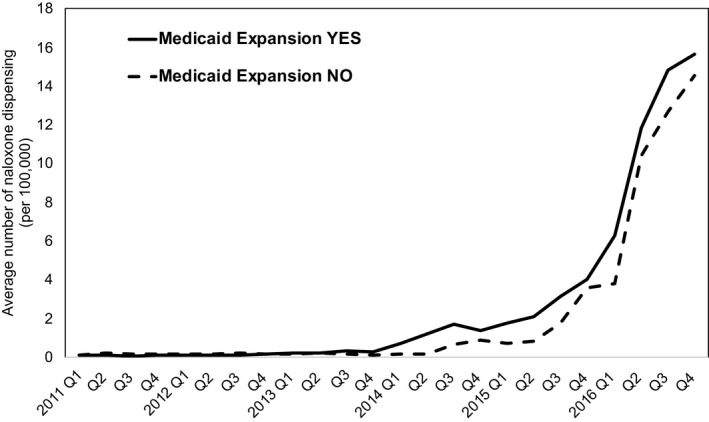
Rate of naloxone dispensing per 100 000 by retail pharmacies in Medicaid expansion states and nonexpansion states
In the multivariate regression model, Medicaid expansion showed a significant impact on the number of naloxone prescriptions dispensed (Table 2A). In particular, Medicaid expansion states dispensed an average of 38 additional naloxone prescriptions per state per quarter compared to nonexpansion controls, after controlling for covariates (P = .030).
Table 2.
Impact of Medicaid expansion on retail naloxone dispensing, estimated from difference‐in‐difference multivariate regression modelsa
| (A) Dependent variable: number of naloxone prescriptions dispensed per quarter‐year | ||
|---|---|---|
| Variable | Average marginal effect | P‐value |
| Medicaid expansion X post | 38 | .030 |
| Third‐party prescribing in the absence of pharmacy‐based naloxone law | 82 | <.001 |
| Third‐party prescribing in the presence of pharmacy‐based naloxone law | 391 | <.001 |
| Death rate involving opioid overdose (per 100 000) | 19 | <.001 |
| Opioid prescribing rate (per 100) | −2 | .226 |
| Ln population | 1912 | .001 |
| (B) Dependent variable: percent of naloxone prescriptions paid by Medicaid | ||
|---|---|---|
| Variable | Coefficient | P‐value |
| Medicaid expansion X post | 9.86 | <.001 |
| Pharmacy‐based naloxone law | 6.29 | .162 |
| Third‐party prescribing | −1.69 | .383 |
| Pharmacy‐based naloxone law X third‐party prescribing | −2.18 | .646 |
| Death rate involving opioid overdose (per 100 000) | 0.62 | .039 |
| Opioid prescribing rate (per 100) | −0.33 | .030 |
| Ln population | −29.30 | .654 |
In addition to the variables in the table, state fixed effects and quarter‐year fixed effects were included in each model.
A significant interaction between the two types of naloxone laws was observed. More specifically, implementing a third‐party prescribing law, in the absence of a pharmacy‐based naloxone law, was associated with an average increase of 82 naloxone prescriptions per state per quarter. On the other hand, if a state had a pharmacy‐based naloxone law in place, a third‐party prescribing law increased naloxone dispensing by 391 per quarter.
A number of sensitivity analyses yielded similar results. In the sensitivity model including year fixed effects instead of quarter‐year fixed effect, the AME of Medicaid expansion was 38 per state per quarter (P = .037; Appendix S4). When the variable of opioid prescribing rate was excluded from the analysis, the AME of Medicaid expansion was 41 (P = .017; Appendix S5).
When the data were restricted to naloxone prescriptions paid by Medicaid, the impact of Medicaid expansion was larger and more significant, with an estimated AME of 65 at P = .001 (Appendix S6). In the analysis with a combined indicator of having either a pharmacy‐based naloxone law or a third‐party prescribing law, the AME of Medicaid expansion was 40 (P = .024) and the AME of the combined indicator was 83 (P < .001; Appendix S7). In the analysis in which the association between the number of naloxone prescriptions dispensed and Medicaid enrollment was examined, a 1 percent increase in Medicaid enrollment in a state was associated with 85 additional naloxone prescriptions dispensed per quarter (P = .001; Appendix S8).
4.2. Percent of naloxone prescriptions paid by Medicaid
4.2.1. National trends
Between 2011 and 2013, a majority of naloxone prescriptions dispensed in the United States were paid out of pocket (cash) by the patient (70 percent, 69 percent, and 56 percent of all naloxone prescriptions in 2011, 2012, and 2013, respectively; Table 1). However, beginning in 2014, third‐party payers including Medicare, Medicaid, and commercial insurers primarily paid for naloxone prescriptions (67 percent, 80 percent, and 90 percent of all naloxone prescriptions in 2014, 2015, and 2016, respectively), and by 2016, <10 percent was paid in cash. Public payers including Medicaid and Medicare gradually increased their share over time. More specifically, approximately 3 percent of naloxone prescriptions were paid by Medicare Part D in 2011, increasing to 11 percent in 2013 and 22 percent in 2016. Medicaid accounted for approximately 2 percent in 2011, 11 percent in 2013, and 25 percent in 2016.
4.2.2. Comparison by Medicaid expansion status
Naloxone prescription dispensing by payer type was compared between expansion and nonexpansion states on a quarterly basis (Figure 2). In both groups, the share of naloxone prescriptions paid by third‐party payers gradually increased over time. However, among third‐party payers, Medicaid paid for a greater proportion of naloxone prescriptions in expansion states than in nonexpansion states in all years. For example, in the last quarter of 2016, Medicaid paid for the largest share of naloxone prescriptions in expansion states (38 percent), whereas commercial health insurance paid the largest share in nonexpansion states (53 percent).
Figure 2.
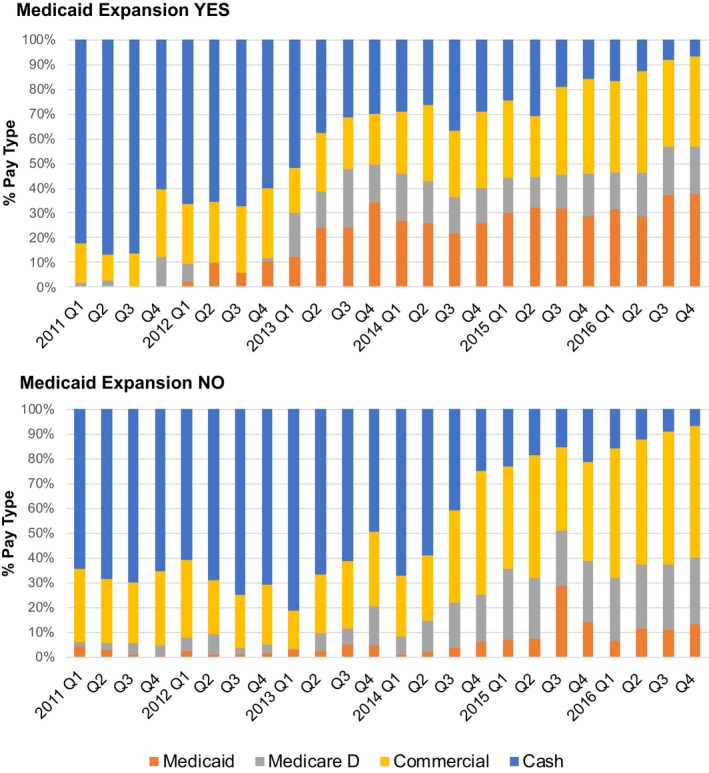
Payer type as a share of all naloxone prescription payments in retail pharmacies by Medicaid expansion status [Color figure can be viewed at https://www.wileyonlinelibrary.com]
In the multivariate regression model (Table 2B), Medicaid expansion increased the Medicaid share of naloxone prescription payments by 9.86 percent (P < .001). Neither a pharmacy‐based naloxone law nor a third‐party prescribing law was significantly associated with the percent of naloxone prescriptions paid by Medicaid.
In the sensitivity model that included year fixed effects instead of quarter‐year fixed effects, Medicaid expansion increased the Medicaid share of naloxone prescription payments by 10.98 percent (P < .001; Appendix S4). In the sensitivity model in which the variable of opioid prescribing rate was excluded, the estimated expansion effect was 10.38 percent (P < .001; Appendix S5). When different thresholds were used for data suppression, the estimated expansion effect ranged from 6.70 percent (P < .001, data suppressed if naloxone dispensing was <3) to 9.86 percent (P < .001, data suppressed if naloxone dispensing was <10; Appendix S5).
5. DISCUSSION
This study evaluated the association between Medicaid expansion and naloxone prescription dispensing for the period 2011‐2016. We found that the naloxone dispensing rate and third‐party payer (eg, Medicare, Medicaid, and commercial insurances) coverage for naloxone prescriptions have increased nationwide. Furthermore, when comparing states based on Medicaid expansion status, more naloxone prescriptions were dispensed in expansion states than nonexpansion states. In particular, Medicaid expansion resulted in an average increase of 38 naloxone prescriptions per state per quarter. Furthermore, we show that Medicaid expansion increased the Medicaid share of naloxone prescription payments by approximately 10 percent, on average.
One of the most widely discussed strategies to prevent fatal opioid overdose is to increase naloxone access.34, 40, 41, 42 As demand for naloxone has increased, the cost of naloxone has also increased. For example, the list price of the auto‐injector (EVZIO®), when it was first approved by the US Food and Drug Administration (FDA), was $575 for a two‐unit pack, which increased to $4500 after two years (683 percent).43 Similarly, Hospira, a manufacturer of widely used generic naloxone vials, increased the price from $62 for a 10‐mL vial in 2012 to $142 in 2016 (129 percent).44 The needle‐free nasal spray naloxone (Narcan) is similarly priced ($150 for two doses).44 As prices increase, third‐party payer coverage for naloxone plays a crucial role in ensuring naloxone access. This is reflected in our study in which the proportion of naloxone prescriptions paid by cash gradually decreased over time and, by 2016, had decreased to less than 10 percent of all naloxone prescription payments.
Because Medicaid expansion directly affects the number of individuals covered by Medicaid in a state, our finding that Medicaid expansion increased the share of naloxone prescriptions paid by Medicaid is not surprising. Even so, expanding Medicaid coverage does not appear to merely supplant other payers but also contributes directly to increased naloxone availability. Low‐income, nonelderly adults who were newly insured through the expanded coverage may have benefitted differentially. Without Medicaid expansion, many of these individuals likely would have remained uninsured, with limited ability to pay for naloxone out of pocket. This is supported by our supplementary analysis in which the impact of Medicaid expansion on the number of naloxone prescriptions dispensed was estimated by restricting data to Medicaid‐paid naloxone prescriptions. The AME of Medicaid expansion increased from 38 in the main analysis (all‐payer prescriptions) to 65 in the sensitivity analysis (Medicaid‐paid prescriptions).
Furthermore, these data suggest that it will be important to monitor naloxone access as Medicaid waivers are approved and implemented. Individuals at risk for opioid‐related overdose that became eligible under Medicaid expansion and received naloxone prescriptions could be at risk if they now lose eligibility for coverage as a result of waiver changes. As shown in our supplementary analysis, a 1 percent increase in Medicaid enrollment in a state was associated with 85 additional naloxone prescriptions per quarter (Appendix S8).
The number of naloxone prescriptions dispensed sharply increased in 2016 for both expansion and nonexpansion states (Figure 1). This trend is likely due to the implementation of naloxone access laws. Most states adopted naloxone access laws between 2014 and 2016, and by December 2016, a total of 47 states had a pharmacy‐based naloxone law, third‐party prescribing law, or both.13, 35 A similar trend was observed in a previously published study in which national trends in naloxone dispensing were estimated for the period 2007‐2016.13 The authors of that study reported that enactment of either a standing order or third‐party prescribing law was significantly associated with increased naloxone dispensing, with an average increase of 78 naloxone prescriptions per state per quarter. This result is very consistent with our study. Our result suggests that having a naloxone access law (standing/protocol order, direct authority, or third‐party prescribing) is associated with an average increase of 83 naloxone prescriptions per state per quarter. In the present study, we also found that enacting a third‐party prescribing law in addition to a pharmacy‐based naloxone law may have a synergistic effect on increasing naloxone access. A third‐party prescribing law in the absence of a pharmacy‐based naloxone law was associated with an average increase of 82 naloxone prescriptions, whereas having both types of laws was associated with an average increase of 391 prescriptions (Table 2A).
It should be noted that increased naloxone dispensing is an indirect measure of harm reduction. This study did not examine whether the increased availability of naloxone was associated with reductions in opioid overdose mortality. However, a study by McClellan et al40 showed that naloxone access laws are associated with a significant reduction in opioid overdose mortality. Using a DD approach, McClellan and colleagues estimated that having a naloxone access law in a state was associated with an average 15 percent reduction in opioid overdose mortality. Similarly, another study conducted by Abouk et al35 found a gradually increasing effect of pharmacy‐based naloxone laws on reducing fatal overdoses involving opioids. Because these laws are intended to increase retail naloxone dispensing, it is possible to infer that the process of naloxone prescribing and dispensing serves as a potential mechanism for these interventions to reduce the opioid overdose mortality.45, 46 Furthermore, based on the positive association between naloxone dispensing and Medicaid expansion observed in our study, we find that Medicaid expansion may have a potentially significant impact on reducing opioid overdose mortality at the population level.
There are limitations to this study. First, naloxone prescription data do not capture naloxone distributed through nonretail pharmacy outlets including overdose prevention groups or first responders such as police officers, firefighters, and emergency medical technicians. If the amount of naloxone distributed outside of the retail pharmacy distribution channel differs substantially by state, it is possible that states distributing large quantities of naloxone through these alternate channels might have less demand for naloxone prescriptions which would be reflected in our naloxone prescription data. However, we are unaware of studies that estimate the proportion of naloxone supplied outside of retail pharmacies. As such, findings from this study should be applied only to naloxone prescriptions that were dispensed in retail pharmacies. Second, our study reflects naloxone prescription dispensing trends from 2011 to 2016. Harm reduction strategies continue to be implemented in more states, and as a result, the impact of Medicaid expansion and other factors may have changed after 2016. For example, Virginia implemented a regulation, effective 2017, in which practitioners are mandated to coprescribe naloxone for any patient when one or more of the following factors are present: prior overdose, substance misuse, doses in excess of 120 morphine milligram equivalent per day, or concomitant benzodiazepine use.47 Similar mandates were enacted in other states including California, Arizona, Ohio, Washington, Vermont, and Rhode Island in 2017 and 2018.48
In conclusion, between 2011 and 2016, Medicaid expansion was associated with a significant increase in naloxone prescription dispensing, as well as an increase in the share of naloxone prescriptions paid by Medicaid. Considering the benefits of naloxone in preventing opioid‐related deaths, access to naloxone should be considered and assessed when making changes to state‐ and federal‐level laws such as Medicaid expansion rollback.49
DISCLAIMER
The statements, findings, conclusions, views, and opinions contained and expressed in this article are based in part on data obtained under license from the National Prescription Audit, 2011‐2016, IQVIA Inc All Rights Reserved. The statements, findings, conclusions, views, and opinions contained and expressed herein are not necessarily those of IQVIA Inc or any of its affiliated or subsidiary entities.
Supporting information
ACKNOWLEDGMENT
Joint Acknowledgment/Disclosure Statement: We would like to thank Heather Bush and Svetla Slavova for providing statistical advice and Jungjun Bae for assisting with statistical analysis. This research was funded, in part, by the National Center for Advancing Translational Sciences of the National Institutes of Health under award number UL1TR001998 and the National Institute on Drug Abuse of the National Institutes of Health under award number T32 DA016176. Dr Lofwall reported receiving consulting fees from Titan Pharmaceuticals, Inc outside the submitted work.
Disclosures: No other disclosures.
Sohn M, Talbert JC, Delcher C, Hankosky ER, Lofwall MR, Freeman PR. Association between state Medicaid expansion status and naloxone prescription dispensing. Health Serv Res. 2020;55:239–248. 10.1111/1475-6773.13266
REFERENCES
- 1. CDC , National Center for Health Statistics . Wide‐Ranging Online Data for Epidemiologic Research (WONDER). Atlanta, GA: CDC, National Center for Health Statistics; 2018. http://wonder.cdc.gov. Accessed February 8, 2019. [Google Scholar]
- 2. Scholl L. Drug and opioid‐involved overdose deaths — United States, 2013–2017. MMWR Morb Mortal Wkly Rep. 2019;67:1419‐1427. [DOI] [PMC free article] [PubMed] [Google Scholar]
- 3. Overdose Death Rates. https://www.drugabuse.gov. Accessed February 8, 2019.
- 4. Rudd RA, Seth P, David F, Scholl L. Increases in drug and opioid‐involved overdose deaths – United States, 2010–2015. MMWR Morb Mortal Wkly Rep. 2016;65(5051):1445‐1452. [DOI] [PubMed] [Google Scholar]
- 5. The opioid crisis. https://www.whitehouse.gov/opioids/. Accessed July 22, 2018.
- 6. Wheeler E, Jones TS, Gilbert MK, Davidson PJ, Centers for Disease Control and Prevention (CDC) . Opioid Overdose Prevention Programs Providing Naloxone to Laypersons ‐ United States, 2014. MMWR Morb Mortal Wkly Rep. 2015;64(23):631‐635. [PMC free article] [PubMed] [Google Scholar]
- 7. Substance Abuse and Mental Health Services Administration (SAMHSA) . Preventing the consequences of opioid overdose: understanding naloxone access laws. https://www.samhsa.gov/capt/sites/default/files/resources/naloxone-access-laws-tool.pdf Accessed February 8, 2019.
- 8. Prescription Drug Abuse Policy System . http://pdaps.org/datasets/laws-regulating-administration-of-naloxone-1501695139. Accessed July 9, 2018.
- 9. Gabay M. Increasing access to naloxone and legal issues. Hosp Pharm. 2016;51(8):633‐634. [DOI] [PMC free article] [PubMed] [Google Scholar]
- 10. Lim JK, Bratberg JP, Davis CS, Green TC, Walley AY. Prescribe to prevent: overdose prevention and naloxone rescue kits for prescribers and pharmacists. J Addict Med. 2016;10(5):300. [DOI] [PMC free article] [PubMed] [Google Scholar]
- 11. Bonner L. Naloxone access: more states look to pharmacists to increase naloxone access. Pharmacy Today. 2016;22(2):57. [Google Scholar]
- 12. Davis CS, Carr D. Legal changes to increase access to naloxone for opioid overdose reversal in the United States. Drug Alcohol Depend. 2015;157:112‐120. [DOI] [PubMed] [Google Scholar]
- 13. Xu J, Davis CS, Cruz M, Lurie P. State naloxone access laws are associated with an increase in the number of naloxone prescriptions dispensed in retail pharmacies. Drug Alcohol Depend. 2018;189:37‐41. [DOI] [PubMed] [Google Scholar]
- 14. Gertner AK, Domino ME, Davis CS. Do naloxone access laws increase outpatient naloxone prescriptions? Evidence from Medicaid. Drug Alcohol Depend. 2018;190:37‐41. [DOI] [PubMed] [Google Scholar]
- 15. Jones CM, Lurie PG, Compton WM. Increase in naloxone prescriptions dispensed in US Retail Pharmacies Since 2013. Am J Public Health. 2016;106(4):689‐690. [DOI] [PMC free article] [PubMed] [Google Scholar]
- 16. Freeman PR, Hankosky ER, Lofwall MR, Talbert JC. The changing landscape of naloxone availability in the United States, 2011–2017. Drug Alcohol Depend. 2018;191:361‐364. [DOI] [PMC free article] [PubMed] [Google Scholar]
- 17. Bachyrycz A, Shrestha S, Bleske BE, Tinker D, Bakhireva LN. Opioid overdose prevention through pharmacy‐based naloxone prescription program: Innovations in health care delivery. Substance Abuse. 2017;38(1):55‐60. [DOI] [PMC free article] [PubMed] [Google Scholar]
- 18. Green TC, Dauria EF, Bratberg J, Davis CS, Walley AY. Orienting patients to greater opioid safety: models of community pharmacy‐based naloxone. Harm Reduct J. 2015;12(1):25. [DOI] [PMC free article] [PubMed] [Google Scholar]
- 19. Humphreys K. How Medicaid can strengthen the national response to the opioid epidemic. Am J Public Health. 2018;108(5):589‐590. [DOI] [PMC free article] [PubMed] [Google Scholar]
- 20. Huhn AS. Serious about the opioid epidemic? Expand Medicaid. Med Care. 2018;56(5):455. [DOI] [PMC free article] [PubMed] [Google Scholar]
- 21. Meinhofer A, Witman AE. The role of health insurance on treatment for opioid use disorders: evidence from the Affordable Care Act Medicaid expansion. J Health Econ. 2018;60:177‐197. [DOI] [PubMed] [Google Scholar]
- 22. Center for Behavioral Health Statistics and Quality . 2017 National Survey on Drug Use and Health: Detailed Tables. Rockville, MD: Substance Abuse and Mental Health Services Administration; 2018. [Google Scholar]
- 23. Orgera K, Tolbert J.The opioid epidemic and Medicaid's role in facilitating access to treatment. The Henry J Kaiser Family Foundation. 2019. https://www.kff.org/medicaid/issue-brief/the-opioid-epidemic-and-medicaids-role-in-facilitating-access-to-treatment/. Accessed July 17, 2019.
- 24. Olfson M, Wall M, Barry CL, Mauro C, Mojtabai R. Impact of Medicaid expansion on coverage and treatment of low‐income adults with substance use disorders. Health Aff. 2018;37(8):1208‐1215. [DOI] [PMC free article] [PubMed] [Google Scholar]
- 25. Sharma B, Bruner A, Barnett G, Fishman M. Opioid use disorders. Child Adolesc Psychiatr Clin N Am. 2016;25(3):473‐487. [DOI] [PMC free article] [PubMed] [Google Scholar]
- 26. Status of State Action on the Medicaid Expansion Decision. The Henry J Kaiser Family Foundation. 2019. https://www.kff.org/health-reform/state-indicator/state-activity-around-expanding-medicaid-under-the-affordable-care-act/. Accessed September 28, 2019.
- 27. Department of Health and Human Services . Patient Protection and Affordable Care Act: Standards Related to Essential Health Benefits, Actuarial Value, and Accreditation; Final Rule. 45 CFR Parts 147, 155, and 156. [PubMed]
- 28. Frank RG, Fry CE. The impact of expanded Medicaid eligibility on access to naloxone. Addiction. 2019;114(9):1567‐1574. [DOI] [PMC free article] [PubMed] [Google Scholar]
- 29. IQVIA Prescription Information. https://www.iqvia.com. Accessed April 15, 2018.
- 30. Centers for Disease Control and Prevention. U.S. Opioid Prescribing Rate Maps. https://www.cdc.gov/drugoverdose/maps/rxrate-maps.html. Published October 29, 2018. Accessed December 25, 2018.
- 31. SAMHSA Opioid Overdose Prevention Toolkit: Information for Prescribers. HHS Publication No. (SMA) 18 4742PT3. https://store.samhsa.gov/system/files/information-for-prescribers.pdf. Published 2018. Accessed February 7, 2019.
- 32. Dowell D, Haegerich TM, Chou R. CDC guideline for prescribing opioids for chronic pain—United States, 2016. JAMA. 2016;315(15):1624‐1645. [DOI] [PMC free article] [PubMed] [Google Scholar]
- 33. Drug VJP. Overdose deaths among women aged 30–64 years — United States, 1999–2017. MMWR Morb Mortal Wkly Rep. 2019; 68(1):1‐5. [DOI] [PMC free article] [PubMed] [Google Scholar]
- 34. Davis C, Carr D. State legal innovations to encourage naloxone dispensing. J Am Pharmacists Assoc. 2017;57(2):S180‐S184. [DOI] [PubMed] [Google Scholar]
- 35. Abouk R, Pacula RL, Powell D. Association between State Laws facilitating pharmacy distribution of naloxone and risk of fatal overdose. JAMA Intern Med. 2019;179(6):805‐811. [DOI] [PMC free article] [PubMed] [Google Scholar]
- 36. Sohn M, Talbert JC, Huang Z, Lofwall MR, Freeman PR. Association of naloxone coprescription laws with naloxone prescription dispensing in the United States. JAMA Netw Open. 2019;2(6):e196215. [DOI] [PMC free article] [PubMed] [Google Scholar]
- 37. Buis ML, Baum CF, Beck N, et al. Stata tip 87: interpretation of interactions in nonlinear models. The Stata Journal. 2010;10(2):305‐308. [Google Scholar]
- 38. Health Insurance Coverage of the Total Population. The Henry J Kaiser Family Foundation. 2018. https://www.kff.org/other/state-indicator/total-population/. Accessed June 27, 2019.
- 39. StataCorp . Stata Statistical Software: Release 13. College Station, TX: StataCorp LP; 2013. [Google Scholar]
- 40. McClellan C, Lambdin BH, Ali MM, et al. Opioid‐overdose laws association with opioid use and overdose mortality. Addict Behav. 2018;86:90‐95. [DOI] [PubMed] [Google Scholar]
- 41. Adams JM. Increasing naloxone awareness and use: the role of health care practitioners. JAMA. 2018;319(20):2073‐2074. [DOI] [PubMed] [Google Scholar]
- 42. Surgeon General's Advisory on Naloxone and Opioid Overdose. https://www.surgeongeneral.gov/priorities/opioid-overdose-prevention/naloxone-advisory.html. Accessed February 13, 2019.
- 43. Ramsey L.The price of a life‐saving overdose treatment has increased 680% to $4,500 in the last 3 years. Business Insider. http://www.businessinsider.com/price-of-naloxone-auto-injector-evzio-2017-2. Accessed July 22, 2018.
- 44. Gupta R, Shah ND, Ross JS. The rising price of naloxone — risks to efforts to stem overdose deaths. N Engl J Med. 2016;375(23):2213‐2215. [DOI] [PubMed] [Google Scholar]
- 45. Nielsen S, Van Hout MC. What is known about community pharmacy supply of naloxone? A scoping review. Int J Drug Policy. 2016;32:24‐33. [DOI] [PubMed] [Google Scholar]
- 46. Pitt AL, Humphreys K, Brandeau ML. Modeling health benefits and harms of public policy responses to the US Opioid Epidemic. Am J Public Health. 2018;108(10):1394‐1400. [DOI] [PMC free article] [PubMed] [Google Scholar]
- 47. 18VAC85‐21. Regulations Governing Prescribing of Opioids and Buprenorphine (Adding 18VAC85‐21‐10 through 18VAC85‐21‐170) . http://register.dls.virginia.gov. Accessed November 17, 2018.
- 48. Ostrov BF. More States Say Doctors Must Offer Overdose Reversal Drug Along With Opioids. Kaiser Health News 2019. https://khn.org/news/more-states-say-doctors-must-offer-overdose-reversal-drug-along-with-opioids/. Accessed February 26, 2019.
- 49. Rudowitz R, Musumeci M. “Partial Medicaid Expansion” with ACA enhanced matching funds: Implications for Financing and Coverage. The Henry J Kaiser Family Foundation 2019. https://www.kff.org/medicaid/issue-brief/partial-medicaid-expansion-with-aca-enhanced-matching-funds-implications-for-financing-and-coverage/. Accessed July 17, 2019.
Associated Data
This section collects any data citations, data availability statements, or supplementary materials included in this article.
Supplementary Materials