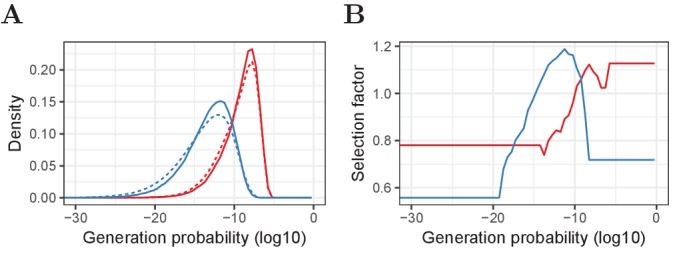
Figure 8. Pre- and post-selection densities and -dependent selection factors for α and β chains.

(A) Relative frequency of generation probabilities of TCRα (red) and TCRβ (blue) sequences in the combined HTS data (solid) and IGoR output (dashed). (B) The bin-specific selection factors are determined by division of the density of a given bin in the HTS data by the density in the pre-selection IGoR output. A value of 1 means that a sequence with this has an average probability to be selected in the thymus, whereas lower values indicate stronger selection and higher values weaker selection (i.e., a higher probability to pass selection).
