

Population variability in social lifestyle is reflected in brain morphology in sex-dependent ways.
Abstract
In human and nonhuman primates, sex differences typically explain much interindividual variability. Male and female behaviors may have played unique roles in the likely coevolution of increasing brain volume and more complex social dynamics. To explore possible divergence in social brain morphology between men and women living in different social environments, we applied probabilistic generative modeling to ~10,000 UK Biobank participants. We observed strong volume effects especially in the limbic system but also in regions of the sensory, intermediate, and higher association networks. Sex-specific brain volume effects in the limbic system were linked to the frequency and intensity of social contact, such as indexed by loneliness, household size, and social support. Across the processing hierarchy of neural networks, different conditions for social interplay may resonate in and be influenced by brain anatomy in sex-dependent ways.
INTRODUCTION
Being part of social networks provides key advantages. According to the “social brain hypothesis,” neocortex volume in primates coevolved with the cognitive skills required for coping with the complex social dynamics of increasingly large groups (1). Effective coordination of social groups, in turn, allows animals to solve pressing ecological problems of the physical environment.
Across primate species including humans, neocortex volume was found to correlate with various indices of social complexity, including average social network size (2), the capacity to predict others’ actions (3), and tactical deception maneuvers (1). Yet, male and female monkeys play distinct roles in primate societies. For instance, female primates invest more energy in childcare and strengthening social bonds to close allies (4). Instead, male primates invest more heavily in competition and managing the dominance hierarchy (5). Because male and female social behaviors may have been shaped by different needs and goals, we might expect that these have selected for specific neurocognitive adaptations.
Recent evidence speaks to a sex-specific extension of the social brain hypothesis. The neocortex size of primates correlates with group size in females better than it does for males, which suggests sex-specific selection pressures during natural selection (6). On the other hand, the reproductive success of male primates correlated with the size of their neocortex (7). This hints at the advantage of having more neurocognitive performance to navigate social relationships.
Sex explains much of the phenotypic variability in primate species, including humans. Even baby boys and girls tend to judge the salience of environmental cues differently: Newborn boys preferred viewing a physical-mechanical object, whereas newborn girls preferred viewing human faces (8). Similarly, young girls have been shown to make more eye contact with their caregivers than boys (9). During development, girls have been shown to detect faux pas earlier than boys (10). Sex differences in social bond formation exist across the life span [e.g., (11)].
In adult humans, neuroimaging experiments reported sex-typed neural activity patterns, even with the same behavioral performance. Such observations suggest that men and women may process the same environmental information in some unique ways. A seminal experiment on empathy (12) that administered painful stimulation to self and others found that the pain-responsive brain regions were bilaterally activated when experiencing pain oneself or observing others in pain in both sexes. However, the infliction of pain on unfair others was linked to increased neural activity in the reward circuitry in men, but not in women. Consistently, men reported a stronger desire for revenge than women (12).
Such differences in social behavior may have correspondences in brain architecture. Neuroimaging studies in adults indicate that, on average, men have larger brains than women (13, 14). Sex-specific cortical folding patterns emerge already during early development in the anterior frontal lobe, an area intimately involved in distinctly human cognitive capacities (15). As another structural brain difference potentially underlying behavioral variability linked to human sex, diffusion imaging in 949 participants showed that women typically have more axon bundles in the corpus callosum than men (16), which is the largest fiber tract in the human brain. These findings are suggestive of differential connectivity both within the frontal lobe and between both hemispheres. Furthermore, human neuroimaging studies identified that amygdala (AM) volume showed a close association with the number of people in one’s social networks (2). Subanalyses revealed that this group-averaged volume effect was largely driven by the examined female participants. Last, significant sex differences have also been reported in cortical cytoarchitecture from postmortem studies (13).
Ten years of magnetic resonance imaging (MRI) studies on possible sex differences have recently been systematically analyzed (17). The authors provide evidence that this literature suffers from publication bias given that exceedingly many statistically significant sex differences have been reported. At the same time, such neuroimaging studies were also found to be chronically underpowered given typically small sample sizes. For instance, in 2009 and 2010, most of these neuroimaging studies considered fewer than 16 participants in each examined subgroup (18). Small-sample studies on the male brain versus female brain are particularly vulnerable to false-positive and false-negative findings. This is even more the case because the distribution of sex-related brain measurements show mostly subtle sex features and are increasingly recognized to bear substantial overlap in the general population (14).
In summary, earlier findings suggest that sex idiosyncrasies in the neurocognitive strategies needed to cope with social life manifest themselves in multifaceted ways in the brain. Therefore, our study probed sex differentiation in social brain morphology in 36 total regions based on sociodemographic and lifestyle factors for ~10,000 individuals from the uniformly acquired UK Biobank. We used a recent social brain atlas that was defined by synthesizing data from 3972 social affective functional MRI experiments involving several thousand participants (19). We implemented a clean approach to explicitly model the extent of similarity between male- and female-specific brain volume patterns related to a wide range of social contexts, including family, free time, and work life. Each analysis with this method jointly modeled all social brain regions with their relation to four participant groups (Table 1): simultaneously examining males versus females living in more enriched versus less enriched social environments. We, thus, revisited the long-standing question of sex gap from a probabilistic perspective that provides the ability to precisely chart population variation in social brain anatomy.
Table 1. List of social lifestyle markers from the UK Biobank.
Each examined trait from the UK Biobank is shown alongside its UK Biobank field identification number. Each social trait was analyzed in four groups according to sex and the richness of the social environment. Each trait can be considered as one of three determinant groups, defined by traits related to social interactions with family and close others (inner support group), traits related to social interactions outside of the family (outer sympathy group) and traits related to place in the social hierarchy (socioeconomic status).
| Social trait | UKBB-ID | Group 1 | Group 2 | Group 3 | Group 4 | Determinant |
| Job | 22617-0.0 | Women without a social job |
Women with a social job |
Men without a social job |
Men with a social job |
Outer sympathy group |
| Friendship satisfaction |
4570-0.0 | Women with low friendship satisfaction |
Women with high friendship satisfaction |
Men with low friendship satisfaction |
Men with high friendship satisfaction |
Outer sympathy group |
| Family satisfaction | 4559-0.0 | Women with low family satisfaction |
Women with high family satisfaction |
Men with low family satisfaction |
Men with high family satisfaction |
Inner support group |
| Household size | 709-0.0 | Women living with up to one person in household |
Women living with two or more people in household |
Men living with up to one person in household |
Men living with two or more people in household |
Inner support group |
| Living alone | 709-0.0 | Women living alone | Women living with others |
Men living alone | Men living with others | Inner support group |
| Siblings | 5057-0.0 | Women with siblings |
Women without siblings |
Men with siblings | Men without siblings |
Inner support group |
| Romantic partners | 2149-0.0 | Women with one romantic partner |
Women with more romantic partners |
Men with one romantic partner |
Men with more romantic partners |
Outer sympathy group |
| Social support | 2110-0.0 | Women with low social support |
Women with high social support |
Men with low social support |
Men with high social support |
Inner support group |
| Sports club | 6160-0.0 | Women not in a sports club |
Women in a sports club |
Men not in a sports club |
Men in a sports club | Outer sympathy group |
| Weekly social activity | 6160-0.0 | Women without weekly social activity |
Women with weekly social activity |
Men without weekly social activity |
Men with weekly social activity |
Outer sympathy group |
| Loneliness | 2020-0.0 | Women feeling lonely |
Women not feeling lonely |
Men feeling lonely | Men not feeling lonely |
Inner support group |
| Income | 738-0.0 | Women with low income |
Women with high income |
Men with low income |
Men with high income |
Socioeconomic status |
| Health care | 4674-2.0 | Women with public health care |
Women with private health care |
Men with public health care |
Men with private health care |
Socioeconomic status |
RESULTS
We go new ways to explore possible sex disparities in social brain anatomy using a fully probabilistic approach (see Materials and Methods). Most previous social neuroscience studies on sex differences tried to draw sharp boundaries for regional volumes using classical null hypothesis testing and P value thresholds, most often in small samples (17). The present study aimed at quantitative answers to a distinct question: “How certain are we that the volume of a social brain region is nonidentical in men and women in a population cohort, and what is the magnitude of this divergence?” Our analytical approach involved estimating the complete shape of normative population uncertainty of region volume effects in the context of sex and social traits. In the following, “volume effect” refers to model parameters that explain variation in regional gray matter volume depending on sex and social traits across age groups (cf. Materials and Methods). The gray matter posterior parameter distributions shed light on degrees of overlap between sex-related social traits in a population neuroscience context.
Limbic system regions showed the strongest sex-specific volume effects
Across the analyzed social traits, regions of the limbic network showed particularly strong structural volume effects compared with regions belonging to the visual sensory, intermediate, or higher associative networks the social brain (cf. fig. S4). In particular, the AM and ventromedial prefrontal cortex (vmPFC) showed population volume effects in various sectors of social behavior. Regarding social relationships in the inner circles, we found evidence for various structural deviations in the AM and vmPFC. Analyzing the number of people living in the same household (Fig. 1), women sharing their home environment with several individuals showed higher volume effects in the AM [mean of the population volume posterior distribution = 1.238, highest density interval of the population volume posterior distribution covering 95% uncertainty (HPDI) = 1.008 to 1.477] than women interacting with fewer people at home (posterior mean = 0.352, HPDI = 0.120 to 0.576). In contrast, in men, different household sizes were associated with much more overlapping volume parameter distributions for the AM. In contrast, in the vmPFC, sex-specific volume effects emerged for men experiencing less rich social dynamics at home (posterior mean = 0.134, HPDI = 0.037 to 0.226) compared with men living in more socially stimulating homes (posterior mean = −0.042, HPDI = −0.145 to 0.064). This family trait showed more similar vmPFC volume distributions in women.
Fig. 1. Sex disparity in the association between limbic system morphology and the richness of social interaction.
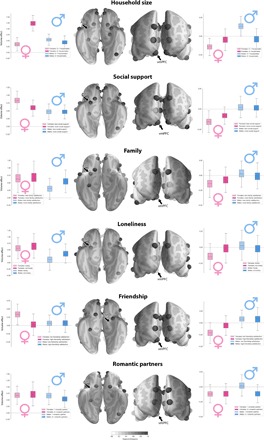
Marginal posterior population distributions uncover the degree of sex overlap in social brain anatomy for several social traits. Among all target regions, many strong volume effects were apparent in the AM and vmPFC of the limbic network (cf. the Supplementary Materials). For each index of less and more rich social life (light versus dark colors), boxplots show the estimated population volume parameter distribution of the AM and vmPFC for men and women (blue versus pink colors). Each set of four boxplots juxtaposes the probabilistic relevance of a region’s volume in explaining sex and social trait, taking into account positive and negative volume effects of the 35 remaining social brain regions. Vertical axis indicates the brain volume effect obtained from z-scored region averages measured by T1-MRI. Black arrows indicate the brain region corresponding to the boxplots. Transparency level of the brain regions reflects the degree of divergence in population volume dispersion between the four social/sex groups (less transparent = more divergence according to Kullback-Leibler distance). The collective results may speak to sex-specific sensitivity of limbic system structures to the quality and quantity of social exchange.
Furthermore, the quality of social exchange in close relationships revealed female-specific gray matter volume effects in the AM and vmPFC of the limbic system. In the AM, women with fewer opportunities for exchange with emotionally close others showed larger volume effects (posterior mean = 0.832, HPDI = 0.599 to 1.049) compared with women with stronger close social ties (posterior mean = 0.604, HPDI = 0.425 to 0.789). In the vmPFC, women with fewer opportunities to share experiences and thoughts with close others also showed stronger volume effects (posterior mean = −0.157, HPDI = −0.248 to −0.066) compared with women with ample social support (posterior mean = −0.082, HPDI = −0.165 to −0.004). In men, however, the posterior population distributions of region effects showed considerable overlap in both the AM and vmPFC as a function of the quality of social support. In another aspect of the inner social circles, we detected some evidence for regional anatomical divergence within males as a function of the satisfaction with one’s family. A larger AM volume effect was observed for men expressing happiness with their relationships (posterior mean = 0.550, HPDI = 0.280 to 0.835) with family members compared with men who feel unhappy about their family life (posterior mean = 0.310, HPDI = 0.020 to 0.611). However, for women, family satisfaction was related to largely overlapping volume parameter distributions for the AM (women with low family satisfaction: posterior mean = 0.651, HPDI = 0.288 to 1.043; women with high family satisfaction: posterior mean = 0.673, HPDI = 0.264 to 1.131). In addition, in women, some volume parameter deviations in the vmPFC were observed for this family trait (women with low family satisfaction: posterior mean = −0.141, HPDI = −0.310 to 0.016; women with high family satisfaction: posterior mean = −0.074, HPDI = −0.243 to 0.091). Men, in contrast, showed vmPFC volume parameter distributions with little volume effect as a function of the quality of family interactions (men with low family satisfaction: posterior mean = 0.033, HPDI = −0.127 to 0.199; men with high family satisfaction: posterior mean = −0.017, HPDI = −0.172 to 0.136).
In addition to traits characterizing the inner social circles, we also found several anatomical divergences in the social brain linked to the wider social interaction circles. Male- and female-specific volume effects were observed in the AM and vmPFC for loneliness, a proxy for the number or quality of social relationships (Fig. 1). In the AM of the limbic system, the population parameter distributions of region volume deviated between lonely men (posterior mean = 0.123, HPDI = −0.183 to 0.448) and socially satisfied men (posterior mean = 0.355, HPDI = 0.096 to 0.646), while lonely and socially engaged women showed more overlapping volume effects. In contrast, in the vmPFC, lonely women showed structural deviations (posterior mean = −0.141, HPDI = −0.282 to 0.014) compared with women who feel well surrounded (posterior mean = −0.015, HPDI = −0.188 to 0.159). Yet, men showed largely overlapping vmPFC volume parameter distributions in the context of the feeling of loneliness. Social interactions outside of the family, particularly investing in close and satisfying friendships, showed a female-specific volume effect in both the AM and vmPFC. Women with unsatisfying friendships showed the largest volume deviations in both the AM (posterior mean = 0.336, HPDI = 0.104 to 0.560) and vmPFC (posterior mean = −0.210, HPDI = −0.386 to −0.041). Men showed considerable overlap in the volume parameter distributions of both AM and vmPFC regarding friendship quality.
In another aspect of social investments in the broader social networks, some structural deviations in both the AM and vmPFC were observed in men. Men who have experienced more romantic relationships throughout life deviated in AM volume (posterior mean = 0.537, HPDI = 0.291 to 0.796) compared with men who have had committed to a single romantic partner (posterior mean = 0.666, HPDI = 0.414 to 0.919). In the vmPFC, a similar sex-specific effect was observed. Men with a single lifetime partner showed vmPFC volume parameter distributions (posterior mean = 0.021, HPDI = −0.107 to 0.156) that were incongruent with men who have had more intimate relationships in their life (posterior mean = −0.116, HPDI = −0.235 to 0.002). In contrast, in both the AM and vmPFC, women showed considerable overlap in volume parameter distributions in the context of romantic social investments. Together, our population evidence reveals marked patterns of male and female volume variation in the limbic network related to family relationships as well as social experience outside of the family.
The reward system shows strong volume effects specific to men
In the nucleus accumbens (NAC) of the limbic network, our analyses revealed a consistent pattern of population volume effects across sectors of social determinants. Across different social traits, we observed that men exposed to a less enriched social environment showed volume parameter deviations in this key node of the reward circuitry.
As an aspect of the inner support group, men receiving less social support from close others showed the larger NAC volume effects (posterior mean = 0.083, HPDI = −0.040 to 0.188) than men with more opportunities for social exchange (posterior mean = −0.016, HPDI = −0.111 to 0.081). In contrast, women showed overlapping NAC volume parameter distributions for this social trait of inner social circles (Fig. 2). Another male-specific volume effect was identified in a family-related trait. Men who grew up without brothers and sisters showed a volume effect in the NAC (posterior mean = 0.078, HPDI = −0.084 to 0.248) compared with males who grew up with a fuller household (posterior mean = −0.003, HPDI = −0.180 to 0.153). However, our female participants showed overlapping volume parameter distributions in this reward region in the context of household sizes.
Fig. 2. Similar volumetric divergences in the reward circuitry in men with fewer social interactions and low indicators of social hierarchy.
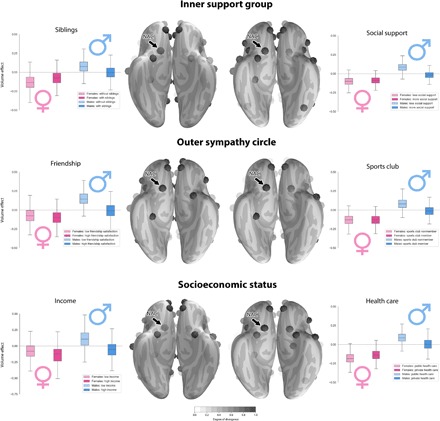
Marginal posterior population distributions reveal similar volume parameter divergences in the reward circuitry of the social brain. Across analyses of six social traits, the NAC showed a sex-specific volume parameter pattern. In the six social traits, the female groups showed largely congruent population volume parameter distributions in NAC anatomy. The collective results suggest sex idiosyncrasies in neural processing of social and nonsocial reward cues.
Paralleling these findings, social exchange with friends and peers was again related to male-specific structural NAC deviation (Fig. 2). Men with less satisfying friendships (posterior mean = 0.151, HPDI = −0.026 to 0.342) showed a larger volume effect compared with men with stronger ties to their friends (posterior mean = −0.009, HPDI = −0.177 to 0.172). This pattern in volume variation in the context of maintaining close contact with friends was not observed among women. The male-specific trend in NAC volume effects is extended to include sports club membership. Men who do not belong to a sports club showed a larger volume effect in the NAC (posterior mean = 0.081, HPDI = −0.062 to 0.211) compared with men regularly attending a sports club (posterior mean = −0.013, HPDI = −0.146 to 0.130). In contrast, regular attendance of a sports club was associated with largely overlapping parameter distributions for NAC volume among women.
Furthermore, socioeconomic status can be a key factor in the dynamics of social dominance and here revealed additional sex-specific NAC volume effects. Men with less socioeconomic resources overall showed the largest morphological effects in NAC volume (Fig. 2). Specifically, low-income men showed a larger volume effect in this social brain region (posterior mean = 0.110, HPDI = −0.181 to 0.398) compared with men earning a higher income (posterior mean = −0.058, HPDI = −0.306 to 0.188). In contrast, women showed largely overlapping NAC volume parameter distributions depending on yearly salary.
Type of health care insurance revealed an additional male-specific pattern of morphological divergence in the NAC. Men with public health care showed a diverging volume effect (posterior mean = 0.091, HPDI = −0.042 to 0.223) compared with men paying into private health care (posterior mean = 0.003, HPDI = −0.149 to 0.156). However, overlapping distributions in NAC volume were observed for women covered by public health insurance and women with private health care. Together, we provide evidence of a male-distinctive structural phenotype in a limbic region that encompasses life history markers related to family network size, richness of social interactions in the outer sympathy group, and socioeconomic status. Notably, men with fewer opportunities for social interaction and with a lower status in the social hierarchy showed similar volume effects in components of the social brain related to reward-guided behavior.
The visual sensory, intermediate, and higher associative networks show various sex-specific volume effects
Complementary to our observations in the limbic network, our definition of the social brain also contains the visual sensory, intermediate, and higher associative networks (19). These sets of regions presented several volume effects across the overall network with respect to several social traits. In addition to quantifying region volume effects within a network, our probabilistic modeling approach also assessed coherent volume variation in entire brain networks. At the lowest level of the neural processing hierarchy (19), sex-dependent volume effects of circuits processing visual sensory cues were mostly observed in measures of social interactions in everyday life (Fig. 3). Notably, lonely women (posterior mean = −0.135, HPDI = −0.218 to −0.058) showed an overall network volume effect compared to well-surrounded women (posterior mean = −0.063, HPDI = −0.155 to 0.040). However, the feeling of loneliness was associated with more overlapping network parameter volume distributions for men.
Fig. 3. Sex-specific volume effects at the network level.
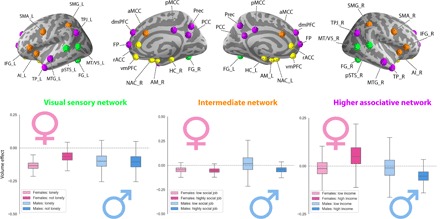
In addition to the within-network volume effects (Figs. 1 and 2), our analyses estimated marginal posterior population distributions for the overall network volume effects of the social brain: visual sensory (green), limbic (yellow; not shown since weakest effects as a whole network), intermediate (orange), and higher associative networks (purple). As such, sex-related anatomical divergences also become apparent for subsets of social brain regions, known to be functionally cohesive. AI_L, left anterior insula; AI_R, right anterior insula; AM_L, left amygdala; AM_R, right amygdala; aMCC, anterior mid-cingulate cortex; Cereb_L, left cerebellum; Cereb_R, right cerebellum; dmPFC, dorsomedial prefrontal cortex; FG_L, left fusiform gyrus; FG_R, right fusiform gyrus; FP, medial frontal pole; HC_L, left hippocampus; HC_R, right hippocampus; IFG_L, left inferior frontal gyrus; IFG_R, right inferior frontal gyrus; MTG_L, left middle temporal gyrus; MTG_R, right middle temporal gyrus; MT/V5_L, left middle temporal V5 area; MT/V5_R, right middle temporal V5 area; NAC_L, left nucleus accumbens; NAC_R, right nucleus accumbens; PCC, posterior cingulate cortex; pMCC, posterior mid-cingulate cortex; Prec, precuneus; pSTS_L, left posterior superior temporal sulcus; pSTS_R, right posterior superior temporal sulcus; rACC, rostral anterior cingulate cortex; SMA_L: left supplementary motor area; SMA_R, right supplementary motor area; SMG_L, left supramarginal gyrus; SMG_R, right supramarginal gyrus; TP_L, left temporal pole; TP_R, right temporal pole; TPJ_L, left temporo-parietal junction; TPJ_R, right temporo-parietal junction; vmPFC, ventromedial prefrontal cortex.
In the intermediate network of our social brain atlas, a series of volume effects was observed in these parts of the human cortex commonly related to salience and relevance detection (19). Men with fewer opportunities for social interaction in the workplace (Fig. 3) showed large volume parameter dispersion in the intermediate network (posterior mean = 0.016, HPDI = −0.155 to 0.195) compared with men with a more social professional occupation (posterior mean = −0.046, HPDI = −0.115 to 0.016). However, women showed more overlapping network volume distributions in relation to daily opportunities for social exchange with colleagues. As another aspect of the wider social circles, men unhappy with their friendships (posterior mean = −0.068, HPDI = −0.148 to 0.015) showed a stronger intermediate network volume effect compared with men with satisfying friendships (posterior mean = −0.036, HPDI = −0.102 to 0.036) (not shown). In the context of leisure activities, men and women with regular social engagements were more congruent in intermediate network volume (women with weekly social activities: posterior mean = −0.037, HPDI = −0.079 to 0.000; men with weekly social activities: posterior mean = −0.030, HPDI = −0.072 to 0.015) (not shown). Similarly, men and women without weekly social activities showed more overlapping network volume distributions (women without weekly social activities: posterior mean = −0.030, HPDI = −0.083 to 0.025; men without weekly social activities: posterior mean = −0.036, HPDI = −0.104 to 0.037) (not shown).
Last, in the higher associative network, which comprises regions known to be associated with complex cognitive processes such as mental perspective-taking (19), we observed that the income earned by each of our examined participants showed gray matter variation. Notably, high-income men (posterior mean = −0.052, HPDI = −0.113 to 0.007) and high-income women (posterior mean = 0.053, HPDI = −0.096 to 0.207) showed opposite patterns of network volume effects. However, men with a lower income and women with a lower income showed largely overlapping higher-order network distributions. Our collective results witness extensive sex differentiation of region and network volume variation linked to the richness of social interplay with family, friends, and peers.
DISCUSSION
Sex is one of the most evolutionarily conserved phenotypical distinctions in biology. For that reason, we might expect to find evidence for it in the neuroanatomical underpinnings of human social behavior. Using fully probabilistic modeling, we estimated possible sex gap in the human social brain as directly supported from the data. In this way, we provide a population-level window into the brain associations with social behavior across a range of sociodemographic and life history traits.
Our findings provide a notable demonstration of the coherent links between the richness of one’s social environment and interindividual variation in brain volume. Consistently, in monkeys, introducing more housemates into the cage for daily social interaction has led to volume adaptations including the prefrontal cortex and AM (20). Humans also have shown volume effects in these brain regions putatively as a function of the diversity and frequency of their social exchanges as well as the capacity to mentalize or model other persons’ thoughts (2, 3). One human neuroimaging study found that the richness and extent of one’s social circles correlate with the individual AM volume (2). Another neuroimaging study highlighted the relevance of the vmPFC volume by demonstrating its relation to both social network size and interindividual differences in perspective-taking skills (3). Our study carefully dissects such coarse sex-averaged findings by probabilistic modeling of anatomical variability in ~10,000 humans related to important indices of social context.
A previous large-scale neuroimaging study highlighted prominent sex-dependent divergences in the vmPFC and other regions implicated in emotion-guided decision-making (14). Detailing these previous observations, our analyses related living in a household with few people to opposite vmPFC volume effects in men and women at the population level. We here relate a bigger household size to a larger female-specific volume effect in the AM that we did not observe in men. In addition, we have associated feelings of loneliness to male-specific AM volume patterns. Lonely women deviated more in vmPFC anatomy, perhaps implying that they reflected more on their social state than men do. For both the satisfaction with one’s friendships and frequent opportunities to confide to other people, women showed more substantial anatomical effects in the AM and vmPFC compared with men. Furthermore, feeling satisfied with family relationships was manifested in the vmPFC especially in women, whereas men showed vmPFC volume effects with the number of lifetime sexual partners. Some of our observed volumetric trends may underlie women’s typically higher number of close social contacts and usually better performance in mental perspective-taking (21). We thus offer a clearer understanding of how the complexity of one’s social environment is linked to brain circuits in a sex-dependent manner, perhaps due to some unique cognitive and coping strategies.
In line with the prominence of our findings in the limbic medial temporal lobe and medial prefrontal lobe, axonal tracing studies in macaque monkeys identified directional projections from the AM and hippocampus, especially to the medial and orbital prefrontal cortex (22). These direct inputs from the medial temporal limbic systems are in line with the putative integrative role of the medial prefrontal cortex. Bodily affective states and external cues may be bound in the medial prefrontal cortex for the purpose of perspective-taking and other advanced forms of social-affective capacities, with sex-dependent idiosyncrasies.
Gray matter volume of both vmPFC and ventral striatum was correlated with social reward attitudes and behavior in previous human neuroimaging research (23). These authors related a questionnaire capturing interindividual differences in stable reward dependence traits to correspondences in structural brain scans. The uncovered volume effects in the vmPFC and NAC were interpreted as reflecting a natural disposition toward social interaction and social attachment in humans, featuring men-specific volume effects in the vmPFC and NAC in line with our findings. Our results suggest that men, in particular, show social environment–sensitive volume effects in the NAC of the reward circuitry in several examined markers. We also observed similar volumetric patterns in two socioeconomic status indices: low-income men and men with public, as opposed to private, health care. Social interaction dynamics may provide both nonsocial material rewards such as money (24) and social rewards such as approval by peers (25). Moreover, a study on phone usage behavior in millions of people investigated the social network dynamics in men and women (11). The authors found that social network size tended to decrease for men and increase for women across the life span. In particular, in early adulthood, men were reported to have richer social circles than women (at age 25) on average. However, later on in adulthood (starting at age 39), the effect reverses, and the social network size decreases faster in men than in women. Furthermore, women contacted members of their social network more often, with more insistence, and had longer conversations (11). In our male participants, NAC volumes were sensitive to interindividual differences in social support and family structure. In contrast, our female participants with a smaller inner “support group” (21) did not show such effects in the NAC.
Collecting information about others in a social group potentially aids future social decision-making (26), which is related to reading others’ faces (27) or planning tactical action (1). Human neuroimaging experiments indicated that receiving information from others (28) or information about action on others (12) may be perceived as more valuable than many nonsocial rewards, like receiving money. These studies also reported that humans can experience the same social reward cue in nonidentical ways, depending on sex and other demographic factors. In line with this, a behavioral experiment showed that thirsty male monkeys readily sacrificed a nonsocial primary reward, such as juice, to be able to view photos of peers and potential female mating partners (29). In addition, mating success in males is related to bigger neocortex size [cf. (1)], which includes regions associated with reward-guided strategic thinking.
These previous findings suggest a link between social brain anatomy and a role for reward processing in socially engaged males. These findings on social reward preference may relate to our NAC volume effects in men with less social exchange across inner and outer social circles. In particular, our social indices of the outer (i.e., friendship satisfaction and sports club membership) and inner (i.e., social support and family network size) social circles showed comparable patterns of volume parameter distributions. This invites the speculation that the structural plasticity of the reward-related circuit nodes may be more reactive to social information and exchange in men, rather than women, perhaps because men have weaker social ties on average (21).
In line with our findings, the repercussions of diminished frequency and intensity of social interaction may be traced to dopaminergic neurotransmitter pathways implicated in reward processing (30). In a behavioral study in male primates, monkeys were socially isolated for some time. After social rehabilitation, less socially interactive males with fewer grooming opportunities displayed hyperactive dopamine responses, not present before the isolation condition. Longer socially deprived monkeys were observed to self-administer more reward-inducing drugs than socially integrated monkeys. The authors concluded that a selective neurobiological adaptation to an altered social environment may have led to reward-induced neural activity, potentially rendering nonsocial rewards to be more valuable.
In a human neuroimaging study, men showed stronger neural responses in the NAC to the anticipation of nonsocial monetary rewards than to social rewards (31). In contrast, in women, both social and nonsocial rewards evoked similar neural responses (31). At the behavioral level, men also responded faster to stimuli indicating high monetary, rather than social, reward gains. Instead, women’s response speed did not significantly differ according to the type or magnitude of expected reward outcomes. We here provide clues that these previously identified social versus nonsocial dopaminergic mechanisms may have diverging neural bases in men and women (30). This may pertain to the similar volume pattern deviations in men for several socioeconomic indices, which we did not observe in women. Similarly, painful stimulation to an unfair player of an economic game was reported to trigger reward processing that implicated the NAC in men, but not in women (12). The authors interpreted men to show distinct valuation processes accompanied by less empathy-related neural responses to unfair persons than women. The male participants were proposed to prefer punishment of unfair opponents. Together, our population imaging findings suggest that the NAC of the limbic social brain has a differentiated relation to nonsocial and social rewards in men and women.
Examining volume effects of entire networks that compose the human social brain, we also report sex-selective anatomical divergences linked to indices of sociality. At our lowest level of the neural processing hierarchy, the volume of the sensory network diverged in lonely versus socially well-embedded women, but not in men. Many studies in social neuroscience have been based on face perception—arguably a biologically evolved adaption to the exchange of social information. Faces may enable a most efficient information transfer between humans and among other primates. Fusiform gyrus, posterior superior temporal sulcus, and MT/V5 in the sensory network are consistently recruited during judgments on facial identity or facial expression (32). Lesions in these regions interfere with processing of face, mimicry, and gaze in both humans and monkeys [e.g., (33)]. The posterior superior temporal sulcus has often been thought to preferentially process dynamic features of others’ faces, such as emotional expressions and gaze direction relevant for joint attention. In contrast, the fusiform gyrus is frequently thought to preferentially process stable features of others’ faces, such as identity, attractiveness, sex, and age. Our data invite us to speculate that felt loneliness is distinctly associated with appraisal of the visual social environment in our female participants.
At the intermediate level of the neural processing hierarchy, our male participants with less social jobs and those with weaker friendship circles showed distinct volume effects. In particular, men working in an occupation with fewer opportunities for daily social exchange showed the largest variation in volume in the intermediate network. Both men and women with some weekly social activity showed smaller anatomical effects of the intermediate network. In an interactive game during functional MRI scanning, several of these regions increased activity during the experience of social exclusion (34), which correlated with perceived distress. This study suggested that humans undergoing hurtful experiences in social interaction may recruit neural systems also involved in managing physical pain. These authors argued that social separation or rejection may be neurally processed as an existential threat given the adaptive value of social bonds in humans and other primate societies. As such, our data can be read as suggesting possible sex differentiation in how humans undergo and integrate being excluded from social interplay with others.
Longitudinal structural plasticity was recently demonstrated in regions belonging to our intermediate network induced by affective compassion training of 332 matched adults (35). This seminal study (35) also showed that several months of cognitive training for improving perspective-taking resulted in structural remodeling in regions belonging to our highly associative social network (19), parts of which are also referred to as “default mode” network. This social neuroscience study demonstrated structural plasticity in aspects underlying social intelligence by targeted mental training intervention. Submitting participants to daily practice of socioemotional (more related to empathy) or sociocognitive (more related to perspective-taking) capacities, regional gray matter was selectively modulated, which is implicated in processing social information. According to these investigators, training to see the world through others’ eyes may promote cooperation and well-being in professional life. Our cross-sectional population results are complementary to these previous findings and are consistent with the suggested long-term manifestations of sex-specific plasticity in the human social brain.
We here show that the anatomy of the top-level network diverged in high-income men compared with high-income women. In this way, we corroborate and characterize in further detail the previous observation that the higher-association cortices feature network-specific sex divergence in human neuroimaging (14). Its anatomy has further been shown to differ depending on social network size and social cognitive performance in navigating relationships with other humans (3, 36). Our findings of sex dissimilarities are noteworthy because this high-level network is believed to subserve many of the most complex social faculties, including moral judgments, participating and learning from social interaction, and anticipating future scenarios (37). The ability of the default mode network to subserve recursive, less constrained neural processing, together with its wide-ranging interplay with subordinate brain systems (38), may provide an important basis for social decision-making in everyday life.
As a note of caution, structural imaging research based on T1-weighted brain scanning has so far struggled to attach unambiguous meaning to findings of more or less gray matter volume in specific brain locations (36). An increase in this quantity could indicate higher density of cell populations, only some of which need to be neurons, or their substructures, like cell bodies or axons. While an increase in this quantity has repeatedly been observed to be associated with enhanced cognitive performance, various counterexamples have reported reduced functional capacity. In particular, neuronal pruning processes are one candidate mechanism how less regional volume may allow for computational efficiency gains in a specific cognitive process (36).
CONCLUSION
Sex differentiation in the human social brain may often be of degree, not of kind. Much previous research noted considerable sex overlap in human behavior, brain, and genes (14, 39). Even meta-analyses often concluded sex differences to be unexpectedly small. By probabilistic population modeling of brain anatomy and social relationship traits in ~10,000 individuals, we delineated rich patterns of similarity and dissimilarity in the brains of men and women. While our cross-sectional approach cannot disentangle nature against nurture, long-term plasticity effects in masculine or feminine social brain circuitry may be speculated to be different and sometimes opposite as a result of living in the same social environments. Daily social interaction with family, friends, and colleagues may influence brain circuitry differently in males and females. This insight would have far-reaching implications at the evolutionary, developmental, bioregulatory, and sociological scales. Our quantitative investigation supports the idea that human survival has been optimized toward sex-specific strategies to successfully navigate the social world.
MATERIALS AND METHODS
Data resources
The UK Biobank is a population epidemiology resource that offers extensive behavioral and demographic assessments, lifestyle, and cognitive measures, as well as biological samples in a cohort of 500,000 participants recruited from across Great Britain (https://www.ukbiobank.ac.uk/). This openly accessible population dataset aims to provide multimodal brain imaging for 100,000 individuals to be completed in 2022 (39). The present study was based on the data release providing brain imaging from 10,129 individuals to detail population variation in gray matter morphology of the social brain as measured by T1-weighted structural MRI. To improve comparability and reproducibility, our study profited from the uniform data preprocessing pipelines designed by FMRIB, Oxford, UK (39). We extracted available social, affective, and lifestyle-related summary measures characterizing aspects of social behavior for consideration in the present analyses (Table 1; see figs. S1 to S3 for their mutual relationships). Social traits that are provided as continuous information by the UK Biobank were dichotomized using median splitting. Our study involved a population sample of 10,129 participants [52.4% females, aged 40 to 69 years when recruited with mean age 55 ± 7.5 (SD) years]. The present analyses were conducted under UK Biobank application number 23827. All participants provided informed consent to participate. Further information on the consent procedure and ethics approval can be found here (http://biobank.ctsu.ox.ac.uk/crystal/field.cgi?id=200).
Brain imaging preprocessing procedures
Identical MRI scanners (3T Siemens Skyra) were used at the same imaging site with the same acquisition protocols and standard Siemens 32-channel radiofrequency receiver head coils. To protect the anonymity of the study participants, brain imaging data were defaced, and any sensitive information from the header was removed. Automated processing and quality control pipelines were deployed (39). To improve homogeneity of the brain imaging data, noise was removed by means of 190 sensitivity features. This approach allowed reliably identifying and excluding problematic brain scans, such as those with excessive head motion.
The structural MRI data were acquired as high-resolution T1-weighted images of brain anatomy using a three-dimensional (3D) MPRAGE (magnetization-prepared rapid gradient-echo) sequence at 1-mm isotropic resolution. Preprocessing included gradient distortion correction, field-of-view reduction using the Brain Extraction Tool, and FLIRT, as well as nonlinear registration to MNI152 standard space at 1-mm resolution using FNIRT. To avoid unnecessary interpolation, all image transformations were estimated, combined, and applied by a single interpolation step. Tissue-type segmentation into cerebrospinal fluid, gray matter, and white matter was applied using FAST (Functional MRI of the Brain’s Automated Segmentation Tool) to generate full bias field–corrected images. Analyses in the present study capitalized on the ensuing gray matter maps. SIENAX, in turn, was used to derive volumetric measures normalized for head sizes. The ensuing adjusted volume measurements represented the amount of gray matter corrected for individual brain sizes.
Social brain atlas definition
Our study built on a current best estimate of the social brain localization in humans, which recently became available (19). This topographical atlas was derived by a quantitative large-scale synthesis of functional MRI findings from 3972 experiments involving thousands of individuals. Thirty-six volumes of interest were thus identified that are known to show consistent neural activity changes induced by a diversity of social and affective task experiments. The 36 data-derived target locations were also shown to be connectionally and functionally segregated [(19), Fig. 3]: (i) a visual sensory network (fusiform gyrus, posterior superior temporal sulcus, and MT/V5), (ii) a limbic network (AM, vmPFC, rostral anterior cingulate cortex, hippocampus, and NAC), (iii) an intermediate network (inferior frontal gyrus, anterior insula, anterior midcingulate cortex, cerebellum, supplementary motor area, and supramarginal gyrus), and (iv) a highly associative network (dorsomedial prefrontal cortex, frontal pole, posterior midcingulate cortex, posterior cingulate cortex, precuneus, temporoparietal junction, middle temporal gyrus, and temporal pole). Our modeling approach incorporated this existing knowledge of how the social brain regions relate to major networks at different biological levels of neural processing (cf. below).
Our targeted analyses were, thus, enhanced by anatomical guidance of brain volume extraction for the 36 regions of interest, each associated with one of four different social brain networks. In this way, neurobiologically interpretable measures of gray matter volume were obtained from the ~10,000 participants (38, 39). This was achieved by summarizing whole-brain anatomical maps centered on the topographical compartments of the social brain. We applied a smoothing filter of 5-mm full width at half maximum to the participants’ structural brain maps to homogenize local neuroanatomical features. Gray matter measures were averaged in spheres of 5-mm diameter around the consensus location from the social brain atlas, averaging the preprocessed, tissue-segmented, and brain size–adjusted MRI signals (cf. above) across the voxels belonging to a given target region. That is, the gray matter information from all voxels that belonged to a particular atlas region was added up and divided by the total number of region voxels. This procedure yielded a single representative measure for the mean gray matter volume in the particular brain region. Note that using spheres of 2.5- or 7.5-mm diameter yielded virtually identical results and led to the same conclusions. This way of engineering morphological region summaries yielded 36 corresponding brain volume measures per UK Biobank participant, which we subsequently z scored by centering to zero mean and unit variance scaling to one. These commonly used aggregate measures of regional brain volume (38, 39) in social brain networks served as the basis for all subsequent analysis steps.
All regions of interest used in this study are available online for transparency and reuse at the data-sharing platform NeuroVault (http://neurovault.org/collections/2462/).
Probabilistic generative modeling of volume variation in the social brain
To jointly model the normative anatomical population distribution of social brain regions underlying participant sex and social contexts, Bayesian hierarchical regression was a natural choice of method (40). In contrast, classical hypothesis testing methods simply provide P values against the null hypothesis of no effect in the data. Our goal was to equally consider the outcomes presence versus absence of sex distinctions in human social brain regions in all parts of our modeling approach. We aimed to directly quantify divergence between males and females in brain region volumes—as it relates to social-affective traits—to the extent supported by the observed data while providing coherent estimates of associated uncertainty.
To this end, our analyses answered the question: “How certain are we that a region volume is different between men and women in a particular social context?” Our study did not ask “Is there a strict categorical difference in region volume between men and women in a particular social context?” We, thus, aimed to directly quantify the population uncertainty intervals of volume effects in their relation to social-affective traits, rather than restricting attention to differences in simple mean volumes alone. A fully specified generative model of the social brain gray matter opens the possibility to find degrees of overlap between sex-related traits dispersed in the general population (14), which relaxes the view of strict sex dichotomy in the human brain.
Each participant belonged to one of four groups g that stratified our population cohort into males and females with or without the presence of a certain social trait: for instance, men versus women with high versus low friendship satisfaction (table S1). The probability model with parameters that vary by network followed the following form
where xi denotes the (z scored) brain volumes for all 36 regions of the social brain atlas, y denotes the (z scored) age of the participants, and the hyperparameters capture volume variation at the network level that jointly informs parameters at the region level, while g denotes the participant group. Potential confounding influences were addressed by the nuisance variables ci, controlling for variance explained by body mass and head size (38, 39). Additionally incorporating height and weight as covariates of no interest in the analyses of each social trait did not change the results and led us to the same conclusions. The multilevel regression approach also capitalized on the fact that sex and age differences are among the most salient sources of variability in MRI data in general (14). In this way, we could get the most out of our rich sample by borrowing statistical strength between networks and their constituent brain regions through interlocking of their corresponding model coefficients. Parameters of the region regressions were placed at the lower level of the model. These parameters were modeled themselves by the hyperparameters of the regression at the higher level of the model. We could thus provide fully probabilistic answers to questions about morphological dissimilarity of the social brain regions and networks by a joint model estimation profiting from several sources of population variation.
Joint posterior parameter distributions were approximated using the NUTS (No U-Turn Sampler), a type of Markov chain Monte Carlo using the PyMC3 software. After 4000 tuning steps, the sampler had converged to the stationary distribution (tables S2 and S3 and fig. S4). Subsequently, we drew 1000 unbiased samples from the joint posterior distribution over all parameters in the model (40). A range of explanations for the brain relation between groups and social traits was browsed through by obtaining multiple plausible sets of model parameters, including their similarities and divergences, that could have generated the observed data.
We deploy a probabilistic modeling strategy to zoom-in on sex differentiation in a population cohort, which has at least four advantages (40). First, we could directly quantify how the tail area of the region volume distributions varied as a function of sex and social traits. This allowed for full comparison of the degree of overlap in population volume distribution, rather than discerning whether the average volumes are different at some conventional threshold, as assessed by most previous sex research. Second, the problem of multiple comparisons (e.g., testing separate regions or social groups) was accommodated by the hierarchical modeling setup. This strength arises from estimating the joint probability distribution over all quantities in the model, which finds differences by searching through many plausible parameter constellations and assigning uncertainty at every level appropriately. Third, our probabilistic hierarchical regression takes into account meaningful previous knowledge about the social brain to simultaneously estimate within-network variation and between-network variation in conjunction with sex and social traits. Fourth, incorporating the hierarchical structure inherent in the social brain into our statistical model increases robustness and fidelity as network-level distributions help constrain model estimation while also themselves being informed by individual region-level effects.
Scientific computing implementation
We used scikit-learn executed in Python because the package provides efficient, unit-tested implementations of state-of-the-art machine learning algorithms (http://scikit-learn.org). This general-purpose machine learning library was interfaced with the nilearn library for design and efficient execution of neuroimaging data analysis workflows (http://github.com/nilearn/nilearn). 3D visualization of brain maps was performed using PySurfer (https://pysurfer.github.io/), and data plots were generated by Seaborn (https://seaborn.pydata.org/). Probabilistic hierarchical modeling and Markov chain Monte Carlo sampling were implemented as symbolic computation graphs in the PyMC3 framework (https://github.com/pymc-devs/pymc3).
Supplementary Material
Acknowledgments
We thank three anonymous reviewers for valuable feedback on the paper. Funding: D.B. was funded by the Deutsche Forschungsgemeinschaft (DFG; BZ2/2-1, BZ2/3-1, and BZ2/4-1; International Research Training Group IRTG2150), Amazon AWS Research Grant (2016–2017), the German National Merit Foundation, as well as the START-Program of the Faculty of Medicine (126/16) and Exploratory Research Space (OPSF449), RWTH Aachen. D.B. was also supported by the Healthy Brains Healthy Lives initiative (Canada First Research Excellence fund), and by the CIFAR Artificial Intelligence Chairs program (Canada Institute for Advanced Research). Author contributions: H.K., R.I.M.D., T.V.W., and D.B. contributed to the conception and design of the work. All authors contributed to the analysis and interpretation of the data as well as drafting and revising the manuscript. Competing interests: The authors declare that they have no competing interests. Data and materials availability: All data needed to evaluate the conclusions in the paper are present in the paper and/or the Supplementary Materials. Additional data related to this paper may be requested from the authors. Code availability: The analysis scripts that reproduce the results of the present study are readily accessible to and open for reuse by the reader (http://github.com/banilo/socialbrain_sexdiff).
SUPPLEMENTARY MATERIALS
Supplementary material for this article is available at http://advances.sciencemag.org/cgi/content/full/6/12/eaaz1170/DC1
Fig. S1. Correlation of social markers from the UK Biobank across 10,129 participants.
Fig. S2. Correlation of social markers from the UK Biobank across female participants.
Fig. S3. Correlation of social markers from the UK Biobank across male participants.
Fig. S4. Gross sex effects in social brain volume across examined social traits.
Table S1. Excel sheet with all posterior parameter distributions of examined social traits.
Table S2. Links to boxplots of posterior parameter distributions of examined social traits.
Table S3. Explained variance for total, age, and sex effects for each examined social trait.
REFERENCES AND NOTES
- 1.Dunbar R. I. M., Shultz S., Evolution in the social brain. Science 317, 1344–1347 (2007). [DOI] [PubMed] [Google Scholar]
- 2.Bickart K. C., Wright C. I., Dautoff R. J., Dickerson B. C., Barrett L. F., Amygdala volume and social network size in humans. Nat. Neurosci. 14, 163–164 (2010). [DOI] [PMC free article] [PubMed] [Google Scholar]
- 3.Lewis P. A., Rezaie R., Brown R., Roberts N., Dunbar R. I. M., Ventromedial prefrontal volume predicts understanding of others and social network size. Neuroimage 57, 1624–1629 (2011). [DOI] [PMC free article] [PubMed] [Google Scholar]
- 4.Silk J. B., Alberts S. C., Altmann J., Social bonds of female baboons enhance infant survival. Science 302, 1231–1234 (2003). [DOI] [PubMed] [Google Scholar]
- 5.Key C., Ross C., Sex differences in energy expenditure in non–human primates. Proc. Biol. Sci. 266, 2479–2485 (1999). [DOI] [PMC free article] [PubMed] [Google Scholar]
- 6.Lindenfors P., Neocortex evolution in primates: the ‘social brain’ is for females. Biol. Lett. 1, 407–410 (2005). [DOI] [PMC free article] [PubMed] [Google Scholar]
- 7.Lindenfors P., Fröberg L., Nunn C. L., Females drive primate social evolution. Proc. Biol. Sci. 271, (Supp 3) S101–S103 (2004). [DOI] [PMC free article] [PubMed] [Google Scholar]
- 8.Connellan J., Baron-Cohen S., Wheelwright S., Batki A., Ahluwalia J., Sex differences in human neonatal social perception. Infant Behav. Dev. 23, 113–118 (2000). [Google Scholar]
- 9.Hittelman J. H., Dickes R., Sex differences in neonatal eye contact time. Merrill Palmer Q. Behav. Dev. 25, 171–184 (1979). [Google Scholar]
- 10.Baron-Cohen S., O’Riordan M., Plaisted K., Recognition of faux pas by normally developing children and children with Asperger syndrome or high-functioning autism. J. Autism Dev. Disord. 29, 407–418 (1999). [DOI] [PubMed] [Google Scholar]
- 11.Bhattacharya K., Ghosh A., Monsivais D., Dunbar R. I., Kaski K., Sex differences in social focus across the life cycle in humans. R. Soc. Open Sci. 3, 160097 (2016). [DOI] [PMC free article] [PubMed] [Google Scholar]
- 12.Singer T., Seymour B., O'Doherty J. P., Stephan K. E., Dolan R. J., Frith C. D., Empathic neural responses are modulated by the perceived fairness of others. Nature 439, 466–469 (2006). [DOI] [PMC free article] [PubMed] [Google Scholar]
- 13.Lenroot R. K., Giedd J. N., Sex differences in the adolescent brain. Brain Cogn. 72, 46–55 (2010). [DOI] [PMC free article] [PubMed] [Google Scholar]
- 14.Ritchie S. J., Cox S. R., Shen X., Lombardo M. V., Reus L. M., Alloza C., Harris M. A., Alderson H. L., Hunter S., Neilson E., Liewald D. C. M., Auyeung B., Whalley H. C., Lawrie S. M., Gale C. R., Bastin M. E., McIntosh A. M., Deary I. J., Sex differences in the adult human brain: evidence from 5216 UK Biobank participants. Cereb. Cortex 28, 2959–2975 (2018). [DOI] [PMC free article] [PubMed] [Google Scholar]
- 15.Semendeferi K., Armstrong E., Schleicher A., Zilles K., Van Hoesen G. W., Prefrontal cortex in humans and apes: A comparative study of area 10. Am. J. Phys. Anthropol. 114, 224–241 (2001). [DOI] [PubMed] [Google Scholar]
- 16.Ingalhalikar M., Smith A., Parker D., Satterthwaite T. D., Elliott M. A., Ruparel K., Hakonarson H., Gur R. E., Gur R. C., Verma R., Sex differences in the structural connectome of the human brain. Proc. Natl. Acad. Sci.U.S.A. 111, 823–828 (2014). [DOI] [PMC free article] [PubMed] [Google Scholar]
- 17.David S. P., Naudet F., Laude J., Radua J., Fusar-Poli P., Chu I., Stefanick M. L., Ioannidis J. P. A., Potential reporting bias in neuroimaging studies of sex differences. Sci. Rep. 8, 6082 (2018). [DOI] [PMC free article] [PubMed] [Google Scholar]
- 18.Fine C., Is there neurosexism in functional neuroimaging investigations of sex differences? Neuroethics 6, 369–409 (2013). [Google Scholar]
- 19.Alcalá-López D., Smallwood J., Jefferies E., Van Overwalle F., Vogeley K., Mars R. B., Turetsky B. I., Laird A. R., Fox P. T., Eickhoff S. B., Bzdok D., Computing the social brain connectome across systems and states. Cereb. Cortex 28, 2207–2232 (2018). [DOI] [PubMed] [Google Scholar]
- 20.Sallet J., Mars R. B., Noonan M. P., Andersson J. L., O'Reilly J. X., Jbabdi S., Croxson P. L., Jenkinson M., Miller K. L., Rushworth M. F. S., Social network size affects neural circuits in macaques. Science 334, 697–700 (2011). [DOI] [PubMed] [Google Scholar]
- 21.Dunbar R. I. M., The anatomy of friendship. Trends Cogn. Sci. 22, 32–51 (2018). [DOI] [PubMed] [Google Scholar]
- 22.Aggleton J. P., Wright N. F., Rosene D. L., Saunders R. C., Complementary patterns of direct amygdala and hippocampal projections to the macaque prefrontal cortex. Cereb. Cortex 25, 4351–4373 (2015). [DOI] [PMC free article] [PubMed] [Google Scholar]
- 23.Lebreton M., Barnes A., Miettunen J., Peltonen L., Ridler K., Veijola J., Tanskanen P., Suckling J., Jarvelin M.-R., Jones P. B., Isohanni M., Bullmore E. T., Murray G. K., The brain structural disposition to social interaction. Eur. J. Neurosci. 29, 2247–2252 (2009). [DOI] [PubMed] [Google Scholar]
- 24.Harbaugh W. T., Mayr U., Burghart D. R., Neural responses to taxation and voluntary giving reveal motives for charitable donations. Science 316, 1622–1625 (2007). [DOI] [PubMed] [Google Scholar]
- 25.Izuma K., Saito D. N., Sadato N., Processing of social and monetary rewards in the human striatum. Neuron 58, 284–294 (2008). [DOI] [PubMed] [Google Scholar]
- 26.Báez-Mendoza R., Schultz W., The role of the striatum in social behavior. Front. Neurosci. 7, 233 (2013). [DOI] [PMC free article] [PubMed] [Google Scholar]
- 27.Powell L. J., Kosakowski H. L., Saxe R., Social origins of cortical face areas. Trends Cogn. Sci. 22, 752–763 (2018). [DOI] [PMC free article] [PubMed] [Google Scholar]
- 28.Rademacher L., Salama A., Gründer G., Spreckelmeyer K. N., Differential patterns of nucleus accumbens activation during anticipation of monetary and social reward in young and older adults. Soc. Cogn. Affect. Neurosci. 9, 825–831 (2013). [DOI] [PMC free article] [PubMed] [Google Scholar]
- 29.Deaner R. O., Khera A. V., Platt M. L., Monkeys pay per view: Adaptive valuation of social images by rhesus macaques. Curr. Biol. 15, 543–548 (2005). [DOI] [PubMed] [Google Scholar]
- 30.Soutschek A., Burke C. J., Raja Beharelle A., Schreiber R., Weber S. C., Karipidis I. I., ten Velden J., Weber B., Haker H., Kalenscher T., Tobler P. N., The dopaminergic reward system underpins gender differences in social preferences. Nat. Hum. Behav. 1, 819–827 (2017). [DOI] [PubMed] [Google Scholar]
- 31.Spreckelmeyer K. N., Krach S., Kohls G., Rademacher L., Irmak A., Konrad K., Kircher T., Gründer G., Anticipation of monetary and social reward differently activates mesolimbic brain structures in men and women. Soc. Cogn. Affect. Neurosci. 4, 158–165 (2009). [DOI] [PMC free article] [PubMed] [Google Scholar]
- 32.Haxby J. V., Hoffman E. A., Gobbini M. I., The distributed human neural system for face perception. Trends Cogn. Sci. 4, 223–233 (2000). [DOI] [PubMed] [Google Scholar]
- 33.Iaria G., Fox C. J., Waite C. T., Aharon I., Barton J. J., The contribution of the fusiform gyrus and superior temporal sulcus in processing facial attractiveness: Neuropsychological and neuroimaging evidence. Neuroscience 155, 409–422 (2008). [DOI] [PMC free article] [PubMed] [Google Scholar]
- 34.Eisenberger N. I., Lieberman M. D., Williams K. D., Does rejection hurt? An FMRI study of social exclusion. Science 302, 290–292 (2003). [DOI] [PubMed] [Google Scholar]
- 35.Valk S. L., Bernhardt B. C., Trautwein F.-M., Böckler A., Kanske P., Guizard N., Collins D. L., Singer T., Structural plasticity of the social brain: Differential change after socio-affective and cognitive mental training. Sci. Adv. 3, e1700489 (2017). [DOI] [PMC free article] [PubMed] [Google Scholar]
- 36.Kanai R., Rees G., The structural basis of inter-individual differences in human behaviour and cognition. Nat. Rev. Neurosci. 12, 231–242 (2011). [DOI] [PubMed] [Google Scholar]
- 37.Mars R. B., Neubert F.-X., Noonan M. A. P., Sallet J., Toni I., Rushworth M. F. S., On the relationship between the “default mode network” and the “social brain”. Front. Hum. Neurosci. 6, 189 (2012). [DOI] [PMC free article] [PubMed] [Google Scholar]
- 38.Kernbach J. M., Yeo B. T. T., Smallwood J., Margulies D. S., Thiebaut de Schotten M., Walter H., Sabuncu M. R., Holmes A. J., Gramfort A., Varoquaux G., Thirion B., Bzdok D., Subspecialization within default mode nodes characterized in 10,000 UK Biobank participants. Proc. Natl. Acad. Sci. U.S.A. 115, 12295–12300 (2018). [DOI] [PMC free article] [PubMed] [Google Scholar]
- 39.Miller K. L., Alfaro-Almagro F., Bangerter N. K., Thomas D. L., Yacoub E., Xu J., Bartsch A. J., Jbabdi S., Sotiropoulos S. N., Andersson J. L. R., Griffanti L., Douaud G., Okell T. W., Weale P., Dragonu I., Garratt S., Hudson S., Collins R., Jenkinson M., Matthews P. M., Smith S. M., Multimodal population brain imaging in the UK Biobank prospective epidemiological study. Nat. Neurosci. 19, 1523–1536 (2016). [DOI] [PMC free article] [PubMed] [Google Scholar]
- 40.A. Gelman, J. B. Carlin, H. S. Stern, D. B. Rubin, Bayesian data analysis (Chapman & Hall/CRC Boca Raton, FL, USA, 2014), vol. 2. [Google Scholar]
Associated Data
This section collects any data citations, data availability statements, or supplementary materials included in this article.
Supplementary Materials
Supplementary material for this article is available at http://advances.sciencemag.org/cgi/content/full/6/12/eaaz1170/DC1
Fig. S1. Correlation of social markers from the UK Biobank across 10,129 participants.
Fig. S2. Correlation of social markers from the UK Biobank across female participants.
Fig. S3. Correlation of social markers from the UK Biobank across male participants.
Fig. S4. Gross sex effects in social brain volume across examined social traits.
Table S1. Excel sheet with all posterior parameter distributions of examined social traits.
Table S2. Links to boxplots of posterior parameter distributions of examined social traits.
Table S3. Explained variance for total, age, and sex effects for each examined social trait.