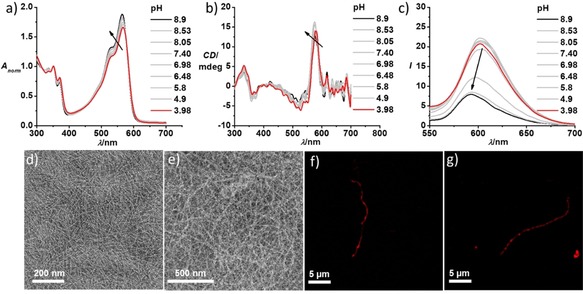
Figure 3.

pH‐dependent a) normalized absorption spectra and b) CD spectra of NDI‐OEtiPA‐cat, showing a reversed ratio between π‐π* vibronic bands and the presence of an induced CD signal at both high and low pH values. This is indicative of a pH‐insensitive self‐assembly of NDI‐OEtiPA‐cat. c) Corresponding emission spectra (λex=530 nm) shows a red shift and increased emission upon decreasing the pH. TEM images of NDI‐OEtiPA‐cat show the presence of supramolecular polymers at both d) pH 8 (10 mM tris HCl buffer) and at e) pH 3 (0.15 M citric acid buffer, 9 : 1 Ca/Na3C). TEM samples were prepared by placing a drop of the solution on carbon coated copper grids followed by drying at room temperature in a desiccator; samples were stained with uranyl acetate. SIM microscopy images (λex=561 nm) also show fibre‐like red fluorescent supramolecular polymers at both f) pH 8 and at g) pH 3 ([NDI‐OEtiPA‐cat]=2.5×10⁻⁵ M, 0.15 M citric acid buffer, 9 : 1 Ca/Na3C for pH=3, 10 mM Tris‐HCl buffer for pH 9, l=10 mm).
