Abstract
To overcome the rising burdens of nonalcoholic fatty liver disease, mechanistic linkages in mitochondrial dysfunction, inflammation and hepatic injury are critical. As ataxia telangiectasia mutated (ATM) gene oversees DNA integrity and mitochondrial homeostasis, we analyzed mRNAs and total proteins or phosphoproteins by arrays in subjects with healthy liver, fatty liver or nonalcoholic steatohepatitis. Functional genomics approaches were used for DNA damage or cell growth events. The effects of fatty acid-induced toxicity in mitochondrial health, DNA integrity and cell proliferation were validated in HuH-7 cells, including ATM kinase inhibition or mRNA downregulation. In fatty liver, DNA damage and ATM pathway activation was observed. During steatosis in cells, less ATM activity produced mitochondrial dysregulation, DNA damage and cell growth inhibition. In steatohepatitis, ATM was depleted with increased hepatic DNA damage and growth-arrest due to cell cycle checkpoint activations. Moreover, molecular signatures of oncogenesis were associated with upstream mechanistic networks directing cell metabolism, inflammation or growth that were either activated (in fatty liver) or inactivated (in steatohepatitis). To compensate for hepatic growth arrest, preoncogenic oval cell populations expressing connexin-43 and/or albumin emerged. These oval cells avoided DNA damage and proliferated actively. We concluded that ATM is a major contributor to the onset and progression of nonalcoholic fatty liver disease. Therefore, specific markers for ATM pathway dysregulation will allow prospective segregation of cohorts for disease susceptibility and progression. This will offer superior design and evaluation parameters for clinical trials. Restoration of ATM activity with targeted therapies should be appropriate for nonalcoholic fatty liver disease.
Keywords: DNA damage response, gene expression, inflammation, liver regeneration, steatohepatitis
1. INTRODUCTION
Due to the world-wide epidemics of obesity, metabolic syndrome and diabetes mellitus, prevalence has been rapidly rising of nonalcoholic fatty liver disease (NAFLD) [1]. In this condition, onset of serious complications (cirrhosis, liver failure or hepatocellular carcinoma - HCC) greatly increases after fatty liver (FL) progresses to nonalcoholic steatohepatitis (NASH) [2, 3]. The central aspects of pathology in NASH concern steatosis, hepatic degeneration with intermediate filament damage and liver inflammation [4]. These events are associated with oxidative stress (mitochondrial damage and substrate dysutilization), inflammatory cytokine release (from activated Kupffer cells, liver sinusoidal endothelial cells, immunocytes) and fibrogenesis (involving hepatic stellate cells, fibrocytes) [2, 5]. Liver regeneration (LR) is also impaired and hepatic polyploidy is observed due to cell growth arrest by p53 and p21 activations [6, 7]. Eventually, hepatic injury leads to appearance of transformed cell clones that contribute in HCC. Therefore, insights into molecular pathway-specific processes will be highly significant for arresting disease progression and managing NASH.
The DNA damage response (DDR) has extensive importance for tissue injury and repair [8]. For instance, hepatic regeneration fails in settings of inadequate DDR [9]. The troika of ataxia telangiectasia mutated (ATM), ATM-and-Rad3-related and DNA-protein kinase genes oversee integrity of mitochondrial as well as genomic DNA; and among these ATM is most significant [9-11]. Moreover, ATM is necessary for mitochondrial homeostasis [12]. Under purview of ATM are included sensing of DNA damage and repair of damaged nucleotides or strand-breaks. When DDR goes awry, cell death or cell cycle checkpoints and cell growth-arrest are initiated by downstream ATM pathway members [8]. This oversight of DDR by ATM is interlinked with inflammatory cytokines (TNF-α; NF-kB) [13]. Additionally, ATM is involved in intermediary metabolism, e.g., through insulin, IGF1 or AMPK signaling [14, 15]. These mechanisms should be particularly relevant for NAFLD. However, the role in NAFLD for ATM is ill-defined. Although children with ataxia telangiectasia were found to exhibit greater prevalence of NAFLD [16]; and in Atm−/− knockout mice, diet-induced hepatic steatosis is less prominent [17], the ATM-related mechanisms underlying disease progression remain unclear.
Previously, mRNA expression profiling in people with NAFLD did not identify ATM pathway disruptions [18, 19]. This might have been due to divergences in mRNA and protein expression patterns, since these correlate poorly in tissues [20]. Although mRNA datasets have been used in NAFLD for predictive protein-based models [19], these too may be confounded by post-transcriptional alterations (e.g., ATM protein may be degraded by oxidization after cytotoxicity) [21]. To avoid such biases in ATM pathway analysis, we simultaneously studied expression in NAFLD of mRNA plus total proteins and phosphoproteins. Identification of differentially expressed candidates allowed construction of pathway networks for significance along with studies in cells and tissues to validate mechanisms. This revealed causal association between ATM pathway and NAFLD: ATM was activated within the setting of DDR in early disease stage (FL); whereas ATM was depleted with further pathway dysregulations over disease progression (NASH). Regulation of ATM pathways in these NAFLD states allowed probing of upstream mechanistic regulators that should be relevant for inflammation and cell growth-arrest. This will be significant for cohort segregation, trial development and therapeutic efficacy.
2. MATERIALS AND METHODS
2.1. Liver samples.
Anonymized frozen and formalin-fixed paraffin-embedded pairs of tissues from organ donors or liver resections were obtained (NIDDK Liver Tissue Procurement and Distribution Service; University of Minnesota, Minneapolis, MN). This was approved by IRB at Albert Einstein College of Medicine.
2.2. Tissues.
Specimens (n=18) were from adult males and females. Cases were classified into healthy liver (HL), FL or NASH (n=6 ea). Sections stained by hematoxylin and eosin were graded for steatosis, hepatic ballooning and inflammation by NAFLD activity score (NAS) [4].
2.3. Cell culture assays.
Authenticated HuH-7 cells were verified to be devoid of mycoplasma. Cells were maintained at 37°C in 5% CO2 in RPMI-1640 medium (GIBCO, Grand Island, NY) with 10% fetal bovine serum and antibiotics. For steatosis, 1-3x10⁴ cells per well in 48-well dishes were cultured overnight with 200 μM palmitic acid (PA) (P0500, Sigma-Aldrich, St Louis, MO), as described [22]. ATM activity was blocked by 2.5-10 μM of the specific kinase activity antagonist, KU-60019 (Cayman Chemical, Ann Arbor, MI). Alternatively, the microRNA (miRNA) approach was used with hsa-miR-26b, which directly targets ATM mRNA [23]. The miR-26b mimic (mature miRNA sequence, MIMAT0004500: CCUGUUCUCCAUUACUUGGCU) was purchased (C-300501-07-0010, Dharmacon, Lafayette, CO). This mimic is predicted to bind ATM mRNA at multiple sites commencing at nucleotide positions 127, 914 and 3061 (mirSVR score −0.42, http://microRNA.org). To test miRNA effects, HuH-7 cells were cultured with 12.5-50 nM miR-26b mimic for 4h followed by 1 mM H2O2 for 30 min to induce DNA damage response and ATM mRNA expression. The optimal ATM mRNA knockdown condition was applied to studies with PA-induced lipotoxicity. All experimental conditions were in triplicate and repeated twice. Some experiments used rat-tail collagen-coated dishes with metal-catalyzed oxidization, as previously described [24].
To stain for fat, cells fixed in 4% paraformaldehyde were rinsed with 60% isopropanol. Oil Red O (5 mg/ml isopropanol stock – 3 to 2 parts water, v/v; Sigma) was added for 10 min with toluidine blue counterstaining. To quantitate fat, cells were lysed in 100% isopropanol with absorbance at 500 nm by the Cytation5 instrument (Biotek, Winooski, VT). For mitochondrial membrane potential (MMP), cells were incubated for 1h with JC-1 dye (Cayman) [9]. For reactive oxygen species (ROS), cells were incubated for 1h with dihydrorhodamine (DHR) (Cayman) as described [9]. To count cells and for identifying necrosis/apoptosis, nuclei were stained by 10μg/ml Hoechst 33258 dye for 10-20 min. Images were obtained under200-400 x magnifications by Axiovision System (Carl Zeiss, Thornwood, NY). Image analysis used the Cytation5 with multiple fields of 40-100 cells each.
2.4. DNA damage.
Deparaffinized formalin-fixed sections or cryosections were subjected to antigen retrieval and then acetone post-fixing. Cells were fixed in cold ethanol. Permeabilization used 0.1% triton-X (Sigma-Aldrich) for 5 min and blocking 5% goat serum for 1h at room temperature. Primary antibodies in phosphate buffered saline, pH 7.4 (PBS) were used overnight at 4°C: pATM (S1981, 1:100, 560007 BD Pharmingen, Franklin Lakes, NJ); γH2AX (1:100, 2595; Cell Signaling Technologies, Danvers, MA); Ki-67 (1:100; 1:100, 550609, BD Biosciences, San Jose, CA); pNBS1 (1:100, ab23996; Abcam, Cambridge, UK); 8-oxo-dG (1:100, 4354-MC-050; Trevigen, Gaithersburg MD); p21 (1:100, SC-379, Santa Cruz Biotechnology, Santa Cruz, CA) or); or 2h at 37°C: albumin (1:100, sc-271605, Santa Cruz Biotechnology, Santa Cruz, CA); connexin (Cx)-43 (1:100, 71-0700 Zymed, Invitrogen Corp,, Waltham, MA). Detection used Alexa Flour-647- or −488 conjugated anti-mouse or anti-rabbit IgG (1:500, 4410, 4412 and 4414, respectively, Cell Signaling) for 1h at room temperature. Nuclei counterstaining used DAPI. Events were quantitated under 25-50 high power fields (hpf; x400) or entire cell culture wells.
2.5. Cell subpopulations and ploidy analysis.
Nuclei were stained with 10 μg/ml Hoechst 33258 dye for 10-30 min at room temperature. Multiple images per sample were used for DNA content analysis by Cytation5. Cell populations were localized by characteristic nuclear morphology in periportal areas of liver sections. DNA fluorescence per nucleus was measured. Data were binned by Excel software (Microsoft Corp., Seattle, CA) as described [9]. Diploid DNA content (2N) was used to identify 2N, 4N, 8N+ or intervening ploidy classes. Polyploidy was absent in HuH-7 cells; therefore, baseline G0/G1, S and G2/M were verified by flow cytometry in propidium iodide-stained cells, as previously described [9]. Nonviable fractions of sub-diploid cells were quantitated.
2.6. Quantitative RT-PCR.
Total RNAs were isolated from 50 mg tissues including DNase treatment by RNEasy (ThermoFisher Scientific, Waltham, MA) or from cultured HuH-7 cells by Quick-RNA MicroPrep Kit (Zymo Research, Irvine, CA). Complementary DNAs were generated from 1 μg RNAs for tissues (RT2 First Strand Kit, SA Biosciences, Gaithersburg, MD) and for HuH-7 cells (Superscript IV VILO master mix, Invitrogen, Carlsbad, CA). The ATM primer design used NCBI Pick Primers with oligonucleotide synthesis by Integrated DNA Technologies (Coralville, IA): Forward, AGGAAGAAAATAGAACTAGGCTGGG; reverse, TTGCAATCTGTAGCCAAGGCA (94 bp product). The RPS13 gene was used as control with following primers: Forward, CAGTCGGCTTTACCCTATCG, reverse, ATCTGCTCCTTCACGTCGTC (74 bp product). The qRT-PCR was duplicated per sample in 10 μl with 5μl 2x PowerUp SYBR Green master mix (Applied Biosystems, Foster City, CA), 200 nM or 100 nM of ATM and RPS13 primers, respectively, and 20 ng cDNAs by QuantStudio6 Flex instrument (Applied Biosystems): 95°C x 20s, and 40 cycles at 95°C x 1s, 60°C x 20s, melting curve stage at 95°C x 15s, 60°C x 1 min, and 95°C x 15s. The linear range, amplification efficiency and expected single melting curve peaks were verified.
For tissues, pools were prepared for experimental conditions to avoid confounding by sampling errors. These were amplified in RT2 SYBR® Green qPCR Mastermix (Cat. no. 330529) with prespotted arrays containing 84 probes and 12 controls each (Human DNA Damage Signaling Pathway Array, PAHS 029Z; Qiagen, Fredericks, MD). Gene expression was normalized by invariantly expressed genes across samples by 2−ΔΔCt method. Differences in gene expression of ≥2-fold up or down were considered significant. This gene expression difference was used for following categorizations: upregulated - expression level greater by 2-fold or more than in controls; downregulated – expression level below 2-fold or less than in controls; unchanged – expression level within 1.9-fold higher or lower than in controls.
2.7. Protein assays.
Tissue aliquots used for mRNAs were lysed in buffer with protease and phosphatase inhibitors (Roche Diagnostics, Basel, Switzerland). Proteins were quantitated by Bradford method (Biorad Protein Assay Dye Reagent, LifeSciences, Carlsbad, CA).Arrays contained probes for total proteins (TP) and phosphoproteins (PP) (PEX100, Fullmoon Biosystems, Sunnyvale, CA). Each probe was in four to six spots. Duplicate arrays per sample from tissue pools were incubated with 80 μg proteins after biotinylation, according to the manufacturer. Detection used Cy3-conjugated streptavidin followed by spot analysis with GenePix software (Molecular Devices LLC, Sunnyvale, CA). Mean probe signals were corrected against blanks. Signals were normalized by global medians per array. Expression of PP was normalized by corresponding TP. Residues from multiple isoforms were selected for greatest relevance (apoptosis, cell cycle, cell growth, proliferation, or differentiation), according to PhosphoSitePlus - https://www.phosphosite.org/homeAction (Cell Signaling Technologies). Differences in protein expression of ≥1.5-fold up or down were considered significant. These differences were applied to assign following categories: upregulated - expression level greater by 1.5-fold or more than in controls; downregulated – expression level below 1.5-fold or less than in controls; unchanged – expression level within 1.4-fold higher or lower than in controls.
2.8. Bioinformatics.
Annotated lists of mRNAs or proteins were examined by Ingenuity Pathway Analysis (IPA) (Redwood City, CA). Ontological groups and biological functions were categorized by Fisher’s exact test. Pathway regulators were prioritized by p for non-overlap. Mechanistic networks with maximum depth of interactions were generated according to IPA.
2.9. Statistical methods.
Data are provided as means ±SEM. Comparisons used t-test, Chi-square, Mann-Whitney rank-sum test or analysis of variance (ANOVA) with post hoc Kruskal-Wallis test. Correlations used Pearson or Spearman tests. Binned ploidy classes were analyzed by Wilcoxon’s rank-sum correlations. GraphPadPrism7 was used (GraphPad Software Inc, La Jolla, CA). P <0.05 was considered significant.
3. RESULTS
The morphology of healthy liver (HL) was normal. In FL, steatosis was widespread without hepatic ballooning or inflammation. In NASH, steatosis, hepatic ballooning and inflammation were evident. The NAFLD activity scores were: HL, 0.5±0.2; FL, 3.2±0.3; NASH, 5.8±0.2, p<0.001, ANOVA. No tissue exhibited evidences for cirrhosis or tumors (Supplementary Fig. S1).
3.1. ATM pathways were activated in NAFLD
Numerous differences were noted in expression of total proteins (TP) and phosphoproteins (PP) in FL vs HL and NASH vs FL (Supplementary Table S1). Evidences for DDR were also identified in mRNAs (n=82) compared with HL for FL (69 up; 3 down) or NASH (62 up; 3 down). The markers of DDR in TP and PP arrays (n=38 each) also showed differences in HL vs FL for TP (31 up; 6 down) or PP (30 up; 3 down) (Supplementary Table S2). For markers shared in arrays (n=15), the directionality of expression change varied (e.g., FL vs HL): mRNA and TP, r=0.5; TP and PP, r=0.2; p>0.05). Remarkably, in previous studies, correlation of mRNA and protein expression in multiple tissues yielded similar results (r=0.4), likely due to post-transcriptional or other mechanisms [20].
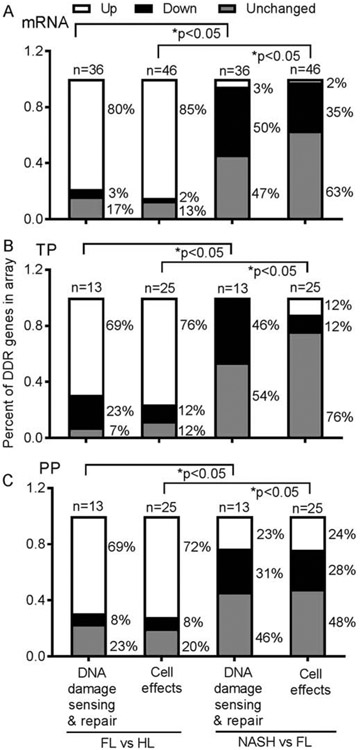
Multiple ATM pathway members were expressed differently in FL vs HL (Fig. 1 A-C). These included the following (mRNA, TP and PP): ATM (+2.5- and +2.2-fold); BRCA1 (+4-, +4.3- and +3.6-fold), sensors of DNA double-strand breaks (DSBs) (NBS1, +4.5-, −1.5 and −1.3-fold; H2AX, +5.9-, −3.0 and −3.0-fold), downstream signal transduction (Chek-2, +4.9-, +4.3 and +3.9-fold); and DNA repair (Rad51, +2.5-, +2.0 and +2.0-fold). Cell growth controls were altered, i.e., apoptosis activator, BAX – TP, was expressed more (3.7-fold); phosphorylated p53, the cell cycle suppressor, was expressed less (−5.6-fold); and phosphorylated S phase cyclins (CCND1 and CCND3) were expressed more (3.3- and 5.1-fold, respectively). This suggested active hepatic DNA damage and repair, along with cell turnover. Due to disease progression (NASH vs FL), the nature of DDR shifted: ATM and BRCA1 mRNA or proteins decreased by up to −4.0-fold and −7.7-fold, respectively; pNBS1 or γH2AX increased, 3.0- and 6.5-fold, respectively; Chek-2 protein decreased 3.0-fold, DNA repair protein, Rad51, decreased 4.0-fold; and BAX was expressed similar to FH; but phosphorylated p53 increased 2.5-fold; and phosphorylated CCND1 and CCND3 decreased, 1.6- or 2-fold, respectively. This suggested greater DNA damage, along with cell growth-arrest in NASH.
Fig.1. DDR in NAFLD.
Expression of multiple genes in FL vs HL or NASH vs FL with mRNAs (chart at top), TP (middle) or PP (bottom) (n=6 tissue samples per condition). The proportions varied in categories of DNA damage-sensing and repair or cell effects (survival, proliferation, growth-arrest). Overall, members transducing these processes were upregulated in FL; and downregulated in NASH. Statistical comparisons used ANOVA. Also, see Supplementary Table S2.
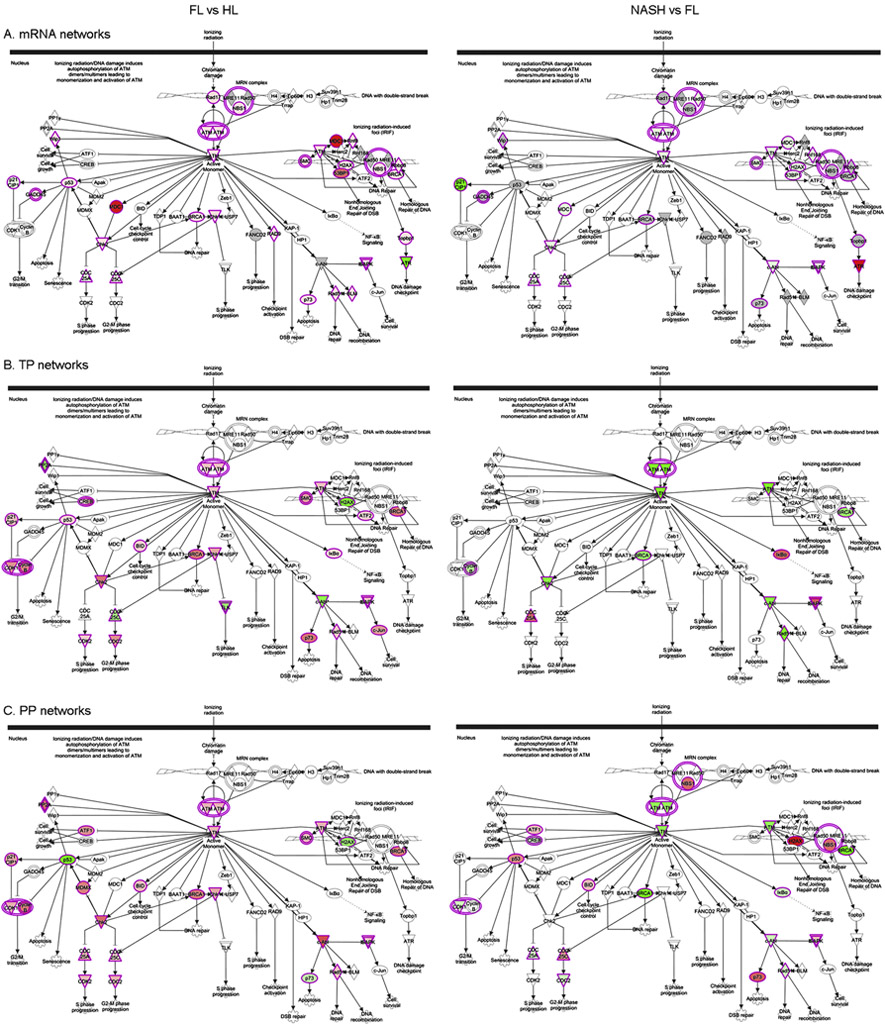
Mapping of ATM pathways in FL and NASH allowed visualization of the roles for differently expressed mRNA, TP and PP in DNA damage and repair, p53-mediated cell growth, apoptosis and other processes (Fig. 2).
Fig. 2. Mapping of ATM networks.
Indicated is distribution of differentially expressed mRNAs (A), TP (B) or PP (C). Comparisons are for FL vs HL or NASH vs FL. Genes or proteins in red are expressed more and in green are expressed less. In FL, ATM pathways were geared toward DNA damage repair and cell cycling; additional consequences related to impaired DNA damage repair and cell growth-arrest resulted in NASH.
3.2. ATM served roles in multiple cellular and molecular functions
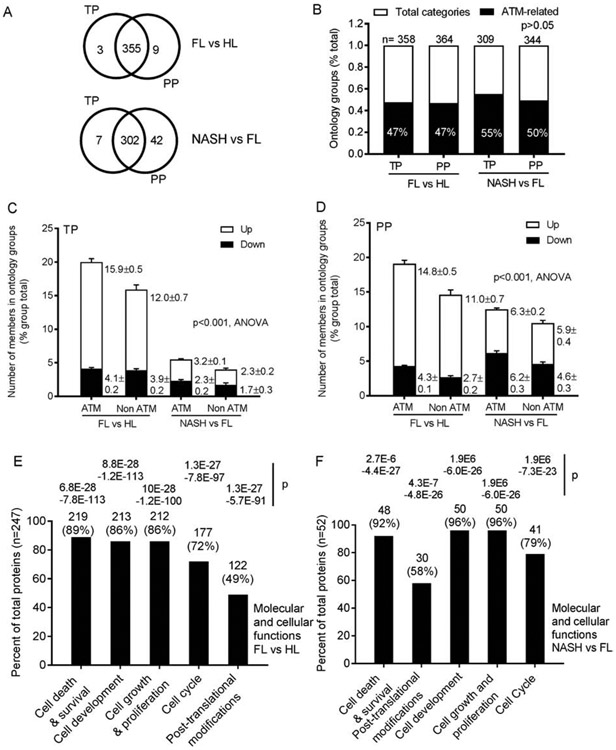
To elucidate in what ways ATM may have contributed, we examined by IPA ontology groups for TP and PP in FL and NASH. Group members in ontologies either including or excluding ATM were then co-segregated (Supplementary Table S3). The ontology groups identified by TP and PP were similarly distributed, p=0.5, ANOVA (Fig. 3A). Therefore, we continued this analysis. Remarkably, ATM was included in nearly 50% of ontological groups (for both TP and PP) (Fig. 3B). If ATM recruited partners, the number of group members could have increased. We tested this across data matrices by the proportions of members per group. Ontology groups that included ATM and were also upregulated, contained more TP members compared with groups excluding ATM in FL (vs HL) (means of 15.9 and 12.0, respectively, p<0.001) (Fig. 3C). Similarly, more PP were in upregulated groups including ATM in FL (vs HL) (means of 14.8 vs 11.0, respectively, p<0.001) (Fig. 3D).This indicated that ATM had recruited members to the ontology groups. In NASH (vs FL), group members including or excluding ATM differed (means for TP, 3.2 and 2.3; for PP, 6.3 and 5.9, respectively, p>0.05) (Fig. 3C-D). This resulted from ATM having no longer being upregulated in NASH. Differentially-expressed TP were especially significant for cell death and survival, cell proliferation and cell cycle (Fig. 3E-F). In NASH, trends for greater significances were noted for cell development and cell growth and proliferation. Thus, ATM pathways were already active in FL; and that produced further deleterious consequences in NASH.
Fig. 3. Role of ATM in cellular and molecular functions by TP and PP (n=6 tissues per condition).
(A) Ontological groups annotated by IPA in differentially-expressed TP and PP in FL or NASH. Numbers of these groups identified by TP and PP were similar, p=0.5. (B) Proportions of ontological groups including or excluding ATM for TP and PP in FL vs HL and NASH vs FL. These were also similar, p>0.05, ANOVA. (C-D) Prevalence of members in ontology groups with or without ATM. With ATM, upregulated ontology groups contained more members in FL. This was so for both TP and PP, p<0.001, ANOVA. Number of group members was unaffected in NASH, likely because ATM itself was downregulated. (E) Top functions of TP in both FL and NASH included cell death and survival, and cell growth or proliferation. Thus, ATM exerted major effects in NAFLD.P values were determined by Fisher’s exact tests. Also, see Supplementary Table S3.
3.3. DDR-related events correlated with hepatic injury in NASH
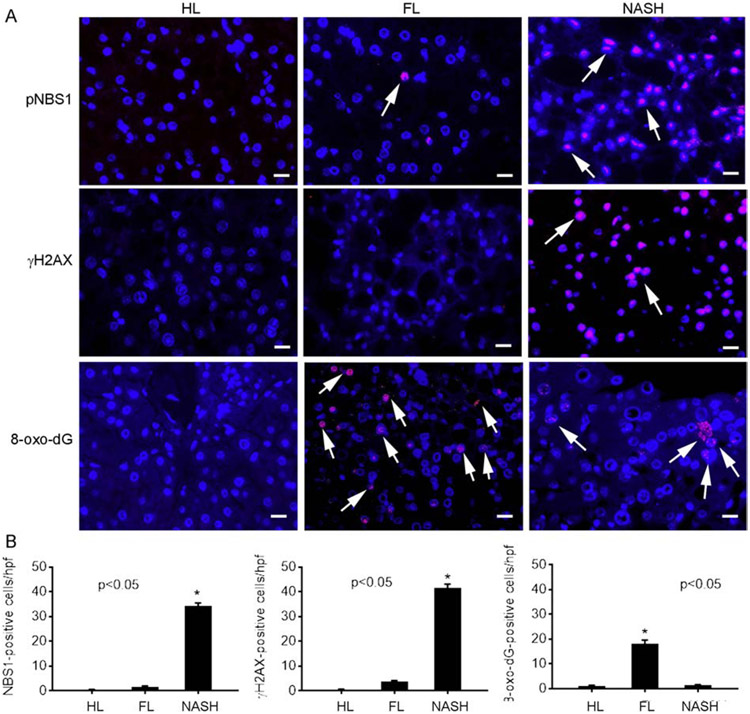
We examined PP as transducers of processes for effects of ATM pathways. Localization of pNBS1 - a major component of MRN complex that senses DSBs – and γH2AX - indicator of persistent DSBs, was informative [21, 25] (Fig. 4A-B): pNBS1 was absent in HL, infrequent in FL, but well-expressed in NASH (0.5±0.1, 1.7±0.3 and 34±1 cells/hpf, respectively, p<0.05). Expression of γH2AX differed (0.5±0.1, 3.8±0.3 and 41.3±1.7 cells/hpf, HL, FL and NASH, respectively, p<0.05). More oxidative 8-oxo-dG DNA adducts were found in NASH vs FL (7.7±0.4 and 0.5±0.1 cells/hpf, p<0.05).
Fig. 4. Hepatic staining for DNA damage markers.
(A) Illustration in HL, FL and NASH of pNBS-1, γH2AX and 8-oxo-dG adducts in hepatocytes (red color; arrows). These cells were readily identified from nonprarenchymal cells by their nuclear morphology. Original magnification x400; scale bar, 10μm. Nuclei counterstained with DAPI (blue). (B) Morphometry for various events (n=3 replicates per condition), asterisks, p<0.05 vs HL and FL.
Significance in NASH of DDR was correlated by histological markers (Supplementary Fig. S2). The extent of DSBs (pNBS1; γH2AX) correlated with ballooning or inflammation (r=0.8 to0.9) but mostly not with steatosis (r=0.04 to 0.3). The 8-oxo-dG DNA adducts correlated less (r=0.3 to 0.6). These major aspects of DDR in NAFLD were thus also ATM-related.
3.4. Direct effects of ATM in hepatic steatosis
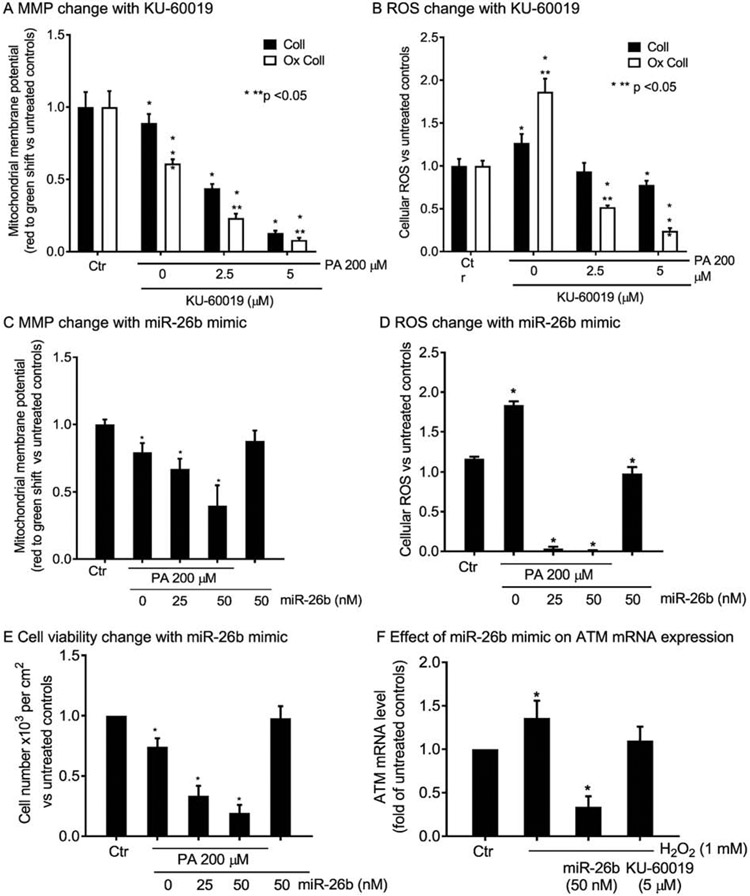
To identify the immediate consequences of ATM in cells, we recapitulated steatosis in HuH-7 cells by overnight culture with palmitic acid (PA), as previously established [22]. This included native collagen (Coll), as well as metal-catalyzed oxidization of collagen (Ox Coll) (Supplementary Fig. S3A). As matrix perturbations accompany NAFLD, these effects of Ox Coll were relevant. The onset of steatosis produced impairment in mitochondrial function, such that mitochondrial membrane potential (MMP) decreased and reactive oxygen species (ROS) increased: Ox Coll worsened and KU-60019 further amplified these injury effects (Supplementary Fig. S3B, S3C); (Fig. 5A, 5B). To verify the effects of ATM kinase antagonism, we utilized miR-26b mimic as a genetic ATM mRNA knockdown approach, in view of its established efficacy for this purpose [23]. The miR-26b mimic reproduced worsening of MMP and ROS in conjunction with PA treatment of HuH-7 cells (Fig. 5C, 5D). Moreover, the combination of PA and miR-26b mimic, as well as KU-60019 (see below), resulted in cell viability loss (Fig. 5E). The mimic by itself without PA did not alter MMP, ROS or cell viability. The effects of the miR-26b mimic on ATM mRNA were verified in HuH-7 cells treated with H2O2 to reproduce oxidative stress (Fig. 5F). This oxidative stress induced ATM mRNA expression, as expected for DNA damage response [25], whereas preconditioning of cells with miR-26b mimic knocked down ATM mRNA by >70%. Significantly, KU-60019 decreased only the H2O2-induced component of ATM mRNA, which was in agreement with its action at the kinase activity level.
Fig. 5. Role of ATM in lipotoxicity-related events in HuH-7 cells.
Overnight cell culture with PA on collagen (Coll) with or without oxidization (Ox Coll), with decreases in MMP (A), which worsened after ATM antagonism with KU-60019. (B) ROS increased in response to PA, more with Ox Coll, and KU-60019 inhibited ROS, in agreement with MMP impairments. (C-D) The miR-26b mimic affected MMP and ROS similar to KU-60019 with worsening of PA-induced toxicity. (E) The viability of HuH-7 cells declined after PA plus miR-26b mimic to emphasize the role of ATM in this process. (F) Effects of miR-26b mimic in ATM mRNA knockdown following oxidative stress with H2O2 for 30 min. This mRNA knockdown was not observed for KU-60019 since it acts downstream at kinase activity level. Intra- and inter-group significances vs controls are shown by one or two asterisks, respectively, p<0.05, ANOVA. For images, see Supplementary Fig. S3.
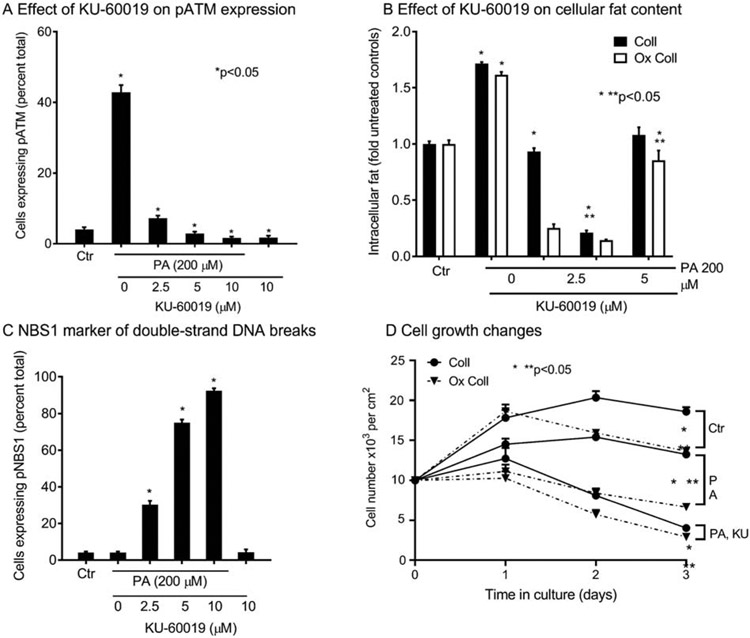
This ATM kinase inhibitory effect in HuH-7 cells of KU-60019 was verified by the abrogation of pATM expression induced by PA (Supplementary Fig. S3D), (Fig. 6A). The ATM antagonism by KU-60019 led to less steatosis due to intracellular injury effects; and this was further pronounced by Ox Coll, which contributes oxidative stress and NF-kB-related inflammatory signaling [24] (Supplementary Fig. S3A), (Fig. 6B). Simultaneous to pATM loss, and in conformity with cell viability differences after PA plus miR-26b mimic or KU-60019, DNA damage increased with more pNBS1 (Supplementary Fig. S3E), (Fig. 6C). The cell growth was inhibited by PA; and Ox Coll increased cell loss (Fig. 6D). Moreover, KU-60019 decimated cell survival in even the lowest amount (2.5 μM). All of these differences were highly significant, p<0.05, ANOVA.
Fig. 6. Role of ATM in hepatic steatosis and cell growth-regulation in HuH-7 cells.
(A) In cells cultured overnight with KU-60019, pATM activity decreased and that induced by PA was abrogated. (B) Overnight cell culture with PA on collagen (Coll) with or without oxidization (Ox Coll), induced steatosis, which decreased after ATM antagonism by KU-60019. (C) The pNBS1 expression indicating double-strand breaks increased after PA and further increased after KU-60019. (D) Cell growth curves indicated proliferation inhibition and cell losses over three days of culture with PA; even 2.5 μM of KU-60089 (smallest dose), particularly on Ox Coll, exacerbated cell loss and inhibited growth. (F) Intra- and inter-group significances vs controls are shown by one or two asterisks, respectively, p<0.05, ANOVA. For images, see Supplementary Fig. S3.
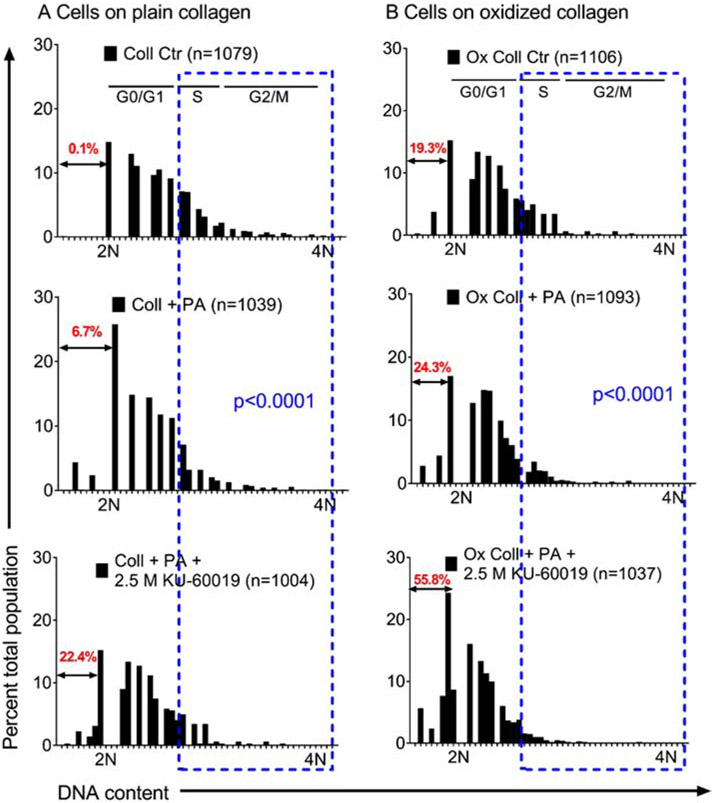
After DNA damage, ATM pathway regulates cell growth by G1/S or G2/M checkpoints [9, 10, 26]. These effects on HuH-7 cell subpopulations were characterized by cytofluorimetric DNA content analysis (Fig. 7). After overnight culture on Coll, nuclei with <2N DNA (subdiploid) were negligible (0.1%), indicating no apoptosis, necroptosis or necrosis. However, after PA or PA plus 2.5 μM KU-60019, S and G2/M decreased and nuclei with sub-diploid DNA rose to 6.7% and 22.4%, respectively, p<0.05. On Ox Coll, loss of S and G2/M cells worsened and PA plus KU-60019 produced necrotic cells with sub-diploid DNA content in 55.8%, p<0.05. These effects of ATM deficiency on DNA damage and cell growth-arrest were examined in tissues as indicated next.
Fig. 7. Consequences of ATM-related effects on HuH-7 cell subpopulations after PA-induced steatosis in overnight culture.
Separation of cells based upon nuclear DNA content after cultured on Coll (A) or Ox Coll (B). Estimated locations of G0/G1, S and G2/M are given based on DNA content distributions of 2N and 4N. Nuclei with subdiploid DNA content, representing apoptotic, necroapoptotic or necrotic fractions, are in red type. Blue boxes allow visual comparisons of S and G2/M fractions, which were depleted after PA with or without KU-60019 on either Coll or Ox Coll. Subdiploid fractions of nuclei increased markedly on Ox Coll. Subpopulation distributions differed significantly with intra- as well as intergroup comparisons, ANOVA.
3.5. Consequences of DNA damage on cell cycling in NASH
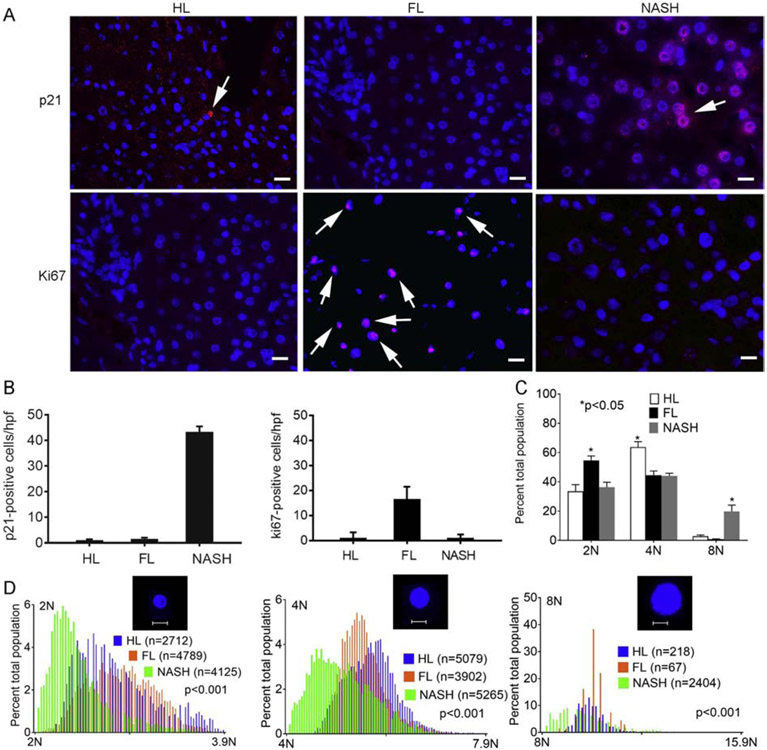
In NASH (vs FL), PP expression indicated more p53 and Rb (suggesting cell growth inhibition); and less CCND1 and CCND3 (suggesting decreased G1/S and S traverse or G2/M exit). As p53 regulates checkpoints via p21, tissues were immunostained for these markers. Whereas p21 was infrequent in HL or FL (1.1±0.6 and 1.6±0.4 cells/hpf, respectively), in NASH, it was extensive (43.3±2.1 cells/hpf), p<0.05 (Fig. 8A, top). This suggested cell growth-arrest. The cell cycling marker, Ki67, was expressed more in FL (16.6±1.3 cells/hpf) vs either HL (0.1±0.4 cells/hpf) or NASH (1.2±0.4 cells/hpf), p<0.05 (Fig. 8A, bottom). This indicated low-grade proliferation in FL. Hepatocytes in HL (n=8009) were mostly 2N (33±5%) or 4N (64±4%) with few 8N+ (3±1.0%). However, hepatocytes in FL (n=8758) were more often 2N (55±3%) and less often 4N (45±3%) or 8N+ (1±0.3%), p<0.05 vs HL, ANOVA. In NASH (n=11,794), 2N (36±4%) and 4N (44±4%) were smaller than FL, but 8N+ was >6-20-fold (20±4%) larger than HL or FL, p<0.001, ANOVA (Fig. 8B). All ploidy subclasses in NASH had less DNA – implying noncycling states. This verified some proliferation in FL; but growth-arrest in NASH, consistent with p21-induced polyploidy [6, 9, 27, 28].
Fig. 8. DDR and cell cycling in NAFLD.
(A) Immunostaining for p21 and Ki67 (red). Nuclei counterstained by DAPI (blue). In NASH, p21 was widely expressed in hepatocytes (arrows), whereas this was rare in HL or FL. Hepatocytes with Ki67 were infrequent in HL, interspersed in FL, and absent in NASH. Original magnification x400; scale bar, 10μm. (B) Morphometric quantitation for p21 and Ki67 (n=3 tissues per condition), asterisks, p<0.05, ANOVA. (C) Hepatic ploidy in HL, FL and NASH (n=3 tissues each). Cumulatively, 2N fraction increased and 4N fraction decreased in FL vs HL. In NASH, 2N and 4N fractions decreased; 8N+ increased, p<0.05, ANOVA.(D) In all subclasses in NASH hepatic ploidy was lower than HL and FL. Insets, 2N, 4N and 8N+ nuclei; scale bar, 10μm. This indicated growth-arrest across all ploidy classes in NASH, p<0.001, Wilcoxon’s correlation.
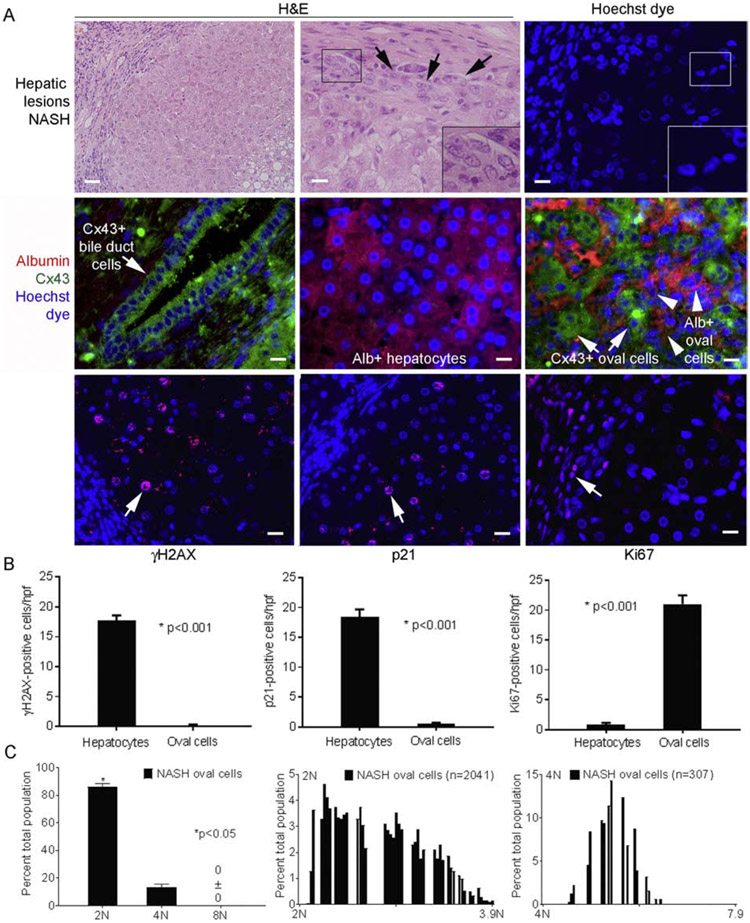
Cellular and molecular functions in PP differed for FL vs HL and NASH vs FL (Supplementary Fig. S4A). In NASH, the category of “cell movement” gained prominence, but “molecular mechanisms of cancer” assumed the topmost ontology (Supplementary Table S3; Supplementary Fig. S4B). As NASH increases susceptibility to HCC, we examined tissues further and noted emergence of epithelial cells with oval nuclei (Fig. 9). Hepatic oval cells were originally identified morphologically during chemical carcinogenesis [29]. These arise from ductal niches harboring progenitor cells and exhibit oncogenic potential, including in NASH [29-31]. In fact, oval cells were highly abundant in NASH (Fig. 9A). To characterize these cells, we immunostained Cx43 - a component of gap junctions related to cell death, differentiation and proliferation with expression in mature cholangiocytes or oval cells, but not adult hepatocytes [32, 33]. In both FL and NASH (vs HL) TP and PP arrays showed 2-3.5-fold greater Cx43 expression (Supplementary Table S1). In NASH, oval cells expressed Cx43 (with and without albumin) (Fig. 9A). Oval cells lacked DNA damage (no pNBS1, γH2AX, 8-oxodG adducts) (Fig. 9A, 9B). Moreover, oval cells were actively cycling with Ki67 in significant fractions, and no p21 expression. Ploidy classes in oval cells (n=8053) were largely 2N; fewer 4N; and none 8N+ (unlike hepatocytes), p<0.001(Fig. 9C). Moreover, oval cells distributed across 2N and 4N subclasses displayed aneuploid DNA content – this indicated S and G2/M progression. Different fates of hepatocytes (DNA damage; growth-arrest) and oval cells (no DNA damage; active proliferation) suggested gene expression regulation was important.
Fig. 9. Oval cells in NASH (n=3 tissue replicates).
(A) Steatosis with inflammatory cells and additional hepatic epithelial cells (left side, upper left panel). Oval cells were prevalent (top middle and right panels; arrows, inset of boxed areas). Middle panels show Cx43 and albumin costaining. Bile duct cells expressed Cx43 (left), hepatocytes expressed albumin (middle) and oval cells expressed Cx43 with or without albumin (right). In oval cells, γH2AX or p21 were absent but Ki67 was widely expressed (red color; arrows) (bottom panels). This contrasted with hepatocytes. Nuclei stained byHoechst or DAPI (blue); original magnification x 100-400, scale bar, 10μm. (B) Events in oval cells vs adjacent hepatocytes by morphometry showed major differences, p<0.05. (C) Ploidy in oval cells revealed 2Nor 4N and no8N+. Cells with aneuploid DNA were distributed across ploidy classes.
3.6. Cell fate determination by upstream regulators and mechanistic networks
Distribution of PP (n=321) was analyzed by IPA in FL vs HL and NASH vs FL for regulators. Tissue lysates largely represented hepatocytes due to their greater abundance, sizes and protein content. This analysis identified 177 and 86 regulators in FL vs HL and NASH vs FL, respectively (Supplementary Table S4). In NASH, the top 20 regulators arranged by p-values for non-overlap in mechanistic networks concerned the categories of cell growth control, gene expression, metabolic regulation, inflammation, and survival (Table 1). Most regulators were inactive (n=82); and only few of these were activated (n=4): CD28 and LCK (regulators of lymphocyte biology), IGF1R (cell metabolism), and MAPK14 (cell survival). These downstream networks contributed differently in FL (vs HL) or NASH (vsFL). For instance, ATM and BRCA1 networks substituted for one another in FL and NASH, which was in agreement with ATM activation in FL, and its deficiency during progression to NASH (Supplementary Fig. S5). The mechanistic networks for MAPK14, RELA, p53 and AKT were informative (Supplementary Fig. S6).These networks were rearranged for cell repair and proliferation in FL; and for cytoprotection or cell growth-arrest in NASH. The regulators concerned metabolism and inflammation (e.g., RELA and AKT1), again with differences in FL or NASH, which agreed with the roles of ATM in metabolism, mitochondrial homeostasis and cell growth control.
TABLE 1.
Top 20 upstream regulators identified by PP expression differences in NASH vs FL*
| Regulator | Expr Fold Change |
Molecule type | Activation z-score |
p-value of overlap |
Dataset genes downstream of regulators |
Regulators in network |
|---|---|---|---|---|---|---|
| TP53 | 2.511 | transcription regulator | 0.827 | 1.11E-31 | 89 | 19 |
| SP1 | 1.791 | transcription regulator | −0.149 | 2.77E-27 | 93 | 27 |
| BRCA1 | −7.69 | transcription regulator | 0.656 | 2.24E-19 | 94 | 22 |
| RELA | −2.677 | transcription regulator | −0.414 | 7.72E-19 | 84 | 17 |
| AKT1 | −2.385 | kinase | −0.519 | 3.23E-18 | 91 | 25 |
| IKBKB | 2.16 | kinase | 0.733 | 5.84E-18 | 67 | 15 |
| ERBB2 | 1.671 | kinase | −0.331 | 8.98E-18 | 99 | 24 |
| NFKB1 | −1.588 | transcription regulator | 0.945 | 4.92E-17 | 71 | 14 |
| FAS | 2.109 | transmembrane receptor | 1.267 | 1.25E-16 | 92 | 18 |
| BCL2 | −1.966 | transporter | −1.177 | 1.13E-15 | 95 | 21 |
| CD28 | −1.556 | transmembrane receptor | 2.072 | 9.84E-14 | 80 | 17 |
| NFKBIA | −1.735 | transcription regulator | −1.457 | 4.8E-13 | 83 | 16 |
| MTOR | 1.581 | kinase | 1 | 2.57E-12 | 86 | 17 |
| JAK2 | 2.089 | kinase | 0.872 | 4.75E-12 | 75 | 18 |
| ATM | −3.924 | kinase | −0.445 | 5.02E-12 | 95 | 22 |
| RAF1 | −2.626 | kinase | 0.878 | 1.46E-11 | 87 | 24 |
| TP73 | 3.272 | transcription regulator | 1.367 | 3.03E-11 | 89 | 16 |
| GSK3B | 1.533 | kinase | −1.125 | 4.35E-11 | 87 | 23 |
| CBL | −1.798 | transcription regulator | 1.067 | 3.79E-10 | 66 | 13 |
| PRKCZ | 1.783 | kinase | −1.912 | 4.15E-10 | 95 | 19 |
Data are generated by IPA (see Supplementary Table S4)
4. DISCUSSION
This study identified perturbations at multiple levels in ATM pathways in cases of FL as well as NASH. Despite metabolic dysregulation, oxidative stress and inflammation as among the harbingers for NAFLD, mechanistic linkages in hepatic damage, fibrosis and cancer have remained elusive. The regulation by ATM pathways of mitochondrial homeostasis, metabolism and DNA integrity should be critical for disease progression in NASH. Significantly, our study revealed that both activation and inactivation of ATM pathways was important.
The approach using sample pools, simultaneous mRNA and protein analyses, and bioinformatics annotations was quite informative. In tissue mRNA databases from human NAFLD, ATM pathways have not been obvious [18, 19]. One reason could be sampling or assay limitations due to small biopsy materials. Another could be discrepant nature of the directionalities in mRNA and protein expression within tissues [20]. Notwithstanding that human NAFLD is not reproduced effectively in animals [34], mice with diet-induced NASH do exhibit gene ontology alterations that have included the ATM pathway [35]. Our findings of ATM pathway disruption were verified in cultured HuH-7 cells. These studies demonstrated major effects of ATM loss at mRNA as well as kinase activity levels with biochemical and genetic approaches that have been validated [23, 25]. Similar studies in intact animals are hampered by difficulties in reproducing human disease in various models. The reasons for alterations in ATM expression likely include transcriptional or post-transcriptional processes related to inflammation, including regulation by cytokines [25, 36], that should exert similar consequences according to HuH-7 cell studies.
As a cardinal component of FL and NASH, steatosis is intimately connected with mitochondria. Dysregulation of mitochondrial glycolysis and fatty acid metabolism results in ROS and DDR. For glucose homeostasis, partnering by ATM of p53, IGF1 and AMPK is already established [15, 37]. In NAFLD, these mechanisms are among those identified by mRNA analysis [19]. This is important because ATM deficiency may disrupt mitophagy [12], and also mitochondrial fission and fusion [38]. These disruptions may perpetuate ROS and amplify DDR, including by oxidative degradation of ATM protein itself [21]. Mitochondrial DNA mutations during persistent injury exacerbate ROS and worsen NAFLD [39]. In FL, profiling of TP and PP identified mechanisms potentially involving ATM since E2F1, FOXO1, or mTOR that concern it were among regulatory networks. These have been previously noted by mRNA analysis [19], and may increase steatosis [40-42]. By contrast, downregulation of MAPK14 may decrease steatosis through greater expression of PPARα, PGC1α or CYP7A1 [43]. Importantly, in NASH, activation or inactivation of regulatory networks often reversed. Since loss of diseased cells might decrease apparent steatosis, little correlation in steatosis and DDR markers should make sense.
Hepatic inflammation correlated more strongly with DDR. After DNA damage, cell survival involves regulation by ATM of cell death receptors and regulatory cytokines, e.g., TNFα [13]. In FL, mechanistic networks were activated for major inflammatory cytokines. In NASH, cytokine networks were downregulated, e.g., RELA and NF-kB, which are also regulated by ATM [44].
Multiple evidences indicated residual hepatocytes in NASH were in survival mode. This brings in MAPK14 network again – it transduces genotoxic stress after inflammation through p38MAPK [45, 46]. Targets of MAPK14 regulate cell cycle, chromatin reassembly and apoptosis. Oxidative stress or DDR directly activate ATM and p38MAPK to inhibit proliferation via p53 [26]; similarly, after ischemia - reperfusion injury, p38MAPK improves hepatocyte survival but restricts proliferation [47]. ATM inhibition also affects MAPK14 signaling and this increases radiation injury [46]. Despite ATM engagement, MAPK14 was not activated in FL. By contrast, MAPK14 was activated in NASH with ATM depletion. These processes contributed variances in tissue markers for DDR - absent in FL but present in NASH; and also for hepatocyte proliferation - active in FL but inhibited in NASH.
Intracellular injury with hepatic ballooning is another aspect of NASH. Differences in FL and NASH of growth factor signaling, e.g., IGF1R network (activated in NASH), including in concert with AKT, may impact liver cell survival and proliferation [48]. Similarly, AKT signaling, which was active in FL but decreased in NASH, may improve hepatocyte survival after injury [49]. As metabolic alterations may impair mitochondrial fission/fusion to disrupt cell cycling [11], this will be another mechanism for disease progression. Of note, cell division is arrested without transfer of mitochondria to daughter cells leading to polyploidy [9, 11]. Activation by ATM of p53-dependent G1/S and G2/M checkpoints are also reasons for polyploidy. Thus, p53 mechanistic network was regulated differently: it was inactive in FL as hepatocytes were allowed to proliferate; and it was active in NASH as hepatocyte proliferation ceased. This cell growth-arrest was wide-ranging because all ploidy classes were affected via p53 effector, p21 [50]. Such perturbations have been of significance for attenuating hepatic replication in cell transplantation assays [51], as well as ALF or chronic liver disease [9, 52]. Association of p21 with telomere shortening, which indicates replicative senescence, has been reported in NASH [7].
In disease conditions, ATM pathway is strongly linked to oncogenesis [10]. In NASH, mRNA expression profiling has been consistent with activation of cancer pathways [18, 19]. In preoncogenic settings, restriction of tissue repair with genotoxic injury invites cell transformation [29]. Although the molecular nature of genotoxic alterations is complex, cell compartment alterations during hepatocarcinogenesis identified emergence of oval cells in animals as well as people with NASH [30, 31]. In our study, oval cells avoided DNA damage and actively proliferated, such that substantial fractions were in G1/S and G2/M, along with expression of Ki67 and aneuploid DNA. This expansion of oval cells was clearly aimed at compensating for hepatocyte losses and hepatic growth-arrest in NASH. Lack of suitable markers for predisposition to HCC in NASH is a major gap in clinical management. Therefore, the Cx43 marker of oval cell activation will be helpful for identifying cohorts with susceptibility to HCC.
Disease prediction models for NAFLD have been developed [53], albeit with serious limitations due to uncertain mechanistic biomarkers for this purpose. The incorporation of DDR markers, including for DSBs, to separate less and more severe disease stages should be helpful. In this way, early identification of at-risk individuals for disease progression should allow early interventions. The criterion of DDR should strengthen clinical trials in NAFLD: By allowing superior cohort selection; and from outcomes analysis in meaningful subgroups.
The potential of molecular pathway-based interventions has begun to be exploited, as exemplified by the antagonism of MAPK14 or AKT to overcome drug resistance in HCC [45, 54]. Similarly, well-characterized targets within the ATM pathway will provide additional opportunities for therapeutic development in NASH.
Supplementary Material
ACKNOWLEDGEMENTS
PV and YS conducted experiments and analyzed data; SG conceived the experiments and analyzed data. All authors were involved in writing of the paper and approval of the submitted version.
FUNDING
This work was supported in part by NIH grants R01 DK071111, P30 DK41296, P30 DK020541and P30 CA13330.
ABBREVIATIONS
- ATM
ataxia telangiectasia mutated
- Cx
connexin
- Coll
collagen
- DDR
DNA damage response
- DHR
dihydrorohodamine
- DAPI
2-(4-amidinophenyl)-1H -indole-6-carboxamidine
- FL
fatty liver
- HCC
hepatocellular carcinoma
- HL
healthy liver
- MMP
mitochondrial membrane potential
- NAFLD
nonalcoholic fatty liver disease
- NAS
NAFLD activity score
- NASH
nonalcoholic steatohepatitis
- Ox Coll
oxidized collagen
- PP
phosphoprotein
- ROS
reactive oxygen species
- TP
total protein
Footnotes
Conflicts of interest: The authors declare no conflicts of interest exist.
Publisher's Disclaimer: This is a PDF file of an unedited manuscript that has been accepted for publication. As a service to our customers we are providing this early version of the manuscript. The manuscript will undergo copyediting, typesetting, and review of the resulting proof before it is published in its final form. Please note that during the production process errors may be discovered which could affect the content, and all legal disclaimers that apply to the journal pertain.
REFERENCES
- [1].Estes C, Razavi H, Loomba R, Younossi Z, Sanyal AJ. Modeling the epidemic of nonalcoholic fatty liver disease demonstrates an exponential increase in burden of disease. Hepatology 2018;67:123–133. [DOI] [PMC free article] [PubMed] [Google Scholar]
- [2].Schuppan D, Surabattula R, Wang XY. Determinants of fibrosis progression and regression in NASH. J Hepatol 2018;68:238–250. [DOI] [PubMed] [Google Scholar]
- [3].Younossi Z, Stepanova M, Ong JP, Jacobson IM, Bugianesi E, Duseja A, et al. Non-alcoholic Steatohepatitis is the Fastest Growing Cause of Hepatocellular Carcinoma in Liver Transplant Candidates. Clin Gastroenterol Hepatol 2018. [DOI] [PubMed]
- [4].Brunt EM, Kleiner DE, Wilson LA, Belt P, Neuschwander-Tetri BA. Nonalcoholic fatty liver disease (NAFLD) activity score and the histopathologic diagnosis in NAFLD: distinct clinicopathologic meanings. Hepatology 2011;53:810–820. [DOI] [PMC free article] [PubMed] [Google Scholar]
- [5].Musso G, Cassader M, Paschetta E, Gambino R. Bioactive lipid species and metabolic pathways in progression and resolution of Non-Alcoholic Steatohepatitis. Gastroenterology 2018. [DOI] [PubMed]
- [6].Gentric G, Maillet V, Paradis V, Couton D, L'Hermitte A, Panasyuk G, et al. Oxidative stress promotes pathologic polyploidization in nonalcoholic fatty liver disease. J Clin Invest 2015;125:981–992. [DOI] [PMC free article] [PubMed] [Google Scholar]
- [7].Aravinthan A, Scarpini C, Tachtatzis P, Verma S, Penrhyn-Lowe S, Harvey R, et al. Hepatocyte senescence predicts progression in non-alcohol-related fatty liver disease. J Hepatol 2013;58:549–556. [DOI] [PubMed] [Google Scholar]
- [8].Subhashree M, Venkateswarlu R, Karthik K, Shangamithra V, Venkatachalam P. DNA damage and the bystander response in tumor and normal cells exposed to X-rays. Mutation research 2017;821:20–27. [DOI] [PubMed] [Google Scholar]
- [9].Viswanathan P, Sharma Y, Gupta P, Gupta S. Replicative stress and alterations in cell cycle checkpoint controls following acetaminophen hepatotoxicity restrict liver regeneration. Cell Prolif 2018;51:e12445. [DOI] [PMC free article] [PubMed] [Google Scholar]
- [10].Blackford AN, Jackson SP. ATM, ATR, and DNA-PK: The Trinity at the Heart of the DNA Damage Response. Mol Cell 2017;66:801–817. [DOI] [PubMed] [Google Scholar]
- [11].Horbay R, Bilyy R. Mitochondrial dynamics during cell cycling. Apoptosis : an international journal on programmed cell death 2016;21:1327–1335. [DOI] [PubMed] [Google Scholar]
- [12].Valentin-Vega YA, Kastan MB. A new role for ATM: regulating mitochondrial function and mitophagy. Autophagy 2012;8:840–841. [DOI] [PMC free article] [PubMed] [Google Scholar]
- [13].Biton S, Ashkenazi A. NEMO and RIP1 control cell fate in response to extensive DNA damage via TNF-alpha feedforward signaling. Cell 2011;145:92–103. [DOI] [PubMed] [Google Scholar]
- [14].Ching JK, Spears LD, Armon JL, Renth AL, Andrisse S, Collins RLt, et al. Impaired insulin-stimulated glucose transport in ATM-deficient mouse skeletal muscle. Applied physiology, nutrition, and metabolism = Physiologie appliquee, nutrition et metabolisme 2013;38:589–596. [DOI] [PMC free article] [PubMed] [Google Scholar]
- [15].Suzuki A, Kusakai G, Kishimoto A, Shimojo Y, Ogura T, Lavin MF, et al. IGF-1 phosphorylates AMPK-alpha subunit in ATM-dependent and LKB1-independent manner. Biochem Biophys Res Commun 2004;324:986–992. [DOI] [PubMed] [Google Scholar]
- [16].Weiss B, Krauthammer A, Soudack M, Lahad A, Sarouk I, Somech R, et al. Liver Disease in Pediatric Patients With Ataxia Telangiectasia: A Novel Report. J Pediatr Gastroenterol Nutr 2016;62:550–555. [DOI] [PubMed] [Google Scholar]
- [17].Daugherity EK, Balmus G, Al Saei A, Moore ES, Abi Abdallah D, Rogers AB, et al. The DNA damage checkpoint protein ATM promotes hepatocellular apoptosis and fibrosis in a mouse model of non-alcoholic fatty liver disease. Cell cycle (Georgetown, Tex) 2012;11:1918–1928. [DOI] [PMC free article] [PubMed] [Google Scholar]
- [18].Ahrens M, Ammerpohl O, von Schonfels W, Kolarova J, Bens S, Itzel T, et al. DNA methylation analysis in nonalcoholic fatty liver disease suggests distinct disease-specific and remodeling signatures after bariatric surgery. Cell metabolism 2013;18:296–302. [DOI] [PubMed] [Google Scholar]
- [19].Li L, Liu H, Hu X, Huang Y, Wang Y, He Y, et al. Identification of key genes in nonalcoholic fatty liver disease progression based on bioinformatics analysis. Molecular medicine reports 2018;17:7708–7720. [DOI] [PMC free article] [PubMed] [Google Scholar]
- [20].Wilhelm M, Schlegl J, Hahne H, Gholami AM, Lieberenz M, Savitski MM, et al. Mass-spectrometry-based draft of the human proteome. Nature 2014;509:582–587. [DOI] [PubMed] [Google Scholar]
- [21].Guo Z, Kozlov S, Lavin MF, Person MD, Paull TT. ATM activation by oxidative stress Science (New York, NY) 2010;330:517–521. [DOI] [PubMed] [Google Scholar]
- [22].Malhi H, Bronk SF, Werneburg NW, Gores GJ. Free fatty acids induce JNK-dependent hepatocyte lipoapoptosis. J Biol Chem 2006;281:12093–12101. [DOI] [PubMed] [Google Scholar]
- [23].Lin F, Li R, Pan ZX, Zhou B, Yu DB, Wang XG, et al. miR-26b promotes granulosa cell apoptosis by targeting ATM during follicular atresia in porcine ovary. PLoS One 2012;7:e38640. [DOI] [PMC free article] [PubMed] [Google Scholar]
- [24].Giri RK, Malhi H, Joseph B, Kandimalla J, Gupta S. Metal-catalyzed oxidation of extracellular matrix components perturbs hepatocyte survival with activation of intracellular signaling pathways. Exp Cell Res 2003;291:451–462. [DOI] [PubMed] [Google Scholar]
- [25].Bandi S, Viswanathan P, Gupta S. Evaluation of cytotoxicity and DNA damage response with analysis of intracellular ATM signaling pathways. Assay Drug Dev Technol 2014;12:272–281. [DOI] [PMC free article] [PubMed] [Google Scholar]
- [26].Kumari G, Ulrich T, Krause M, Finkernagel F, Gaubatz S. Induction of p21CIP1 protein and cell cycle arrest after inhibition of Aurora B kinase is attributed to aneuploidy and reactive oxygen species. J Biol Chem 2014;289:16072–16084. [DOI] [PMC free article] [PubMed] [Google Scholar]
- [27].Sigal SH, Rajvanshi P, Gorla GR, Sokhi RP, Saxena R, Gebhard DR Jr., et al. Partial hepatectomy-induced polyploidy attenuates hepatocyte replication and activates cell aging events. Am J Physiol 1999;276:G1260–1272. [DOI] [PubMed] [Google Scholar]
- [28].Gupta S Hepatic polyploidy and liver growth control. Seminars in cancer biology 2000;10:161–171. [DOI] [PubMed] [Google Scholar]
- [29].Sell S, Leffert HL. Liver cancer stem cells. J Clin Oncol 2008;26:2800–2805. [DOI] [PMC free article] [PubMed] [Google Scholar]
- [30].Lee JS, Heo J, Libbrecht L, Chu IS, Kaposi-Novak P, Calvisi DF, et al. A novel prognostic subtype of human hepatocellular carcinoma derived from hepatic progenitor cells. Nat Med 2006;12:410–416. [DOI] [PubMed] [Google Scholar]
- [31].Roskams T, Yang SQ, Koteish A, Durnez A, DeVos R, Huang X, et al. Oxidative stress and oval cell accumulation in mice and humans with alcoholic and nonalcoholic fatty liver disease. Am J Pathol 2003;163:1301–1311. [DOI] [PMC free article] [PubMed] [Google Scholar]
- [32].Bode HP, Wang L, Cassio D, Leite MF, St-Pierre MV, Hirata K, et al. Expression and regulation of gap junctions in rat cholangiocytes. Hepatology 2002;36:631–640. [DOI] [PubMed] [Google Scholar]
- [33].Paku S, Nagy P, Kopper L, Thorgeirsson SS. 2-acetylaminofluorene dose-dependent differentiation of rat oval cells into hepatocytes: confocal and electron microscopic studies. Hepatology 2004;39:1353–1361. [DOI] [PubMed] [Google Scholar]
- [34].Santhekadur PK, Kumar DP, Sanyal AJ. Preclinical models of non-alcoholic fatty liver disease. J Hepatol 2018;68:230–237. [DOI] [PMC free article] [PubMed] [Google Scholar]
- [35].Soufi N, Hall AM, Chen Z, Yoshino J, Collier SL, Mathews JC, et al. Inhibiting monoacylglycerol acyltransferase 1 ameliorates hepatic metabolic abnormalities but not inflammation and injury in mice. J Biol Chem 2014;289:30177–30188. [DOI] [PMC free article] [PubMed] [Google Scholar]
- [36].Gueven N, Keating KE, Chen P, Fukao T, Khanna KK, Watters D, et al. Epidermal growth factor sensitizes cells to ionizing radiation by down-regulating protein mutated in ataxia-telangiectasia. J Biol Chem 2001;276:8884–8891. [DOI] [PubMed] [Google Scholar]
- [37].Armata HL, Golebiowski D, Jung DY, Ko HJ, Kim JK, Sluss HK. Requirement of the ATM/p53 tumor suppressor pathway for glucose homeostasis. Molecular and cellular biology 2010;30:5787–5794. [DOI] [PMC free article] [PubMed] [Google Scholar]
- [38].Qian W, Choi S, Gibson GA, Watkins SC, Bakkenist CJ, Van Houten B. Mitochondrial hyperfusion induced by loss of the fission protein Drp1 causes ATM-dependent G2/M arrest and aneuploidy through DNA replication stress. J Cell Sci 2012;125:5745–5757. [DOI] [PMC free article] [PubMed] [Google Scholar]
- [39].Sookoian S, Flichman D, Scian R, Rohr C, Dopazo H, Gianotti TF, et al. Mitochondrial genome architecture in non-alcoholic fatty liver disease. J Pathol 2016;240:437–449. [DOI] [PubMed] [Google Scholar]
- [40].Denechaud PD, Lopez-Mejia IC, Giralt A, Lai Q, Blanchet E, Delacuisine B, et al. E2F1 mediates sustained lipogenesis and contributes to hepatic steatosis. J Clin Invest 2016;126:137–150. [DOI] [PMC free article] [PubMed] [Google Scholar]
- [41].Fernandes GW, Bocco B, Fonseca TL, McAninch EA, Jo S, Lartey LJ, et al. The Foxo1-Inducible Transcriptional Repressor Zfp125 Causes Hepatic Steatosis and Hypercholesterolemia. Cell reports 2018;22:523–534. [DOI] [PMC free article] [PubMed] [Google Scholar]
- [42].Zhou W, Ye S. Rapamycin improves insulin resistance and hepatic steatosis in type 2 diabetes rats through activation of autophagy. Cell biology international 2018. [DOI] [PubMed]
- [43].Xiao Y, Wang J, Yan W, Zhou K, Cao Y, Cai W. p38alpha MAPK antagonizing JNK to control the hepatic fat accumulation in pediatric patients onset intestinal failure. Cell Death Dis 2017;8:e3110. [DOI] [PMC free article] [PubMed] [Google Scholar]
- [44].Fang L, Choudhary S, Zhao Y, Edeh CB, Yang C, Boldogh I, et al. ATM regulates NF-kappaB-dependent immediate-early genes via RelA Ser 276 phosphorylation coupled to CDK9 promoter recruitment. Nucleic acids research 2014;42:8416–8432. [DOI] [PMC free article] [PubMed] [Google Scholar]
- [45].Witt-Kehati D, Fridkin A, Alaluf MB, Zemel R, Shlomai A. Inhibition of pMAPK14 Overcomes Resistance to Sorafenib in Hepatoma Cells with Hepatitis B Virus. Translational oncology 2018;11:511–517. [DOI] [PMC free article] [PubMed] [Google Scholar]
- [46].Liang N, Zhong R, Hou X, Zhao G, Ma S, Cheng G, et al. Ataxia-telangiectasia mutated (ATM) participates in the regulation of ionizing radiation-induced cell death via MAPK14 in lung cancer H1299 cells. Cell Prolif 2015;48:561–572. [DOI] [PMC free article] [PubMed] [Google Scholar]
- [47].Kapoor S, Berishvili E, Bandi S, Gupta S. Ischemic preconditioning affects long-term cell fate through DNA damage-related molecular signaling and altered proliferation. Am J Pathol 2014;184:2779–2790. [DOI] [PMC free article] [PubMed] [Google Scholar]
- [48].Pivonello C, Negri M, De Martino MC, Napolitano M, de Angelis C, Provvisiero DP, et al. The dual targeting of insulin and insulin-like growth factor 1 receptor enhances the mTOR inhibitor-mediated antitumor efficacy in hepatocellular carcinoma. Oncotarget 2016;7:9718–9731. [DOI] [PMC free article] [PubMed] [Google Scholar]
- [49].Liu W, Jing ZT, Wu SX, He Y, Lin YT, Chen WN, et al. A Novel AKT Activator, SC79, Prevents Acute Hepatic Failure Induced by Fas-Mediated Apoptosis of Hepatocytes. Am J Pathol 2018;188:1171–1182. [DOI] [PubMed] [Google Scholar]
- [50].Beamish H, Williams R, Chen P, Lavin MF. Defect in multiple cell cycle checkpoints in ataxia-telangiectasia postirradiation. J Biol Chem 1996;271:20486–20493. [DOI] [PubMed] [Google Scholar]
- [51].Gorla GR, Malhi H, Gupta S. Polyploidy associated with oxidative injury attenuates proliferative potential of cells. J Cell Sci 2001;114:2943–2951. [DOI] [PubMed] [Google Scholar]
- [52].Wiemann SU, Satyanarayana A, Tsahuridu M, Tillmann HL, Zender L, Klempnauer J, et al. Hepatocyte telomere shortening and senescence are general markers of human liver cirrhosis. Faseb j 2002;16:935–942. [DOI] [PubMed] [Google Scholar]
- [53].Vilar-Gomez E, Chalasani N. Non-invasive assessment of non-alcoholic fatty liver disease: Clinical prediction rules and blood-based biomarkers. J Hepatol 2018;68:305–315. [DOI] [PubMed] [Google Scholar]
- [54].Zhai B, Zhang X, Sun B, Cao L, Zhao L, Li J, et al. MK2206 overcomes the resistance of human liver cancer stem cells to sorafenib by inhibition of pAkt and upregulation of pERK. Tumour Biol 2016;37:8047–8055. [DOI] [PubMed] [Google Scholar]
Associated Data
This section collects any data citations, data availability statements, or supplementary materials included in this article.


