

Abstract
Purpose:
To examine whether the rate of change in maximum 18F-FDOPA PET uptake and the rate of change in non-enhancing tumor volume could predict malignant transformation and residual overall survival (OS) in low grade glioma (LGG) patients who received serial 18F-FDOPA PET and MRI scans.
Methods:
27 LGG patients with ≥2 18F-FDOPA PET and MRI scans between 2003–2016 were included. The rate of change in FLAIR volume (uL/day) and maximum normalized 18F-FDOPA specific uptake value (nSUVmax/month), were compared between histological and molecular subtypes. General linear models (GLMs) were used to integrate clinical information with MR-PET measurements to predict malignant transformation. Cox univariate and multivariable regression analyses were performed to identify imaging and clinical risk factors related to OS.
Results:
A GLM using patient age, treatment, the rate of change in FLAIR and 18F-FDOPA nSUVmax could predict malignant transformation with >67% sensitivity and specificity (AUC=0.7556,P=0.0248). A significant association was observed between OS and continuous rates of change in PET uptake (HR=1.0212,P=0.0034). Cox multivariable analysis confirmed that continuous measures of the rate of change in PET uptake was an independent predictor of OS (HR=1.0242,P=0.0033); however, stratification of patients based on increasing or decreasing rate of change in FLAIR (HR=2.220,P=0.025), PET uptake (HR=2.148,P=0.0311), or both FLAIR and PET (HR=2.354,P=0.0135) predicted OS.
Conclusions:
The change in maximum normalized 18F-FDOPA PET uptake, with or without clinical information and rate of change in tumor volume, may be useful for predicting the risk of malignant transformation and estimating residual survival in patients with LGG.
Keywords: 18F-FDOPA PET, biomarker, low grade glioma, MRI
INTRODUCTION
The lack of effective treatments for patients with gliomas remains a significant health problem and highlights the need for novel and innovative therapeutic approaches. While maximum resection followed by chemoradiation is the standard of care for glioblastoma, there is no standard of care for low-grade gliomas (LGGs), and management of low-grade gliomas remains one of the most controversial areas in clinical neuro-oncology[1]. Patients with low-grade, IDH mutant gliomas tend to be young (mean age 35–40[2]) and can have a relatively long survival (5–13 years from diagnosis[2–5]). Aggressive chemoradiation in these patients can result in significant morbidity (~98% of patients in RTOG-9802)[5], leading some oncologists to adopt a “watch and wait” strategy[6, 7] prior to aggressive surgery and/or chemoradiation[6, 8]. Since low-grade IDH mutant tumors grow very slowly and patients may have a relatively long survival, testing of new, often non-beneficial therapies, in large clinical trials based solely on survival outcomes can take more than 20 years (e.g. RTOG-9802)[3]. Thus, there is a significant demand for non-invasive imaging biomarkers that can quickly identify transformation of low-grade into higher grade gliomas, as well as predict overall survival in low-grade gliomas.
Although magnetic resonance imaging (MRI) is routinely used for serial evaluation of tumor burden in patients with LGGs[9], amino acid positron emission tomography (PET) is often used for confirming the presence of metabolically active tumors. Unlike normal brain tissue, tumor cells use amino acids for fuel and a variety of enzymatic processes. Thus, amino acid PET has higher tumor-to-background uptake (i.e. contrast to noise) compared with traditional FDG PET and better delineates hypermetabolic regions from less aggressive areas of the tumor [10–17]. While [18F]-fluoro-ethyl-tyrosine (18F-FET) PET is the most frequently used amino acid PET tracer in neuro-oncology due to its long half-life and simple synthesis [17], other tracers including methyl-L-[11C]-methionine (11C-MET) and 3,4-dihydroxy-6-[18F]-fluoro-L-phenylalanine (18F-FDOPA) provide similar information[18, 19], as they share a common transport mechanism (i.e. system L amino acid transporters like LAT1–4). 18F-FDOPA PET is regularly used for diagnosis and management of movement disorders including Parkinson’s disease[20, 21], so its dual use in neuro-oncology is economically attractive. 18F-FDOPA PET combined with MRI has been shown to significantly improve diagnosis [22], identify the degree of malignancy, and differentiate pseudoprogression from true tumor growth [23–25]. Thus, we hypothesized serial changes in 18F-FDOPA PET combined with changes in MRI may be useful as a unique tool for predicting both malignant transformation as well as predicting residual survival in patients with LGG. In the current study, we examined a series of 27 patients with LGGs who received two or more 18F-FDOPA PET scans and corresponding MRI scans to determine whether a general model consisting of clinical information, the time rate of change in maximum 18F-FDOPA PET uptake, and the time rate of change in non-enhancing tumor volume could be used to predict eventual malignant transformation and residual OS from the time of the last PET scan.
METHODS
Patient Selection
The UCLA Medical Center institutional review board approved this study (IRB IRB#15–000467). Patients from 2003 to 2016 with histology confirmed LGG (WHO II) who underwent at least two 18F-FDOPA PET scans and MRI scans within 3 months of the PET scans, and had no surgical intervention between scans were eligible for inclusion. A total of 27 patients were identified as having two or more 18F-FDOPA PET scans, MRI scans consisting of at least pre- and post-contrast T1-weighted images and either T2-weighted turbo spin echo or T2-weighted fluid-attenuated inversion recovery (FLAIR) images with sufficient quality, lack of contrast enhancement, and adequate clinical information including survival. When available, isocitrate dehydrogenase (IDH) 1 mutational status, 1p19q codeletion status, and O6-methylguanine–DNA methyltransferase (MGMT) promoter methylation results were obtained from the patient’s clinical chart. IDH mutation status was determined by genomic sequencing analysis using polymerase chain reaction (PCR) and/or through immunohistochemistry (IHC) of resected tumor tissue. 1p/19 co-deletion status was identified using fluorescence in situ hybridization (FISH) or Foundation medicine. MGMT methylation status was determined by PCR analysis. Malignant transformation was determined either by histology or radiological changes consistent with transformation (e.g. emergence of contrast enhancement suggestive of transformation to higher grade as indicated in the clinical radiology report). OS was measured from the time of the 2nd PET scan until death. Table 1 summarizes these patient demographics and molecular information.
Table 1: Patient Demographics.
| Patient ID | Sex | Age | WHO 2007 (Histological) Diagnosis | IDH Status | lpl9q Status | MGMT Status | Date of Initial Diagnosis | Date of 1st PET Scan | Date of 2nd PET Scan | Days Between PET Scans | Therapy Between PET Scans | Transformed < 6 mo After 2nd PET Scan |
|---|---|---|---|---|---|---|---|---|---|---|---|---|
| 1 | M | 45 | LO | MUT | Codel | M | 1/16/2009 | 4/7/2009 | 5/2/2013 | 1486 | None | Yes |
| 2 | F | 62 | LA | WT | Unknown | Unknown | 2/28/2012 | 10/26/2010 | 1/17/2012 | 448 | None | Yes |
| 3 | M | 49 | OA | WT | Non-Codel | M | 1/15/2009 | 7/21/2009 | 6/8/2010 | 322 | None | Yes |
| 4 | M | 34 | LO | MUT | Codel | M | 7/2/2009 | 7/27/2010 | 3/6/2012 | 588 | None | Yes |
| 5 | F | 48 | LA | Unknown | Unknown | Unknown | 6/8/1995 | 4/28/2009 | 4/27/2010 | 364 | TMZ | No |
| 6 | M | 34 | LA | MUT | Non-Codel | U | 6/12/1997 | 2/8/2011 | 2/6/2014 | 1094 | TMZ | Yes |
| 7 | M | 40 | LO | MUT | Unknown | U | 1/12/1998 | 9/12/2007 | 4/20/2010 | 951 | CCNU | No |
| 8 | F | 44 | OA | MUT | Codel | M | 4/12/2000 | 3/14/2007 | 8/31/2010 | 1266 | None | Yes |
| 9 | M | 31 | LO | MUT | Codel | M | 4/24/2007 | 10/30/2008 | 10/24/2011 | 1089 | None | Yes |
| 10 | M | 34 | LO | MUT | Codel | M | 11/14/2001 | 2/21/2007 | 6/19/2008 | 484 | RT | Yes |
| 11 | M | 50 | OA | Unknown | Unknown | Unknown | 8/22/2003 | 2/9/2010 | 11/2/2010 | 266 | CCNU | No |
| 12 | M | 64 | LA | Unknown | Unknown | Unknown | 6/10/2005 | 6/19/2008 | 12/8/2009 | 537 | CCNU | Yes |
| 13 | M | 36 | LA | WT | Non-Codel | U | 3/25/2005 | 6/6/2007 | 6/21/2011 | 1111 | None | No |
| 14 | F | 31 | OA | Unknown | Codel | Unknown | 1/12/2009 | 9/23/2009 | 2/21/2012 | 881 | None | No |
| 15 | M | 30 | LO | WT | Non-Codel | Unknown | 11/4/1998 | 5/9/2007 | 11/14/2007 | 189 | None | No |
| 16 | M | 32 | OA | MUT | Non-Codel | Unknown | 7/12/2007 | 2/6/2008 | 7/28/2009 | 538 | TMZ | Yes |
| 17 | M | 48 | OA | Unknown | Codel | Unknown | 11/5/2007 | 3/31/2009 | 6/20/2013 | 1542 | None | No |
| 18 | M | 35 | OA | MUT | Codel | U | 3/20/2008 | 9/9/2008 | 9/8/2009 | 364 | TMZ | No |
| 19 | M | 71 | OA | Unknown | Unknown | Unknown | 2/19/2001 | 2/24/2009 | 7/31/2009 | 157 | TMZ | No |
| 20 | F | 34 | OA | MUT | Non-Codel | M | 5/7/2008 | 10/21/2008 | 5/30/2013 | 1682 | RT | No |
| 21 | M | 33 | LO | MUT | Codel | U | 3/2/2009 | 3/2/2010 | 10/30/2014 | 1703 | None | Yes |
| 22 | M | 39 | LA | Unknown | Unknown | Unknown | 7/10/2009 | 11/16/2010 | 6/21/2011 | 217 | TMZ | No |
| 23 | F | 24 | LA | MUT | Unknown | M | 2/10/2009 | 10/30/2009 | 3/1/2011 | 487 | TMZ | No |
| 24* | M | 24 | LO | MUT | Codel | Unknown | 11/24/2010 | 1/4/2011 | 1/5/2012 | 366 | TMZ | No |
| 25 | F | 53 | LA | MUT | Non-Codel | U | 1/31/2011 | 9/5/2013 | 4/10/2014 | 217 | TMZ+RT | No |
| 26 | F | 37 | OA | MUT | Non-Codel | U | 11/21/2011 | 10/2/2012 | 10/24/2013 | 387 | None | Yes |
| 27 | M | 87 | LA | WT | Non-Codel | M | 12/14/2011 | 4/3/2014 | 8/7/2014 | 126 | None | No |
=Cerebellar IDHMUT, 1p19q codeleted patient with unknown MGMT status.
Magnetic Resonance Imaging Acquisition and Analysis
Anatomic MRI consisted of at least standard anatomic T1-weighted pre- and post-contrast images (2D axial turbo spin echo with 3 mm slice thickness and no interslice gap or 3D inversion-prepared gradient echo images with 1–1.5 mm isotropic voxel size), and 2D axial T2-weighted or T2-weighted FLAIR images acquired at 3 mm slice thickness with no interslice gap. The presence or absence of nodular contrast enhancement (CE) on post-contrast T1-weighted images within the lesion was determined by the official clinical radiology report. All 27 patients included in the current study lacked CE on post-contrast T1-weighted images.
A single volume of interest (VOI) was segmented based on regions of T2 hyperintensity on T2-weighted or T2-weighted FLAIR images by two investigators (T.O. and J.Y.) and confirmed by another investigator (B.E.) using a semi-automatic procedure documented previously [26–28] and the Analysis of Functional NeuroImages (AFNI) software (NIMH Scientific and Statistical Computing Core; Bethesda, MD, USA). All volumes are reported in microliters (uL) and the time rate of change in tumor volume was quantified by calculating the change in volume divided by the time interval between the two MRI scans (units of uL/day).
18F-FDOPA PET Image Acquisition and Analysis
18F-FDOPA PET scans were acquired using a high-resolution full-ring PET scanner (ECAT-HR; CTI/MIMVista) after subjects fasted for more than 4 hours. 18F-FDOPA was synthesized and injected intravenously according to previously established procedures[29, 30]. A CT scan was acquired prior to PET for attenuation correction. Three-dimensional 18F-FDOPA emission data were acquired for a total of 30 minutes, and data were integrated between 10 and 30 minutes from injection to obtain 20-min static 18F-FDOPA images following reconstruction. PET images were reconstructed using an ordered-subset expectation maximization (OSEM) iterative reconstruction algorithm consisting of six iterations with eight subsets [31, 32]. Lastly, a Gaussian filter with a full width at half maximum of 4 mm was applied. The resulting voxel sizes were 1.34 mm × 1.34 mm × 3 mm for 18F-FDOPA PET images. These images were then fused to the MRI scans using a 12-degree of freedom affine registration transformation with a normalized mutual information cost function using FSL (FLIRT; FMRIB Software Library, Oxford, England; http://www.fmrib.ox.ac.uk/fsl/).
Standardized uptake volume (SUV) maps were calculated based on the radioactive activity divided by the decay-corrected injected dose per body mass[33]. The resulting SUV images were then normalized to the basal ganglia (nSUV) as described previously [13, 34, 35]. Maximum nSUV was quantified within T2 hyperintense VOIs at each respective time point (nSUVmax) and the rate of change in nSUVmax was quantified by calculating the change in nSUVmax divided by the time interval between the two PET scans (units of nSUVmax/month).
General Linear Model (GLM) Integrating Clinical and MR-PET Imaging Information
Multiple linear regression was used to create a series of general linear models (GLMs) integrating known clinical information and MR-PET imaging information for the purposes of predicting the risk of malignant transformation (WHO II→III or II→IV) within 6 months of the 2nd PET scan.
Statistical Analyses
Statistical analysis was performed in MATLAB (R2018a; MathWorks, Natick, MA) or GraphPad Prism (Version 7.0c; GraphPad Software, La Jolla, CA). The receiver operating characteristic (ROC) curve was used to determine whether a combination of clinical information (e.g. age, MGMT status, on treatment during scans, etc.) combined with the rate of change in non-enhancing tumor volume and rate of change in nSUVmax could discriminate between patients who demonstrated malignant transformation within 6 months of the 2nd PET scan and those who did not transform. The area under the curve (AUC), along with sensitivity and specificity for detecting malignant transformation, was evaluated as a measure of model performance.
The Shapiro-Wilk test was used to test for normally-distributed data. For normally-distributed data, Student’s t-test or analysis of variance (ANOVA) was performed. For non-normally-distributed data, a Mann-Whitney or Wilcoxon rank-sum analysis of medians was performed. Univariate and multivariate cox proportional hazards regression analysis was performed to investigate the association between OS and one or more predictor variables including clinical information such as age and treatment along with imaging metrics like rate of change in non-enhancing tumor volume and rate of change in nSUVmax. Kaplan-Meier curves were used to display differences in OS, and the log-rank test was used to compare survival when appropriate. Statistical significance was defined as alpha = 0.05 and no correction for multiple comparisons was performed.
RESULTS
A total of 27 patients met the inclusion criteria for the current study. The mean age for these patients was 50.9±13.4 s.d. years and 29% were female. The average time interval between serial 18F-FDOPA PET exams was 1.3 years (range = 125 days to 4.7 years) and matched MRI scans used in the current study was 1.3 years (range = 125 days to 4.6 years). According to WHO 2007 histological criteria, 9 patients had low-grade diffuse astrocytomas (LA), 8 patients had low-grade oligodendrogliomas (LO), and 10 patients had low-grade mixed oligoastrocytomas (OA). A total of 15 patients were IDH mutant gliomas, 5 patients were IDH wild type, and 7 patients did not have known IDH status. Ten patients were 1p19q codeleted, 9 patients were non-codeleted, and 8 patients did not have known 1p19q status. A total of 9 patients were MGMT methylated, 7 were unmethylated, and the remaining 11 did not have MGMT status available. Approximately 48% of patients (13 of 27) were not on active therapy between the two PET and MRI exams and about 44% of patients (12 of 27) demonstrated histological or radiographic evidence of malignant transformation within 6 months of the 2nd MR-PET exam. Within 6 months of the 2nd PET scan, about 52% (14 of 27) patients accepted chemotherapy and/or radiation treatment. Of the patients who accepted therapy, about 43% (6 of 14) had malignant transformation.
Fig. 1A–C illustrates MR-PET changes in a 24-year-old female patient with a residual survival of around 1 year after the 2nd PET scan. This patient had a WHO II, IDH1 mutant, MGMT methylated diffuse glioma with multi-parametric MR-PET imaging showing increasing tumor extent crossing the midline and an increasing focus of 18F-FDOPA PET uptake over a period of about 1.3 years while on temozolomide. Conversely, Fig. 1D–F illustrates a 35-year-old male patient with a residual survival of more than 9.7 years from the 2nd PET scan. This patient had a WHO II, IDH1 mutant, unmethylated, 1p19q codeleted oligodendroglioma with a small tumor burden and minimal PET uptake that was relatively stable over 1 year of evaluation while on temozolomide.
Fig. 1:
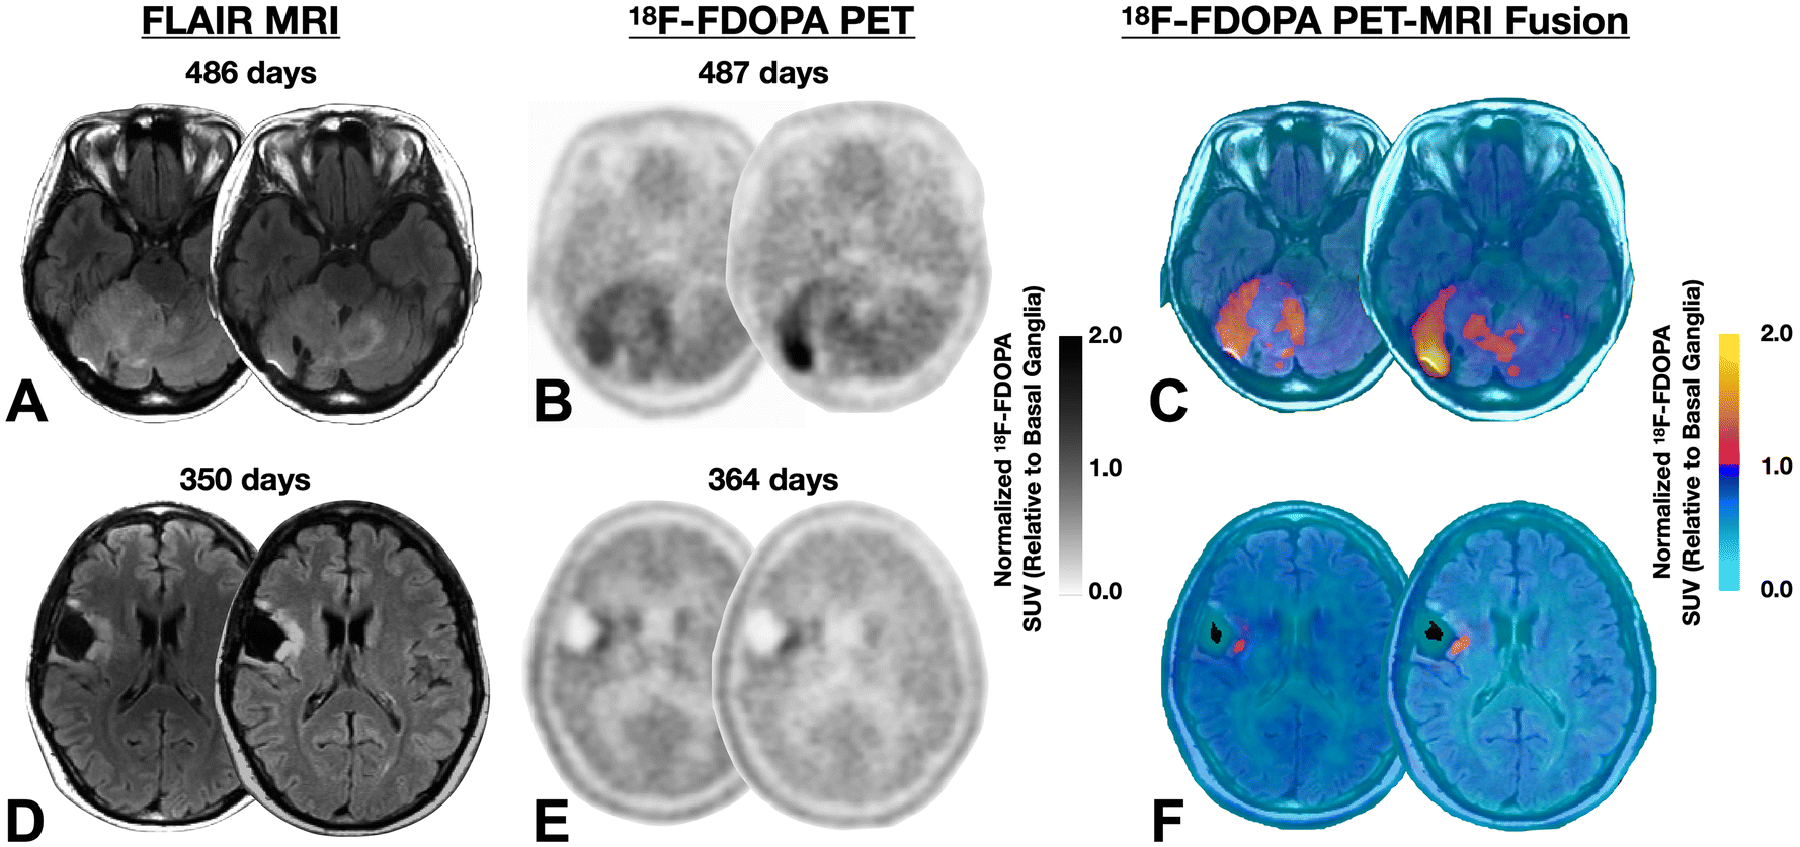
A) Fluid attenuated inversion recover (FLAIR) MRI images, B) normalized 18F-FDOPA PET uptake, and C) MR-PET fused images in a 24-year-old female patient with a WHO II, IDH1 mutant, MGMT methylated diffuse glioma with multi-parametric MR-PET imaging showing increasing tumor extent crossing the midline and an increasing focus of 18F-FDOPA PET uptake over a period of around 1.3 years while on temozolomide. This patient expired approximately 1 year after the 2nd PET scan. D) Fluid attenuated inversion recover (FLAIR) MRI images, E) normalized 18F-FDOPA PET uptake, and F) MR-PET fused images in a 35-year-old male patient with a WHO II, IDH1 mutant, unmethylated, 1p19q codeleted oligodendroglioma with a small tumor burden and minimal PET uptake that is relatively stable over a year of evaluation while on temozolomide. This patient expired more than 9.7 years from the time of the last PET scan.
There was a weak but significant correlation between the rate of change in 18F-FDOPA PET nSUVmax and the rate of change in non-enhancing tumor volume using FLAIR (Fig. 2A; Pearson’s correlation, R2=0.1769, P=0.0289). We did not observe any notable differences in the rate of change in FLAIR volume or rate of change in PET uptake between tumor subtypes using the WHO 2007 histological criteria (Fig. 2B; Kruskal-Wallis, FLAIR volume, P=0.7075, PET uptake, P=0.5226). Similarly, we did not observe any significant differences between IDH mutants and wild type gliomas (Fig. 2C; FLAIR, P=0.6262, PET, P=0.9623), patients with 1p19q co-deletion and those without co-deletion (Fig. 2D; FLAIR, P=0.4668, PET, P=0.9154), patients with MGMT methylated or unmethylated tumors (Fig. 2E; PET, P=0.6065, FLAIR, P=0.2441). There was also no difference in the rate of change in FLAIR volume between patients on active treatment compared with those who were off active treatment during the time of the MRI and PET scans (Fig. 2F; Mann-Whitney, P=0.9051); however, there was a slight, insignificant trend toward lower rate of change in PET uptake in patients who were on active treatment compared to those off treatment (Fig. 2F; Mann-Whitney, P=0.1546).
Fig. 2: Comparison of Rate of Change in FLAIR Volume and Maximum Normalized 18F-FDOPA PET Uptake (nSUVmax) in Histological and Molecular Subtypes of Low-Grade Gliomas (LGGs).
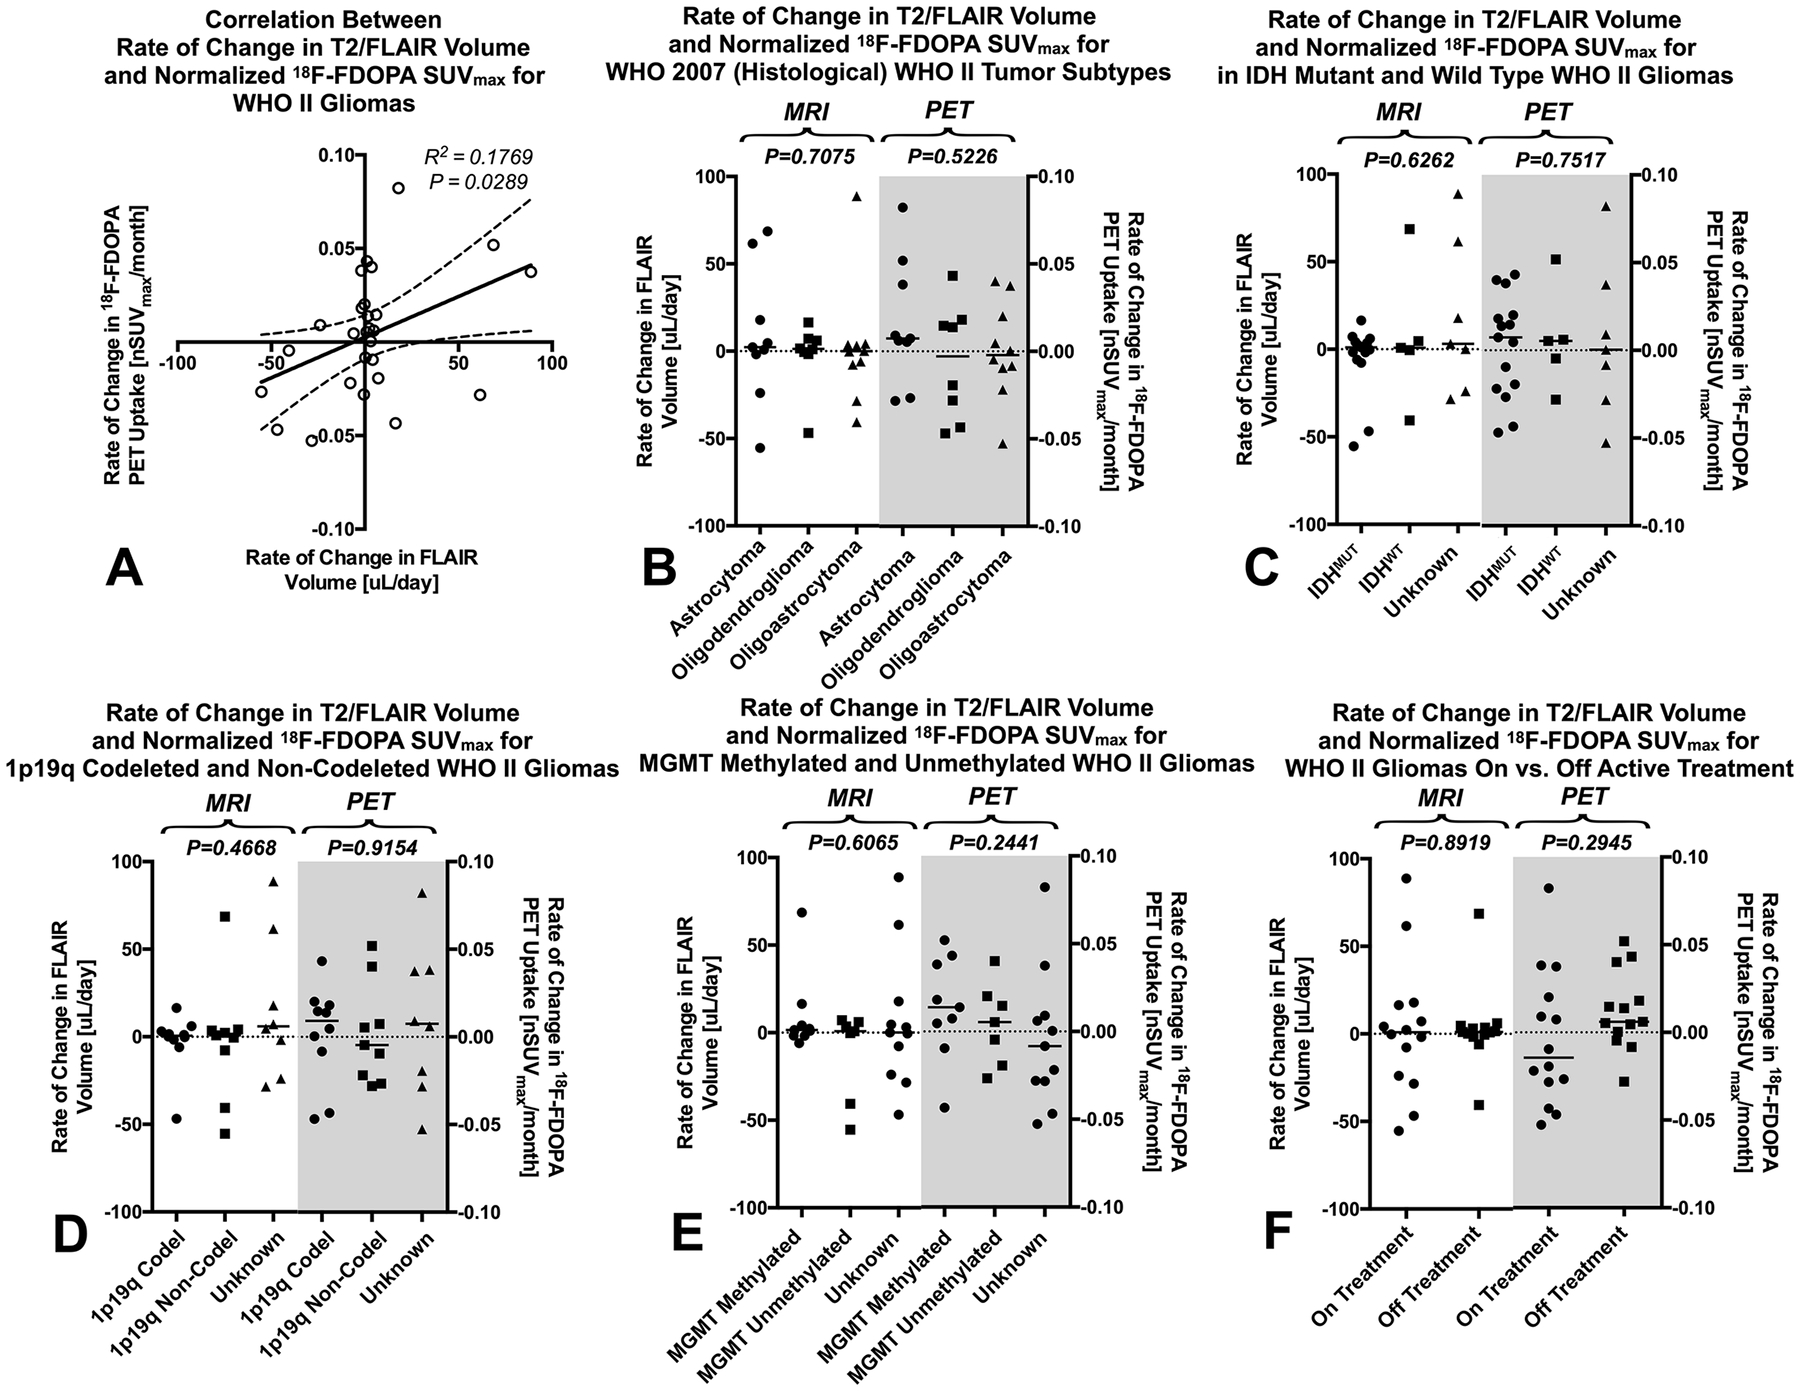
A) Correlation between rate of change in FLAIR volume and normalized maximum 18F-FDOPA PET uptake in WHO II low grade gliomas (R2=0.1769, P=0.0289). B) Rate of change in FLAIR volume and 18F-FDOPA nSUVmax for WHO 2007 (histological) tumor subtypes. C) Rate of change in FLAIR volume and 18F-FDOPA nSUVmax for isocitrate dehydrogenase (IDH)-1 mutant and wild type LGGs. D) Rate of change in FLAIR volume and 18F-FDOPA nSUVmax for 1p19q codeleted and non-codeleted LGGs. E) Rate of change in FLAIR volume and 18F-FDOPA nSUVmax for MGMT methylated and unmethylated LGGs. F) Rate of change in FLAIR volume and 18F-FDOPA nSUVmax for LGG patients on active treatment compared with those not on active treated during the PET and MRI examinations.
Predicting Malignant Transformation
Next, we tested whether the rate of change in FLAIR volume or rate of change in PET nSUVmax could be used to predict malignant transformation within 6 months of the 2nd MRI or PET examination. Results suggested no difference between the rate of change in FLAIR volume and PET uptake between transformers compared with those who did not transform within 6 months (Fig. 3A; Mann-Whitney, MRI, P=0.6141, PET, P=0.3473). Creation of a new metric from the linear combination of both the rate of change in FLAIR volume and the rate of change in PET uptake via a general linear model (GLM) of the form:
resulted in a trend toward detecting a difference between transformed and non-transformed LGGs (Fig. 3B; Mann-Whitney, P=0.1712). Expanding this model to include patient age and whether the patient was on active treatment during the MRI and PET exams resulted in a GLM of the form:
In the above linear model, “Age” is an integer in years and “On Tx” is a binomial with zero representing no treatment between serial PET scans and one for patients with treatment between scans. This model demonstrated a significant difference between transformed and non-transformed LGG patients (Fig. 3C; Mann-Whitney, P=0.0396). Receiver-operator characteristic curves (ROCs) for predicting malignant transformation of LGGs within 6 months of the 2nd PET or MRI exam (Fig. 3D) suggested that the rate of change in FLAIR volume (Fig. 3E; AUC=0.5611, P=0.5914) and rate of change in PET uptake (Fig. 3E; AUC=0.6111, P=0.3291) could not predict transformation. Similarly, a GLM using only the rate of change in FLAIR and PET uptake could not reliably predict transformation (Fig. 3E; AUC=6722, P=0.1304). However, a GLM using the rate of change in FLAIR volume and the rate of change in PET uptake combined with patient age and whether they were on active treatment could predict transformation (Fig. 3E; AUC=0.7556, P=0.0248) with approximately 87% sensitivity and 67% specificity using a risk threshold of 0.5907.
Fig. 3: Prediction of Malignant Transformation in LGGs Using Serial Changes in MR-PET Measurements.
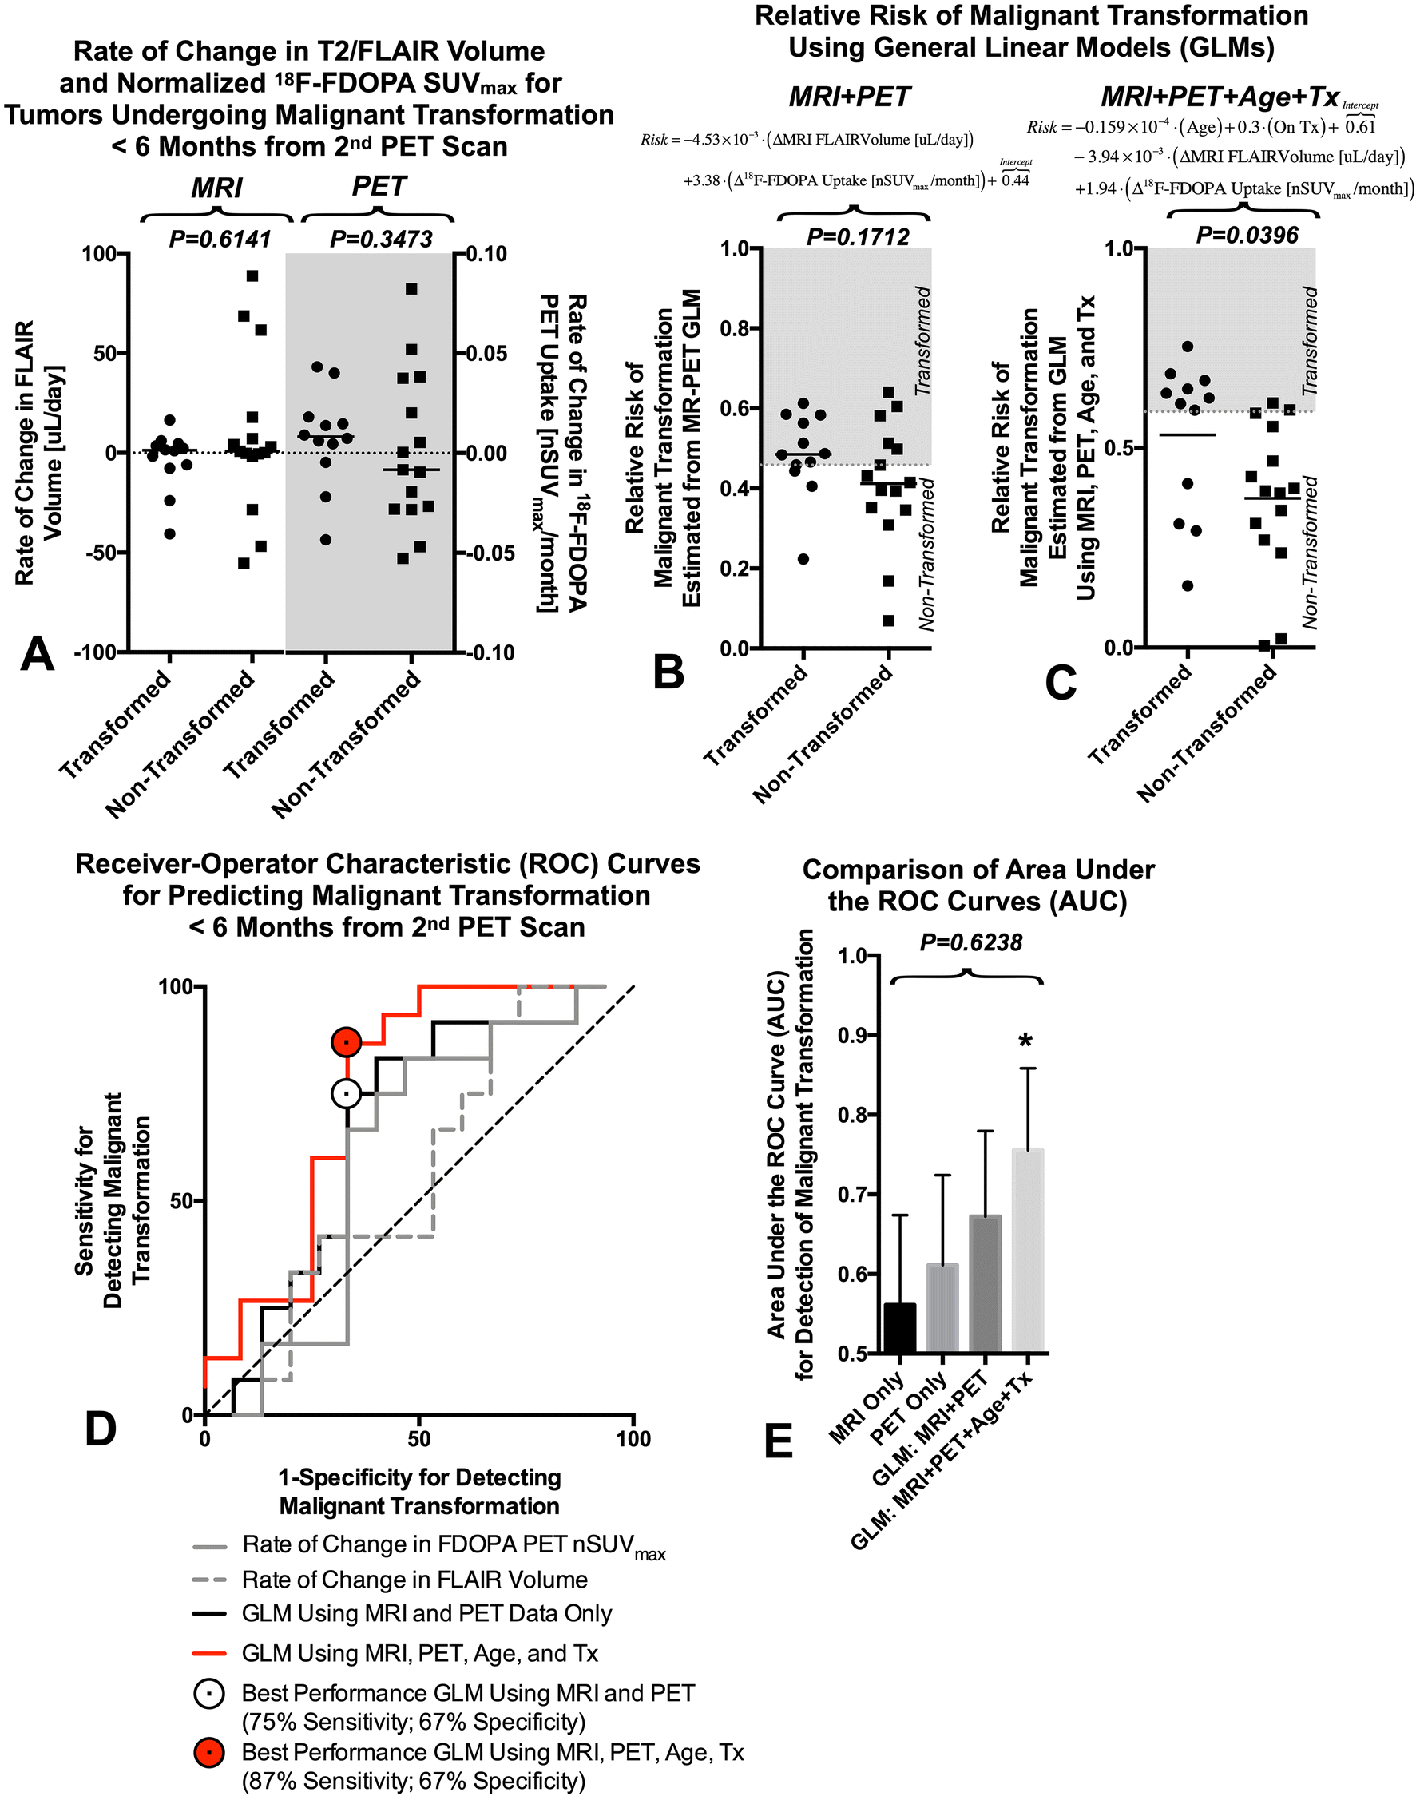
A) Rate of change in FLAIR volume and 18F-FDOPA nSUVmax for LGGs undergoing malignant transformation within 6 months of the last MR-PET scan. B) Relative risk of malignant transformation estimated using a general linear model (GLM) consisting of only the rate of change in FLAIR volume and the rate of change in maximum normalized 18F-FDOPA PET uptake. C) Relative risk of malignant transformation estimated using a GLM composed of patient age, whether they were on active treatment at the time of the MR-PET exams, the rate of change in FLAIR volume, and the rate of change in maximum normalized 18F-FDOPA PET uptake. D) Receiver-operator characteristic (ROC) curves for a) the rate of change in FLAIR volume, b) the rate of change in maximum normalized 18F-FDOPA PET uptake, c) the GLM using MRI and PET only, and d) the GLM using age, treatment, MRI, and PET. E) Comparison between area under the ROC curves (AUC) showing no significant difference between each technique (P=0.6238), although the GLM using both clinical and imaging characteristics demonstrated AUCs significantly higher than chance. * = P<0.05
Survival Analysis
Lastly, we performed Cox regression to estimate residual OS from the 2nd PET scan using clinical factors (age, on treatment between scans) and imaging predictor variables (rate of change in non-enhancing tumor volume and rate of change in PET nSUVmax), both individually (univariate) and in a combined (multivariable) model. Univariate analysis suggested both static measurements of continuous FLAIR volume at the 2nd time point (HR=1.0178,P=0.0212) and continuous normalized PET uptake at the 2nd time point (HR=2.4050,P=0.0270) were associated with OS. In patients with IDH status, MGMT methylation status, or 1p19q codeletion status available, no significant association was observed with OS (IDH, P=0.9986; MGMT, P=1.000; 1p19q, P=0.9990). Univariate analysis demonstrated a trend toward increased risk of death with increasing age (Table 2; Hazard Ratio (HR)=1.027, Confidence Interval (CI)=[0.9939, 1.0613], P=0.1107), a trend toward shorter OS with increasing rate of change FLAIR tumor volume (Table 2; HR=1.0111, CI=[0.9974, 1.0250], P=0.1142), and a significantly shorter OS in patients with increasing rate of change in PET nSUVmax (Table 2; HR=1.0212, CI=[1.0070, 1.0356], P=0.0034). No real association was observed between treatment status and OS (Table 2; HR=1.1013, CI=[0.5037, 2.4078], P=0.8090). When considering all four variables, Cox multivariable regression analysis suggested only the continuous measure of the time rate of change in PET nSUVmax was an independent predictor of OS in LGGs (Table 2; HR=1.0242, CI=[1.0080, 1.0407], P=0.0033).
Table 2. Cox Proportional-Hazards Model Analysis.
(Note: Continuous values of the rate of change in PET uptake were scaled by x1000 for regression)
| Overall Survival (Univariate) | Overall Survival (Multivariable) | |||
|---|---|---|---|---|
| Characteristic (unit) | P-Value | Hazard Ratio (95% C.I.) | P-Value | Hazard Ratio (95% C.I.) |
|
Age (Years) |
0.1107 | 1.0270 (0.9939 – 1.0613) | 0.1525 | 1.0246 (0.9910 – 1.0594) |
|
Treatment Status (On vs. Off) |
0.809 | 1.1013 (0.5037 – 2.4078) | 0.188 | 1.7590 (0.7588 – 4.0779) |
|
Rate of Change in FLAIR Volume (uL/day) |
0.1142 | 1.0111 (0.9974 – 1.0250) | 0.9304 | 1.0007 (0.9853 – 1.0163) |
|
Rate of Change in Normalized PET SUV (x1000 nSUVmax/month) |
0.0034** | 1.0212 (1.0070 – 1.0356) | 0.0033** | 1.0242 (1.0080 – 1.0407) |
P<0.01
Although continuous measures of the change in FLAIR volume was not a predictor of OS in LGGs, grouping patients into those with increasing versus decreasing FLAIR volume stratified patients into short and long-term residual OS (Fig. 4A; Log-rank, P=0.025, HR=2.220). Similarly, patients with an increasing PET uptake had worse residual OS (Fig. 4B; Log-rank P=0.0311, HR=2.148). Additionally, patients with increasing rate of both FLAIR volume and PET uptake had significantly shorter OS compared to patients with decreasing FLAIR volume or PET uptake (Fig. 4C; Log-rank, P=0.0135, HR=2.354), suggesting the combination of both change in FLAIR volume and PET uptake may be meaningful for identifying patients at highest risk.
Fig. 4:
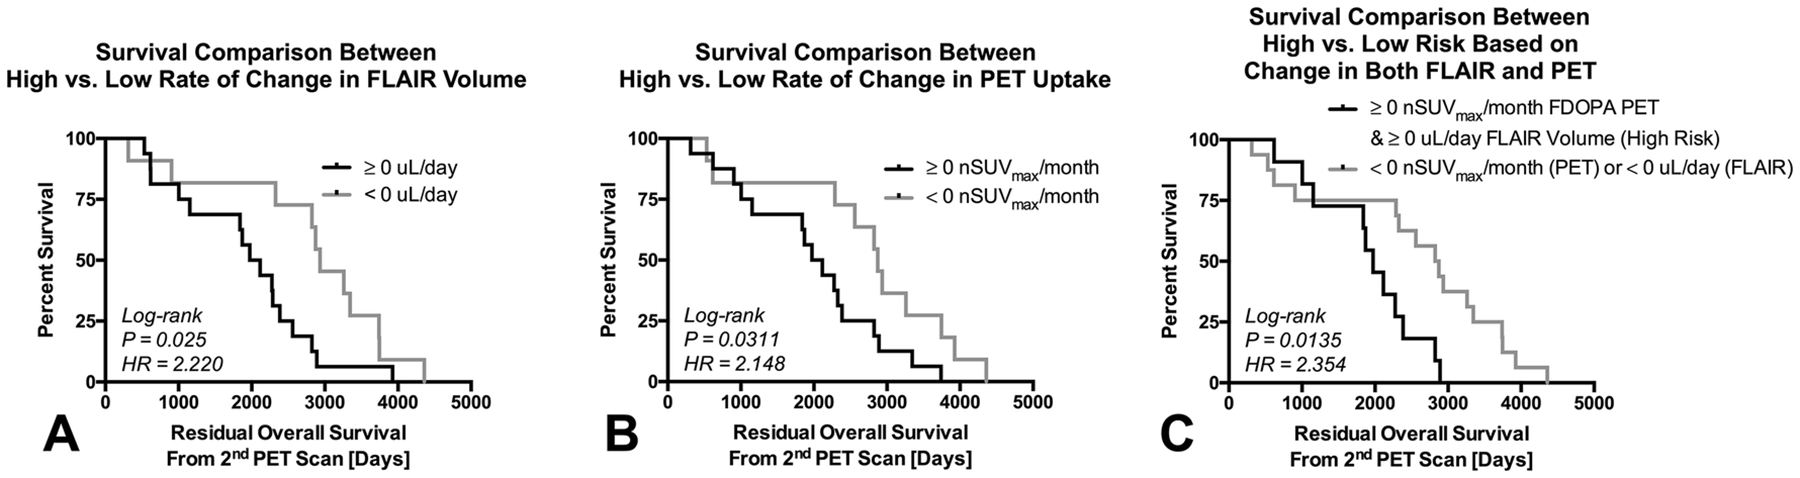
Kaplan-Meier plots showing significant differences in residual OS from the 2nd PET scan in patients with A) a positive or negative rate of change in FLAIR volume (HR=2.220, P=0.025); B) a positive or negative rate of change in PET uptake (HR=2.148, P=0.0311); and C) patients with a positive rate of change in both FLAIR volume and PET uptake compared to those with either a negative rate in FLAIR volume or PET uptake changes (HR=2.354, P=0.0135). Black = positive rate of change or high risk. Gray = negative rate of change or low risk.
DISCUSSION
18F-FDOPA PET imaging and MRI are routinely used in the clinic to monitor treatment response in patients with LGGs. However, most patients only receive a single PET and corresponding MRI scan when clinical questions arise. While 18F-FDOPA PET combined with MRI has been shown to improve diagnosis [22], identify the degree of malignancy, and differentiate pseudoprogression from true tumor growth [23–25], few studies have explored the value of serial PET and MRI scans in predicting response assessment or long-term outcome [34, 36, 37] and no studies to our knowledge have examined the use of both serial PET and MRI to predict malignant transformation or survival in LGGs.
Although the current study did not find any significant differences between histological or molecular subtypes of LGGs, results suggest a linear combination of imaging features with or without clinical factors may be beneficial for predicting malignant transformation and long-term survival. In particular, a simple linear combination containing age, treatment, the rate of change in T2 hyperintense lesion volume on FLAIR and rate of change in 18F-FDOPA PET nSUVmax were able to predict subsequent malignant transformation with >67% sensitivity and specificity. When controlling for clinical factors and tumor growth dynamics on MRI, the change in maximum tumor metabolism using PET appears significantly associated with survival. This suggests metabolic information may compliment traditional measures of tumor growth and may be important for understanding aspects of long-term disease control in LGGs.
Although we found an association between static measurements of FLAIR volume and PET uptake with survival in LGGs, the rate of change in PET uptake appeared to provide additional information in terms of predicting transformation and survival. This was not completely surprising, considering there was a correlation between nSUVmax on the second PET scan and change in 18F-FDOPA uptake (data not shown, P=0.0023, R2=0.3160); however, there were some patients with favorable outcome that had high PET uptake on the 2nd PET scan but exhibited decreasing PET uptake over time. For LGGs, serial 18F-FDOPA PET and MRI exams may provide a more accurate illustration of tumor progression and prediction of patient outcome.
The current study had a number of important limitations that should be addressed. First, the current study was a small, retrospective study involving only 27 patients over a period of more than 10 years. Because this was a retrospective study spanning a long period of time, there was a significant amount of missing clinical and molecular information on these limited number of patients. Therefore, the lack of significant findings between histological and molecular subtypes may be premature and may require further investigation. Also, patients did not have their PET and MRI scans at a specific controlled interval, but instead had PET scans based on clinical or radiographic (e.g. MRI) changes, which may have biased the results because these patients represent a subset of patients with specific interval changes requiring evaluation. Additionally, due to this being a retrospective study, we were unable to acquire multiple baseline PET scans to correct for noise and resulting intra-subject scan variations. A more systematic study in a large cohort of LGG patients with PET and MRI scans at controlled intervals, even when lacking clinical or radiographic changes, is warranted.
CONCLUSION
The rate of change in non-enhancing tumor volume on FLAIR combined with the rate of change in maximum normalized 18F-FDOPA PET uptake, with or without clinical information including age and treatment, may be useful for predicting the risk of malignant transformation and residual survival in patients with LGGs.
Funding:
This study was funded by grants from the American Cancer Society (ACS) Research Scholar Grant (RSG-15-003-01-CCE) (Ellingson); American Brain Tumor Association (ABTA) Research Collaborators Grant (ARC1700002)(Ellingson); National Brain Tumor Society (NBTS) Research Grant (Ellingson, Cloughesy); NIH/NCI UCLA Brain Tumor SPORE (1P50CA211015-01A1) (Ellingson, Lai, Cloughesy, Nghiemphu); NIH/NCI 1R21CA223757-01 (Ellingson)
Footnotes
Publisher's Disclaimer: This Author Accepted Manuscript is a PDF file of an unedited peer-reviewed manuscript that has been accepted for publication but has not been copyedited or corrected. The official version of record that is published in the journal is kept up to date and so may therefore differ from this version.
Conflicts of Interest:
Timothy F. Cloughesy reports advisory roles with Roche, Trizel, Medscape, Bayer, Amgen, Odonate Therapeutics, Pascal Biosciences, Bayer, Del Mar Pharmaceuticals, Tocagen, Karyopharm, GW Pharma, Kiyatec, Abbvie, Boehinger Ingelheim, VBI, Deciphera, VBL, Agios, Merck, Roche, Genocea, Celgene, Puma, Lilly, BMS, Cortice, Wellcome Trust, Novocure, Novogen, Boston Biomedical, Sunovion, Human Longevity, Insys, ProNai, Pfizer, Notable labs, Medqia. Stock options with Notable Labs. Member of the board for the 501c3 Global Coalition for Adaptive Research. U.S. Provisional Application No.: 62/819,322 Title: COMPOSITIONS AND METHODS FOR TREATING CANCER.
Benjamin M. Ellingson reports advisory and consulting roles with MedQIA, Roche, Agios, Siemens, Medicenna, Imaging Endpoints, Novogen, Northwest Biopharmaceuticals, Image Analysis Groupm Concoceutics, BeiGene, VBL, and Tocagen. Dr. Ellingson also has research grants with Siemens, Roche, and Janssen.
All other authors declare no conflicts of interest related to the subject matter in this publication.
Ethical Approval: All procedures performed in studies involving human participants were in accordance with the ethical standards of the institutional and/or national research committee and with the 1964 Helsinki declaration and its later amendments or comparable ethical standards. Written informed consent was obtained from all individual participants included in the study.
References
- 1.Whittle IR (2004) The dilemma of low grade glioma. J Neurol Neurosurg Psychiatry 75 Suppl 2: ii31–36 [DOI] [PMC free article] [PubMed] [Google Scholar]
- 2.Claus EB, Walsh KM, Wiencke JK, Molinaro AM, Wiemels JL, Schildkraut JM, Bondy ML, Berger M, Jenkins R, Wrensch M (2015) Survival and low-grade glioma: the emergence of genetic information. Neurosurg Focus 38: E6 doi: 10.3171/2014.10.FOCUS12367 [DOI] [PMC free article] [PubMed] [Google Scholar]
- 3.Shaw EG, Wang M, Coons SW, Brachman DG, Buckner JC, Stelzer KJ, Barger GR, Brown PD, Gilbert MR, Mehta MP (2012) Randomized trial of radiation therapy plus procarbazine, lomustine, and vincristine chemotherapy for supratentorial adult low-grade glioma: initial results of RTOG 9802. J Clin Oncol 30: 3065–3070 doi: 10.1200/JCO.2011.35.8598 [DOI] [PMC free article] [PubMed] [Google Scholar]
- 4.Buckner JC, Chakravarti A, Curran WJ Jr. (2016) Radiation plus Chemotherapy in Low-Grade Glioma. N Engl J Med 375: 490–491 doi: 10.1056/NEJMc1605897 [DOI] [PubMed] [Google Scholar]
- 5.Buckner JC, Shaw EG, Pugh SL, Chakravarti A, Gilbert MR, Barger GR, Coons S, Ricci P, Bullard D, Brown PD, Stelzer K, Brachman D, Suh JH, Schultz CJ, Bahary JP, Fisher BJ, Kim H, Murtha AD, Bell EH, Won M, Mehta MP, Curran WJ Jr. (2016) Radiation plus Procarbazine, CCNU, and Vincristine in Low-Grade Glioma. N Engl J Med 374: 1344–1355 doi: 10.1056/NEJMoa1500925 [DOI] [PMC free article] [PubMed] [Google Scholar]
- 6.Wessels PH, Weber WE, Raven G, Ramaekers FC, Hopman AH, Twijnstra A (2003) Supratentorial grade II astrocytoma: biological features and clinical course. Lancet Neurol 2: 395–403 [DOI] [PubMed] [Google Scholar]
- 7.Feigenberg SJ, Amdur RJ, Morris CG, Mendenhall WM, Marcus RB Jr., Friedman WA (2003) Oligodendroglioma: does deferring treatment compromise outcome? Am J Clin Oncol 26: e60–66 doi: 10.1097/01.COC.0000072507.25834.D6 [DOI] [PubMed] [Google Scholar]
- 8.Keles GE, Lamborn KR, Berger MS (2001) Low-grade hemispheric gliomas in adults: a critical review of extent of resection as a factor influencing outcome. J Neurosurg 95: 735–745 doi: 10.3171/jns.2001.95.5.0735 [DOI] [PubMed] [Google Scholar]
- 9.van den Bent MJ, Wefel JS, Schiff D, Taphoorn MJ, Jaeckle K, Junck L, Armstrong T, Choucair A, Waldman AD, Gorlia T, Chamberlain M, Baumert BG, Vogelbaum MA, Macdonald DR, Reardon DA, Wen PY, Chang SM, Jacobs AH (2011) Response assessment in neuro-oncology (a report of the RANO group): assessment of outcome in trials of diffuse low-grade gliomas. Lancet Oncol 12: 583–593 doi: 10.1016/S1470-2045(11)70057-2 [DOI] [PubMed] [Google Scholar]
- 10.Ullrich RT, Kracht L, Brunn A, Herholz K, Frommolt P, Miletic H, Deckert M, Heiss WD, Jacobs AH (2009) Methyl-L-11C-methionine PET as a diagnostic marker for malignant progression in patients with glioma. J Nucl Med 50: 1962–1968 doi: 10.2967/jnumed.109.065904 [DOI] [PubMed] [Google Scholar]
- 11.Singhal T, Narayanan TK, Jacobs MP, Bal C, Mantil JC (2012) 11C-methionine PET for grading and prognostication in gliomas: a comparison study with 18F-FDG PET and contrast enhancement on MRI. J Nucl Med 53: 1709–1715 doi: 10.2967/jnumed.111.102533 [DOI] [PubMed] [Google Scholar]
- 12.Nihashi T, Dahabreh IJ, Terasawa T (2013) Diagnostic accuracy of PET for recurrent glioma diagnosis: a meta-analysis. AJNR Am J Neuroradiol 34: 944–950, S941–911 doi: 10.3174/ajnr.A3324 [DOI] [PMC free article] [PubMed] [Google Scholar]
- 13.Chen W, Silverman DH, Delaloye S, Czernin J, Kamdar N, Pope W, Satyamurthy N, Schiepers C, Cloughesy T (2006) 18F-FDOPA PET imaging of brain tumors: comparison study with 18F-FDG PET and evaluation of diagnostic accuracy. J Nucl Med 47: 904–911 [PubMed] [Google Scholar]
- 14.Popperl G, Kreth FW, Mehrkens JH, Herms J, Seelos K, Koch W, Gildehaus FJ, Kretzschmar HA, Tonn JC, Tatsch K (2007) FET PET for the evaluation of untreated gliomas: correlation of FET uptake and uptake kinetics with tumour grading. Eur J Nucl Med Mol Imaging 34: 1933–1942 doi: 10.1007/s00259-007-0534-y [DOI] [PubMed] [Google Scholar]
- 15.Calcagni ML, Galli G, Giordano A, Taralli S, Anile C, Niesen A, Baum RP (2011) Dynamic O-(2-[18F]fluoroethyl)-L-tyrosine (F-18 FET) PET for glioma grading: assessment of individual probability of malignancy. Clin Nucl Med 36: 841–847 doi: 10.1097/RLU.0b013e3182291b40 [DOI] [PubMed] [Google Scholar]
- 16.Rapp M, Heinzel A, Galldiks N, Stoffels G, Felsberg J, Ewelt C, Sabel M, Steiger HJ, Reifenberger G, Beez T, Coenen HH, Floeth FW, Langen KJ (2013) Diagnostic performance of 18F-FET PET in newly diagnosed cerebral lesions suggestive of glioma. J Nucl Med 54: 229–235 doi: 10.2967/jnumed.112.109603 [DOI] [PubMed] [Google Scholar]
- 17.Dunet V, Rossier C, Buck A, Stupp R, Prior JO (2012) Performance of 18F-fluoro-ethyl-tyrosine (18F-FET) PET for the differential diagnosis of primary brain tumor: a systematic review and Metaanalysis. J Nucl Med 53: 207–214 doi: 10.2967/jnumed.111.096859 [DOI] [PubMed] [Google Scholar]
- 18.Grosu AL, Astner ST, Riedel E, Nieder C, Wiedenmann N, Heinemann F, Schwaiger M, Molls M, Wester HJ, Weber WA (2011) An interindividual comparison of O-(2-[18F]fluoroethyl)-L-tyrosine (FET)- and L-[methyl-11C]methionine (MET)-PET in patients with brain gliomas and metastases. Int J Radiat Oncol Biol Phys 81: 1049–1058 doi: 10.1016/j.ijrobp.2010.07.002 [DOI] [PubMed] [Google Scholar]
- 19.Weber WA, Wester HJ, Grosu AL, Herz M, Dzewas B, Feldmann HJ, Molls M, Stocklin G, Schwaiger M (2000) O-(2-[18F]fluoroethyl)-L-tyrosine and L-[methyl-11C]methionine uptake in brain tumours: initial results of a comparative study. Eur J Nucl Med 27: 542–549 doi: 10.1007/s002590050541 [DOI] [PubMed] [Google Scholar]
- 20.Tolosa E, Wenning G, Poewe W (2006) The diagnosis of Parkinson’s disease. Lancet Neurol 5: 75–86 doi: 10.1016/S1474-4422(05)70285-4 [DOI] [PubMed] [Google Scholar]
- 21.Brooks DJ (1991) Detection of preclinical Parkinson’s disease with PET. Neurology 41: 24–27; discussion 28 doi: 10.1212/wnl.41.5_suppl_2.24 [DOI] [PubMed] [Google Scholar]
- 22.Bund C, Heimburger C, Imperiale A, Lhermitte B, Chenard MP, Lefebvre F, Kremer S, Proust F, Namer IJ (2017) FDOPA PET-CT of Nonenhancing Brain Tumors. Clin Nucl Med 42: 250–257 doi: 10.1097/RLU.0000000000001540 [DOI] [PubMed] [Google Scholar]
- 23.Bell C, Dowson N, Puttick S, Gal Y, Thomas P, Fay M, Smith J, Rose S (2015) Increasing feasibility and utility of (18)F-FDOPA PET for the management of glioma. Nucl Med Biol 42: 788–795 doi: 10.1016/j.nucmedbio.2015.06.001 [DOI] [PubMed] [Google Scholar]
- 24.Fueger BJ, Czernin J, Cloughesy T, Silverman DH, Geist CL, Walter MA, Schiepers C, Nghiemphu P, Lai A, Phelps ME, Chen W (2010) Correlation of 6–18F-fluoro-L-dopa PET uptake with proliferation and tumor grade in newly diagnosed and recurrent gliomas. J Nucl Med 51: 1532–1538 doi: 10.2967/jnumed.110.078592 [DOI] [PubMed] [Google Scholar]
- 25.Villani V, Carapella CM, Chiaravalloti A, Terrenato I, Piludu F, Vidiri A, Schillaci O, Floris R, Marzi S, Fabi A, Pace A (2015) The Role of PET [18F]FDOPA in Evaluating Low-grade Glioma. Anticancer Res 35: 5117–5122 [PubMed] [Google Scholar]
- 26.Ellingson BM, Harris RJ, Woodworth DC, Leu K, Zaw O, Mason WP, Sahebjam S, Abrey LE, Aftab DT, Schwab GM, Hessel C, Lai A, Nghiemphu PL, Pope WB, Wen PY, Cloughesy TF (2017) Baseline pretreatment contrast enhancing tumor volume including central necrosis is a prognostic factor in recurrent glioblastoma: evidence from single and multicenter trials. Neuro Oncol 19: 89–98 doi: 10.1093/neuonc/now187 [DOI] [PMC free article] [PubMed] [Google Scholar]
- 27.Ellingson BM, Kim HJ, Woodworth DC, Pope WB, Cloughesy JN, Harris RJ, Lai A, Nghiemphu PL, Cloughesy TF (2014) Recurrent glioblastoma treated with bevacizumab: contrast-enhanced T1-weighted subtraction maps improve tumor delineation and aid prediction of survival in a multicenter clinical trial. Radiology 271: 200–210 doi: 10.1148/radiol.13131305 [DOI] [PMC free article] [PubMed] [Google Scholar]
- 28.Tran AN, Lai A, Li S, Pope WB, Teixeira S, Harris RJ, Woodworth DC, Nghiemphu PL, Cloughesy TF, Ellingson BM (2014) Increased sensitivity to radiochemotherapy in IDH1 mutant glioblastoma as demonstrated by serial quantitative MR volumetry. Neuro Oncol 16: 414–420 doi: 10.1093/neuonc/not198 [DOI] [PMC free article] [PubMed] [Google Scholar]
- 29.Namavari M, Bishop A, Satyamurthy N, Bida G, Barrio JR (1992) Regioselective radiofluorodestannylation with [18F]F2 and [18F]CH3COOF: a high yield synthesis of 6-[18F]Fluoro-L-dopa. Int J Rad Appl Instrum A 43: 989–996 [DOI] [PubMed] [Google Scholar]
- 30.Bishop A, Satyamurthy N, Bida G, Hendry G, Phelps M, Barrio JR (1996) Proton irradiation of [18O]O2: production of [18F]F2 and [18F]F2 + [18F] OF2. Nucl Med Biol 23: 189–199 [DOI] [PubMed] [Google Scholar]
- 31.Kinahan PE, Townsend DW, Beyer T, Sashin D (1998) Attenuation correction for a combined 3D PET/CT scanner. Med Phys 25: 2046–2053 doi: 10.1118/1.598392 [DOI] [PubMed] [Google Scholar]
- 32.Nuyts J, Michel C, Dupont P (2001) Maximum-likelihood expectation-maximization reconstruction of sinograms with arbitrary noise distribution using NEC-transformations. IEEE Trans Med Imaging 20: 365–375 doi: 10.1109/42.925290 [DOI] [PubMed] [Google Scholar]
- 33.Thie JA (2004) Understanding the standardized uptake value, its methods, and implications for usage. J Nucl Med 45: 1431–1434 [PubMed] [Google Scholar]
- 34.Harris RJ, Cloughesy TF, Pope WB, Nghiemphu PL, Lai A, Zaw T, Czernin J, Phelps ME, Chen W, Ellingson BM (2012) 18F-FDOPA and 18F-FLT positron emission tomography parametric response maps predict response in recurrent malignant gliomas treated with bevacizumab. Neuro Oncol 14: 1079–1089 doi: 10.1093/neuonc/nos141 [DOI] [PMC free article] [PubMed] [Google Scholar]
- 35.Patel CB, Fazzari E, Chakhoyan A, Yao J, Raymond C, Nguyen H, Manoukian J, Nguyen N, Pope W, Cloughesy TF, Nghiemphu PL, Czernin J, Lai A, Ellingson BM (2018) (18)F-FDOPA PET and MRI characteristics correlate with degree of malignancy and predict survival in treatment-naive gliomas: a cross-sectional study. J Neurooncol 139: 399–409 doi: 10.1007/s11060-018-2877-6 [DOI] [PMC free article] [PubMed] [Google Scholar]
- 36.Bruggers CS, Friedman HS, Fuller GN, Tien RD, Marks LB, Halperin EC, Hockenberger B, Oakes WJ, Hoffman JM (1993) Comparison of serial PET and MRI scans in a pediatric patient with a brainstem glioma. Med Pediatr Oncol 21: 301–306 doi: 10.1002/mpo.2950210414 [DOI] [PubMed] [Google Scholar]
- 37.Schwarzenberg J, Czernin J, Cloughesy TF, Ellingson BM, Pope WB, Geist C, Dahlbom M, Silverman DH, Satyamurthy N, Phelps ME, Chen W (2012) 3’-deoxy-3’−18F-fluorothymidine PET and MRI for early survival predictions in patients with recurrent malignant glioma treated with bevacizumab. J Nucl Med 53: 29–36 doi: 10.2967/jnumed.111.092387 [DOI] [PMC free article] [PubMed] [Google Scholar]