Abstract
Introduction
Nerve regeneration involves multiple processes which enhance blood supply that can be promoted by growth factors. Currently, tools are lacking to visualize the vascularization patterns in transplanted nerves in vivo. The purpose of this study was to describe three-dimensional visualization of the vascular system in the rat sciatic nerve and to quantify angiogenesis of nerve reconstruction.
Materials and Methods
In 12 Lewis rats (weighing 250 – 300 grams), 10 mm sciatic nerve gaps were repaired with ipsilateral reversed autologous nerve grafts. At 12- and 16 weeks of sacrifice, Microfil® contrast compound was injected in the aorta. Nerve autografts (N=12) and contralateral untreated nerves (N=12) were harvested and cleared while preserving the vasculature. The amount of vascularization was measured by quantifying the vascular surface area using conventional photography (two dimensional) and the vascular volume was calculated with micro-computed tomography (three dimensional). For each measurement, a vessel/nerve area ratio was calculated and expressed in percentages (vessel%).
Results
The vascular volume measured 3.53 ± 0.43% in autografts and 4.83 ± 0.45% vessels in controls at 12 weeks and 4.95 ± 0.44% and 6.19 ± 0.29% vessels at 16 weeks, respectively. The vascular surface area measured 25.04 ± 2.77 % in autografts and 26.87 ± 2.13% vessels in controls at 12 weeks, and 28.11 ± 3.47% and 33.71 ± 2.60% vessels at 16 weeks respectively. The correlation between both methods was statistically significant (P=0.049).
Conclusions
Both methods are considered to successfully reflect the degree of vascularization. Application of this technique could be used to visualize and objectively quantify angiogenesis of the transplanted nerve graft. Moreover, this simple method is easily reproducible and could be extrapolated to any other desired target organ ex vivo in small animals to investigate the vascular network.
Keywords: Angiogenesis, nerve regeneration, micro CT, conventional photography, vascular volume, vascular surface area
Introduction
It has been postulated that blood supply affects nerve regeneration (Weddell 1942, Best and Mackinnon 1994, Sondell, Lundborg et al. 1999, Hobson, Green et al. 2000, Mompeo, Engele et al. 2003, Skold, Svensson et al. 2011, Cattin, Burden et al. 2015), as it is reported that vascular endothelial cells directly guide the regeneration of peripheral nerve axons (Cattin, Burden et al. 2015). Angiogenesis can be enhanced through growth factors (Cui, Qiu et al. 2016), in particular angiopoietin-1 (Ang-1); an important angiogenic factor that promotes vascular stabilization (Brindle, Saharinen et al. 2006) and vascular endothelial growth factor (VEGF) which enhances intraneural angiogenesis (Hobson, Green et al. 2000). To quantify blood vessels in nerve grafts or conduits, previous studies have focused on immunohistochemical staining (Connolly, Heuvelman et al. 1989, Hu and Fan 1995, Norrby 1996). Unfortunately, the amount of (neo)angiogenesis was not evaluated in these studies.
Histomorphometric analyses are used to describe angiogenesis, but are limited in the ability to identify the three-dimensional interconnectivity of the vasculature in serial histological sections (Kline, Knudsen et al. 2014, Perrien, Saleh et al. 2016) and focuses on representing superficial blood flow (Zagorchev, Oses et al. 2010). Connectivity defines the maximal number of branches that may be cut without separating the structure (Zagorchev, Oses et al. 2010). Insight in the connectivity of the vascular tree may contribute to crucial description of neovascularization patterns. Therefore, two-dimensional measures of vasculature deliver incomplete information (Perrien, Saleh et al. 2016). Three-dimensional reconstruction of blood vessels in sciatic nerves of the rat has been technically difficult because the average diameter of the small endoneurial vessels in the rat is 8.8 μm (Bell and Weddell 1984).
Micro-computed tomography (micro CT) facilitates the visualization of contrast enhanced microvessels and could separate vessels from surrounding tissues, such as bone, fat tissue or nerve (Ghanavati, Yu et al. 2014). It provides three-dimensional volume imaging with spatial resolution at the micrometer scale and is applied in many fields, for instance in tumor visualization, cardiovascular plaque imaging (Zagorchev, Oses et al. 2010, Ghanavati, Yu et al. 2014) and evaluation of surgical angiogenesis in a bone allotransplantation models (Willems, Kremer et al. 2012, Willems, Kremer et al. 2014, Kotsougiani, Hundepool et al. 2019).
As technology continues evolving, modern micro CT systems are more commonly available and are capable of generating very small voxels with short scan acquisition times allowing both ex vivo and in vivo scanning (Zagorchev, Oses et al. 2010). Moreover, due to voxels as small as 1 μm, the vascular system in rat and even mice could now be visualized (Deshpande, Donneys et al. 2014, Kline, Knudsen et al. 2014, Lee, Barbe et al. 2014, Perrien, Saleh et al. 2016). As perfusion with a radiopaque contrast agent is the only requirement to delineate the vascular tree, a closer-meshed network of smaller vessels, contrast enhanced micro CT can become a powerful tool in quantifying angiogenesis (Perrien, Saleh et al. 2016).
Information collected from conventional photography may complement the micro CT. Photographs could be analyzed by measuring the ratio of vessel area and total nerve area digitally (Giusti, Lee et al. 2014). More conventional methods such as manual vessel counts per sub-segment of the nerve, providing a vessel density per mm2, have also been described (Wongtrakul, Friedrich et al. 2002). These techniques have never been verified and are questionably representative for the entire quantification of the nerve vasculature when used solely. However, with evolving technology, the quality of conventional photography has improved and there are numerous photo editing software available providing a cost-effective way to measure vessel and nerve surface areas.
The purpose of this study was to describe three-dimensional visualization of the vascular system in the rat sciatic nerve and to quantify angiogenesis of nerve reconstruction. The micro CT and conventional photography were used to objectively quantify vascular volume and vascular surface area, respectively, as measurements of angiogenesis in rat nerve.
Materials and Methods
Animal experiments were approved by our Institutional Animal Care and Use Committee (IACUC A3348–18). For this study, male Lewis rats (Envigo, USA) were used, weighing between 250 – 300 grams. All animals were housed with ad libitum access to food and water, with a 12-hour light-dark cycle after surgery.
Experimental design
In 12 Lewis rats, unilateral 10 mm sciatic nerve gaps were repaired with ipsilateral reversed autologous nerve grafts to create a mismatch in the alignment of the nerve fibers (Kumta, Yip et al. 1996, Hudson, Zawko et al. 2004). This group was considered the gold standard for nerve repair. Rats survived for either 12- or 16 weeks. At the time of the sacrifice, autograft nerves (N=6 per time point) and the contralateral nerve samples as untreated, control samples (N=6 per time point) were harvested. The nerve vasculature was preserved to obtain the vascular volume and vascular surface area measurements.
Surgical procedure
After anesthesia in an isoflurane chamber, rats were shaved, prepped and positioned in the nosecone to maintain anesthesia throughout the procedure. Preoperatively the following were administrated subcutaneously; infection prophylaxis provided by Enrofloxacin (Baytril, Bayer, Germany, 10mg/kg), 5 ml of NaCl 0.9% solution to prevent dehydration and Buprenorphine SR (Buprenorphine SR-LAB, ZooPharm pharmacy, 0.6mg/kg) for pain control. During surgery, body temperature was maintained at 37°C with a heating pad.
The sciatic nerve was fully exposed proximally from the inferior margin of the piriformis muscle to approximately 5 mm distal to the bifurcation, under an operating microscope (Zeiss OpMi 6, Carl Zeiss Surgica, Oberkochen, Germany). A 10 mm segment of the sciatic nerve was excised by sharp transection with microsurgical scissors. The nerve graft was reversed and reconstructed with six 10–0 nylon (Ethilon, Ethicon Inc., Sommerville, NJ, USA), epineural interrupted sutures on either side of the anastomosis. Wounds were closed in layers, approximating muscle with two 5–0 absorbable interrupted sutures (5–0 Vicryl Rapide, Ethicon Inc., Sommerville, NJ, USA). The skin was closed subcutaneously, using the same suture. Postoperatively, the rats were kept warm with towels. The rats were observed weekly until completion of the experiment.
Perfusion of contrast
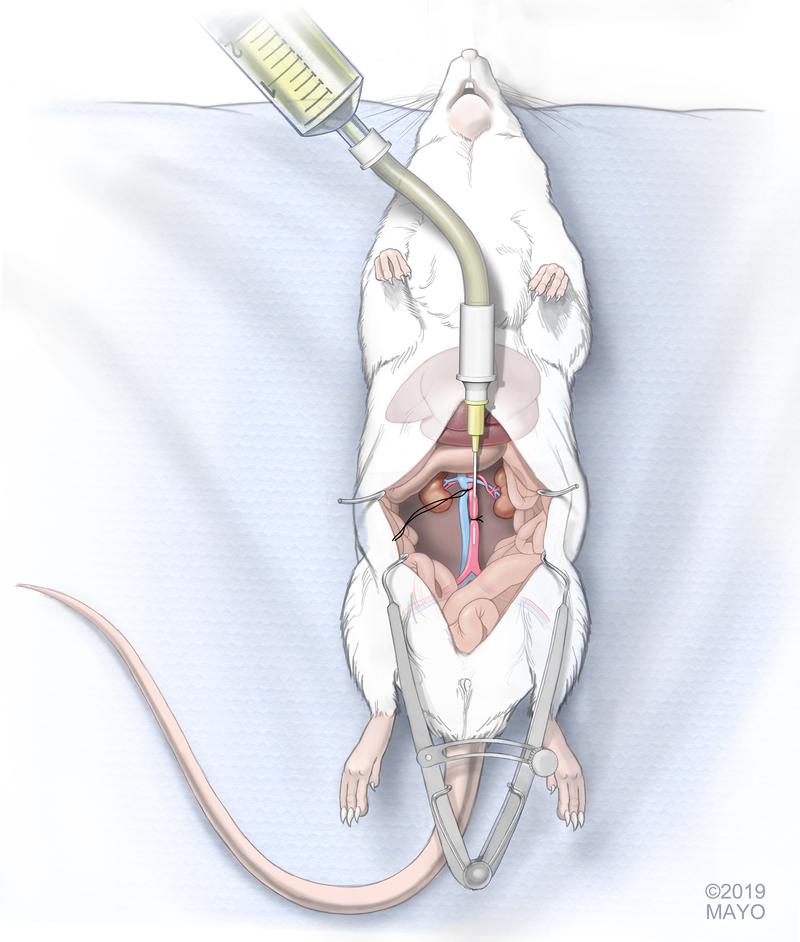
Twelve and 16 weeks postoperatively, rats were sacrificed. Access for aortic infusion catheter placement was achieved via the abdomen. A large midline incision was made in the abdomen to expose the aorta and vena cava. A small retractor was used to retract the digestive organs providing stable exposure of the aorta and vena cava throughout the experiment. The fat surrounding the thoracic aorta and vena cava was cleaned using cotton tip applicators taking care not to harm the vascular structures. The thoracic aorta and vena cava were ligated proximally with a 5–0 Vicryl suture (5–0 Vicryl Rapide, Ethicon Inc., Sommerville, NJ, USA) which was kept long to act as grip sutures. The ligation was placed as proximal as possible and distal to any large hepatic bifurcations, depending on the anatomic variation. The aorta was dissected from the vena cava distally using cotton tip applicators. This was performed approximately 1 cm proximal to the iliac bifurcation. A loose 5–0 Vicryl suture was placed under the aorta. To facilitate the passage of contrast, a 24 Gauge catheter (Jelco IV Catheter Radiopaque, Smiths Medical International, UK) connected to an IV tubing system, was introduced in the aorta just distally to the proximally placed grip sutures, while keeping the aorta on tension by slightly pulling the grip sutures (Figure 1). After the catheter was fixated with the previously placed suture around the aorta distally, 2–3 ml of saline (NaCl 0.9%) was infused through the tubing system to evaluate the patency of the aorta. The needle was removed off the cannula, while maintaining the cannula in the artery. Care was taken that the tip of the cannula would still be proximal to the iliac bifurcation, so that the contrast would reach both limbs. A yellow-colored (MV-122) Microfil® compound (MV 8ml, diluent 15 ml, and curing agent 1.2 ml, Flow Tech, Inc., Carver, MA, USA) in a 50 cc syringe was connected to the tubing system to be infused in the aorta. While putting pressure on the insertion site using gauze, the perfusion was performed with constant perfusion of approximately 100 mmHg. The perfusion was continued until the syringe was empty and yellow nailbeds on either paw were observed. After the perfusion was completed, a clamp was placed on the cannula to prevent leakage of the infused contrast. The rat was kept at room temperature while the agents cured for at least 90 minutes.
Figure 1. Schematic drawing of the insertion of the catheter into the rat aorta.
Long sutures indicated the grip sutures that ligated the thoracic aorta and vena cava proximally. Short cut suture served to hold catheter in place while injecting the Microfil® contrast compound into both common iliac arteries of the rat. (with permission of the Mayo Foundation, Copyright Mayo Foundation 2019)
Sample collection
After the vascular bed was perfused successfully and the contrast had cured, the sciatic nerve was exposed and harvested extending to approximately 3 mm on either side of the anastomoses. Nerve samples were collected in phosphate buffered saline (PBS) and cleared for five days by immersion in graded series of ethyl alcohol as follows: the samples were first placed in 25% ethyl alcohol and at successive 24–48 hour intervals the concentration was raised to 50%, 75%, 95% and 100%. As the final step, the samples were immersed in methyl salicylate. If tissue had not cleared, a second clearing starting from 95% ethyl alcohol stage was performed to repeat the final steps of the clearing procedure. This procedure allowed clearing of all structures, with exception of the opacified microvascular structures that were filled with contrast.
Micro CT for calculating the vascular volume
After clearing had taken place, the samples were scanned in a SkyScan 1276 micro CT (Bruker Corporation, Billerica, MA, USA) at 40 kV voltage, 200 μA current and 10 μm resolution to calculate vascular volume. Three samples were scanned at a time, taking approximately 26 minutes per scan with frame averaging set at three in order to reduce noise. Three-dimensional images of the samples were reconstructed using Hierarchical InstaRecon software (NRecon, 1.7.4.2., InstaRecon, 2.0.4.0. InstaRecon). This software was used to adjust the following parameters while reconstructing the images; Beam Hardening Correction (%) was set at 51, Ring Artifact Correction at 9, Smoothing at 1, Post alignment compensation and Histogram windows were manually adjusted for each scan. After obtaining reconstruction of the images, AnalyzePro software (AnalyzeDirect, Inc., Overland Park, KS, USA) was used to measure the volume of the vasculature and the volume of the total nerve. A vessel/nerve area ratio was calculated and expressed in percentages (vessel%).
Photography for calculating the vascular surface area
After micro CT scanning was completed, the nerve samples were stretched by suturing both nerve ends onto a solid holder. Detailed pictures of the samples were obtained using a Canon 5D Mark IV camera, (Manual Mode, ISO 200, 1/200th of a sec, f/16), a Canon MP-E 65mm Macro lens and a Canon MT-26-RT Twin Lite Macro strobe light source. During photography, samples were placed in a petri dish with methyl salicylate in order to obtain clean photographs allowing for the specimen to be separated from the background for better measurement. The petri dish was placed on a black background to achieve maximum contrast with the yellow vessels in the nerve samples. Polarized light was used to reduce reflections and a 1:1 magnification was used to ensure consistency of the pictures. To correct for the surface area that altered depending on the angle of the image, two pictures of each nerve sample were obtained; one of the front whereafter the holder was flipped and the picture of the other side was obtained. With NIS-Elements software (NIS-Elements BR 4.51.01), the total vessel area and the total nerve area in the graft were measured in a blinded fashion. For each image, a vessel/nerve area ratio was calculated and expressed in percentages. The ratios of the two images (front and back) were averaged per sample.
Statistical analysis
The vascular volume and the vascular surface area were analyzed and compared to the untreated side (control). A nonpaired student t-test for comparisons between groups was used for statistical investigation. Correlations were analyzed using Pearson’s correlation test. Results were reported as the mean and standard error or the mean (SEM), and the level of significance was set at α ≤ 0.05.
Results
Macroscopic appearance of the vessels in nerve samples
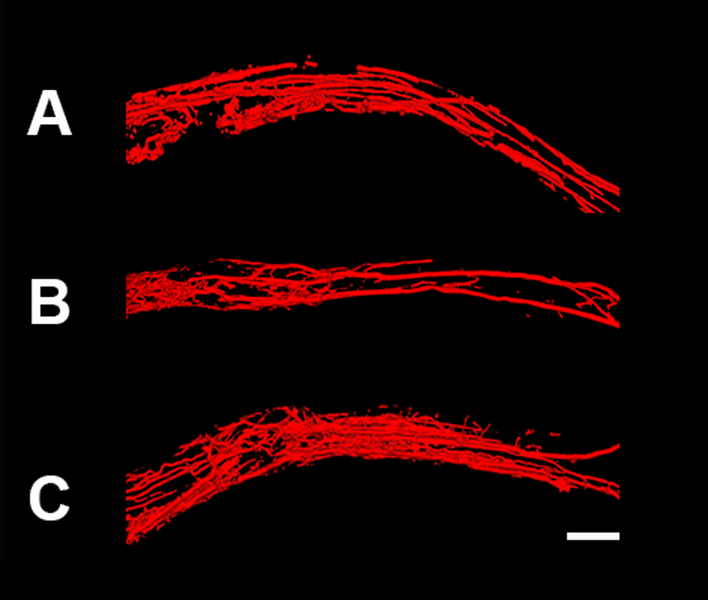
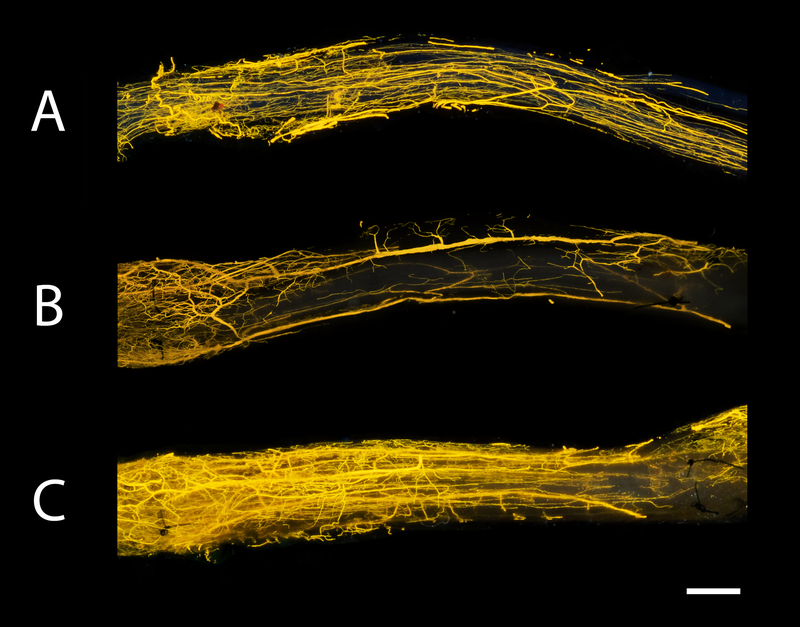
After the clearing process, the nerve samples were transparent and vessels were filled with Microfil®. For 3D imaging, the micro CT was used and allowed visualization of the vessels in space (Figure 2). The size and position of the vessels were visualized. Figure 3 shows the macroscopic images of the nerve autografts at 12- and 16 weeks and a control sample at 12 weeks obtained with a conventional digital camera. Sutures are clearly visible and were used to set the borders of the analysis frame. As demonstrated, the microvasculature was clearly visualized. The smallest diameter of blood vessels detected was 9.3 μm using micro CT and 7.4 μm using conventional photography.
Figure 2. Micro computed tomography (micro CT) images of nerve samples.
Images of control nerve at 12 weeks (A), nerve autograft at 12 weeks (B) and nerve autograft at 16 weeks (C). Nerve samples were positioned from proximal to distal (left to right, respectively). Scale bar is set a 1 millimeters (mm).
Figure 3. Macroscopic images of nerve samples obtained with conventional digital photography.
Photographs of the same samples visualized in Figure 2. Microvessels could be clearly seen in the control nerve at 12 weeks (A), nerve autograft at 12 weeks (B) and nerve autograft at 16 weeks (C). Sutures used to repair the graft were visible in nerve autograft groups (B+C) and depicted the border of the frame of analysis. Nerve samples were positioned from proximal to distal (left to right, respectively). Scale bar is set at 1 millimeters (mm).
Vascular volume measured with micro CT
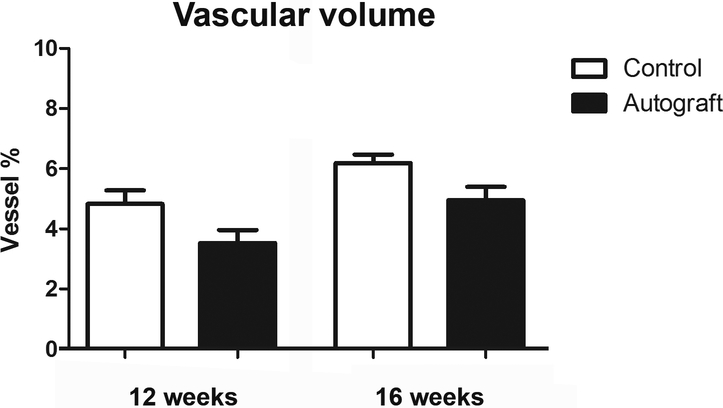
The vascular volume was successfully measured using the micro CT. At 12 weeks, autograft nerves measured 3.53 ± 0.43% and control nerve samples measured 4.83 ± 0.45% vessels. At 16 weeks, this was 4.95 ± 0.44% and 6.19 ± 0.29% vessels for autografts and controls, respectively. These outcomes are depicted in Figure 4.
Figure 4. Vascular volume of control and nerve autograft samples at 12 and 16 weeks using micro CT.
Results were expressed as a percentage (vessel %) of the total nerve area and were given as the mean±SEM.
Vascular surface area measured with conventional photography
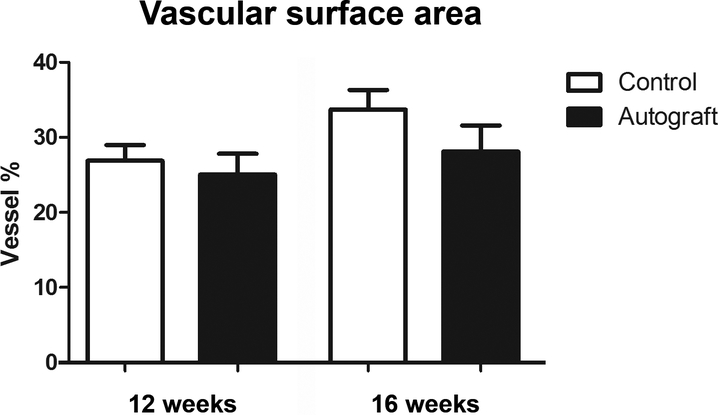
After 12 weeks, the vascular surface area was 25.04 ± 2.77% and 26.87 ± 2.13% vessels for autografts and control nerves, respectively. At 16 weeks, photography measured 28.11 ± 3.47% vessels for autografts and 33.71 ± 2.60% vessels for controls (Figure 5).
Figure 5. Vascular surface area of control and nerve autograft samples at 12 and 16 weeks using digital photography.
Results were expressed as a percentage (vessel %) of the total nerve area and were given as the mean±SEM.
Correlations
The vascular volume and vascular surface area were significantly correlated with both time points and groups (r=0.951, p=0.049).
Discussion
In this study, the authors successfully measured the vasculature of the sciatic nerve in rats to provide more insight in the amount of angiogenesis and the patterns of neoangiogenesis occurring in nerve regeneration. The limited options available to visualize the small vessels of the rat had previously impeded the understanding of the underlying neoangiogenesis patterns after nerve graft reconstruction.
The utility of the methods described in the current study is two-fold. First, it provides an objective quantification of the amount of angiogenesis, independently from the size of the vessels, in relation to the size of the nerve. Second, it eminently demonstrates the patterns of angiogenesis in (transplanted) nerves. Nerve revascularization is postulated to be composed of angiogenesis and neoangiogenesis; vessels that sprout into the existing vascular tree and vessels that create new pathways (Best, Mackinnon et al. 1999). However, this theory has yet to be objectively described. Angiogenesis is the growth of blood vessels from existing vasculature. Angiogenesis occurs throughout development and forms transvascular tissue pillars that expand with overall growth resulting in the increase in vascularity over time (Adair and Montani 2010). This process could also be seen in our study, when comparing time points. The vascularization of nerves and in particular, the alignment of vessels in nerves is attributed to a directional role for regenerating axons (Cutting and McCarthy 1983, Parrinello, Napoli et al. 2010). Applying the described techniques at several time points after nerve graft implementation may provide insight to the ratio between revascularization components. These techniques may demonstrate the relationship between vessel alignment and the level of nerve regeneration. Thus, allowing us to improve our understanding of the process and the importance of vascular development in nerve grafts.
As blood vessels provide little inherent contrast, viscosity is one of the most important properties of the implemented vehicle (Zagorchev, Oses et al. 2010). With viscosity levels around 20–30, Microfil® is the best available compound that injects both the arterial and venous system and reaches even the smallest angiogenic vessels to allow complete study of the vascular network (Zagorchev, Oses et al. 2010). The injected Microfil® does not directly interact with the histology but could influence the proportion of axon and nerve areas during the analysis. Therefore, we would suggest harvesting other tissue prior to Microfil® injection to secure reliable histologic analysis.
There are a few considerations associated with these techniques. Although micro CT systems become more commonly available with improving quality (15), costs could add up and it is still conceivable that micro CT devices with small effective voxel size are not available for all researchers. In this case, solely the described conventional photography strategy could be used, as it is cost-effective, simple to perform and correlates with micro volume measurements. However, the limitation of conventional photography is that it does not describe vascularization in space and lacks detailed information. As only two sides of the nerve sample are measured and the surface area could not be corrected for the thickness of the nerve (i.e. depth of the obtained photo), representation of the amount of angiogenesis using vascular surface area may be questionable. The difference between various groups of nerve samples, however, could be described with conventional photography. The use of Microfil® to fill the complete vascular bed including the smallest arterial and venous branches allows visualization of the desired vascular system but limits any other histological examination in the same samples, as processing is different. The micro CT has the advantage of precisely measuring vessel volume in relation to total measured nerve volume. Also, clearing of samples is not necessary as the lead pigments in Microfil® provide high contrast compared to background tissue to acquire complete high resolution 3D images of the vessels (Ghanavati, Yu et al. 2014).
Our results indicate the significant correlation between the vascular volume and the vascular surface area measurements demonstrating that the methods could be used either complementary or separately, depending on the goals of the study. These methods will allow us to advance angiogenesis related research by improving the tools for studying and understanding vascular development and the mechanisms of neoangiogenesis.
Conclusion
This study provides accurate objective analysis of the newly formed vascular network of the sciatic nerve. The use of the micro CT and conventional photography provides many modalities for vascular exploration, allowing the exploration of the structure and organization of blood vessels. These imaging methods are easily reproducible and could be extrapolated to any other desired target organ ex vivo in small animals to investigate the vascular network.
Supplementary Material
Acknowledgments
The authors would like to thank Jim Postier (Rochester, MN) for the artwork of Figure 1. This work was supported in part by the Mayo Clinic X-ray Imaging Core.
“Research reported in this publication was supported by the National Institute of Neurological Disorders and Stroke of the National Institutes of Health under Award Number R01NS102360. The content is solely the responsibility of the authors and does not necessarily represent the official views of the National Institutes of Health”
Grant sponsor NIH; Grant number R01NS102360
Footnotes
Disclosure Statement
No competing financial interests exist.
References
- Adair TH and Montani JP (2010). Angiogenesis Angiogenesis. San Rafael (CA). [Google Scholar]
- Bell MA and Weddell AG (1984). “A descriptive study of the blood vessels of the sciatic nerve in the rat, man and other mammals.” Brain 107 (Pt 3): 871–898. [DOI] [PubMed] [Google Scholar]
- Best TJ and Mackinnon SE (1994). “Peripheral nerve revascularization: a current literature review.” J Reconstr Microsurg 10(3): 193–204. [DOI] [PubMed] [Google Scholar]
- Best TJ, Mackinnon SE, Midha R, Hunter DA and Evans PJ (1999). “Revascularization of peripheral nerve autografts and allografts.” Plast Reconstr Surg 104(1): 152–160. [PubMed] [Google Scholar]
- Brindle NP, Saharinen P and Alitalo K (2006). “Signaling and functions of angiopoietin-1 in vascular protection.” Circ Res 98(8): 1014–1023. [DOI] [PMC free article] [PubMed] [Google Scholar]
- Cattin AL, Burden JJ, Van Emmenis L, Mackenzie FE, Hoving JJ, Garcia Calavia N, Guo Y, McLaughlin M, Rosenberg LH, Quereda V, Jamecna D, Napoli I, Parrinello S, Enver T, Ruhrberg C and Lloyd AC (2015). “Macrophage-Induced Blood Vessels Guide Schwann Cell-Mediated Regeneration of Peripheral Nerves.” Cell 162(5): 1127–1139. [DOI] [PMC free article] [PubMed] [Google Scholar]
- Connolly DT, Heuvelman DM, Nelson R, Olander JV, Eppley BL, Delfino JJ, Siegel NR, Leimgruber RM and Feder J (1989). “Tumor vascular permeability factor stimulates endothelial cell growth and angiogenesis.” J Clin Invest 84(5): 1470–1478. [DOI] [PMC free article] [PubMed] [Google Scholar]
- Cui WL, Qiu LH, Lian JY, Li JC, Hu J and Liu XL (2016). “Cartilage oligomeric matrix protein enhances the vascularization of acellular nerves.” Neural Regen Res 11(3): 512–518. [DOI] [PMC free article] [PubMed] [Google Scholar]
- Cutting CB and McCarthy JG (1983). “Comparison of residual osseous mass between vascularized and nonvascularized onlay bone transfers.” Plastic & Reconstructive Surgery 72(5): 672–675. [DOI] [PubMed] [Google Scholar]
- Deshpande SS, Donneys A, Farberg AS, Tchanque-Fossuo CN, Felice PA and Buchman SR (2014). “Quantification and characterization of radiation-induced changes to mandibular vascularity using micro-computed tomography.” Ann Plast Surg 72(1): 100–103. [DOI] [PMC free article] [PubMed] [Google Scholar]
- Ghanavati S, Yu LX, Lerch JP and Sled JG (2014). “A perfusion procedure for imaging of the mouse cerebral vasculature by X-ray micro-CT.” J Neurosci Methods 221: 70–77. [DOI] [PubMed] [Google Scholar]
- Giusti G, Lee JY, Kremer T, Friedrich P, Bishop AT and Shin AY (2014). “The influence of vascularization of transplanted processed allograft nerve on return of motor function in rats.” Microsurgery. [DOI] [PubMed] [Google Scholar]
- Hobson MI, Green CJ and Terenghi G (2000). “VEGF enhances intraneural angiogenesis and improves nerve regeneration after axotomy.” J Anat 197 Pt 4: 591–605. [DOI] [PMC free article] [PubMed] [Google Scholar]
- Hu DE and Fan TP (1995). “Suppression of VEGF-induced angiogenesis by the protein tyrosine kinase inhibitor, lavendustin A.” Br J Pharmacol 114(2): 262–268. [DOI] [PMC free article] [PubMed] [Google Scholar]
- Hudson TW, Zawko S, Deister C, Lundy S, Hu CY, Lee K and Schmidt CE (2004). “Optimized acellular nerve graft is immunologically tolerated and supports regeneration.” Tissue Eng 10(11–12): 1641–1651. [DOI] [PubMed] [Google Scholar]
- Kline TL, Knudsen BE, Anderson JL, Vercnocke AJ, Jorgensen SM and Ritman EL (2014). “Anatomy of hepatic arteriolo-portal venular shunts evaluated by 3D micro-CT imaging.” J Anat 224(6): 724–731. [DOI] [PMC free article] [PubMed] [Google Scholar]
- Kotsougiani D, Hundepool CA, Bulstra LF, Friedrich PF, Shin AY and Bishop AT (2019). “Bone vascularized composite allotransplantation model in swine tibial defect: Evaluation of surgical angiogenesis and transplant viability.” Microsurgery 39(2): 160–166. [DOI] [PubMed] [Google Scholar]
- Kumta S, Yip K, Roy N, Lee SK and Leung PC (1996). “Revascularisation of bone allografts following vascular bundle implantation: an experimental study in rats.” Arch Orthop Trauma Surg 115(3–4): 206–210. [DOI] [PubMed] [Google Scholar]
- Lee S, Barbe MF, Scalia R and Goldfinger LE (2014). “Three-dimensional reconstruction of neovasculature in solid tumors and basement membrane matrix using ex vivo X-ray microcomputed tomography.” Microcirculation 21(2): 159–170. [DOI] [PMC free article] [PubMed] [Google Scholar]
- Mompeo B, Engele J and Spanel-Borowski K (2003). “Endothelial cell influence on dorsal root ganglion cell formation.” J Neurocytol 32(2): 123–129. [DOI] [PubMed] [Google Scholar]
- Norrby K (1996). “Vascular endothelial growth factor and de novo mammalian angiogenesis.” Microvasc Res 51(2): 153–163. [DOI] [PubMed] [Google Scholar]
- Parrinello S, Napoli I, Ribeiro S, Wingfield Digby P, Fedorova M, Parkinson DB, Doddrell RD, Nakayama M, Adams RH and Lloyd AC (2010). “EphB signaling directs peripheral nerve regeneration through Sox2-dependent Schwann cell sorting.” Cell 143(1): 145–155. [DOI] [PMC free article] [PubMed] [Google Scholar]
- Perrien DS, Saleh MA, Takahashi K, Madhur MS, Harrison DG, Harris RC and Takahashi T (2016). “Novel methods for microCT-based analyses of vasculature in the renal cortex reveal a loss of perfusable arterioles and glomeruli in eNOS−/− mice.” BMC Nephrol 17: 24. [DOI] [PMC free article] [PubMed] [Google Scholar]
- Skold MK, Svensson M, Tsao J, Hultgren T, Landegren T, Carlstedt T and Cullheim S (2011). “Karolinska institutet 200-year anniversary. Symposium on traumatic injuries in the nervous system: injuries to the spinal cord and peripheral nervous system - injuries and repair, pain problems, lesions to brachial plexus.” Front Neurol 2: 29. [DOI] [PMC free article] [PubMed] [Google Scholar]
- Sondell M, Lundborg G and Kanje M (1999). “Vascular endothelial growth factor has neurotrophic activity and stimulates axonal outgrowth, enhancing cell survival and Schwann cell proliferation in the peripheral nervous system.” J Neurosci 19(14): 5731–5740. [DOI] [PMC free article] [PubMed] [Google Scholar]
- Weddell G (1942). “Axonal regeneration in cutaneous nerve plexuses.” J Anat 77(Pt 1): 49–62 43. [DOI] [PMC free article] [PubMed] [Google Scholar]
- Willems WF, Kremer T, Friedrich P and Bishop AT (2012). “Surgical revascularization induces angiogenesis in orthotopic bone allograft.” Clin Orthop Relat Res 470(9): 2496–2502. [DOI] [PMC free article] [PubMed] [Google Scholar]
- Willems WF, Kremer T, Friedrich P and Bishop AT (2014). “Surgical revascularization in structural orthotopic bone allograft increases bone remodeling.” Clin Orthop Relat Res 472(9): 2870–2877. [DOI] [PMC free article] [PubMed] [Google Scholar]
- Wongtrakul S, Friedrich PF and Bishop AT (2002). “Vascular endothelial growth factor promotion of neoangiogenesis in conventional nerve grafts.” J Hand Surg [Am] 27(2): 277–285. [DOI] [PubMed] [Google Scholar]
- Zagorchev L, Oses P, Zhuang ZW, Moodie K, Mulligan-Kehoe MJ, Simons M and Couffinhal T (2010). “Micro computed tomography for vascular exploration.” J Angiogenes Res 2: 7. [DOI] [PMC free article] [PubMed] [Google Scholar]
Associated Data
This section collects any data citations, data availability statements, or supplementary materials included in this article.


