

Abstract
Background
¹⁸F‐FDFG uptake by brain tissue as measured by positron emission tomography (PET) is a well‐established method for assessment of brain function in people with dementia. Certain findings on brain PET scans can potentially predict the decline of mild cognitive Impairment (MCI) to Alzheimer’s disease dementia or other dementias.
Objectives
To determine the diagnostic accuracy of the ¹⁸F‐FDG PET index test for detecting people with MCI at baseline who would clinically convert to Alzheimer’s disease dementia or other forms of dementia at follow‐up.
Search methods
We searched the Cochrane Register of Diagnostic Test Accuracy Studies, MEDLINE, EMBASE, Science Citation Index, PsycINFO, BIOSIS previews, LILACS, MEDION, (Meta‐analyses van Diagnostisch Onderzoek), DARE (Database of Abstracts of Reviews of Effects), HTA (Health Technology Assessment Database), ARIF (Aggressive Research Intelligence Facility) and C‐EBLM (International Federation of Clinical Chemistry and Laboratory Medicine Committee for Evidence‐based Laboratory Medicine) databases to January 2013. We checked the reference lists of any relevant studies and systematic reviews for additional studies.
Selection criteria
We included studies that evaluated the diagnostic accuracy of ¹⁸F‐FDG PET to determine the conversion from MCI to Alzheimer’s disease dementia or to other forms of dementia, i.e. any or all of vascular dementia, dementia with Lewy bodies, and fronto‐temporal dementia. These studies necessarily employ delayed verification of conversion to dementia and are sometimes labelled as ‘delayed verification cross‐sectional studies’.
Data collection and analysis
Two blinded review authors independently extracted data, resolving disagreement by discussion, with the option to involve a third review author as arbiter if necessary. We extracted and summarised graphically the data for two‐by‐two tables. We conducted exploratory analyses by plotting estimates of sensitivity and specificity from each study on forest plots and in receiver operating characteristic (ROC) space. When studies had mixed thresholds, we derived estimates of sensitivity and likelihood ratios at fixed values (lower quartile, median and upper quartile) of specificity from the hierarchical summary ROC (HSROC) models.
Main results
We included 14 studies (421 participants) in the analysis. The sensitivities for conversion from MCI to Alzheimer's disease dementia were between 25% and 100% while the specificities were between 15% and 100%. From the summary ROC curve we fitted we estimated that the sensitivity was 76% (95% confidence interval (CI): 53.8 to 89.7) at the included study median specificity of 82%. This equates to a positive likelihood ratio of 4.03 (95% CI: 2.97 to 5.47), and a negative likelihood ratio of 0.34 (95% CI: 0.15 to 0.75). Three studies recruited participants from the same Alzheimer's Disease Neuroimaging Initiative (ADNI) cohort but only the largest ADNI study (Herholz 2011) is included in the meta‐analysis. In order to demonstrate whether the choice of ADNI study or discriminating brain region (Chételat 2003) or reader assessment (Pardo 2010) make a difference to the pooled estimate, we performed five additional analyses. At the median specificity of 82%, the estimated sensitivity was between 74% and 76%. There was no impact on our findings. In addition to evaluating Alzheimer's disease dementia, five studies evaluated the accuracy of ¹⁸F‐FDG PET for all types of dementia. The sensitivities were between 46% and 95% while the specificities were between 29% and 100%; however, we did not conduct a meta‐analysis because of too few studies, and those studies which we had found recruited small numbers of participants. Our findings are based on studies with poor reporting, and the majority of included studies had an unclear risk of bias, mainly for the reference standard and participant selection domains. According to the assessment of Index test domain, more than 50% of studies were of poor methodological quality.
Authors' conclusions
It is difficult to determine to what extent the findings from the meta‐analysis can be applied to clinical practice. Given the considerable variability of specificity values and lack of defined thresholds for determination of test positivity in the included studies, the current evidence does not support the routine use of ¹⁸F‐FDG PET scans in clinical practice in people with MCI. The ¹⁸F‐FDG PET scan is a high‐cost investigation, and it is therefore important to clearly demonstrate its accuracy and to standardise the process of ¹⁸F‐FDG PET diagnostic modality prior to its being widely used. Future studies with more uniform approaches to thresholds, analysis and study conduct may provide a more homogeneous estimate than the one available from the included studies we have identified.
Plain language summary
¹⁸F‐FDG PET scan for early prediction of developing Alzheimer’s disease or other dementia in people with mild cognitive impairment (MCI)
Background
The numbers of people with dementia and other cognitive problems are increasing globally. A diagnosis of dementia at early stage is recommended but there is no agreement on the best approach. A range of tests have been developed which healthcare professionals can use to assess people with poor memory or cognitive impairment. In this review we have focused on the ¹⁸F‐FDG PET test.
Aim
We aimed to see how accurately the ¹⁸F‐FDG PET scan identified those people with MCI who would clinically convert to Alzheimer’s disease dementia or other types of dementia over a period of time.
Study characteristics
The evidence is current to January 2013. We included 16 studies covering 697 participants with MCI. The studies have been published over a 14‐year period (1999 to 2013). Study sizes were small and ranged from 19 to 94 participants. Five papers have a mean age of less than 70 years. The age range in the youngest sample was 55 to 73 years and in the oldest sample was 71 to 86 years. Participants were mainly recruited from university departments, clinics or research centres. The percentage of participants with positive ¹⁸F‐FDG PET scans at baseline ranged in the included studies from 10.5% to 74% and the percentage of those participants who converted to Alzheimer’s disease dementia over a period of time ranged from 22% to 50%. Included studies reported a range of different cut‐off values used for identifying their participants with positive ¹⁸F‐FDG PET scans.
Quality of the evidence
Our findings are based on studies with poor reporting. The majority of included studies had an unclear risk of bias, mainly because they did not describe in sufficient details how participants were selected and how the clinical diagnosis of Alzheimer’s disease dementia was justified. According to the assessment of the ¹⁸F‐FDG PET test domain, more than 50% of studies were of poor methodological quality.
The main limitations of the review are poor reporting in the included studies, a lack of a widely‐accepted cut‐off value of the ¹⁸F‐FDG PET scan in people with MCI, and the marked variation in test accuracy between the included studies.
Key findings
In this review, we have found that the ¹⁸F‐FDG PET scan, as a single test, lacks the accuracy to identify those people with MCI who would develop Alzheimer’s disease dementia or other forms of dementia over a period of time. Assuming a typical conversion rate of MCI to Alzheimer’s disease dementia of 38%, the findings indicate that for every 1000 ¹⁸F‐FDG PET scans, 174 cases with a negative scan will progress to Alzheimer's disease dementia and 285 with a positive scan will not. Therefore, a positive ¹⁸F‐FDG PET scan in people with MCI is of no clinical value in early prediction of developing Alzheimer's disease dementia.
Summary of findings
Summary of findings'. 'Summary of findings table.
| What is the diagnostic accuracy of ¹⁸F‐FDG PET biomarker for detecting Alzheimer's disease, and predicting progression to dementia, in people with mild cognitive impairment | |||||||
| Descriptive | |||||||
| Participant population | Participants diagnosed with MCI at baseline using any of the Petersen criteria or CDR = 0.5 or any 16 definitions included by Matthews 2008 | ||||||
| Sources of referral |
|
||||||
| MCI criteria |
|
||||||
| Sampling procedure |
|
||||||
| Prior testing | The only testing prior to performing the ¹⁸F‐FDG PET scans was the application of diagnostic criteria for identifying participants with MCI | ||||||
| Sources of recruitment |
|
||||||
| Index tests | ¹⁸F‐FDG PET | ||||||
| Threshold prespecified at baseline |
|
||||||
| PET scan interpretation |
|
||||||
| Threshold | Almost all included studies referred to ratios of cerebral glucose metabolism (rCGMr) and not to absolute numbers. They used a range of different thresholds (different brain regions studied as potential AD areas as well as different scaling). Most of the studies (12/16) performed PET analysis based on the combination of visual analysis (qualitative) and rCGMr estimations (quantitative). The rest (4/16) only referred to visual PET inspections (qualitative‐only analysis). |
||||||
| ¹⁸F‐FDG hypometabolism regions | Authors used brain regions that are expected to be affected by AD. In these terms, all studies involved temporo‐parietal lobes and most of them (12/16) also included the posterior cingulate metabolism in their assessment. 7 studies also involved part of the frontal lobes in their evaluations. | ||||||
| Reference standard | For Alzheimer’s disease dementia:
|
||||||
| Target condition | Conversion from MCI to Alzheimer’s disease dementia or any other forms of dementia. | ||||||
| Included studies | Prospectively well‐defined cohorts with any accepted definition of MCI (as above). 16 included studies (N=697 participants) were identified. 3 studies included ADNI participants. Number included in analysis was 421 from 14 studies. | ||||||
| Quality concerns | QUADAS‐2 scoring was challenging due to insufficient details. Poor reporting about sampling procedure led mainly to unclear risk of bias or contributed to high risk of bias in the participant selection domain. Although the reference standard was regarded as adequate to correctly classify the target condition, poor reporting on blinding of dementia assessors determined unclear risk of bias in the reference domain in most of the included studies. According to the assessment of Index test domain, more than 50% of studies were of poor methodological quality due to lack of prespecified threshold. | ||||||
| Limitations | Limited investigation of heterogeneity due to insufficient number of studies. Lack of common thresholds. | ||||||
| Test | Studies | Cases/ Participants | Median specificity from included studies |
Sensitivity (95% CI)1 at median specificity |
Consequences in a cohort of 1000 | ||
| Median percentage converting % (range)2 | Missed cases3 | Over Diagnosed3 |
|||||
| Alzheimer's disease dementia | |||||||
| ¹⁸F‐FDG PET | 14 | 150/421 | 82 | 76 (54 to 90) | 38.5 (22 ‐ 50) | 174 | 285 |
|
Key feature of the results: The results of the included studies show a great deal of heterogeneity, encompassing both values which would render the technology “useless” and some which indicate a valuable diagnostic tool. The sensitivity values ranged from 25% to 100%, while the specificity values ranged from 29% to 100%. The values for both sensitivity and specificity were mainly over 80% in 7 included studies. In the remaining 7 studies those values were less than 80% or a sensitivity value higher than 80% was accompanied by a very low specificity value and vice versa. Investigation of heterogeneity: We investigated the effects of interpretation of PET scan (combination of visual inspection and quantitative rCGMr evaluation versus those that used visual interpretation only) and use of the prespecified threshold on the test results. There was no impact on our findings. The remaining planned investigations (e.g. the effect of spectrum of participants, referral centres, ¹⁸F‐FDG reduction brain regions, inadequate blinding or loss to follow‐up) were not possible due to the limited number of studies available for each analysis. We conducted sensitivity analyses for type of clinical diagnosis for MCI and for type of reference standard. There was no impact on our findings. | |||||||
|
Conclusions: Given the considerable variability and specificity values, the heterogeneity in the conduct and interpretation of the test, and lack of defined thresholds for determination of test positivity in the included studies, the current evidence does not support the routine use of ¹⁸F‐FDG PET scan in clinical practice. ¹⁸F‐FDG PET scan is a high‐cost investigation, and it is therefore important to clearly demonstrate its accuracy and to standardise the process of ¹⁸F‐FDG PET diagnostic modality prior to its being widely used. Future studies with more uniform approaches to thresholds, analysis and study conduct may provide a more homogeneous estimate than the one that has been available from the included studies we have identified. | |||||||
1 Meta‐analytic estimate of sensitivity derived from the HSROC model at a fixed value of specificity. We did not compute summary estimates of sensitivity and specificity because the studies that contributed to the estimation of the summary ROC curve used various thresholds.
2 We derived the median proportion converting (reported as a percentage) and range using all the studies included in the analysis for each target condition.
3 We computed missed and over‐diagnosed numbers using the median proportion converting to each target condition.
Background
The most common form of dementia in the general population is Alzheimer’s disease. It is useful to distinguish the term Alzheimer's disease, which refers to underlying pathology, from Alzheimer's disease dementia, which is the final stage of a clinical syndrome associated with the pathology.
Alzheimer’s disease dementia (ADD) afflicts 5% of men and 6% of women over the age of 60 worldwide (ICD‐10 2010). The prevalence increases exponentially with age as Alzheimer’s disease dementia affects fewer than 1% of people aged 60 to 64, but 24% to 33% of those over 85 (Ferri 2005). The earliest symptoms of ADD include short‐term memory loss, a gradual decline in other cognitive abilities and behavioural changes. Cortical intracellular neurofibrillary tangles (NFT) and extracellular β‐amyloid (Aβ) plaques (Braak 1991) represent the neuropathological features of Alzheimer's disease dementia and are responsible for synapse dysfunction, neuronal cell loss and consequent brain atrophy (Ballard 2011). According to the National Institute of Neurological and Communicative Disorders and Stroke and the Alzheimer's Disease and Related Disorders Association (NINCDS‐ADRDA) criteria (McKhann 1984), definite Alzheimer's diseases dementia can only be diagnosed following neuropathological examination of brain tissue, obtained by biopsy or autopsy.
Mild cognitive impairment (MCI) represents a possible intermediary condition between normal cognition and dementia (Morris 2001; Petersen 2009). Currently, 16 different classifications are used to define MCI (Matthews 2008). The different definitions of MCI are based on general criteria that include a cognitive complaint (self‐ or informant‐reported or both), preserved basic activities of daily living, cognitive impairment (not normal for age and education) or decline in cognition evidenced by performance on objective cognitive tasks, and absence of dementia (Petersen 2004; Winblad 2004). In this review MCI refers to the clinical criteria defined by Petersen and Winbald (Petersen 1999; Petersen 2001; Petersen 2004; Winblad 2004), or the Clinical Dementia Rating (CDR) scale (CDR = 0.5) (Morris 1993), or any of the 16 descriptions of MCI reported by Matthews 2008.
There are four outcomes for those within an MCI population: progression to ADD, progression to another dementia, maintaining stable MCI, or recovery. An early identification of those people who would convert from MCI to ADD and other forms of dementia may improve the opportunities for early intervention and might help their carers to plan the future. However, current data in the medical literature are still not adequate to guide clinicians and researchers in understanding the progression of dementia. There is no clinical method to predict the possible conversion of people with MCI to ADD or other dementias. Studies (Bruscoli 2004; Mattsson 2009; Petersen 1999; Petersen 2009) indicate that an annual average of 10% to 15% of people with MCI progress to ADD. This all depends on clinical profile, settings and investigation for vascular disease. Thus, the improvement of diagnostic accuracy is critical for the management and treatment of ADD and other dementias. Research suggests that measurable change in positron emission tomography (PET), magnetic resonance imaging (MRI) and cerebrospinal fluid (CSF) biomarkers occurs years in advance of the onset of clinical symptoms (Beckett 2010). This review focuses on the relation between the ¹⁸F‐2‐fluoro‐2‐deoxy‐D‐glucose (¹⁸F‐FDG)‐PET biomarker results, the brain tissue glucose metabolism at baseline, and i) ‘conversion from MCI to Alzheimer’s disease dementia’ or ii) ‘conversion from MCI to other forms of dementia’ at follow‐up.
Target condition being diagnosed
The primary target condition is Alzheimer's disease dementia. The diagnosis is based on the exclusion of other causes of dementia through clinical, paraclinical and neuropsychological investigations criteria as indicated in the NINCDS‐ADRDA guidelines (McKhann 1984). Exclusion of other diseases such as depression, hypothyroidism, and non‐Alzheimer's disease brain lesions is a fundamental part of the diagnostic process (McKhann 1984). A standard diagnostic practice is based on clinical examinations and neurological and mental status examination of the patient. Moreover, the standard diagnostic practice includes caregiver or family member interviews, focusing on progressive cognitive impairments and behavioural changes associated with the disease.
The secondary target condition is any other form of dementia, including all‐cause dementia (APA 1987; APA 1994), vascular dementia (Román 1993), dementia with Lewy bodies (McKeith 2006), and fronto‐temporal dementia (Lund Manchester 1994; Neary 1998).
Index test(s)
PET represents a unique, minimally invasive diagnostic nuclear medicine modality of well‐documented accuracy. It assesses pathophysiologic and chemical processes by using radiopharmaceuticals that mimic endogenous molecules. Depending on the distribution of the radiotracer in the human body, images are produced and diagnostic information is acquired. Kinetic information may also be available. ¹⁸F‐FDG is the most common molecular imaging biomarker used in PET. In particular, ¹⁸F‐FDG is a radiolabeled glucose analogue and thus by entering the glucose metabolic pathway provides information about tissue metabolism. In other words, ¹⁸F‐FDG is an indicator of intracellular glucose metabolism. It has a wide variety of applications in neurosciences, oncology, and cardiology.
¹⁸F‐FDG uptake by brain tissue as measured by PET is a well‐established method for evaluation of brain function and it has been used in the study of dementia for more than three decades. ¹⁸F‐FDG PET evaluates the regional cerebral metabolic rate for glucose (rCGMr), thus giving information about the entity of neuronal loss or synapse dysfunction The key finding is the reduced brain glucose metabolism that is associated with neurodegenerative diseases. Glucose metabolism imaging with ¹⁸F‐FDG is the most sensitive and specific imaging modality available today for the diagnosis of ADD (Lucignani 2006). Furthermore, ¹⁸F‐FDG PET is nowadays considered an imaging biomarker for Alzheimer's disease before onset of dementia and in clinical trials (Bohnen 2012; Dubois 2010; Hampel 2010). Hypometabolism in the temporo‐parietal lobe, as assessed by qualitative visual interpretation of the PET scan, represents the typical pattern found in ADD (Herholz 2002; Nitrini 2000). Moreover, it has been demonstrated that progression of neurodegenerative changes in people with ADD and other dementias is associated with both more cognitive impairment and larger PET metabolic deficits (Duara 1986; Haxby 1986).
The ¹⁸F‐FDG PET pattern for MCI is not so consistent, which is unsurprising, due to the variable physical history of the disorder. However, people with MCI usually present on PET with mild global and regional hypometabolism (Mosconi 2009). ¹⁸F‐FDG PET studies have found characteristic and progressive cerebral metabolic rate for glucose (CMRgl) reductions in posterior cingulate, precuneus, parietal, temporal and frontal regions in both ADD and in people with MCI, with the findings being more pronounced in those with MCI who eventually converted to ADD (Chen 2010; Morbelli 2010; Patterson 2010). Moreover, a growing body of ¹⁸F‐FDG PET studies have been carried out specifically in order to evaluate the correlation between glucose metabolism impairment and the progression from MCI to ADD and other dementias. These studies suggest that certain findings on brain PET scans can potentially predict the decline of MCI to ADD. In agreement with this, a recent meta‐analysis points out that people converting from MCI, in comparison with those who did not convert to ADD, showed hypometabolism/hypoperfusion in the parietal lobe (Schroeter 2009). Further, Laforce 2010 studied the role of ¹⁸F‐FDG PET in the diagnosis of atypical/unclear dementias in a cohort of 94 people suffering from MCI or dementia. Their results showed that PET significantly reduced the percentage of unclear dementia diagnoses from 39% to 16%.
The mainstay in ¹⁸F‐FDG PET interpretation is the visual reading of the scan, which depends heavily on the experience and previous training of the reading physician. This reliance on the observer’s qualitative interpretation and the lack of well‐defined thresholds for differentiation of pathological from normal scans is an issue regarding the application of the modality in the diagnostic work‐up of people with MCI. Nevertheless, the development and utilisation in recent years of new software tools for image analysis have helped in the direction of carrying out many brain ¹⁸F‐FDG PET studies. These software applications, some of which are currently Food and Drug Administration (FDA)‐approved, have enabled the quantification of brain PET scans, achieving objective evaluation and thus increasing the physician's interpretative confidence. Although subjective (visual) interpretation of the brain scan is the general standard in clinical practice, the addition of quantitative information can be crucial in such studies, since it improves the diagnostic accuracy (Patterson 2010).
Clinical pathway
Dementia develops over a trajectory of several years. There is a presumed period when people are asymptomatic, and when pathology is accumulating. Individuals or their relatives may then notice subtle impairments of recent memory. Gradually, more cognitive domains become involved, and difficulty in planning complex tasks becomes increasingly apparent. In the UK, people usually present to their general practitioner, who may administer some neuropsychological tests, and will potentially refer them to a hospital memory clinic. However, many people with dementia do not present until much later in the disorder and will follow a different pathway to diagnosis, for example being identified during an admission to a general hospital for a physical illness. Thus the pathway influences the accuracy of the diagnostic test. The accuracy of the test will vary with the experience of the administrator, and the accuracy of the subsequent diagnosis will vary with the history of referrals to the particular healthcare setting. Diagnostic assessment pathways may vary between countries and diagnoses may be made by a variety of specialists including neurologists and geriatricians.
Alternative test(s)
We are not including alternative tests in this review because there are currently no standard practice tests available for the diagnosis of dementia.
The Cochrane Dementia and Cognitive Improvement Group (CDCIG) is in the process of conducting a series of diagnostic test accuracy reviews of biomarkers and scales (see list below). Although we are conducting reviews on individual tests compared to a reference standard, we plan to compare our results in an overview.
¹¹C‐PIB PET( Pittsburgh Compound‐B positron emission tomography)
CSF (Cerebrospinal fluid analysis of abeta and tau)
sMRI (structural magnetic resonance imaging)
Neuropsychological tests (MMSE; Mini‐Cog; MoCA)
Informant interviews (IQCODE; AD8)
APOE ϵ4 (apolipoprotein ϵ4 allele gene)
rCBF SPECT (regional cerebral blood flow single photon emission computerised tomography)
Rationale
According to the latest revised NINCDS‐ADRA diagnostic criteria for ADD of the National Institute on Aging and Alzheimer Association (Albert 2011; Dubois 2010; McKhann 2011; Sperling 2011), the confidence in diagnosing MCI due to Alzheimer's disease is raised with the application of biomarkers based on imaging or CSF measures. These tests, added to core clinical criteria, might increase the sensitivity or specificity of a testing strategy. However, it is crucial that each of these biomarkers is assessed for their diagnostic accuracy before they are adopted as routine add‐on tests in clinical practice.
The ¹⁸F‐FDG PET biomarker, as the extra diagnostic criterion, might facilitate accurate identification of those people with MCI who would convert to ADD or other forms of dementia. At the present time there is no 'cure' for dementia, but there are some treatments which can slow cognitive and functional decline, or reduce the associated behavioural and psychiatric symptoms of dementia (Birks 2006; McShane 2006). In addition, the accurate early diagnosis of dementia may improve opportunities for the use of newly‐evolving interventions designed to delay or prevent progression to more debilitating stages of dementia (Oddo 2004). Coupled with appropriate contingency planning, proper recognition of the disease may also help to prevent inappropriate and potentially harmful admissions to hospital or institutional care (NAO 2007).
Objectives
To determine the diagnostic accuracy of the ¹⁸F‐FDG‐PET index test for detecting people with MCI at baseline who would clinically convert to ADD or other forms of dementia at follow‐up. Although we want to identify whether 'early forms of Alzheimer's disease dementia' are present at the moment of examination, there is no reference standard to make a final diagnosis of early ADD. Follow‐up is therefore needed to reconstruct what was going on at the time of the index examination. In this context, it is clear that the duration of follow‐up becomes critical, i.e. sufficiently long to capture the natural course of conversion.
Secondary objectives
To investigate heterogeneity of test accuracy in the included studies.
We expect that heterogeneity will be likely and that it will be an important component of the review. The potential sources of heterogeneity, which we will use as a framework for the investigation of heterogeneity, include target population, index test, target disorder and study quality.
Methods
Criteria for considering studies for this review
Types of studies
We consider longitudinal cohort studies in which index test results are obtained at baseline and the reference standard results at follow‐up (see below for detail about the nature of the index test and reference standard). These studies necessarily employ delayed verification of conversion to dementia and are sometimes labelled as ‘delayed verification cross‐sectional studies’ (Bossuyt 2004; Bossuyt 2008; Knottnerus 2002).
We also consider case‐control studies if they incorporate a delayed verification design. This occurs in the context of a cohort study, so these studies are invariably diagnostic nested case‐control studies. We only include data on performance of the index test to discriminate between people with MCI who convert to dementia and those who remained stable from those studies. We have not considered data from healthy controls or any other control group.
Participants
Participants recruited and clinically classified as those with MCI at baseline were eligible for this review. We include studies that used the Petersen or revised Petersen criteria (Petersen 1999; Petersen 2004; Winblad 2004) or the Clinical Dementia Rating (CDR = 0.5) scale (Morris 1993) or any of the 16 different classifications of MCI described by Matthews 2008 as diagnostic criteria for MCI. Those criteria are presented in Table 2 and Table 3.
1. Classification systems for describing mild cognitive impairment according to Matthews 2008.
| System | Description | Impairment |
| Age‐related cognitive change | ||
| ACMI | Age‐consistent memory impairment |
Memories aging in accord with normative expectations; individual aged 50 to 79 and reports a decline in memory verified using objective memory testing performance (within ± 1 standard deviation of aged norms on 75% of tests (memory) administered); preserved general functioning. |
| ARCD | Age‐related cognitive decline | Objectively identified decline in memory and cognitive functioning considered to be a normal consequence of aging. |
| Category systems | ||
| SMC | Subjective memory complaint | Self‐reported decline in memory. |
| MMSE MCI | Mini‐Mental State Examination | Classification based on MMSE cut‐offs (maximum score 30). 'Normal' defined as a score from 27 to 30; MCI defined as a score from 22 to 26; and 'impaired' defined as a score < 21. |
| Pathological decline | ||
| MNCD | Mild neurocognitive disorder | Impairment resulting from a general medical condition; reported decline in cognitive functioning supported by formal testing; deficits observed in at least 2 areas of cognitive functioning; interference in social, occupational, or other areas of functioning. |
| CIND | Cognitive impairment no dementia | Cognitive impairment in one or more domains (including memory and non‐memory domains) that can have a variety of aetiologies. |
| BSF | Benign senescent Forgetfulness |
Impairment in remote memory and intact recent memory; awareness of the impairment and use of compensatory strategies. |
| AAMI | Age‐associated memory impairment | Subjective and objective memory loss associated with normal aging; individual aged 50 and older and shows adequate intellectual function (i.e. without dementia). |
| MD | Minimal dementia | Cognitive impairment in memory and minor and variable errors in orientation; no evidence of impaired occupational or social functioning; self care unimpaired. |
| LCD | Limited cognitive disturbance | Reported decline in memory with use of compensatory strategies; occasional forgetfulness (e.g. names, places); 1 or 2 errors on cognitive (memory) testing. |
| QD | Questionable dementia | Impaired memory and non‐memory test performance; no significant activity of daily living or instrumental activity of daily living interference. |
| AACD | Age‐associated cognitive decline | Self‐ or informant report of cognitive decline (gradual and present for 6 months); objective difficulties in any of the following domains: learning and memory, attention and concentration, thinking, language, and visuospatial functioning |
| MCD | Mild cognitive disorder | Decline in cognitive performance, including memory impairment and learning or concentration difficulties; complaint confirmed by cognitive tests; may precede, accompany, or follow a wide variety of infections or physical disorders. |
| Mayo Clinic Criteria | ||
| N‐MCI | Non‐amnestic mild cognitive impairment | Subjective memory complaint; normal general cognitive function; normal range of activities of daily living; objective impairment in 1 or more domains other than memory. |
| A‐MCI | Amnestic mild cognitive impairment | Subjective memory complaint; normal general cognitive function; normal range of activities of daily living; impaired memory performance; normal non‐memory test performance |
| M‐MCI | Multiple mild cognitive impairment | Subjective memory complaint; normal general cognitive function; normal range of activities of daily living; impaired memory and nonmemory test performance |
2. Criteria for the diagnosis of mild cognitive impairment.
Petersen 1999
|
|
Petersen 2004 4 subtypes of MCI were identified:
All 4 subtypes of mild cognitive impairment also have to meet the following criteria: a) the presence of a complaint about memory – participants or informants (or both) reporting memory impairment. b) intact ability to perform activities of daily living – forgetfulness not compromising overall functional ability; impairment owing to physical disease not sufficient for exclusion. c) absence of dementia – assessed by DSM–IV criteria. |
|
Morris 1993 Clinical Dementia Rating (CDR) is a scale used to classify patients along a continuum from normal aging through Alzheimer’s disease. This scale describes a continuum from normal (CDR 0) through questionable dementia or MCI (CDR 0.5) to mild (CDR 1), moderate (CDR 2), and severe (CDR 3) dementia. Patient's cognitive and functional performances are assessed in 6 areas: memory, orientation, judgement and problem solving, community affairs, home and hobbies, and personal care. Scores in each of these areas are combined to obtain the total score. |
MCI: mild cognitive impairment
We exclude those studies that involve people with MCI possibly caused by: i) current use or history of alcohol/drug abuse; ii) Central Nervous System trauma (e.g. subdural haematoma), tumour or infection; iii) other neurological conditions e.g. Parkinson’s or Huntington’s diseases.
Index tests
¹⁸F‐FDG PET biomarker test
There are currently no generally accepted standards for a ¹⁸F‐FDG positivity threshold, and therefore we have used the criteria which were applied in each included primary study to classify participants as either ¹⁸F‐FDG‐positive or ¹⁸F‐FDG‐negative, according to the degree of glucose metabolism in selected brain regions. Some studies apply a qualitative assessment of PET scans, while some apply both qualitative and quantitative assessments. Moreover, different thresholds are used in quantitative studies. While this may generate heterogeneity it should be noted that the addition of quantitative analysis (in the interpretation of the ¹⁸F‐FDG PET brain scan) in clinical practice is done in order to support the visual (qualitative) reading of the scan by the physician.
A range of thresholds have been used in primary research, for instance: i) "the regional cerebral glucose metabolism ratio (rCGM‐r) is lower than 80% of whole brain mean of control subjects" (Chételat 2003); ii) "the rCGM‐r of temporo‐parietal and posterior cingulate < 1.3 ‐ 8" (Anchisi 2005).
We considered the use of any image analysis technique, ¹⁸F‐FDG injection dose, the time between ¹⁸F‐FDG injection and PET acquisition, and ¹⁸F‐FDG reduction regions (e.g. parietal, temporal, frontal lobes, posterior cingulated, precuneus). The exact administered ¹⁸F‐FDG activity does not affect the PET examination (as long as it ranges between the accepted limits for acquiring proper images), as this can be compensated for by the duration of the scan; the number of counts detected by the scanner is the key finding.
The accepted limits of administered activity are defined by guidelines published by the Nuclear Medicine Societies. The two major ones are the Society of Nuclear Medicine (SNM, USA) (Waxman 2009) and the European Association of Nuclear Medicine (EANM, Europe) (Varrone 2009). According to SNM, the recommended ¹⁸F‐FDG activity in adults for brain PET is 185 ‐ 740 MBq (or 5 ‐ 20 mCi). According to EANM, the recommended administered activity for adults is 300 – 600 MBq (typically 370 MBq) in 2D mode and 125 – 250 MBq (typically 150 MBq) in 3D mode. All studies included in this review demonstrated homogeneity in the protocol followed, with no substantial differences, regarding administered dose or scanning acquisition followed. Moreover, despite the between‐studies differences regarding interpretation criteria, the evaluation of the PET scans was based on the fundamental principle of detection of a pattern of brain hypometabolism (decreased ¹⁸F‐FDG uptake) in people with MCI that is topographically consistent with the respective hypometabolic pattern expected to be seen in ADD. This means detection of regional metabolic reductions mainly in the temporo‐parietal and posterior cingulate cortices.
The differences in exact timing of image acquisition also do not influence the study, as long as the acquisition does not start earlier than 30 minutes after ¹⁸F‐FDG injection. It is recommended, however, that each department follow a standard protocol with a fixed time for starting the acquisition (e.g. 30 or 60 minutes after injection) (Varrone 2009; Waxman 2009). The aim of the acquisition is the good contrast between grey and white matter.
We did not include any comparator test because there are currently no standard practice tests available for the diagnosis of dementia. We compared the index test with a reference standard.
Target conditions
There are two target conditions in this review:
1. Alzheimer’s disease dementia (conversion from MCI to Alzheimer’s disease dementia);
2. Other forms of dementia (conversion from MCI to other forms of dementia, i.e. any or all of vascular dementia, dementia with Lewy bodies, or fronto‐temporal dementia).
Reference standards
For the purpose of this review, several definitions of ADD are acceptable. We Included studies that applied probable or possible NINCDS‐ADRDA criteria (McKhann 1984). We also considered those studies that used the Diagnostic and Statistical Manual of Mental Disorders (DSM) (APA 1987; APA 1994) and International Classification of Diseases (ICD) (ICD‐10 2010) definitions for ADD.
Similarly, differing clinical definitions of other dementias are acceptable. For Lewy body dementia the reference standard is the McKeith criteria (McKeith 1996; McKeith 2006). For fronto‐temporal dementia the reference standards are the Lund criteria (Lund Manchester 1994), Neary 1998, Boxer 2005, DSM‐III (APA 1987), DSM‐IV (APA 1994), ICD‐9 (ICD‐9 2006), ICD‐10 (ICD‐10 2010). For vascular dementia the reference standards are the NINDS‐ARIEN criteria (Román 1993), DSM‐III (APA 1987), DSM‐IV (APA 1994), ICD‐9 (ICD‐9 2006) and ICD‐10 (ICD‐10 2010).
The time interval over which progression from MCI to ADD or other forms of dementia occurs is important. We chose one year as the minimum period of delay in the verification of the diagnosis (i.e. the time between the assessment at which a diagnosis of MCI is made and the assessment at which the diagnosis of dementia is made).
Search methods for identification of studies
We used a variety of information sources, aiming to retrieve as many relevant studies as possible. The Trials Search Co‐ordinator of the CDCIG devised search strategies for electronic database searching.
Electronic searches
The most recent search for this review was performed in January 2013. We requested a search of the Cochrane Register of Diagnostic Test Accuracy Studies (managed by the Cochrane Renal Group). We also searched MEDLINE (OvidSP) (1950 to January 2013), MEDLINE (1950 to present), EMBASE (OvidSP) (1974 to week 2 2013), PsycINFO (OvidSP) (1806 to January week 2 2013), all databases in the Web of Science collection: Web of Science (1945 to present); BIOSIS Previews (1926 to present); Journal Citation Reports, and LILACS (Bireme). See Appendix 1 for details of the sources searched, the search strategies used, and the number of hits retrieved. We did not apply any language or date restrictions to the electronic searches; we did not use methodological filters, so as to maximise sensitivity (Beynon 2013; Whiting 2011).
Searching other resources
We checked the reference lists of all relevant studies for additional studies. We also conducted searches in the MEDION database (Meta‐analyses van Diagnostisch Onderzoek) at www.mediondatabase.nl, Database of Abstracts of Reviews of Effects (DARE) at www.crd.york.ac.uk/CRDWeb/, Health Technology Assessments Database (HTA Database) at www.crd.york.ac.uk/CRDWeb/, and Aggressive Research Intelligence Facility (ARIF) database at www.arif.bham.ac.uk for other related systematic diagnostic accuracy reviews. We searched for systematic reviews of diagnostic studies from the International Federation of Clinical Chemistry and Laboratory Medicine Committee for Evidence‐based Laboratory Medicine database (C‐EBLM). We checked reference lists of any relevant systematic reviews for additional studies.
Data collection and analysis
Selection of studies
The CDCIG Trials Search Co‐ordinator (TSC), who is a researcher with experience of DTA systematic reviews, performed the first assessment of the search results in order to remove the obviously non‐relevant studies. Two review authors independently reviewed the remaining titles and abstracts for potentially eligible studies for full paper review. Two review authors then independently assessed full manuscripts against the inclusion criteria. Where necessary, a third review author resolved disagreements that the other two were not able to resolve through discussion.
Where a study did not present all relevant data (for creating a 2 x 2 table) in the published manuscript, we contacted the authors directly to request further information. When the same dataset was presented in more than one paper, we planned to include the primary paper, which is the paper with the largest number of participants or with the most informative data.
We detailed the number of studies selected at each point in a Study flow diagram (below).
Data extraction and management
We extracted the following data on study characteristics (if reported):
Bibliographic details of primary paper:
Author, title of study, year and journal
Basic clinical and demographic details:
Number of participants
MCI clinical criteria
Age
Gender
Referral centre(s)
Participant recruitment
Sampling procedures
Details of the index test:
Method of the ¹⁸F‐FDG PET index test administration, including who administered the test
Thresholds used to define positive and negative tests
Other technical aspects as seem relevant to the review, e.g. brain areas
Details of the reference standard:
Definition of ADD and other dementias used in reference standard
Duration of follow‐up from time of index test used to define ADD and other dementias in reference standard: 1 to < 2 years; 2 to < 4 years; and > 4 years; if participants have been followed for varied amounts of time we recorded a mean follow‐up period for each included study
Prevalence or proportion of population developing ADD and other dementias, with severity, if described
We created 2 x 2 tables (cross‐relating index test results of the reference standards) as shown in Appendix 2. We also extracted data necessary for the assessment of quality, as defined below. Two blinded review authors (NS, CS) extracted data independently, resolving disagreements in data extraction by discussion, and involving a third review author (CH) as arbiter when necessary.
Assessment of methodological quality
We assessed the methodological quality of each study using the QUADAS‐2 tool (Whiting 2011), as recommended by The Cochrane Collaboration. The tool is made up of four domains: i) Participant selection; ii) Index test; iii) Reference standard; iv) Participant flow.
Two independent raters (NS, SM), blinded to each other’s scores, performed the QUADAS‐2 assessment, resolving disagreement by further review and discussion, with potential to involve a third review author (CH) as arbiter if necessary. We assessed each domain in terms of risk of bias, with the first three domains also considered in terms of applicability. The components of each of these domains and a rubric which details how judgements concerning risk of bias are made are detailed in Appendix 3 and Appendix 4. Certain key areas important to quality assessment are participant selection, blinding and missing data.
We did not use QUADAS‐2 data to form a summary quality score in order to ensure that the nature of the limitations of the studies were as transparent as possible. We produced a narrative summary describing numbers of studies that were found to have high/low/unclear risk of bias as well as concerns regarding applicability.
Statistical analysis and data synthesis
We evaluated test accuracy according to target condition. There are no accepted thresholds to define ¹⁸F‐FDG PET positivity for Alzheimer's disease dementia and other forms of dementia, and so the estimates of diagnostic accuracy reported in primary studies were likely to be based on data‐driven threshold selection (Leeflang 2008). We conducted exploratory analyses by plotting estimates of sensitivity and specificity from each study in forest plots and in receiver operating characteristic (ROC) space. We meta‐analysed pairs of sensitivity and specificity using the hierarchical summary ROC (HSROC) model (Rutter 2001) which allows for the possibility of variation in threshold between studies. Where inadequate studies were available to estimate all parameters, we assumed a symmetrical shape to the summary ROC curve. Estimates of summary sensitivities and specificities are not clinically interpretable when studies with mixed thresholds are included in the HSROC model, and so we derived estimates of sensitivity and likelihood ratios at fixed values (lower quartile, median and upper quartile) of specificity from the HSROC models. We performed the analyses using the SAS software (version 9.2; SAS Institute 2011, Cary, NC).
Investigations of heterogeneity
In preliminary analyses, we visually examined forest plots of sensitivity and specificity, and SROC plots to explore the effect of the sources of heterogeneity. We investigated the effect of i) interpretation of PET scan (a combination of visual inspection and quantitative rCGMr evaluation interpretation or visual‐only interpretation) and ii) prespecification of threshold on the diagnostic accuracy of the ¹⁸F‐FDG PET index test. However as there were insufficient studies we did not perform meta‐regression (by including each potential source of heterogeneity as a covariate in the HSROC model) as planned (Differences between protocol and review).
Sensitivity analyses
Due to the limited number of studies evaluating ¹⁸F‐FDG PET for all dementia, we performed sensitivity analyses only for studies of ADD. This is a departure from the protocol (Vacante 2013) and is explained in the Differences between protocol and review section.
Assessment of reporting bias
We did not investigate reporting bias because of current uncertainty about how it operates in test accuracy studies and the interpretation of existing analytical tools such as funnel plots.
Results
Results of the search
The total number of records identified by the searches for this review was 9676. After de‐duplication, the Trials Search Co‐ordinator and two paid assessors with experience of screening citations for biomarker diagnostic test accuracy studies screened the titles and abstracts. In total, they assessed 397 full papers and conference abstracts for eligibility (Figure 1). We included 16 papers, and discarded 349 for the following reasons: i) not MCI participants at baseline; ii) not a longitudinal study; iii) index test not a ¹⁸F‐FDG PET. In addition, we excluded 32 papers due to insufficient data for creating 2 x 2 tables (Characteristics of excluded studies). We found no extra studies through reference checking. We obtained usable data for seven studies (Anchisi 2005; Clerici 2009; Galluzzi 2010; Landau 2010; Ossenkoppele 2012a; Ossenkoppele 2012b; Schmand 2012) through contacting the authors.
1.
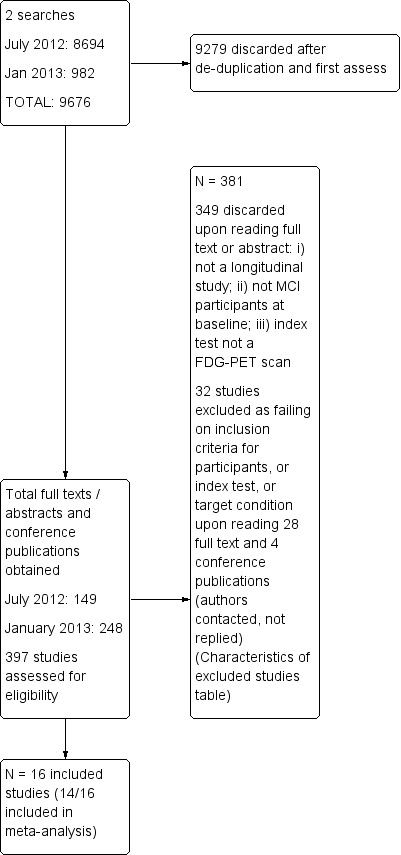
Study flow diagram.
Included Studies
The Characteristics of included studies table lists the details of the 16 included studies covering 697 participants with MCI at baseline, of whom 595 had analysable data. Three studies (Landau 2010; Herholz 2011; Schmand 2012) recruited participants from the same cohort (ADNI participants). The studies have been published over a 14‐year period (1999 to 2013). Most of them (13/16) were conducted in Europe (five in Italy, four in The Netherlands, two in Germany, one in Sweden and one in France), and three in the USA. Fourteen included studies used a version of the Petersen criteria for MCI. Thirteen studies applied NINCDS‐ADRDA criteria as a reference standard for ADD (Berent 1999 also used ICD‐10 while Clerici 2009 and Nobili 2008 also used DSM‐IV; Fellgiebel 2007, Herholz 2011 and Pardo 2010 did not specify the reference standard at follow‐up).
Demographic and participant characteristics are summarised in Table 4. Study sizes were small and ranged from 19 to 94 participants. Five papers have a mean age of under 70 years (Arnáiz 2001; Fellgiebel 2007; Mosconi 2004; Ossenkoppele 2012a; Ossenkoppele 2012b); Schmand 2012 did not report demographic data on the sample with ¹⁸F‐FDG PET scan. The youngest sample was aged 64.0 ± 9.0 (Ossenkoppele 2012b) and the oldest sample was aged 78.3 ± 7.5 (Landau 2010). Seven studies included more men than women in the samples included in the analysis (range from 33% to 75%); three studies did not reported gender for those samples (Ossenkoppele 2012b; Pardo 2010; Schmand 2012). APOE Ɛ4 gene carriers and sampling procedure were poorly reported. Participants were mainly recruited from university departments, clinics or research centres (seven studies) while three studies did not report their sources of recruitment (Chételat 2003; Mosconi 2004; Ossenkoppele 2012a). Most of the studies did not clearly report whether participants were recruited from secondary or tertiary outpatient care settings.
3. Demographic and participant characteristics of participants included in analysis.
| Study | N / n (included in analysis) | Age converters (non‐converters) |
Gender (M %) |
MMSE score converters (non‐converters) |
APOE Ɛ4 carrier (%) | MCI diagnostic criteria | Sampling | Sources of referral |
Sources of recruitment (setting) |
|
Anchisi 2005 (Italy) |
67/48 | 71.1 ± 73.9 (65.0 ± 9.0) |
25 (52.1) | 26.6 ± 1.7 (28.4 ± 1.1) |
Not reported | Patterson 2010 | Consecutive sample (email from the author on 22nd October 2013) |
GP surgeries (email from the author on 22nd October 2013) |
Outpatients from 4 University Departments (Milan, Brescia, Cologne and Dresden) (email on 22nd October 2013) |
|
Arnáiz 2001 (Sweden) |
20/20 | 64.9 ± 8.3 (60.1 ± 8.4) |
12 (60.0) | 26.7 ± 1.8 (27.2 ± 2.9) |
Not reported | Global Deterioration Scale | Consecutive sample | Not reported | Geriatric University clinic |
|
Berent 1999 (USA) |
20/20 | 70.2 ± 5.5 Total sample |
13 (65.0) | 26.0 ± 1.9 Total sample |
Not reported | AAMI criteria |
Not reported |
Not reported | Cognitive disorders University clinic |
|
Chételat 2003 (France) |
19/17 | 73.0 ± 5.1 (67.8 ± 7.0) |
8 (45.2) | 26.3 ± 1.0 (27.8 ± 1.2) |
Not reported | Petersen 2001 | Not reported |
Not reported | Not reported |
|
Clerici 2009 (Italy) |
30/26 | 74.2 ± 6.9 Total sample |
10 (33.3) | 26.2 ± 1.7 Total sample |
Not reported | Petersen 2004 and CDR = 0.5 criteria | Not reported |
GP surgeries or specialists (85%) or self referral (15%) | University Centre for Research and Treatment |
|
Drzezga 2005 (Germany) |
30/30 | 74.7 ± 4.7 (67.6 ± 2.0) |
14 (46.7) | 25.9 ± 2.1 (27.6 ± 1.5) |
17 (56.7) | Petersen 1999 and CDR = 0.5 criteria | Not reported |
GP surgeries or specialists or other institutions |
University Research Unit |
|
Fellgiebel 2007 (Germany) |
16/16 | 69.5 ± 7.9 (68.8 ± 10.0) |
9 (56.2) | 24.3 ± 1.5 (27.3 ± 1.8) |
Not reported | Petersen 1999 | Consecutive sample | Not reported | University memory clinic |
|
Galluzzi 2010 (Italy) |
90/38 | 72.0 ± 7.1 Total sample |
37 (41.1) | 26.1 ± 1.8 Total sample |
35 (38.9) | Petersen 1999 | Consecutive sample | Not reported | Outpatient memory clinic |
|
Herholz 2011 (USA) ADNI participants |
94/94 | 75.0 ± 7.6 Total sample |
66 (70.2) | 2671 ± 1.6 Total sample |
Not reported |
Petersen 2010 & CDR = 0.5 |
Not reported |
Not reported | Multicentre (not specified) |
|
Landau 2010 (USA) ADNI participants |
85/85 | 78.3 ± 7.5 (78.0 ± 7.4) |
56 (65.9) | 26.4 ± 1.7 (27.3 ± 1.6) |
25 (29.4) | Petersen 2010 & CDR=0.5 |
Not reported |
Not reported | Multicenter (not specified) |
|
Mosconi 2004 (Italy) |
37/37 | 69.0 ± 4.0 (63.0 ± 8.0) |
17 (45.9) | 23.9 ± 1.7 (28.1 ± 1.6) |
16 (43.2) | Petersen 2010 | Not reported |
Not reported | Not reported |
|
Nobili 2008 (Italy) |
36/33 | 77.3 ± 4.8 (74.6 ± 5.4) |
13 (39.4) | 69.0 ± 4.0 (63.0 ± 8.0) |
Not reported on all MCI included in analysis | Petersen 2004 | Not reported |
Not reported | Outpatients |
|
Ossenkoppele 2012a (Netherlands) |
15/12 | 67.0 ± 7.0 Sample analysed |
9 (75%) Sample analysed |
75.0 ± 7.6 Sample analysed |
8 (66.7) Sample analysed |
Petersen 1999 | Not reported |
Not reported |
Not reported |
|
Ossenkoppele 2012b (Netherlands) |
30/12 | 64.0 ± 9.0 Total sample |
23 (30.4) Total sample |
75.0 ± 7.6 Total sample |
Not reported | Petersen 2001 | Not reported |
Not reported |
Outpatient University memory clinic |
|
Pardo 2010 (USA) |
19/18 Reader 1 19/19 Reader 2 |
Mean 80.0 (range 54 ‐ 83) Total sample |
Not reported | Not reported | Not reported | Petersen 1999 | Not reported |
Not reported | Geriatric, Research, Education and Medical Centre Unclear |
|
Schmand 2012 (Netherlands) ADNI participants |
89/89 | Not reported on the sample with ¹⁸F‐FDG scan (N = 89) | Not reported on the sample with ¹⁸F‐FDG scan (N = 89) | Not reported on the sample with ¹⁸F‐FDG scan (N = 89) | Not reported on the sample with ¹⁸F‐FDG scan (N = 89) |
Petersen 2010 & CDR = 0.5 |
Not reported |
Not reported | Multicentre (not specified) |
ADNI: Alzheimer's Disease neuroimaging initiative
Table 5 summarises the data regarding the threshold used, image scaling, brain region as potential Alzheimer's disease areas, ¹⁸F‐FDG dose and the time between ¹⁸F‐FDG injection and performing a PET scan, the number of ¹⁸F‐FDG‐positive participants at baseline and the number of converters during the follow‐up period.
4. Index test and numbers of converters to Alzheimer’s disease dementia.
| Study |
Threshold (prespecified Yes/No) |
Image scaling | Discriminating brain area | Image analysis | Time between FDG injection and PET acquisition (min) | ¹⁸F‐FDG dose |
Number of ¹⁸F‐FDG positive (%) |
Number of converters (%) |
Duration of follow‐up Mean (months) / Maximum (years) |
|
Anchisi 2005 (Italy) |
rCGMglc of temporo‐parietal and posterior cingulate of 1.138 (No) |
Regional sensorimotor FDG uptake ratio (p 1730) |
Bilateral parietal and posterior cingulate cortex | SPM99 | Not reported | Not reported |
19 (40) (calculated in RevMan5) |
14 (29) | Median: 12 months Range: 12 ‐ 27 months |
|
Arnáiz 2001 (Sweden) |
rCGMglc of left temporo‐parietal region 13 mm above the basal ganglia (Model I) (No) |
Sensorimotor area of the cortex 26 mm above the level of the basal ganglia (p 852) |
Temporo‐parietal cortex | SPSS (Herholz 1999) |
60 | Not reported |
8 (40) (calculated in RevMan5) |
9 (45) | 36.5 months |
|
Berent 1999 (USA) |
rCGMglc of diagnostic index based on Z‐scores of the parietal cortex (No) |
Thalamus (p 11) | Frontal, temporal, parietal and occipital regions normalised to the thalamus | 3D‐SSP | Not reported | 370 MBq | 10 (50) | 10 (50) | 3 years |
|
Chételat 2003 (France) |
rCGMglc at Z‐score of > 3.09 Thresholding was set at 80% of whole brain mean of control subjects (No) |
FDG uptake normalised by and adjusted to the person’s global uptake (p 1375) | Right temporo‐parietal and posterior cingulate | SPM99 | Not reported | Not reported |
7 (41) right temporo‐parietal region 8 (47.0) posterior cingulate |
7 (41) | 18 months |
|
Clerici 2009 (Italy) |
rCGMglc lower than the control group corresponding to a P value < 0.01 level) (Yes) |
Global counts were normalised by proportional scaling to remove confounding effects due to global changes (Del Sole 2008) |
Posterior gyrus cingulate and bilateral inferior frontal cortex | SPM(t) | 45 | 185‐370 MBq | 23 (88.5) | 13 (50) | 1.5 years aMCI group. 3 years snaMCI group |
|
Drzezga 2005 (Germany) |
rCGMglc at Z‐score of > 1.64 (1‐tail) corresponding to a P value of 0.05 (1‐tail) (Yes) |
Not reported |
Orbitofrontal, prefrontal, premotor, central, parietal superior and inferior, occipital, temporal anterior, temporal posterior and posterior cingulate | 3D‐SSP | 30 | 370 MBq | 13 (43) | 12 (40) | 16 ± 2 months |
|
Fellgiebel 2007 (Germany) |
rCGMglc at significantly decreased Z‐score > 2 in more than 50 adjacent pixels (Yes) |
Sensorimotor area of the cortex (transaxial images parallel to the intercomissural line) (Fellgiebel 2004) |
Parietal mesial or posterior cingulate and temporal regions | SPSS (Fellgiebel 2004) |
30 (Fellgiebel 2004) |
180 MBq (Fellgiebel 2004) | 7 (44) | 4 (25) | 19.6 ± 9.0 |
|
Galluzzi 2010 (Italy) |
rCGMglc of t sum > 11.090 (email from the author) (Herholz 2002) (Yes) |
Cerebellum | Temporo‐parietal, hippocampus and posterior cingulate | SPSS | Not reported | Not reported |
28 (74) | 14 (37) | 20.6.6 ± 9.7 |
|
Herholz 2011 (USA) ADNI participants |
rCGMglc of t sum > 11.090 (Herholz 2002) (Yes) |
Global cortex | Temporal and parietal lobes | PALZ (PMOD software) | 30 ‐ 60 | Not reported |
38 (40) | 30 (32) | 2 years |
|
Landau 2010 (USA) ADNI participants |
rCGMglc of 1.21 (No) |
Cerebellar vermis and pons | ROI interest were study‐independent, frequently associated with decline in AD and MCI. No further details. | SPM5 | 30 ‐ 60 | Not reported |
51 (60) | 28 (33) | 1.9 ± 0.4 years Range: 2 ‐ 3 years |
|
Mosconi 2004 (Italy) |
rCMRglc significantly reduced in certain cerebral areas with emphasis on the inferior parietal lobule (IPL). (No) |
Global cortex | Precuneus, anterior and posterior cingulate, inferior parietal lobe, superior, middle and inferior frontal gyrus, on both hemispheres | SPM99 | 19 ± 3 | 110 ‐ 370 MBq | 4 (10.5) | 8 (22) | 12 ± 0.6 |
|
Nobili 2008 (Italy) |
Visual inspection rCGMglc threshold not reported (No) |
Global cortex | 25 VROI in each hemisphere | Computerized Brain Atlas (CBA; Applied Medical Imaging©, Uppsala, Sweden) |
45 | 370 MBq | 11 (33) | 11 (33) | 21.1 ± 10.9 months |
|
Ossenkoppele 2012a (Netherlands) |
Visual inspection and SUVr of ROIs (threshold not reported) (No) | Cerebellar grey matter | Frontal, parietal and latero‐temporal and medial temporal lobes and posterior cingulate | PMOD Alzheimer discrimination tool (PALZ) | 45 ‐ 60 | 150 ± 17 MBq | 4 (33) | 4 (33) | 30 Range: 2 ‐ 4 years |
|
Ossenkoppele 2012b (Netherlands) |
Visual inspection and SUVr of ROIs (threshold not reported) (No) | Cerebellar grey matter (p 3) | Frontal, parietal, occipital, and latero‐temporal and medial temporal lobes and posterior cingulate | PMOD Alzheimer discrimination tool (PALZ) | 45‐60 | 185 MBq | 5 (42) | 6 (50) | 2 years |
|
Pardo 2010 (USA) |
Visual inspection Hypomethabolism if < 50% of the cubes had the label MCI or normal (Only SVM analysis used thresholds) (No) |
PET scans were adjusted to a whole‐brain mean activity and stereotactically normalised by using Neurostat (p 328) | Frontal, parietal, occipital, and latero‐temporal and medial temporal lobes and posterior cingulate | SVM | Not reported | 5 mCi/70 kg | Reader 1: 6(32) Reader 2: 10 (53) |
8 (44) 9 (47) |
3 years |
|
Schmand 2012 (Netherlands) ADNI participants |
rCGM value of < 1.20 (Email from the author) (Yes) |
Not reported |
Right and left angular gyrus, bilateral posterior cingulate gyrus and left middle/inferior temporal gyrus | SPSS | Not reported | Not reported |
18 (20) | 38 (43) | 2.7 ± 0.9 Range: 0.5 ‐ 4.6 years |
ADNI: Alzheimer's Disease neuroimaging initiative RevMan5: Review Manager 5 software SUVr: standardised uptake value ratio VROI: volumetric region of interest
All included studies applied qualitative/visual evaluations of the PET scans. In particular, 12 of the 16 studies performed PET analysis based on the combination of visual analysis (qualitative) and rCGMr estimations (quantitative), while the remaining four studies referred only to visual PET inspections (qualitative‐only analysis). A range of different thresholds were applied (different rCGMr values, various brain regions studied as potential Alzheimer's disease areas, as well as different scaling). The threshold was prespecified in only six studies (Clerici 2009; Drzezga 2005; Fellgiebel 2007; Galluzzi 2010; Herholz 2011; Schmand 2012). ¹⁸F‐FDG positivity ranged from 10.5% (Mosconi 2004) to 74% (Galluzzi 2010) (Table 6). Conversion to ADD ranged from 22% (Mosconi 2004) to 50% (Berent 1999; Clerici 2009; Ossenkoppele 2012a).
5. Summary of test accuracy at study level for conversion to Alzheimer’s disease dementia.
| Studies included in meta‐analysis | ||||
| Study ID | Participants (n) | Sensitivity (%) | Specificity (%) | % of MCI with ¹⁸F‐FDG PET positivity |
| Anchisi 2005 | 48 | 93 | 82 | 40 |
| Arnáiz 2001 | 20 | 67 | 82 | 40 |
| Berent 1999 | 20 | 70 | 70 | 50 |
|
Chételat 2003 (temporo‐parietal brain region) |
17 | 100 | 100 | 41 |
| Clerici 2009 | 26 | 92 | 15 | 88 |
| Drzezga 2005 | 30 | 92 | 89 | 43 |
| Fellgiebel 2007 | 16 | 100 | 75 | 44 |
| Galluzzi 2010 | 38 | 79 | 29 | 74 |
| Herholz 2011 (ADNI study) | 94 | 57 | 67 | 40 |
| Mosconi 2004 | 37 | 38 | 97 | 10.5 |
| Nobili 2008 | 33 | 82 | 91 | 33 |
| Ossenkoppele 2012a | 12 | 75 | 88 | 33 |
| Ossenkoppele 2012b | 12 | 83 | 100 | 42 |
| Pardo 2010(Reader 1) | 18 | 25 | 60 | 32 |
| Studies included only in descriptive analysis | ||||
|
Chételat 2003 (posterior cingulate brain region) |
17 | 100 | 90 | 47 |
| Landau 2010 (ADNI study) | 85 | 75 | 47 | 60 |
| Pardo 2010 (Reader 2) | 17 | 33 | 30 | 53 |
| Schmand 2012 (ADNI study) | 98 | 24 | 82 | 20 |
ADNI: Alzheimer's Disease neuroimaging initiative
Duration of follow‐up was reported as the mean and standard deviation (SD), or the median, or a range of values.
Methodological quality of included studies
We assessed methodological quality using the QUADAS‐2 tool (Whiting 2011). We present the review authors’ judgements about each methodological quality item for each included study in the Characteristics of included studies table and Figure 2. The overall methodological quality of included study cohorts is summarised in Figure 3.
2.
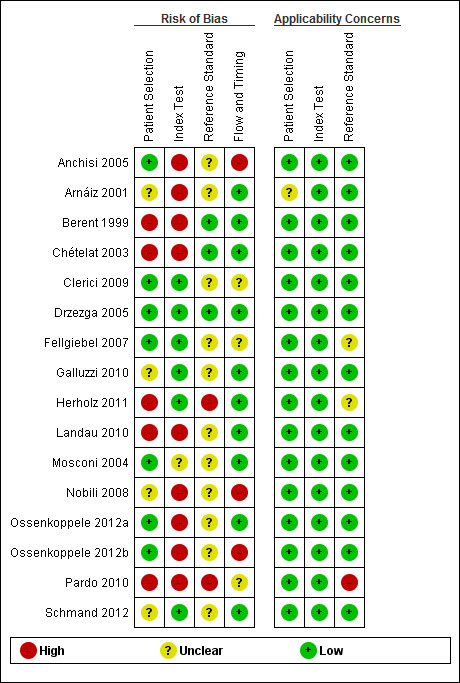
Risk of bias and applicability concerns summary: review authors' judgements about each domain for each included study
3.
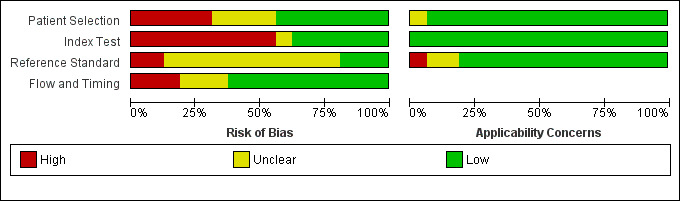
Risk of bias and applicability concerns graph: review authors' judgements about each domain presented as percentages across included studies
In the participant selection domain, we considered five studies (Berent 1999; Chételat 2003; Herholz 2011; Landau 2010; Pardo 2010) to be at high risk of bias because the participants were not consecutively or randomly enrolled. We had excluded studies with a case‐control design because we only considered data on performance of the index test to discriminate between participants with MCI who convert to dementia and those who remained stable. We considered four studies (Arnáiz 2001; Galluzzi 2010; Nobili 2008; Schmand 2012) to be at unclear risk of bias due to poor reporting on sampling procedure and exclusion criteria. We considered the remaining seven (44%) studies to be at low risk of bias.
In the index test domain, we considered nine (56%) studies (Anchisi 2005; Arnáiz 2001; Berent 1999; Chételat 2003; Landau 2010; Nobili 2008; Ossenkoppele 2012a; Ossenkoppele 2012b; Pardo 2010) to be at high risk of bias because the threshold used was not prespecified and the optimal cut‐off level was determined from ROC analyses; therefore, the accuracy of the ¹⁸F‐FDG biomarker reported in these studies appeared to be an overestimate. We considered one study (Mosconi 2004) to be at unclear risk of bias due to poor reporting. We considered the remaining six (38%) studies to be at low risk of bias.
In the reference standard domain, we considered 11 studies (69%) to be at unclear risk of bias, mainly because they did not report whether clinicians conducting follow‐up were aware of the initial ¹⁸F‐FDG biomarker analysis results. One of the 11 studies (Fellgiebel 2007) did not clearly report the reference standards used for diagnosing ADD. We considered two studies (Herholz 2011; Pardo 2010) to be at high risk of bias because they failed to provide information on either item in this domain. We were not able to obtain the information about how the reference standard was obtained and by whom, due to poor reporting. We considered the remaining three studies (Berent 1999; Chételat 2003; Drzezga 2005) to be at low risk of bias.
In the flow and timing domain, we judged 10 studies (62%) to be at low risk of bias because all participants were accounted for in the analysis or the reasons for missing data were given, and/or the time interval between index test and reference standard was appropriate (duration of follow‐up longer than one year). We considered three studies (19%) to be at high risk of bias, either because a large number of participants were excluded from the analyses (Anchisi 2005; Ossenkoppele 2012b) or because the interval between index test and reference standard was shorter than one year for some participants (Nobili 2008). We considered the remaining three studies (Clerici 2009Fellgiebel 2007; Pardo 2010) to be at unclear risk of bias due to poor reporting.
For assessment of applicability, we had no concern that the included participants and setting, the conduct and interpretation of the index test, and the target condition (as defined by the reference standard) in each of the included studies did not meet the review question. It should be noted that the lack of concern about applicability of the three domains mentioned above was based on the inclusion criteria set for the review. Considering the level of heterogeneity with respect to the index test (Table 5), it appears that the judgement about applicability may be optimistic.
Findings
The key characteristics of each study are summarised in Table 4 and Table 5. The summary of main results for 16 included studies is presented in the Table 1.
¹⁸F‐FDG PET for Alzheimer's disease dementia
We identified three studies that recruited participants from the same Alzheimer’s disease Neuroimaging Initiative (ADNI) cohort (Herholz 2011; Landau 2010; Schmand 2012). The largest ADNI study (Herholz 2011) was included in the analysis.
The Chételat 2003 study assessed two different discriminating brain regions (temporo‐parietal and posterior cingulate). We included data for the temporo‐parietal region, since it represents a typical and 'wider' brain area that is potentially involved in conversion to ADD.
In Pardo 2010 the PET scan was interpreted by two raters. As already mentioned, visual/qualitative reading of the ¹⁸F‐FDG PET scan is accepted as the general standard in nuclear medicine (similar to other imaging modalities). It is, therefore, heavily dependent on the physician’s prior experience and training. The quantitative assessment plays a rather complementary role in PET evaluations. The physician usually decides based on his or her own visual‐qualitative assessment. We included data from Reader 1 because it is very likely that Reader 1 is more experienced in interpreting brain PET scans. This rater provided more accurate estimates of the diagnostic accuracy of Alzheimer's disease type imaging comparing to diagnosis on follow‐up.
Individual study estimates of sensitivity and specificity are shown in Figure 4 for each of the 14 studies (150 cases and 271 non‐cases) that evaluated ADD. The sensitivity values ranged from 25% to 100% while the specificity values ranged from 29% to 100%. The criteria for ¹⁸F‐FDG PET positivity varied between studies. Ten studies performed PET analysis based on the combination of visual analysis (qualitative) and rCGMr estimations (quantitative), and four studies only referred to visual PET inspections (qualitative‐only analysis). A range of different thresholds were used. The different brain regions were studied as potential Alzheimer's disease areas as well as different scaling.
4.
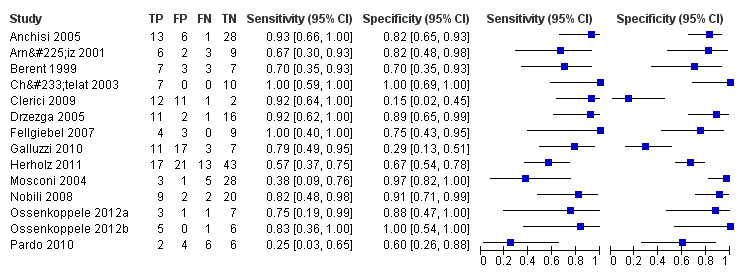
Forest plot of ¹⁸F‐FDG PET Conversion from MCI to AD (with Reader 1 Pardo 2010, Chetelat 2003 temporo‐parietal region and Herholz 2011 ADNI study).
The summary ROC curve presenting the accuracy of ¹⁸F‐FDG PET across the 14 studies is shown in Figure 5. Because of the variation in thresholds and measurement of ¹⁸F‐FDG uptake in brain regions, we did not estimate a summary sensitivity and specificity. However, we derived estimates of sensitivity and likelihood ratios at fixed values of specificity from the HSROC model we fitted to produce the summary ROC curve. At the median specificity of 82%, the estimated sensitivity was 76% (95% confidence interval (CI): 53.80 to 89.70), the positive likelihood ratio was 4.03 (95% CI: 2.97 to 5.47), and the negative likelihood ratio was 0.34 (95% CI: 0.15 to 0.75).
5.
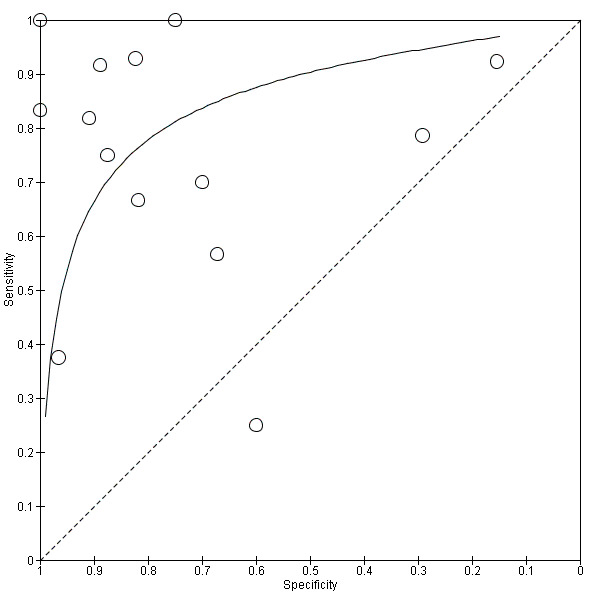
Summary ROC plot of ¹⁸F‐FDG PET Conversion from MCI to AD (with Reader 1 Pardo 2010, Chetelat 2003 temporo‐parietal region and Herholz 2011 ADNI study).
In order to demonstrate whether the choice of ADNI study or discriminating brain region or reader assessment made any differences to the pooled estimate, we performed five additional analyses. At the median specificity of 82%, the estimated sensitivity ranged from 74% to 77%. There was no impact on our findings.
¹⁸F‐FDG PET for all types of dementia (combined AD and non‐AD dementia)
Five studies (64 cases and 42 non‐cases) evaluated the accuracy of ¹⁸F‐FDG PET for all dementia (Figure 6) in addition to evaluating ADD. The sensitivity values ranged from 46% to 95%, while the specificity values ranged from 29% to 100%. Two studies used a semi‐quantitative threshold while the other three used visual inspection to determine test positivity. Meta‐analysis was not performed because the studies were too few and their sample sizes were too small. Figure 7 shows study specific estimates of sensitivity and specificity in ROC space together with their 95% confidence intervals.
6.
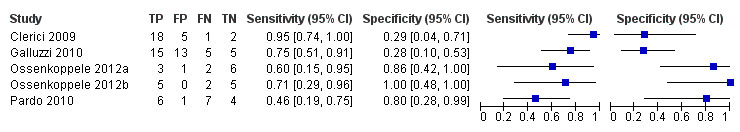
Forest plot of ¹⁸F‐FDG PET Conversion from MCI to All dementia (with Reader 1 Pardo 2010).
7.
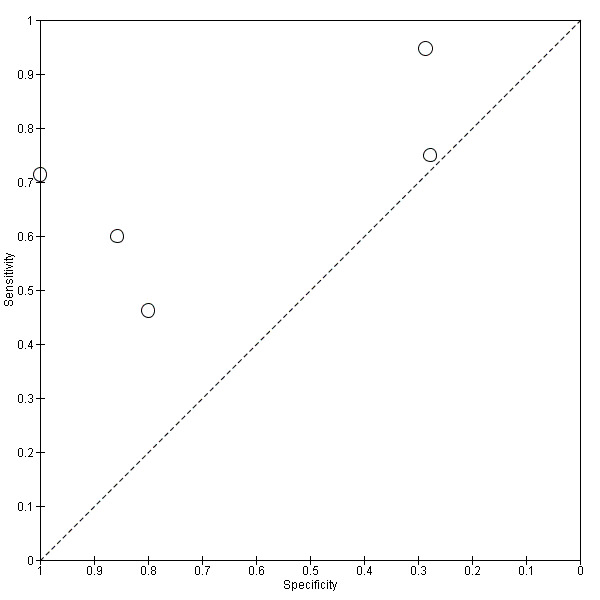
Summary ROC plot of ¹⁸F‐FDG PET Conversion from MCI to All dementia (with Reader 1 Pardo 2010).
The estimate of sensitivity and specificity for the Pardo 2010 study was 46% and 80% for Reader 1, and 64% and 0% for the Reader 2.
Investigation of heterogeneity
We visually inspected the summary of ROC space (see Figure 5). The results of the included studies show a great deal of heterogeneity. The values for both sensitivity and specificity were mainly over 80% in a number of studies (Anchisi 2005; Chételat 2003; Drzezga 2005; Fellgiebel 2007; Fellgiebel 2007; Ossenkoppele 2012a; Ossenkoppele 2012b). In the remaining studies those values were less than 80% or a sensitivity value higher than 80% was accompanied by a very low specificity value and vice versa (Clerici 2009; Galluzzi 2010; Mosconi 2004).
Interpretation of PET scan
There was little evidence that the HSROC model which allowed the shape, accuracy and threshold parameters to differ between those studies using a combination of visual inspection and quantitative rCGMr evaluation interpretation and those using visual‐only interpretation provided an improvement in fit over the basic model where a single HSROC curve (Chi² = 1.7; df = 3; P = 0.64).
Prespecifying threshold regarding rCGM
This investigation relates to the 10 studies in which semi‐quantitative estimation was used. Meta‐regression revealed little evidence of an improvement in fit between the basic model and the model that allowed the parameters to differ between those studies that did and did not specify a threshold (Chi² = 93.5 ‐ 88.3 = 5.2; df = 3; P = 0.16).
The remaining planned investigations (for instance, the effect of the spectrum of participants, referral centres, ¹⁸F‐FDG uptake reduction brain regions, inadequate blinding or loss to follow‐up) were not possible due to the limited number of studies available for each analysis. We conducted sensitivity analyses for type of clinical diagnosis for MCI and for type of reference standard.
Sensitivity analyses
Of the 14 studies that evaluated ¹⁸F‐FDG PET for ADD, 12 used Petersen criteria for diagnosing MCI. To explore the impact of type of diagnostic criteria on the summary estimates, we excluded two studies (Arnáiz 2001; Berent 1999) that used the Global Deterioration Scale and AAMI respectively as the diagnostic criteria. There was no impact on our findings.
Eleven studies used NINCDS‐ADRDA as the reference standard. To explore the impact of the type of reference standard on the summary estimates, we excluded one study (Fellgiebel 2007) that used CDR = 1, one study (Herholz 2011) that used a non‐specified clinical dementia rating and the Alzheimer's Disease Assessment Scale (ADAS‐cog), and one study (Pardo 2010) where the reference standard used was not reported. There was no impact on our findings.
Discussion
Summary of main results
For this review we identified 16 studies assessing the diagnostic accuracy of ¹⁸F‐FDG PET for conversion from mild cognitive impairment (MCI) to Alzheimer's disease dementia or to other forms of dementia. The key results are presented in Table 1. Due to variation in thresholds and measurement of ¹⁸F‐FDG uptake in brain regions, we estimated a summary ROC curve for studies that evaluated conversion from MCI to Alzheimer's disease dementia. We did not estimate a summary sensitivity and specificity on the curve because with mixed thresholds a summary point lacks a clinically meaningful interpretation. At the median specificity of 82%, the estimated sensitivity of ¹⁸F‐FDG PET for conversion to Alzheimer's disease dementia derived from the summary ROC curve was 76% (95% confidence interval (CI): 53.80 to 89.70).
We did not pool data for the five studies that evaluated conversion from MCI to all types of dementia. The sensitivities were between 46% and 95%, and specificities were between 29% and 100%.
¹⁸F‐FDG PET for Alzheimer’s disease dementia
We identified three Alzheimer's Disease Neuroimaging Initiative (ADNI) studies (Herholz 2011; Landau 2010; Schmand 2012). ADNI is a multicentre project with approximately 50 medical centres and university sites across the United States and Canada; it has the primary goal of evaluating magnetic resonance imaging (MRI), positron emission tomography (PET), cerebrospinal fluid (CSF), and clinical measures acquired serially over two to three years. The aims of the three studies differed. Herholz 2011 demonstrated the validity of ¹⁸F‐FDG PET scores as an imaging biomarker for clinical trials to prevent dementia in people with MCI. Longitudinal ADNI data showed that PET scores provide much higher test–retest reliability than the Alzheimer's Disease Assessment Scale (ADAS‐cog), which is the most frequent outcome measure used in dementia trials. They argue that a PET scan evaluation may also provide a useful measure of disease progression, as the power for one‐year studies in people with MCI is similar to what they provide for two‐year studies based on progression of ADAS‐cog scores. Landau 2010 evaluated the prognostic ability of genetic, CSF, neuroimaging, and cognitive measurements obtained in the same participants. The authors concluded that baseline ¹⁸F‐FDG PET and episodic memory predict conversion to ADD, whereas P‐tau181p/Aβ1‐42 and, marginally, ¹⁸F‐FDG PET predict longitudinal cognitive decline. Schmand 2012 examined the value of neuropsychological assessment, structural MRI, CSF biomarkers, and ¹⁸F‐FDG PET scanning with respect to prediction of conversion from MCI to ADD. The authors’ practical conclusions were that these markers are not very useful, either with respect to the diagnosis of ADD beyond the age of 75, or with respect to the prediction of conversion to ADD within a few years. In younger people, all four techniques were equally informative, except for ¹⁸F‐FDG PET, which lost its predictive potential. We created 2 x 2 tables cross‐relating index test results of the reference standard for each ADNI study. The sensitivity and specificity values vary in those studies. All three studies used a combination of visual inspection and quantitative (rCGMr) evaluation of the PET scan, but the threshold, brain regions, image scaling and analysis used differed between them. The number of participants with positive ¹⁸F‐FDG test at baseline also varied (Table 6). Although the samples were recruited from the same ADNI cohort, it appears that test accuracy varies due to characteristics of the participants and index test domains. We have included the largest ADNI study (Herholz 2011) in the analysis.
The Chételat 2003 study assessed both the temporo‐parietal and posterior cingulate regions. We included data for the temporo‐parietal region. Although the posterior cingulate cortex represents the brain area in which hypometabolism occurs in the earliest disease stage (Lucignani 2006), the bilateral temporo‐parietal hypometabolism is the standard ¹⁸F‐FDG PET finding, which is also highly correlated with the pathologic diagnosis of ADD (Hoffman 2000). Moreover, it has been suggested that hypometabolism or hypoperfusion or both in the inferior parietal lobules are the most reliable functional indicators of progression from amnestic MCI to ADD, while changes in the posterior cingulate cortex are most likely non‐specific (Schroeter 2009).
In addition, in the Pardo 2010 study two independent blinded raters with experience in PET evaluated each image as normal or as having an Alzheimer's disease or fronto‐temporal dementia (FTD) pattern. The physicians usually based the decision on their own visual‐qualitative assessment. We therefore included data from Reader 1 because it is very likely that Reader 1 was more experienced in interpreting brain PET scans.
In order to explore whether the choice of ADNI study or discriminating brain region or reader assessment make any differences to the pooled estimate, we performed five additional analyses. The estimated sensitivity values at the median specificity of 82% were similar to the sensitivity value in our analysis (ranging from 74% to 77%).
In all studies ¹⁸F‐FDG PET data evaluation involved qualitative (visual) assessment of the PET scans, and in some of them this visual analysis was supported by the addition of semi‐quantitative data (mainly through rCGMr estimations), derived from quantification of brain PET images. In particular, 12 of the 16 studies applied a combination of qualitative and quantitative assessment, while the remaining four were based only on visual data analysis. This discrepancy introduces a degree of heterogeneity into our analysis. Moreover, and as already mentioned, the application of different thresholds in PET studies for the specific brain area examined and the glucose metabolism ratio applied as a threshold for discriminating a pathological from a normal scan, introduces a further degree of heterogeneity. The use of quantification methods is not the norm in routine clinical practice. However, their deployment has become more popular in recent years with the development of new software, which renders quantification simpler. In general terms, there are two categories of quantification methods: the ‘traditional’ region of interest (ROI) based method, which are manually operated, and the newer voxel‐based, which provide relatively automated results. The ROI‐based method has the disadvantage of being operator‐dependent and therefore time‐intensive. This approach requires a high level of neuro‐anatomical knowledge by the physician, which is particularly demanding in the case of ADD, in which several specific brain areas need to be assessed. The advent of newer voxel‐by‐voxel‐based techniques ((like SPM (statistical parametric mapping), 3D‐SSP (3D stereotactic surface projection) and PMOD software package, which were used in the majority of the studies involved in this meta‐analysis)) that permit normalisation of brain images into a stereotactic space and are less biased and provide higher spatial resolution than the ‘classical’ ROI‐based semi‐quantitative methods, increase the physician’s diagnostic accuracy in the interpretation of a brain PET scan, leading to more reliable results (Lucignani 2006; Patterson 2010; Silverman 2009). In this context, the application of different quantification strategies is another factor that could introduce heterogeneity between studies in this review.
Duration of follow‐up is also important in predicting conversion to ADD. The variability in the duration of follow‐up was considerable in the included studies (Table 5). The normal conversion rate of MCI to ADD is between 8% and 16% per year (Mitchell 2009), but the conversion rates in our review ranged from 22% to 50%. There was a positive correlation between follow‐up time and percentage of conversion. For example, in Berent 1999, Clerici 2009 and Ossenkoppele 2012a, the conversion rate from MCI was 50%, with the duration of follow‐up ranging from two to three years. On the other hand, the lowest conversion rates of 22% and 25% were found in the studies (Mosconi 2004; Fellgiebel 2007) with the shortest duration of follow‐up (mean 12 ± 0.6 and 19.6 ± 9.0 months respectively). Conversion rates from MCI could have influenced the test results. However, we were not able to formally investigate the effect of duration of follow‐up on the accuracy of the ¹⁸F‐FDG PET, due to a high level of heterogeneity and the small number of included studies.
We used the QUADAS‐2 tool to assess methodological quality. We identified methodological issues in all the QUADAS‐2 domains. Assessment of quality is dependent on adequate reporting, and QUADAS scoring was challenging because of insufficient detail. Poor reporting about sampling procedures led mainly to an unclear risk of bias or contributed to a high risk of bias in the participant selection domain. Although the reference standard was regarded as adequate to correctly classify the target condition, poor reporting on blinding of dementia assessors led to an unclear risk of bias in the reference domain in the majority of included studies.
¹⁸F‐FDG PET for other forms of dementia
We were not able to evaluate the accuracy of the index test for conversion from MCI to non‐Alzheimer’s disease dementia, due to insufficient data. Only five included studies (Clerici 2009; Galluzzi 2010; Ossenkoppele 2012a; Ossenkoppele 2012a; Pardo 2010) reported a small number of converters to non‐Alzheimer’s dementia. Clerici 2009 and Galluzzi 2010 reported six converters respectively (two FTD; four Lewy body dementia (LBD); six non‐Alzheimer's Disease non‐specified). The remaining three studies reported only one converter each (three FTD).
As a result of the information available from these five studies, we considered the new target condition (Figure 6 and Figure 7). We did not perform meta‐analysis because the studies were few and small, and there was considerable heterogeneity. Our review therefore suggests that there is inadequate evidence available at present to address the accuracy of the ¹⁸F‐FDG PET scan to identify those people with MCI who will convert to all types of dementia (combined Alzheimer's and non‐Alzheimer's disease dementia).
Strengths and weaknesses of the review
One strength of our review is that the included studies represent probably the majority of studies about this question. We conducted an extensive electronic search strategy, and where a study did not present all relevant data we contacted the study authors and obtained usable data for seven studies (Anchisi 2005; Clerici 2009; Galluzzi 2010; Landau 2010; Ossenkoppele 2012a; Ossenkoppele 2012b; Schmand 2012).
Our review has some limitations. First, the clinical diagnosis of ADD or other forms of dementia is imperfect, so that the findings from studies with post‐mortem confirmation of the diagnosis are more convincing than those from studies with a clinical diagnosis in the evaluation of the accuracy of PET imaging for the early detection of the dementia process in people with MCI.
The findings are based on studies with poor reporting and the majority of included studies were at an unclear risk of bias, mainly for the reference standard and for the participant selection domains. Although there was relative homogeneity in terms of scan acquisition protocol, the process followed and the fundamental evaluation approach that people demonstrating particular brain regions with reduced ¹⁸F‐FDG uptake represent potential MCI converters to ADD, according to the assessment of Index test domain more than 50% of studies were of poor methodological quality due to lack of a prespecified threshold. Index tests that require subjective interpretation (such as ¹⁸F‐FDG PET) are at high risk of bias for the index test domain compared to more objective tests with widely‐accepted thresholds. The Pardo 2010 study illustrates poor agreement between both experienced raters for the correlation between diagnosis at three‐year follow‐up and baseline ¹⁸F‐FDG PET scans classified as PET pattern (normal, ADD, and FTD).
Due to the limited number of included studies and the meta‐analytic techniques, we were unable to formally assess the sources of heterogeneity, or to disentangle the reasons for the test accuracy results varying between studies, so even those factors that we have been able to test cannot be excluded as reasons for the heterogeneity.
Applicability of findings to the review question
We had no concerns that the included participants and setting, the conduct and interpretation of the index test, and the target condition (as defined by the reference standard) in each of the included studies did not address the review question: Could ¹⁸F‐FDG PET scan predict whether people with MCI would convert clinically to dementia? However, due to limited number of included studies and levels of heterogeneity in the three domains mentioned above, it was difficult to determine to what extent the findings from this meta‐analysis can be applied to clinical practice.
Authors' conclusions
Implications for practice.
Positron emission tomography (PET) is a unique diagnostic tool, since it can assess pathophysiologic and metabolic processes before any anatomic changes have taken place. This capacity of PET could potentially lead to several future applications in dementias, and generally in the field of neurosciences. ¹⁸F‐FDG PET is becoming increasingly accepted in the diagnostic approach to Alzheimer's disease and related disorders. Moreover, Silverman 2001 has developed a cost‐effectiveness algorithm for assessment of geriatric patients presenting with early symptoms of cognitive decline; according to this, PET can be incorporated into the diagnostic work‐up of these patients, when the ‘standard’ diagnostic testing does not reveal an underlying cause for the cognitive decline (Moulin‐Romsee 2005; Silverman 2001; Silverman 2002).
The results of the included studies show a great deal of heterogeneity, encompassing both the values which would render the technology 'useless' and some which indicate a valuable diagnostic tool. Given the considerable variability and specificity values, the heterogeneity in the conduct and interpretation of the test, and the lack of defined thresholds for determining test positivity, the current evidence does not support the routine use of a ¹⁸F‐FDG PET scan in clinical practice. ¹⁸F‐FDG PET scan is a high‐cost investigation, and it is therefore important to clearly demonstrate its accuracy and to standardise the process of ¹⁸F‐FDG PET diagnostic modality prior to extending its use.
Implications for research.
The understanding of the functions of the nervous system and the biology of its disorders remains a big challenge. The attempt to comprehend the molecular basis of such disorders, and to potentially interfere in the natural history of the disease, is not driven just by theoretical or purely scientific needs. In the coming decades the number of adults over 65 years is expected to increase dramatically. In this context, the development and application of functional diagnostic imaging modalities that have the opportunity to detect metabolic changes before any macroscopic anatomical changes take place, and furthermore can achieve this with the highest accuracy, will be pivotal in selecting those people who would be candidates and would benefit most from the application of such treatments.
The ¹⁸F‐FDG PET represents a modality that can reflect biochemical/molecular changes before respective morphological imaging modalities detect them. PET assesses cerebral metabolism by measuring glucose utilisation with the use of the radiotracer ¹⁸F‐FDG, a glucose analogue, which is trapped in the neuronal cell after undergoing the first metabolic step of phosphorylation by hexokinase. Since neuronal activity depends on the continuous supply of energy, the assessment of glucose consumption by the cells is indicative of neuronal integrity and function. The ability of PET to serve as a biomarker of dementia has already been highlighted (Dubois 2007; McKhann 2011). Moreover, a recent meta‐analysis demonstrated that ¹⁸F‐FDG PET is the strongest individual positive predictive biomarker of short‐term incident dementia in MCI (Frisoni 2013). However, energy metabolism, reflected by ¹⁸F‐FDG distribution, is not a specific process. Neurodegenerative diseases are based on complex and overlapping molecular processes, and it is known that the metabolic pattern particularly seen in ADD is a complicated one, resulting from neurochemical changes, neuronal disconnection effects and neuronal cell loss, several of which are probably not detected by ¹⁸F‐FDG PET, due the non‐specific nature of ¹⁸F‐FDG (Hoffman 2000). Moreover, PET as a technique carries the inherent drawback of low spatial resolution and subsequently provides anatomical information of low accuracy in comparison with computed tomography or magnetic resonance imaging. The application of newer radiopharmaceuticals (e.g. the PET tracer ¹¹C‐PIB that specifically binds fibrillar amyloid‐beta plaques), which reflect different mechanisms that contribute to the progression from MCI to ADD and other dementias (Brück 2013), and the advent of newer hybrid imaging modalities, like PET/MRI, that provide complementary anatomic, physiologic, metabolic, and functional information about the brain (Catana 2012) could therefore significantly aid our understanding of brain pathophysiology, regarding very early neurodegeneration.
Nevertheless, the results of the present analysis do not suggest the routine use of ¹⁸F‐FDG PET for detection of those people with MCI who will develop ADD. Our review carries some limitations, since generally, the methodological and reporting quality of all considered papers was relatively poor. Therefore, future studies with more uniform approaches to thresholds, analysis and study conduct with particular consistency in length of follow‐up may provide a more homogeneous estimate than the one that has been available from the included studies we have identified, in order to determine the exact role of ¹⁸F‐FDG PET in the diagnostic algorithm for such patients.
What's new
| Date | Event | Description |
|---|---|---|
| 23 February 2015 | Amended | Contact details updated. |
Acknowledgements
The authors would like to thank Anna Noel‐Storr, Trials Search Co‐ordinator of the Cochrane Dementia and Cognitive Improvement Group, for her assistance with writing the search strategy, searching and initial screening of search results. We would also like to thank Dr Karl Herholz for his essential comments in editing this review.
Appendices
Appendix 1. Sources searched and search strategies used
| Source | Search strategy | Hits retrieved |
| 1. MEDLINE In‐process and other non‐indexed citations and MEDLINE 1950‐present (January 2013) (Ovid SP) | 1. exp Dementia/ 2. Cognition Disorders/ 3. (alzheimer$ or dement$).ti,ab. 4. ((cognit$ or memory or cerebr$ or mental$) adj3 (declin$ or impair$ or los$ or deteriorat$ or degenerat$ or complain$ or disturb$ or disorder$)).ti,ab. 5. (forgetful$ or confused or confusion).ti,ab. 6. MCI.ti,ab. 7. ACMI.ti,ab. 8. ARCD.ti,ab. 9. SMC.ti,ab. 10. CIND.ti,ab. 11. BSF.ti,ab. 12. AAMI.ti,ab. 13. MD.ti,ab. 14. LCD.ti,ab. 15. QD.ti,ab. 16. AACD.ti,ab. 17. MNCD.ti,ab. 18. MCD.ti,ab. 19. ("N‐MCI" or "A‐MCI" or "M‐MCI").ti,ab. 20. or/1‐19 21. "Positron emission tomography".ti,ab. 22. *Positron‐Emission Tomography/ 23. PET.ti,ab. 24. "FDG‐PET".ti,ab. 25. ("PET‐FDG" or "18f‐fdg" or "fdg uptake").ti,ab. 26. fluodeoxyglucose*.ti,ab. 27. fluorodexyglucose*.ti,ab. 28. Fluorodeoxyglucose F18/ 29. or/21‐28 30. glucose metabolism.ti,ab. 31. hypometabolism.ti,ab. 32. cerebral metabolic rate.ti,ab. 33. metabolic activity.ti,ab. 34. hypoperfusion.ti,ab. 35. (CMRgl or rCMRGlu).ti,ab. 36. or/30‐35 37. 20 and 29 and 36 38. disease progression/ 39. (dement* or alzheimer* or AD or MCI).ti,ab. 40. exp *Dementia/ 41. 39 or 40 42. 41 and 38 43. 29 and 42 44. 37 or 43 45. exp Dementia/di 46. 36 and 45 47. 44 or 46 |
July 2012: 1480 January 2013: 120 |
| 2. EMBASE 1980‐2013 January week 2 (Ovid SP) |
1. exp dementia/ 2. (alzheimer* or dement*).ti,ab. 3. ((cognit* or memory or cerebr* or mental*) adj3 (declin* or impair* or los* or deteriorat* or degenerat* or complain* or disturb* or disorder*)).ti,ab. 4. (forgetful* or confused or confusion).ti,ab. 5. MCI.ti,ab. 6. ACMI.ti,ab. 7. ARCD.ti,ab. 8. SMC.ti,ab. 9. CIND.ti,ab. 10. BSF.ti,ab. 11. AAMI.ti,ab. 12. LCD.ti,ab. 13. QD.ti,ab. 14. AACD.ti,ab. 15. MNCD.ti,ab. 16. MCD.ti,ab. 17. ("N‐MCI" or "A‐MCI" or "M‐MCI").ti,ab. 18. ("nMCI" or "aMCI" or "mMCI").ti,ab. 19. or/1‐18 20. "positron emission tomography".ti,ab. 21. *positron emission tomography/ 22. PET.ti,ab. 23. "FDG‐PET".ti,ab. 24. ("PET‐FDG" or "18f‐fdg" or "fdg uptake").ti,ab. 25. fluodeoxyglucose*.ti,ab. 26. fluorodexyglucose*.ti,ab. 27. fluorodeoxyglucose f 18/ 28. or/20‐27 29. glucose metabolism.ti,ab. 30. hypometabolism.ti,ab. 31. "cerebral metabolic rate*".ti,ab. 32. metabolic activity.ti,ab. 33. hypoperfusion.ti,ab. 34. (CMRgl or rCMRGlu).ti,ab. 35. or/29‐34 36. 19 and 28 and 35 37. disease course/ 38. (dement* or alzheimer* or AD or "cognit* impair*" or MCI).ti,ab. 39. exp dementia/ 40. 38 or 39 41. (diagnosis or sensitivity or specificity or "disease progression" or converted or conversion).ti,ab. 42. 37 or 41 43. 40 and 42 44. 28 and 43 45. 36 or 44 |
July 2012: 3181 January 2013: 567 |
| 3. PSYCINFO 1806‐January week 2 2013 (Ovid SP) |
1. exp Dementia/ 2. (alzheimer* or dement*).ti,ab. 3. ((cognit* or memory or cerebr* or mental*) adj3 (declin* or impair* or los* or deteriorat* or degenerat* or complain* or disturb* or disorder*)).ti,ab. 4. (forgetful* or confused or confusion).ti,ab. 5. MCI.ti,ab. 6. ACMI.ti,ab. 7. ARCD.ti,ab. 8. SMC.ti,ab. 9. CIND.ti,ab. 10. BSF.ti,ab. 11. AAMI.ti,ab. 12. LCD.ti,ab. 13. QD.ti,ab. 14. AACD.ti,ab. 15. MNCD.ti,ab. 16. MCD.ti,ab. 17. ("N‐MCI" or "A‐MCI" or "M‐MCI").ti,ab. 18. ("nMCI" or "aMCI" or "mMCI").ti,ab. 19. or/1‐18 20. exp Positron Emission Tomography/ 21. "positron emission tomography".ti,ab. 22. PET.ti,ab. 23. "FDG‐PET".ti,ab. 24. ("PET‐FDG" or "18f‐fdg" or "fdg uptake").ti,ab. 25. fluodeoxyglucose*.ti,ab. 26. fluorodexyglucose*.ti,ab. 27. or/20‐26 28. "glucose metabolism".ti,ab. 29. hypometabolism.ti,ab. 30. "cerebral metabolic rate*".ti,ab. 31. metabolic activity.ti,ab. 32. hypoperfusion.ti,ab. 33. (CMRgl or rCMRGlu).ti,ab. 34. or/28‐33 35. 19 and 27 36. 34 and 35 |
July 2012: 479 January 2013: 59 |
| 4. Biosis previews 1926 to present (January 2013) (ISI Web of Knowledge) | Topic=(dementia OR cognition OR MCI OR alzheimer* OR AD OR lewy OR memory OR cognitive OR FTLD) AND Topic=("Positron emission tomography" OR PET OR "FDG‐PET" OR "PET‐FDG" OR "18f‐fdg" OR "fdg uptake" OR fluodeoxyglucose* OR fluorodexyglucose*) AND Topic=("glucose metabolism" OR hypometabolism OR "cerebral metabolic rate" OR "metabolic activity" OR hypoperfusion OR CMRgl OR rCMRGlu) Timespan=All Years. Databases=BIOSIS Previews. Lemmatization=On |
July 2012: 1176 January 2013: 83 |
| 5. Web of Science and conference proceedings (1945‐present ‐ January 2013) | Topic=(dementia OR cognition OR MCI OR alzheimer* OR AD OR lewy OR memory OR cognitive OR FTLD) AND Topic=("Positron emission tomography" OR PET OR "FDG‐PET" OR "PET‐FDG" OR "18f‐fdg" OR "fdg uptake" OR fluodeoxyglucose* OR fluorodexyglucose*) AND Topic=("glucose metabolism" OR hypometabolism OR "cerebral metabolic rate" OR "metabolic activity" OR hypoperfusion OR CMRgl OR rCMRGlu) Timespan=All Years. Databases=BIOSIS Previews. Lemmatization=On |
July 2012: 2082 January 2013: 150 |
| 6. LILACS (January 2013) (BIREME) | positron OR PET OR tomografía OR hypometabolism OR hypoperfusion OR CMRgl OR rCMRGlu [Words] and demências OR dementia OR dementias OR demência OR Alzheimer OR Alzheimers OR Alzheimer's OR cognitive OR cognitive OR cognitive OR cognition OR "déficit cognitive" OR cognición OR cognição OR Memória OR memory OR Memoria OR "frontotemporal lobar degeneration" OR "degeneração lobar frontotemporal" OR FTLD OR FTD OR "pick's disease" OR "primary progressive aphasia" [Words] | July 2012: 296 January 2013: 3 |
| TOTAL before de‐duplication | July 2012: 8694 January 2013: 982 |
|
| TOTAL after de‐dupe and first‐assess | July 2012: 149 January 2013: 248 |
|
1 exp Dementia/ 2 Cognition Disorders/ 3 Mild Cognitive Impairment/ 4 (alzheimer$ or dement$).ti,ab. 5 ((cognit$ or memory or cerebr$ or mental$) adj3 (declin$ or impair$ or los$ or deteriorat$ or degenerat$ or complain$ or disturb$ or disorder$)).ti,ab. 6 (forgetful$ or confused or confusion).ti,ab. 7 MCI.ti,ab. 8 ACMI.ti,ab. 9 ARCD.ti,ab. 10 SMC.ti,ab. 11 CIND.ti,ab. 12 BSF.ti,ab. 13 AAMI.ti,ab. 14 LCD.ti,ab. 15 AACD.ti,ab. 16 MNCD.ti,ab. 17 MCD.ti,ab. 18 or/1‐17 19 "Positron emission tomography".ti,ab. 20 exp Tomography, Emission‐Computed/ 21 PET.ti,ab. 22 tomograph*.ti,ab. 23 or/19‐22 24 FDG.ti,ab. 25 ("18f‐fdg" or 18fdg or fdg18).ti,ab. 26 Fluorodeoxyglucose.ti,ab. 27 Fluorodeoxyglucose F18/ 28 Glucose/ 29 glucose metabol*.ti,ab. 30 cerebral metabolic rate.ti,ab. 31 (CMRgl or rCMRGlu).ti,ab. 32 or/24‐31 33 18 and 23 and 32
34 exp Dementia/di
35 34 AND 32
36 33 OR 35
Appendix 2. Two‐by‐two tables
Table 1: Conversion from MCI to Alzheimer’s disease dementia
| Index test information | References standard information | |
| ADD present | ADD absent | |
| Index test positive | ¹⁸F‐FDG PET+ who convert to ADD (TP) | ¹⁸F‐FDG PET+ who remain MCI (FP) & ¹⁸F‐FDG PET+ who convert to non‐AD(FP) |
| Index test negative | ¹⁸F‐FDG PET‐ who convert to ADD (FN) | ¹⁸F‐FDG PET‐ who remain MCI (TN) & ¹⁸F‐FDG PET‐who convert to non‐AD (TN) |
Table 2: Conversion from MCI to non‐Alzheimer’s disease dementia
| Index test information | References standard information | |
| Non‐ADD present | Non‐ADD absent | |
| Index test positive | ¹⁸F‐FDG PET+ who convert to non‐ADD (TP) | ¹⁸F‐FDG PET+ who remain MCI (FP) & ¹⁸F‐FDG PET+ who convert to ADD (FP) |
| Index test negative | ¹⁸F‐FDG PET‐ who convert to non‐ADD (FN) | ¹⁸F‐FDG PET‐ who remain MCI (TN) & ¹⁸F‐FDG‐PET‐ who convert to ADD (TN) |
Table 3: Conversion from MCI to any forms of dementia
| Index test information | References standard information | |
| Dementia present (any form of dementia) | Dementia absent | |
| Index test positive | ¹⁸F‐FDG PET+ who convert to any forms of dementia (TP) | ¹⁸F‐FDG PET+ who remain MCI (FP) |
| Index test negative | ¹⁸F‐FDG PET‐ who convert to any forms of dementia (FN) | ¹⁸F FDG‐PET‐ who remain MCI (TN) |
Appendix 3. Appendix: Assessment of methodological quality table QUADAS‐2 tool
| DOMAIN | PATIENT SELECTION | INDEX TEST | REFERENCE STANDARD | FLOW AND TIMING |
| Description | Describe methods of participant selection: Describe included patients (prior testing, presentation, intended use of index test and setting): | Describe the index test and how it was conducted and interpreted | Describe the reference standard and how it was conducted and interpreted | Describe any participants who did not receive the index test(s) and/or reference standard or who were excluded from the 2 x 2 table (refer to flow diagram): Describe the time interval and any interventions between index test(s) and reference standard |
|
Signalling questions (yes/no/unclear) |
Was a consecutive or random sample of patients enrolled? | Were the index test results interpreted without knowledge of the results of the reference standard? | Is the reference standard likely to correctly classify the target condition? | Was there an appropriate interval between index test(s) and reference standard? |
| Was a case‐control design avoided? | If a threshold was used, was it prespecified? | Were the reference standard results interpreted without knowledge of the results of the index test? | Did all participants receive a reference standard? | |
| Did the study avoid inappropriate exclusions? | Did all participants receive the same reference standard? | |||
| Were all participants included in the analysis? | ||||
| Risk of bias: High/low/ unclear | Could the selection of participants have introduced bias? | Could the conduct or interpretation of the index test have introduced bias? | Could the reference standard, its conduct, or its interpretation have introduced bias? | Could the participant flow have introduced bias? |
| Concerns regarding applicability: High/low/ unclear | Are there concerns that the included participants do not match the review question? | Are there concerns that the index test, its conduct, or interpretation differ from the review question? | Are there concerns that the target condition as defined by the reference standard does not match the review question? |
Appendix 4. Appendix: Anchoring statements for quality assessment of ¹⁸F‐FDG‐PET biomarker diagnostic studies
Table 1: Review question and inclusion criteria
| Category | Review Question | Inclusion Criteria |
| Patients | Participants with mild cognitive impairment, no dementia | Participants fulfilling the criteria for the clinical diagnosis of MCI at baseline |
| Index Test | ¹⁸F‐FDG PET biomarker | ¹⁸F‐FDG PET biomarker |
| Target Condition | Alzheimer’s disease dementia (conversion from MCI to Alzheimer’s disease dementia) Any other forms of dementia (conversion from MCI to any other forms of dementia) |
Alzheimer’s disease dementia (conversion from MCI to Alzheimer’s disease dementia) Any other forms of dementia (conversion from MCI to any other forms of dementia) |
| Reference Standard | NINCDS‐ADRDA; DSM; ICD; McKeith criteria; Lund criteria; NINDS‐ARIEN criteria | NINCDS‐ADRDA; DSM; ICD; McKeith criteria; Lund criteria; NINDS‐ARIEN criteria |
| Outcome | N/A | Data to construct 2 x 2 table |
| Study Design | N/A | Longitudinal cohort studies and nested case‐control studies if they incorporate a delayed verification design (case‐control nested in cohort studies) |
Anchoring statements for quality assessment of ¹⁸F‐FDG PET biomarker studies
We provide some core anchoring statements for quality assessment of diagnostic test accuracy reviews of ¹⁸F‐FDG PET biomarker in dementia. These statements are designed for use with the QUADAS‐2 tool and are based on the guidance for quality assessment of diagnostic test accuracy reviews of IQCODE in dementia (Quinn 2014).
During the two‐day, multidisciplinary focus group and the piloting/validation of the guidance, it was clear that certain issues were key to assessing quality, while other issues were important to record but less important for assessing overall quality. To assist, we describe a 'weighting' system. Where an item is weighted 'high risk' then that section of the QUADAS‐2 results table is likely to be scored as at high risk of bias. For example in dementia diagnostic test accuracy studies, ensuring that clinicians performing dementia assessment are blinded to results of index test is fundamental. If this blinding was not present then the item on reference standard should be scored 'high risk of bias', regardless of the other contributory elements.
In assessing individual items, the score of 'Unclear' should only be given if there is genuine uncertainty. In these situations review authors will contact the relevant study teams for additional information.
Table 2: Anchoring statements to assist with assessment for risk of bias
| Question | Response and weighting | Explanation |
| Patient Selection | ||
| Was the sampling method appropriate? | No = high risk of bias Yes = low risk of bias Unclear = unclear risk of bias |
Where sampling is used, the designs least likely to cause bias are consecutive sampling or random sampling. Sampling that is based on volunteers or selecting participants from a clinic or research resource is prone to bias. |
| Was a case‐control or similar design avoided? | No = high risk of bias Yes = low risk of bias Unclear = unclear risk of bias |
Designs similar to case‐control that may introduce bias are those designs where the study team deliberately increase or decrease the proportion of participants with the target condition, which may not be representative. Some case‐control methods may already be excluded if they mix participants from various settings. |
| Are exclusion criteria described and appropriate? | No = high risk of bias Yes = low risk of bias Unclear = unclear risk of bias |
Study will be automatically graded unclear if exclusions are not detailed (pending contact with study authors). Where exclusions are detailed, the study will be graded as 'low risk' if exclusions are felt to be appropriate by the review authors. Certain exclusions common to many studies of dementia are: medical instability; terminal disease; alcohol/substance misuse; concomitant psychiatric diagnosis; other neurodegenerative condition. Exclusions are not felt to be appropriate if ‘difficult to diagnose’ patients are excluded. Post hoc and inappropriate exclusions will be labelled 'high risk' of bias. |
| Index Test | ||
| Was ¹⁸F‐FDG PET biomarker assessment/interpretation performed without knowledge of clinical dementia diagnosis? | No = high risk of bias Yes = low risk of bias Unclear = unclear risk of bias |
Terms such as “blinded” or “independently and without knowledge of” are sufficient and full details of the blinding procedure are not required. Interpretation of the results of the index test may be influenced by knowledge of the results of reference standard. If the index test is always interpreted prior to the reference standard then the person interpreting the index test cannot be aware of the results of the reference standard and so this item could be rated as ‘yes’. For certain index tests the result is objective and knowledge of reference standard should not influence the result, for example level of protein in cerebrospinal fluid; in this instance the quality assessment may be 'low risk' even if blinding was not achieved. |
| Were ¹⁸F‐FDG PET biomarker thresholds prespecified? | No = high risk of bias Yes = low risk of bias Unclear = unclear risk of bias |
For scales and biomarkers there is often a reference point (in units or categories) above which participants are classified as 'test positive'; this may be referred to as threshold; clinical cut‐off or dichotomisation point. A study is classified at high risk of bias if the authors define the optimal cut‐off post hoc based on their own study data, because selecting the threshold to maximise sensitivity and specificity may lead to overoptimistic measures of test performance. Certain papers may use an alternative methodology for analysis that does not use thresholds and these papers should be classified as not applicable. |
| Reference Standard | ||
| Is the assessment used for clinical diagnosis of dementia acceptable? | No = high risk of bias Yes = low risk of bias Unclear = unclear risk of bias |
Commonly‐used international criteria to assist with clinical diagnosis of dementia include those detailed in DSM‐IV and ICD‐10. Criteria specific to dementia subtypes include, but are not limited to, NINCDS‐ADRDA criteria for Alzheimer’s dementia; McKeith criteria for Lewy Body dementia; Lund criteria for frontotemporal dementia; and the NINDS‐AIREN criteria for vascular dementia. Where the criteria used for assessment are not familiar to the review authors or the Cochrane Dementia and Cognitive Improvement group (‘unclear’) this item should be classified as 'high risk of bias'. |
| Was clinical assessment for dementia performed without knowledge of the ¹⁸F‐FDG PET biomarker? | No = high risk of bias Yes = low risk of bias Unclear = unclear risk of bias |
Terms such as “blinded” or “independently and without knowledge of” are sufficient and full details of the blinding procedure are not required. Interpretation of the results of the reference standard may be influenced by knowledge of the results of index test. |
| Participant flow | ||
| Was there an appropriate interval between ¹⁸F‐FDG PET biomarker and clinical dementia assessment? | No = high risk of bias Yes = low risk of bias Unclear = unclear risk of bias |
As we test the accuracy of the ¹⁸F‐FDG PET biomarker for MCI conversion to dementia, there will always be a delay between the index test and the reference standard assessments. The time between reference standard and index test will influence the accuracy (Geslani 2005;Okello 2009;Visser 2006), and therefore we will note time as a separate variable (both within and between studies) and will test its influence on the diagnostic accuracy. We have set a minimum mean time to follow‐up assessment of 1 year. If more than 16% of participants have assessment for MCI conversion before 9 months this item will score ‘no’. |
| Did all participants get the same assessment for dementia regardless of ¹⁸F‐FDG PET biomarker? | No = high risk of bias Yes = low risk of bias Unclear = unclear risk of bias |
There may be scenarios where participants who score “test positive” on index test have a more detailed assessment. Where dementia assessment differs between participants this should be classified as high risk of bias. |
| Were all participants who received ¹⁸F‐FDG PET biomarker assessment included in the final analysis? | No = high risk of bias Yes = low risk of bias Unclear = unclear risk of bias |
If the number of participants enrolled differs from the number of paricipants included in the 2 x 2table then there is the potential for bias. If participants lost to drop‐out differ systematically from those who remain, then estimates of test performance may differ. If there are drop‐outs they should be accounted for; a maximum proportion of drop‐outs to remain at low risk of bias has been specified as 20%. |
| Were missing ¹⁸F‐FDG PET biomarker results or uninterpretable ¹⁸F‐FDG PET biomarker results reported? | No = high risk of bias Yes = low risk of bias Unclear = unclear risk of bias |
Where missing or uninterpretable results are reported, and if there is substantial attrition (we have set an arbitrary value of 50% missing data), this should be scored as ‘no’. If those results are not reported, this should be scored as ‘unclear’ and authors will be contacted. |
| Anchoring statements to assist with assessment for applicability | ||
| Question | Explanation | |
| Were included participants representative of the general population of interest? |
The included participants should match the intended population as described in the review question. The review authors should consider population in terms of symptoms; pre‐testing; potential disease prevalence; setting If there is a clear ground for suspecting an unrepresentative spectrum the item should be rated poor applicability. |
|
| Index test | ||
| Were sufficient data on ¹⁸F‐FDG PET biomarker application given for the test to be repeated in an independent study? | Variation in technology, test execution, and test interpretation may affect estimate of accuracy. In addition, the background, and training/expertise of the assessor should be reported and taken into consideration. If ¹⁸F‐FDG PET biomarker was not performed consistently this item should be rated poor applicability. | |
| Reference Standard | ||
| Was clinical diagnosis of dementia made in a manner similar to current clinical practice? | For many reviews, inclusion criteria and assessment for risk of bias will already have assessed the dementia diagnosis. For certain reviews an applicability statement relating to reference standard may not be applicable. There is the possibility that a form of dementia assessment, although valid, may diagnose a far larger proportion of participants with disease than usual clinical practice. In this instance the item should be rated poor applicability. | |
Data
Presented below are all the data for all of the tests entered into the review.
Tests. Data tables by test.
1. Test.
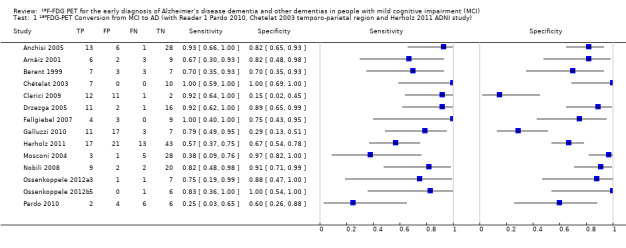
18FFDG‐PET Conversion from MCI to AD (with Reader 1 Pardo 2010, Chetelat 2003 temporo‐parietal region and Herholz 2011 ADNI study).
2. Test.
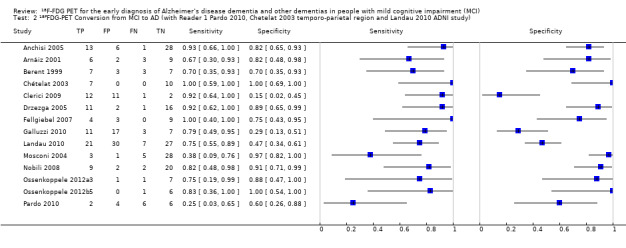
18FFDG‐PET Conversion from MCI to AD (with Reader 1 Pardo 2010, Chetelat 2003 temporo‐parietal region and Landau 2010 ADNI study).
3. Test.
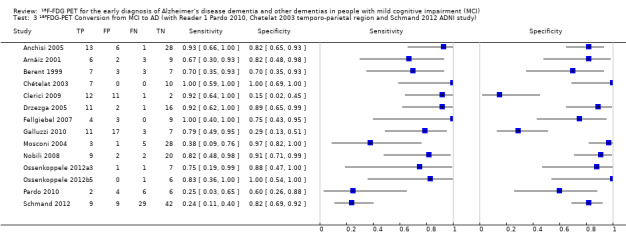
18FFDG‐PET Conversion from MCI to AD (with Reader 1 Pardo 2010, Chetelat 2003 temporo‐parietal region and Schmand 2012 ADNI study).
4. Test.
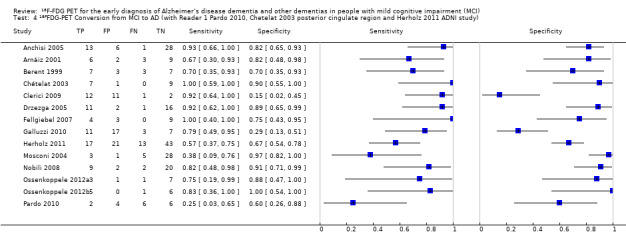
18FFDG‐PET Conversion from MCI to AD (with Reader 1 Pardo 2010, Chetelat 2003 posterior cingulate region and Herholz 2011 ADNI study).
5. Test.
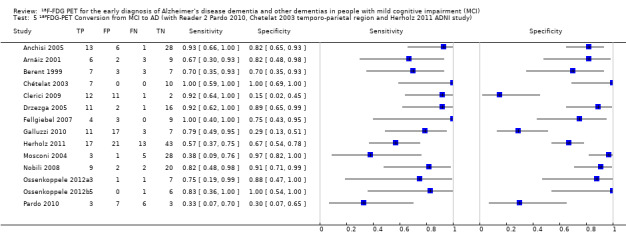
18FFDG‐PET Conversion from MCI to AD (with Reader 2 Pardo 2010, Chetelat 2003 temporo‐parietal region and Herholz 2011 ADNI study).
6. Test.

18FFDG‐PET Conversion from MCI to AD (with Reader 2 Pardo 2010, Chetelat 2003 posterior cingulate region and Herholz 2011 ADNI study).
7. Test.
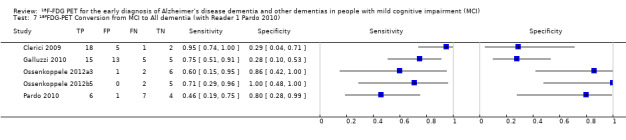
18FFDG‐PET Conversion from MCI to All dementia (with Reader 1 Pardo 2010).
8. Test.
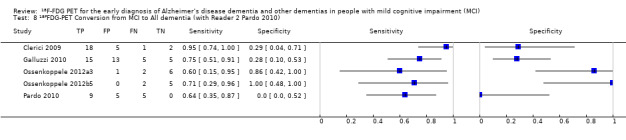
18FFDG‐PET Conversion from MCI to All dementia (with Reader 2 Pardo 2010).
Characteristics of studies
Characteristics of included studies [ordered by study ID]
Anchisi 2005.
| Study characteristics | |||
| Patient sampling | Consecutive sample of 67 right‐handed participants with mild cognitive impairment (Dr Perani email on 22nd October 2013) and 41 healthy controls. We only included data on performance of the index test to discriminate between people with MCI who converted to dementia and those who remained stable. Exclusion criteria: depression and behavioural disorders. No further information. |
||
| Patient characteristics and setting | 67 participants with MCI, diagnosed with the Mayo Clinical criteria (Petersen 2001) at baseline, were recruited from 4 centres enrolled in the Network for Efficiency and Standardisation of Dementia Diagnosis Fifth European Framework Research Project. 48 participants were assessed at follow‐up Gender: total sample 34 men; 33 women. MCI‐non‐converters: 20M, 14F; MCI‐converters: 5M; 9F; Drop‐outs: 9M, 10F Age: total sample mean 67.7 ± 8.3; MCI‐non‐converters: 65.0 ± 9.0; MCI‐converters: 71.1 ± 3.9; Drop‐outs: 70.1 ± 8.3 APOEɛ4: not reported MMSE: mean: total sample 27.7 ±1.7; MCI‐non‐converters: 28.4 ± 1.1; MCI‐converters: 26.6 ± 1.7; Drop‐outs: 27.2 ± 2.3 22.7 ± 11.0; Drop‐outs: 29.7 ± 19.2 Education: total sample mean 11.0 ± 4; MCI‐non‐converters: 11.2 ± 4.5; MCI‐converters: 9.1 ± 5.0; Drop‐outs: 12.2 ± 4.8 Sources of referral: primary care physicians (Dr Perani email on 22nd October 2013) Sources of recruitment: outpatients from 4 University Departments (Milan, Brescia, Cologne and Dresden) (Dr Perani email on 22nd October 2013) |
||
| Index tests | ¹⁸F‐FDG PET scan
Studies were performed according to previously described methods (Herholz 2002). The software packages SPM99 (Wellcome Department of Cognitive Neurology, University College, London, England) and MATLAB 6.1 (MathWorks Inc, Sherborn, Mass) were used for image pre‐processing. Images were spatially normalised to a reference stereotactic template (Montreal Neurological Institute, McGill University, Montreal, Quebec) by a 12‐parameter transformation and smoothed by a Gaussian kernel of 12x12x12‐mm voxels full width at half maximum.
The hypometabolic regions in participants with mild cognitive impairment who developed Alzheimer's disease compared with controls, obtained by SPM99 analysis, were used to define volume of interest (VOI). Using only clusters > 700 voxels, 3 VOIs in the temporo‐parietal regions and posterior cingulate cortex were selected. The regional sensorimotor ¹⁸F‐FDG uptake ratio (regional cerebral glucose metabolism) was used as the index test. Sensitivity and specificity data were reported for a threshold of 1.138, which was derived from ROC analysis. Threshold: rCGM‐r = 1.138; not prespecified At baseline 67 MCI. A number of test+ and test‐ participants reported only for 48 MCI participants who had follow‐up data: 19 with positive ¹⁸F‐FDG test (≤ 1.138); 29 with negative ¹⁸F‐FDG test (> 1.138) Index test was conducted before follow‐up. |
||
| Target condition and reference standard(s) | Target condition: conversion from MCI to Alzheimer's disease dementia Reference standard: NINCDS‐ADRDA criteria Unclear whether clinicians conducting follow‐up were aware of the ¹⁸F‐FDG PET results. |
||
| Flow and timing |
Duration of follow‐up: median follow‐up 12 months; range: 12 ‐ 27 months At baseline 67 MCI. At follow‐up: 48 participants: 14 MCI‐ADD; 34 MCI‐MCI (p 1730) Sensitivity: 92.9%; Specificity: 82.4%; NPV: 96.55%; PPV: 68.4% (at the threshold of rCGM‐r = 1.138; p1731) Number included in analysis: 48 TP = 13; FP = 6; FN = 1; TN = 28 (calculated in Review Manager 5) Loss to follow‐up: 19; no further information. |
||
| Comparative | |||
| Notes | We contacted the trial investigators who provided some additional data for the 'Patient selection' and 'Patient characteristics and setting' items (email on 22nd October 2013). | ||
| Methodological quality | |||
| Item | Authors' judgement | Risk of bias | Applicability concerns |
| DOMAIN 1: Patient Selection | |||
| Was a consecutive or random sample of patients enrolled? | Yes | ||
| Was a case‐control design avoided? | Yes | ||
| Did the study avoid inappropriate exclusions? | Unclear | ||
| Low | Low | ||
| DOMAIN 2: Index Test All tests | |||
| Were the index test results interpreted without knowledge of the results of the reference standard? | Yes | ||
| If a threshold was used, was it pre‐specified? | No | ||
| High | Low | ||
| DOMAIN 3: Reference Standard | |||
| Is the reference standards likely to correctly classify the target condition? | Yes | ||
| Were the reference standard results interpreted without knowledge of the results of the index tests? | Unclear | ||
| Unclear | Low | ||
| DOMAIN 4: Flow and Timing | |||
| Was there an appropriate interval between index test and reference standard? | Yes | ||
| Did all patients receive the same reference standard? | Yes | ||
| Were all patients included in the analysis? | No | ||
| High | |||
Arnáiz 2001.
| Study characteristics | |||
| Patient sampling | 20 participants with MCI were consecutively recruited from the Geriatric Clinic, Huddinge University Hospital, Sweden Exclusion criteria: not reported. |
||
| Patient characteristics and setting | 20 participants with MCI, diagnosed with the Global Deterioration Scale (Reisberg 1982) at baseline. These criteria were not prespecified in the protocol. Gender: Total: 8 women, 11 men; converters: 5F, 6M; non‐converters: 3F, 6M Age: converters 64.9 ± 8.3 years; non‐converters: 60.1 ± 8,4 years APOEɛ4: not reported MMSE: converters 26.7 ± 1.8; non‐converters: 27.2 ± 2.9 Education: 11.9 ± 2.2 years; non‐converters: 11.3 ± 2.0 years Sources of referral: not reported Sources of recruitment: Geriatric University Hospital Clinic |
||
| Index tests | ¹⁸F‐FDG PET scan The PET investigations were performed at the Uppsala University PET Center, using either of 2 scanners (GEMS 2048‐15B or GEMS 4096‐15WB, General Electric Medical Systems, Milwaukee, WI). The accumulation of 2‐[18F]‐fuoro‐deoxyglucose (¹⁸F‐DFG) in the brain was followed for 60 minutes. Regions of interest (ROIs) were defined on transaxial slices in relation to the slice where the basal ganglia (BG) structures were best visible. Based on Herholz 1999 and Jelic 1999, rCMRGlu were obtained for 3 regions of interest: the temporo‐parietal regions 13 mm above the level of the basal ganglia (TPabove), 13 mm below (TPbelow), and at the level of the basal ganglia (TP BG) in the left and the right hemispheres. Estimates of the rCMGlu were standardised to the sensorimotor area of the cortex 26 mm above the level of the basal ganglia. This region is thought to be relatively unchanged in people with AD (Duara 1986). The rate of glucose consumption in the brain was expressed in mol/min 3100 cm3 and calculated by a graphical method which used the lumped constant equal to 0.418 for correction of differences in utilisation between ¹⁸F‐FDG and glucose. Threshold: visual inspection: rCGMglc of left temporo‐parietal region above the basal ganglia (Model I); not prespecified Index test was conducted before follow‐up. |
||
| Target condition and reference standard(s) | Target condition: conversion from MCI to Alzheimer's disease dementia Reference standard: NINCDS‐ADRDA Unclear whether clinicians conducting follow‐up were aware of the ¹⁸F‐FDG PET results. |
||
| Flow and timing |
Duration of follow‐up: average interval 36.5 months Information from the paper 20 MCI: 9 MCI‐ADD; 11 non‐converters; baseline rCMRGlu of left TPabove (isolated) When we used model I (left TPabove measure isolated), the model reached a 75% classification accuracy (P = 0.05). 3 participants with P‐MCI were classified as S‐MCI and two S‐MCI were classified as P‐MCI (p 853); therefore there were FN = 3; FP = 2 Calculated in Review Manager 5: TP = 6; TN = 9; sensitivity = 67%; specificity = 82% Number included in analysis: 20 TP = 6; FP = 2; FN = 3; TN = 9 Loss to follow‐up: none |
||
| Comparative | |||
| Notes | |||
| Methodological quality | |||
| Item | Authors' judgement | Risk of bias | Applicability concerns |
| DOMAIN 1: Patient Selection | |||
| Was a consecutive or random sample of patients enrolled? | Yes | ||
| Was a case‐control design avoided? | Yes | ||
| Did the study avoid inappropriate exclusions? | Unclear | ||
| Unclear | Unclear | ||
| DOMAIN 2: Index Test All tests | |||
| Were the index test results interpreted without knowledge of the results of the reference standard? | Yes | ||
| If a threshold was used, was it pre‐specified? | No | ||
| High | Low | ||
| DOMAIN 3: Reference Standard | |||
| Is the reference standards likely to correctly classify the target condition? | Yes | ||
| Were the reference standard results interpreted without knowledge of the results of the index tests? | Unclear | ||
| Unclear | Low | ||
| DOMAIN 4: Flow and Timing | |||
| Was there an appropriate interval between index test and reference standard? | Yes | ||
| Did all patients receive the same reference standard? | Yes | ||
| Were all patients included in the analysis? | Yes | ||
| Low | |||
Berent 1999.
| Study characteristics | |||
| Patient sampling | 45 participants were recruited: 18 with AD, 20 with isolated memory impairment (IMI) and 15 healthy volunteers. Sampling procedure not described. We only included data on performance of the index test to discriminate between participants with MCI who converted to dementia and those who remained stable. Exclusion criteria: no participants or control subjects were taking any centrally‐acting medications at the time of study. No further information |
||
| Patient characteristics and setting | 20 participants with IMI. Participants were screened by staff of the Michigan Alzheimer’s Disease Research Center (MADRC) and classified using the clinical and psychometric IMI criteria: objective and quantitative evidence of learning inefficiency, with no evidence of impairments in general cognitive status or activities of daily living or behaviour due to change in cognition. This classification is based largely on previously published AAMI criteria (Crook 1986), although the IMI criteria do not require a formal memory complaint, and there is a liberal age restriction. Gender: 7 women; 13 men Age: mean 70.2 ± 5.5 years APOEɛ4: not reported MMSE: 26.0 ± 1.9 Education: total sample average: 15 years Sources of referral: not reported Sources of recruitment: Cognitive Disorders Clinic, Department of Neurology at the University of Michigan |
||
| Index tests | ¹⁸F‐FDG PET scan ¹⁸F‐FDG PETimage sets were acquired following intravenous administration of 10 mCi (370 MBq). Image sets were analysed in quantitative and non‐quantitative (normalisation) fashions described elsewhere (Minoshima 1995). Regional glucose metabolism in frontal, temporal, parietal and occipital regions normalised to the thalamus were determined for IMI participants. Threshold: a diagnostic index based on Z‐scores of the parietal cortex was used to categorise people with IMI into normal and abnormal CMRglc (Minoshima 1995); not prespecified Index test was conducted before follow‐up. |
||
| Target condition and reference standard(s) | Target condition: conversion from MCI to Alzheimer's disease dementia Reference standard: NINCDS‐ADRDA; ICD‐10. All participants received both reference standards. Unclear whether clinicians conducting follow‐up were aware of the ¹⁸F‐FDG PET results. |
||
| Flow and timing |
Duration of follow‐up: 3 years At baseline: 20 IMI; 10 IMI with positive ¹⁸F‐FDG test; 10 IMI with negative ¹⁸F‐FDG test. At follow‐up: 10 IMI with positive ¹⁸F‐FDG test: 7 IMI‐ADD; 3 IMI‐IMI; 10 IMI with negative ¹⁸F‐FDG test: 3 IMI‐ADD; 7 IMI‐IMI Number included in analysis: 20 TP = 7; FP = 3; FN = 3; TN = 7 Loss to follow‐up: none |
||
| Comparative | |||
| Notes | |||
| Methodological quality | |||
| Item | Authors' judgement | Risk of bias | Applicability concerns |
| DOMAIN 1: Patient Selection | |||
| Was a consecutive or random sample of patients enrolled? | Unclear | ||
| Was a case‐control design avoided? | Yes | ||
| Did the study avoid inappropriate exclusions? | Unclear | ||
| High | Low | ||
| DOMAIN 2: Index Test All tests | |||
| Were the index test results interpreted without knowledge of the results of the reference standard? | Yes | ||
| If a threshold was used, was it pre‐specified? | No | ||
| High | Low | ||
| DOMAIN 3: Reference Standard | |||
| Is the reference standards likely to correctly classify the target condition? | Yes | ||
| Were the reference standard results interpreted without knowledge of the results of the index tests? | Yes | ||
| Low | Low | ||
| DOMAIN 4: Flow and Timing | |||
| Was there an appropriate interval between index test and reference standard? | Yes | ||
| Did all patients receive the same reference standard? | Yes | ||
| Were all patients included in the analysis? | Yes | ||
| Low | |||
Chételat 2003.
| Study characteristics | |||
| Patient sampling | 19 right‐handed participants with a memory complaint, but preserved activities of daily living and 15 healthy controls were prospectively recruited. Sampling procedure not described.
We only included data on performance of the index test to discriminate between people with MCI who converted to dementia and those who remained stable. Exclusion criteria: neurologic, medical, or psychiatric disorder. No further information. People with medical disorders unrelated to cause of memory impairment may have been excluded. |
||
| Patient characteristics and setting | 19 participants with MCI, diagnosed with the Petersen 2001 criteria were recruited at baseline. No further information. Demographic characteristics reported on 17 MCI participants, who had a follow‐up. Inclusion criteria: no neurologic, medical, or psychiatric disorder; modified Hachinski score ≥ 2; age > 55 years; education > 7 years; episodic memory performance > 1.5 SD below age‐matched normal mean in Rey Figure delayed recall or 1 subscore of Grober‐Buschke test; Neurological and Communicative Disorders and Stroke, Alzheimer's Disaese and related Disorders Association criteria for Alzheimer's disease not met; MMSE ≥ 24 and normal cognitive functions apart from episodic memory, including the Stroop test, visuospatial function, imitation and production of gestures, and language. Gender: 8 men; 9 women. MCI‐non‐converters: 5M, 5F; MCI‐converters: 3M, 4F Age: Total: mean 69.9 ± 6.7; MCI‐non‐converters: mean 67.8 ± 7; MCI‐converters: mean 73 ± 5.1 APOE 4: not reported MMSE: ≥ 24 (no further details) Education: not reported Sources of referral: not reported Sources of recruitment: not reported |
||
| Index tests | ¹⁸F‐FDG PET scan
At entry each participant underwent an ¹⁸F‐FDG PET study using the ECAT HR+ device (CTI, Knoxville, TN). The ¹⁸F‐FDG uptake datasets were handled with SPM99. SPM maps were threshold at Z > 3.09; only decreases were assessed. 2 cerebral regions were mainly evaluated: the right temporo‐parietal and posterior cingulate. The participants were classified according to the adjusted regional activity values in the referred areas. Threshold: not prespecified: thresholding was set at 80% of whole brain mean of control participants. Index test was conducted before follow‐up. |
||
| Target condition and reference standard(s) | Target condition: conversion from MCI to Alzheimer's disease dementia Reference standard: NINCDS‐ADRDA criteria Clinicians conducting follow‐up were blinded to the ¹⁸F‐FDG PET results. |
||
| Flow and timing |
Duration of follow‐up: 18 months. Participants were evaluated every 6 months for an 18‐month period At baseline 19 MCI. At follow‐up: 17 participants: 7 rapid converters (MCI‐ADD); 10 non‐converters (MCI‐MCI) (p 1377) Number included in analysis: 17 TP = 7; FP = 0; FN = 0; TN = 10 (right temporo‐parietal region) (Figure, p 1376) TP = 7; FP = 1; FN = 0; TN = 9 (posterior cingulate region) (Figure, p 1376) Loss to follow‐up: 2 participants were excluded post hoc: 1 refused repetitive cognitive testing, and another turned out to have depression (did not meet inclusion criteria) |
||
| Comparative | |||
| Notes | |||
| Methodological quality | |||
| Item | Authors' judgement | Risk of bias | Applicability concerns |
| DOMAIN 1: Patient Selection | |||
| Was a consecutive or random sample of patients enrolled? | Unclear | ||
| Was a case‐control design avoided? | Yes | ||
| Did the study avoid inappropriate exclusions? | Unclear | ||
| High | Low | ||
| DOMAIN 2: Index Test All tests | |||
| Were the index test results interpreted without knowledge of the results of the reference standard? | Yes | ||
| If a threshold was used, was it pre‐specified? | No | ||
| High | Low | ||
| DOMAIN 3: Reference Standard | |||
| Is the reference standards likely to correctly classify the target condition? | Yes | ||
| Were the reference standard results interpreted without knowledge of the results of the index tests? | Yes | ||
| Low | Low | ||
| DOMAIN 4: Flow and Timing | |||
| Was there an appropriate interval between index test and reference standard? | Yes | ||
| Did all patients receive the same reference standard? | Yes | ||
| Were all patients included in the analysis? | No | ||
| Low | |||
Clerici 2009.
| Study characteristics | |||
| Patient sampling | 30 right‐handed participants with MCI. Sampling procedure not described. Information from the author: 16 aMCI came from the Del Sole 2008 study; 14 snaMCI were added to the current study. Exclusion criteria: i) presence of a DSM‐IV psychiatric disorder, including dementia or of organic brain pathology or of organic illness affecting the brain; ii) significant history of head injury; iii) major systematic illness; iv) history of drug and alcohol dependence; v) history of stroke. |
||
| Patient characteristics and setting | 30 MCI (16 aMCI and 14 snaMCI) participants were recruited from the Department of Neurology. The participants had experienced cognitive problems and contacted the clinic for examination. Most of the participants (approximately 85%) were referred by their GPs or by a specialist, while approximately 15% came of their own initiative. The diagnostic criteria for MCI were: 1. Subjective and objective anamnestic evidence of progressive cognitive impairment for more than 6 months; 2. Normal activities of daily living; 3. MMSE score of 24 or greater; 4. a CDR score of 0.5; and 5. a score > 1.5 SD below the mean on at least 1 cognitive dimension, as evaluated by neuropsychological assessment. Gender: aMCI: 10 women (62.5%) and 6 men (37.5%); snaMCI: 10 women (71.4%) and 4 men (28.6%) Age: aMCI: 74.92 ± 7.6 years; snaMCI: 73.62 ± 6.3 years APOEɛ4: not reported MMSE: aMCI: 25.82 ± 1.5; snaMCI: 26.72 ± 1.9 Education: aMCI: 9.1 ± 4.5 years; snaMCI: 8.7 ± 4.0 years Sources of referral: GP surgeries or specialists (85%) or self referral (15%) Sources of recruitment: Center for Research and Treatment of Cognitive Dysfunctions of the Department of Neurology, University of Milan, Italy |
||
| Index tests | ¹⁸F‐FDG PET scan An activity of 185‐370 MBq of ¹⁸F‐FGD, depending on person’s weight, was injected intravenously in resting condition with eyes closed and ears unplugged; the participants were asked to rest quietly for the next 45 minutes. The studies were performed using an ECAT ACCELL scanner (Siemens Medical Systems, Erlangen, Germany). PET data of MCI participants were compared to a control group of 7 cognitively normal elderly participants described in previous study of the group (Del Sole 2008). The aMCI and snaMCI groups were first compared to controls (as described in the Del Sole 2008 study) and then to each other on a voxel‐by‐voxel basis using a 2‐sample t test. Each PET study was analysed separately (according to the method described in the Del Sole 2008 study) to assess regional cerebral metabolic abnormalities in individual participants. Briefly, the SPM(t) maps of each person were converted to binary masks, where single pixels of the images were either a 0 in areas of normal ¹⁸F‐FDG uptake or 1 in areas of decreased uptake. The mask images were summed together to generate a map of overlapping regions of metabolic impairment. Threshold: Each scan was considered positive when a cluster of at least 100 consecutive voxel (size 2 x 2 x 2 mm³) had a metabolism lower that the control group (with P set at < 0.01 level); prespecified (Dr Clerici email on 23rd August 2013) Index test was conducted before follow‐up. |
||
| Target condition and reference standard(s) | Target condition: conversion from MCI to Alzheimer's disease dementia or other forms of dementia Reference standard: NINCDS‐ADRDA and DSM‐IV for AD dementia; McKeith criteria for LBD; Lund and Manchester criteria for FTD Not clear whether clinicians conducting follow‐up were aware of the ¹⁸F‐FDG PET results. |
||
| Flow and timing |
Duration of follow‐up: aMCI group: last follow‐up 18 months; snaMCI group: follow‐up at 12, 24, and 37 months Information from the author: At baseline: 26 ¹⁸F‐FDG+ tests; 4 ¹⁸F‐FDG‐ tests at baseline At follow‐up (37 months): 12 aMCI with ¹⁸F‐FDG+: 11 aMCI converters (10 aMCI‐ADD; 1aMCI‐LBD), 1 lost to follow‐up 4 aMCI with ¹⁸F‐FDG‐: 1aMCI‐ADD; 2aMCI‐MCI; 1 lost to follow‐up 14 snaMCI with ¹⁸F‐FDG+: 7 converters (2 snaMCI‐ADD; 2 snaMCI–FTD; 3 snaMCI‐LBD) and 5 non‐converters (5 snaMCI‐ snaMCI) and 2 lost to follow‐up Number included in analysis: 26 TP = 12; FP = 11; FN = 1; TN = 2 for Alzheimer's disease dementia TP = 18; FP = 5; FN = 1; TN = 2 for all forms of dementia Loss to follow‐up: In total 4 MCI participants: 2 aMCI and 2 snaMCI. No further details. |
||
| Comparative | |||
| Notes | We contacted the trial investigators who provided relevant data tor the 2 x 2 table to be completed (email on 23rd August 2013). | ||
| Methodological quality | |||
| Item | Authors' judgement | Risk of bias | Applicability concerns |
| DOMAIN 1: Patient Selection | |||
| Was a consecutive or random sample of patients enrolled? | Unclear | ||
| Was a case‐control design avoided? | Yes | ||
| Did the study avoid inappropriate exclusions? | Yes | ||
| Low | Low | ||
| DOMAIN 2: Index Test All tests | |||
| Were the index test results interpreted without knowledge of the results of the reference standard? | Yes | ||
| If a threshold was used, was it pre‐specified? | Yes | ||
| Low | Low | ||
| DOMAIN 3: Reference Standard | |||
| Is the reference standards likely to correctly classify the target condition? | Yes | ||
| Were the reference standard results interpreted without knowledge of the results of the index tests? | Unclear | ||
| Unclear | Low | ||
| DOMAIN 4: Flow and Timing | |||
| Was there an appropriate interval between index test and reference standard? | Yes | ||
| Did all patients receive the same reference standard? | Yes | ||
| Were all patients included in the analysis? | No | ||
| Unclear | |||
Drzezga 2005.
| Study characteristics | |||
| Patient sampling | Prospective, consecutive recruitment of 30 participants with MCI who were referred for diagnostic evaluation by GPs, neurologists, psychiatrists, or other institutions. Exclusion criteria: people who met the diagnotic criteria for dementia or any other functional psychiatric disorder, including major depression; symptoms of diseases or abnormalities sufficient to cause memory impairment (e.g. Parkinson's disease, normal pressure hydrocephalus); major structural abnormalities on MRI (e.g. infarction, intra‐cerebral aneurysm, arteriovenous malformation); extra‐cerebral causes which could influence neuropsychological function (e.g. use of neuroleptics, substance abuse). The study excluded people with depression, but specified major depression sufficient to cause memory impairment. |
||
| Patient characteristics and setting | 30 MCI participants, diagnosed with the Petersen 1999 and CDR 5 criteria, were recruited from a research unit. Baseline evaluation included medical, psychiatric and neurological examinations performed by an experienced psychiatrist. Paricipants had to meet the established diagnostic criteria for mild cognitive impairment: subjective complaint; performance of 1.5 SD below the age norm on the Consortium to establish a registry for Alzheimer's Disease (CERAD) delayed verbal recall test; CDR score of 0.5; preserved basic activities of daily living. Gender: 14 men; 16 women; MCI‐non‐converters: 8M, 10F; MCI‐converters: 6M, 6F Age: mean: total sample 70 ± 8 years; MCI‐non‐converters: 67.6 ± 8.2 years; MCI‐converters: 74.7 ± 4.7 years APOEɛ4: MCI‐non‐converters: 8/18; MCI‐converters: 9/12 MMSE: MCI‐non‐converters: 27.6 ± 1.5; MCI‐converters: 25.9 ± 2.1 Duration of symptoms: mean 2.6 ± 2.0 years Education: mean 11.6 ± 3.4 years Sources of referral: GP surgeries or neurologists or psychiatrists or other institutions Sources of recruitment: Research Unit for Cognitive Disorders, Technical University, Munich, Germany. |
||
| Index tests | ¹⁸F‐FDG PET scan The index test was performed at the time of initial clinical evaluation. All participants received 370 MBq ¹⁸F‐FDG at rest with the eyes closed. Participants were positioned with the head parallel to the canthomeatal line within the gantry. 30 minutes after injection, PET was performed under standard resting condition (eyes closed in dimmed ambient light) using a Siemens 951 R/31 PET scanner (CTI). A sequence of 3 frames of 10 min was started and later combined into a single frame. Image data were acquired in 2‐dimensional mode with a total axial field of view of 10.5 cm and no interplane gap space. Attenuation correction was performed by a standard ellipse‐fitting method. For analysis of the PET data, a well‐established observer‐independent programme (NEUROSTAT; University of Michigan) was used to minimise observer bias. This method has been evaluated for clinical and scientific use in people with dementia and other cerebral disorders (Bartenstein 1997; Drzezga 1999; Ishii 2001; Minoshima 1995). The ROIs were defined to reflect functional divisions of the cerebral lobes, and each hemisphere was divided into the following regions: orbitofrontal, prefrontal, premotor, central, parietal superior and inferior, occipital, temporal anterior, temporal posterior and posterior cingulate. The results from the ROI analysis were not averaged together; each ROI was assessed individually. The detection of significant hypometabolism (as compared with a control population) in surface ROIs covering the posterior cingulate cortex accompanied by cortical hypometabolism in at least unilateral temporo‐parietal areas was determined as suggestive of early AD, based on findings of earlier studies (Drzezga 2003). According to this strategy, PET baseline results were classified as suggestive or not suggestive for AD. Threshold: A z‐score threshold of > 1.64 (1‐tail) corresponding to a P value of 0.05 (1‐tail) was applied for demarcation of significant abnormalities. This statistical threshold previously proved to be suitable for the diagnosis of DAT using the applied statistical tool (Bartenstein 1997; Minoshima 1995); prespecified. Index test was conducted before follow‐up. |
||
| Target condition and reference standard(s) | Target condition: conversion from MCI to Alzheimer's disease dementia Reference standard: NINCDS‐ADRDA criteria ¹⁸F‐FDG PET results were blinded for the later outcome of the participants, and blinded for other clinical baseline information. |
||
| Flow and timing |
Duration of follow‐up: 15 months (expanded to a mean 16 ± 2 months) At baseline: 30 participants: 13 with ¹⁸F‐FDG positive; 17 with ¹⁸F‐FDG negative (Abstract) At follow‐up: 12 MCI‐ADD; 18 MCI‐MCI (p 1628); sensitivity: 92%; specificity: 89% (Table 2, p 1629) Number included in analysis: 30 TP = 11; TN = 16; FP = 2; FN = 1 (Calculated in Review Manager 5) Loss to follow‐up: none |
||
| Comparative | |||
| Notes | |||
| Methodological quality | |||
| Item | Authors' judgement | Risk of bias | Applicability concerns |
| DOMAIN 1: Patient Selection | |||
| Was a consecutive or random sample of patients enrolled? | Yes | ||
| Was a case‐control design avoided? | Yes | ||
| Did the study avoid inappropriate exclusions? | Yes | ||
| Low | Low | ||
| DOMAIN 2: Index Test All tests | |||
| Were the index test results interpreted without knowledge of the results of the reference standard? | Yes | ||
| If a threshold was used, was it pre‐specified? | Yes | ||
| Low | Low | ||
| DOMAIN 3: Reference Standard | |||
| Is the reference standards likely to correctly classify the target condition? | Yes | ||
| Were the reference standard results interpreted without knowledge of the results of the index tests? | Yes | ||
| Low | Low | ||
| DOMAIN 4: Flow and Timing | |||
| Was there an appropriate interval between index test and reference standard? | Yes | ||
| Did all patients receive the same reference standard? | Yes | ||
| Were all patients included in the analysis? | Yes | ||
| Low | |||
Fellgiebel 2007.
| Study characteristics | |||
| Patient sampling | Prospective recruitment of 16 people with aMCI, presenting at a memory clinic for diagnostic evaluation. Sampling procedure not described. Exclusion criteria: people with metabolic disease that could affect cognitive function; people with other brain diseases; people with a diagnosis of depression according to DSM‐IV criteria |
||
| Patient characteristics and setting | 16 participants, diagnosed with the Petersen 1999 criteria at baseline. 1 person in the initial study group refused further participation and has been replaced by a consecutively‐recruited comparable patient from the memory clinic to preserve the statistical power for prospectively planned follow‐up analyses. Gender: 9 men; 7 women. Age: total sample: mean age 68.6 ± 7.9 years; MCI‐MCI: 68.8 ± 10.0 years; MCI‐progressive: 68.5 ± 5.9 years (4/8 MCI‐ADD: 69.5 ± 7.9 years) APOEɛ4: not reported MMSE: mean 25.7 ± 2.7; MCI‐MCI: 27.3 ± 1.8; MCI‐progressive: 25.0 ± 2.1 (4/8 MCI‐ADD: 24.3 ± 1.5) Education: not reported Sources of referral: not reported Sources of recruitment: University Memory Clinic, Germany |
||
| Index tests | ¹⁸F‐FDG PET scan Method of the index test administration described previously (Fellgiebel 2004): Acquisition was in 3D mode . 30 minutes after injection of 180 MBq ¹⁸F‐FDG, a sequence of 3 5‐minute frames was started and later combined to a single frame. Thereafter, the images were corrected for attenuation, scatter, and dead time. Standardised 3D stereotactic surface projections for each participant, compared with a normal database to provide Z scores. Threshold(s): AD‐typical findings were defined as significant decrease ( Z‐score > 2 in more than 50 adjacent pixels) of cerebral glucose metabolism in at least 1 of the brain regions that have been shown to be typically involved in early AD (parietal mesial or posterior cingulate and temporal regions); prespecified. Index test was conducted before follow‐up. |
||
| Target condition and reference standard(s) | Target condition: conversion from MCI to Alzheimer's disease dementia Reference standard: Progression to Alzheimer's disease dementia was assumed if CDR reached 1. Follow‐up evaluation at variable time points (not specified), comprising neurological and psychiatric examination, CDR and MMSE. Progressive cognitive decline was defined as MMSE score reduction ≥ 2 and a clinical judgement of cognitive deterioration. Clinicians conducting follow‐up were blinded to the¹⁸F‐FDG PET results. |
||
| Flow and timing |
Duration of follow‐up: Total sample: 19.6 ± 9.0 months; MCI‐MCI: 19.5 ± 9.3 months; MCI‐progressive: 17.6 ± 8.8 months (4/8 MCI‐ADD: 23.7 ± 2.0 months) At baseline: 16 MCI: 7 with ¹⁸F‐FDG positive; 9 with ¹⁸F‐FDG negative At follow‐up: 16 MCI: 7 FDG positive: 4 MCI‐ADD, 1 MCI‐MCI, 2 MCI‐progressive (non‐converters); 9 FDG‐: 7 MCI‐MCI ; 2 MCI‐progressive (non‐converters) (p 170). Number included in analysis: 16 TP = 4; FP = 3; FN = 0; TN = 9 Sensitivity: 100%; Specificity: 75%; PPV: 57%; NPV: 100% (calculated in Review Manager 5). Loss to follow‐up: 1/16; however, that participant was replaced by an additional, consecutively‐recruited patient from the memory clinic. |
||
| Comparative | |||
| Notes | |||
| Methodological quality | |||
| Item | Authors' judgement | Risk of bias | Applicability concerns |
| DOMAIN 1: Patient Selection | |||
| Was a consecutive or random sample of patients enrolled? | Unclear | ||
| Was a case‐control design avoided? | Yes | ||
| Did the study avoid inappropriate exclusions? | Yes | ||
| Low | Low | ||
| DOMAIN 2: Index Test All tests | |||
| Were the index test results interpreted without knowledge of the results of the reference standard? | Yes | ||
| If a threshold was used, was it pre‐specified? | Yes | ||
| Low | Low | ||
| DOMAIN 3: Reference Standard | |||
| Is the reference standards likely to correctly classify the target condition? | Unclear | ||
| Were the reference standard results interpreted without knowledge of the results of the index tests? | Yes | ||
| Unclear | Unclear | ||
| DOMAIN 4: Flow and Timing | |||
| Was there an appropriate interval between index test and reference standard? | No | ||
| Did all patients receive the same reference standard? | Yes | ||
| Were all patients included in the analysis? | Yes | ||
| Unclear | |||
Galluzzi 2010.
| Study characteristics | |||
| Patient sampling | 108 consecutive participants with MCI, referred to an outpatient memory clinic over 24 months, were initially selected. Finally, 90 participants were included. Of these, only 38 underwent ¹⁸F‐FDG PET scan. The other 52 did not undergo ¹⁸F‐FDG PET because of refusal (n = 25), contraindications (n = 7) or because they had previously undergone a brain perfusion study with 99mTc‐ECD SPECT (n = 20). Exclusion criteria: not specified. |
||
| Patient characteristics and setting | 38 MCI participants with ¹⁸F‐FDG scan. Diagnostic criteria for MCI were not directly specified. However, it can be inferred that the authors use the Petersen 1999 criteria. MCI is defined as the presence of objective impairment in memory or other cognitive domains (performance lower than the 5th percentile on neuropsychological tests applied in the study) in the absence of functional impairment. Demographic data reported on all 90 participants included in the study. Gender: 53 women, 37 men AGE: MCI‐NC: 70.9 ± 7.1 years; MCI‐ADD: 72.2 ± 7.1 years; MCI‐non‐ADD; 73.0 ± 7.1 years APOEɛ4: MCI‐NC: 19 (41%); MCI‐ADD: 14 (58%); MCI‐nADD: 2 (15%). The data refer to 35 participants in total. It is not reported how many or which of them underwent PET scan MMSE: MCI‐NC: 26.3 ± 1.9; MCI‐ADD: 26.4 ± 1 .6; MCI‐non‐ADD: 25.5 ± 1.9 Education: MCI‐NC: 7.7 ± 3.6; MCI‐ADD: 8.8 ± 4.6; MCI‐non‐ADD: 7.3 ± 4.0 Sources of referral: not reported Sources of recruitment: Translational Outpatient Memory Clinic (TOMC), at the National Institute for the Research and Care of Alzheimer’s Disease (IRCCS Centro San Giovanni di Dio Fatebenefratelli), Brescia, Italy |
||
| Index tests | ¹⁸F‐FDG PET scan The authors did not give details regarding radiopharmaceutical (¹⁸F‐FDG) administration. However, they report on evaluation criteria applied in PET reading. As it is written in text: "FDG uptake was assessed with the automated version (PALZ score of PMOD technologies) of the t sum score developed by Herholz and colleagues for the diagnosis of AD, combining the virtues of voxel‐based parametric mapping with the diagnostic information on brain regions that are typically affected in AD. Briefly, the ¹⁸F‐FDG PET image of an individual patient is compared to a database of normal controls and the voxel‐by‐voxel sum of t scores in an AD‐pattern mask is computed. Abnormal ¹⁸F‐FDG PET was defined following the original indications of a t sum higher than 11,090" (p 2007). Threshold: ¹⁸F‐FDG PET positive: t sum > 11.090 (Herholz 2002); prespecified. Index test was conducted before follow‐up. |
||
| Target condition and reference standard(s) | Target condition: conversion from MCI to Alzheimer's disease dementia or other forms of dementia Reference standard: NINCDS‐ADRDA criteria Unclear whether clinicians conducting follow‐up were aware of the ¹⁸F‐FDG results. |
||
| Flow and timing |
Duration of follow‐up: MCI‐NC: 26.5 ± 16.0 months; MCI‐ADD: 21.5 ± 10.2 months; MCI‐non‐ADD: 19.1 ± 8.9 months The data refer to all 90 people with MCI, not only to the 38 who underwent PET scan. Information from the author: At baseline: 28 ¹⁸F‐FDG test positive; 10 ¹⁸F‐FDG negative At follow‐up: 28 with abnormal ¹⁸F‐FDG PET scan: 15 MCI‐converters (11 MCI‐ADD; 4 MCI non‐ADD) and 13 MCI‐non‐converters (13 MCI‐MCI); 10 with normal ¹⁸F‐FDG PET scan: 3 MCI‐converters (3 MCI‐ADD; 2 MCI‐non‐ADD) and 5 MCI‐non‐converters (5 MCI‐MCI). Number included in analysis: 38 TP = 15; FN = 5; FP = 13; TN = 5 (conversion to All dementia) TP = 11; FN = 3; FP = 17; TN = 7 (conversion to ADD) TP = 4; FN = 2; FP = 24; TN = 8 (conversion to non‐ADD dementia) Loss to follow‐up: none for 38 MCI participants with ¹⁸F‐FDG scan Lost to follow‐up for the initial sample: 52 (25 participants refuse the ¹⁸F‐FDG PET scan; 7 were not performed because of contraindications and 20 because they had previously undergone 99mTc‐ECDSPECT scan). In addition,18 participants were excluded from the consecutive sample (N = 108): 16 due to refusal of follow‐up; 2 due to logistical problems. |
||
| Comparative | |||
| Notes | We contacted the trial investigators who provided relevant data tor the 2 x 2 table to be completed (email on 23rd August 2013). | ||
| Methodological quality | |||
| Item | Authors' judgement | Risk of bias | Applicability concerns |
| DOMAIN 1: Patient Selection | |||
| Was a consecutive or random sample of patients enrolled? | Yes | ||
| Was a case‐control design avoided? | Yes | ||
| Did the study avoid inappropriate exclusions? | Unclear | ||
| Unclear | Low | ||
| DOMAIN 2: Index Test All tests | |||
| Were the index test results interpreted without knowledge of the results of the reference standard? | Yes | ||
| If a threshold was used, was it pre‐specified? | Yes | ||
| Low | Low | ||
| DOMAIN 3: Reference Standard | |||
| Is the reference standards likely to correctly classify the target condition? | Yes | ||
| Were the reference standard results interpreted without knowledge of the results of the index tests? | Unclear | ||
| Unclear | Low | ||
| DOMAIN 4: Flow and Timing | |||
| Was there an appropriate interval between index test and reference standard? | No | ||
| Did all patients receive the same reference standard? | Yes | ||
| Were all patients included in the analysis? | Yes | ||
| Low | |||
Herholz 2011.
| Study characteristics | |||
| Patient sampling | A subset of 94 MCI participants' baseline data, available for all measures of interest, was used from the ADNI, a multicentre project with approximately 50 medical centre and university sites across the United States and Canada. Exclusion criteria: not reported. |
||
| Patient characteristics and setting | 94 participants with MCI, diagnosed with the Petersen 2010 and CDR = 0.5 at baseline, were recruited from ADNI data. Gender: 28 women, 66 men Age: Total: 75.0 ± 7.6 years APOEɛ4: not reported MMSE: 27.1 ± 1.59 Education; not reported Sources of referral: not reported Sources of recruitment: multicentre |
||
| Index tests | ¹⁸F‐FDG PET scan PET scans represented the brain activity 30 – 60 mins after injection of ¹⁸F‐FDG; had been reconstructed using 3D backprojection, 3D ordered‐subset expectation maximisation, or Fourier rebinning/2D ordered‐subset expectation maximisation; were scaled to a common global average value; and were re‐oriented into a standard 160 x 160 x 96 voxel image grid (voxel size, 1.5 x 1.5 x 1.5 mm) along the anterior commissure‐posterior commissure. The AD t‐sum was calculated. It indicates the severity of the metabolic decrease in those brain areas that are typically affected by AD (multimodal association cortices mostly located in the temporal and parietal lobes), including an adjustment for age effects. The AD t‐sum was converted into a PET score by reference to its upper limit (Herholz 2002) ROI: temporal and parietal lobes PET score = log2 {(ADtsum/11,089) + 1)} Threshold: rCGMglc of t sum > 11.090 (Herholz 2002); prespecified. Index test was conducted before follow‐up. |
||
| Target condition and reference standard(s) | Target condition: conversion from MCI to Alzheimer's disease dementia Reference standard: clinical dementia rating (not specified) and ADAS‐cog Unclear whether clinicians conducting follow‐up were aware of the ¹⁸F‐FDG results. |
||
| Flow and timing |
Duration of follow‐up: 24 months Participants were required to have had 4 ¹⁸F‐FDG PET scans at baseline, 6m, 12m, and 24m. At 24‐month follow‐up: 30 MCI‐ADD, 64 MCI‐non‐convertors (57 MCI‐MCI; 7 MCI‐normal cognition); sensitivity = 57%; specificity = 67% (p 1220) 45% abnormal ¹⁸F‐FDG tests (Table 2, p 1220): 38 test positive; 56 test negative Number included in analysis: 94 TP = 17; FP = 21; FN = 13; TN = 43 (Calculated in Review Manager 5) Loss to follow‐up: none |
||
| Comparative | |||
| Notes | |||
| Methodological quality | |||
| Item | Authors' judgement | Risk of bias | Applicability concerns |
| DOMAIN 1: Patient Selection | |||
| Was a consecutive or random sample of patients enrolled? | Unclear | ||
| Was a case‐control design avoided? | Yes | ||
| Did the study avoid inappropriate exclusions? | Unclear | ||
| High | Low | ||
| DOMAIN 2: Index Test All tests | |||
| Were the index test results interpreted without knowledge of the results of the reference standard? | Yes | ||
| If a threshold was used, was it pre‐specified? | Yes | ||
| Low | Low | ||
| DOMAIN 3: Reference Standard | |||
| Is the reference standards likely to correctly classify the target condition? | Unclear | ||
| Were the reference standard results interpreted without knowledge of the results of the index tests? | Unclear | ||
| High | Unclear | ||
| DOMAIN 4: Flow and Timing | |||
| Was there an appropriate interval between index test and reference standard? | Yes | ||
| Did all patients receive the same reference standard? | Yes | ||
| Were all patients included in the analysis? | Yes | ||
| Low | |||
Landau 2010.
| Study characteristics | |||
| Patient sampling | Retrospective analysis of 85 people with MCI taken from a larger study. Participants had MCI and baseline data were available for all measures of interest to the current study. No exclusion criteria were specified. |
||
| Patient characteristics and setting | 85 participants with MCI (Petersen 2010 and CDR = 0.5 criteria), whose data were analysed, were recruited from the ADNI, a multicentre project with approximately 50 medical centre and university sites across the United States and Canada. Approximately 200 cognitively normal older participants, 400 participants with MCI, and 200 with early AD are enrolled in ADNI, all of whom have had MRI scanning; approximately 50% have had PET scanning, and approximately 50% also agreed to lumbar puncture. MCI participants were classified as single‐domain or multi‐domain amnestic MCI (Petersen 2003). Gender: 56 men; 29 women. MCI‐non‐converters: 37M, 20F; MCI‐converters: 19M, 9F Age: MCI‐non‐converters: mean 78 ± 7.4 years; MCI‐converters: mean 78.3 ± 7.5 years APOEɛ4: MCI‐non‐converters: 14 (25%); MCI‐converters: 11 (41%) MMSE: MCI‐non‐converters: mean 27.3 ± 1.6; MCI‐converters: mean 26.4 ± 1.7 Education: MCI‐non‐converters: mean 16.3 ± 2.8; MCI‐converters: mean 16.4 ± 2.6 Sources of referral: not reported Sources of recruitment: multicentre |
||
| Index tests | ¹⁸F‐FDG PET scan PET images were acquired 30 – 60 minutes post‐injection. Images were averaged, spatially aligned, interpolated to a standard voxel size, intensity normalised, and smoothed to a common resolution of 8 mm full width at half maximum. Spatial normalisation of each individual’s PET volume to the standard ¹⁵O‐H₂O PET template was conducted using SPM5 (template voxel dimensions: 91 x 109 x 91; voxel size: 2 mm x 2 mm x 2 mm). The regions of interest selected were study‐independent, frequently associated with decline in AD and MCI (no further details). Optimal diagnostic thresholds were derived from a ROC analysis. Threshold: 1.21 (Table 2 – most likely this value refers to rCMRglc); not prespecified. The mean ± SD values on ¹⁸F‐FDG scan are referred on Table 1: MCI‐non‐converters: 1.22 ± 0.14; MCI‐converters: 1.13 ± 0.10 Index test was conducted before follow‐up. |
||
| Target condition and reference standard(s) | Target condition: conversion from MCI to Alzheimer's disease dementia Reference standard: NINCDS‐ADRDA criteria. Cognitive decline was measured by ADAS–Cognitive Subscale (Rosen 1984) and standard diagnostic criteria. Unclear whether clinicians conducting follow‐up were aware of the ¹⁸F‐FDG results. |
||
| Flow and timing |
Duration of follow‐up: 1.9 ± 0.4 years; maximum 3 years Follow‐up occurred at multiple time points (6, 12, 18, 24 and 36 months) At baseline 85 participants with MCI. At follow‐up: 85 participants: 28 MCI‐ADD; 57 MCI‐MCI (p 232) Information from the author: At follow‐up: 51 MCI with positive ¹⁸F‐FDG biomarker: 21 MCI‐ADD, 30 MCI‐MCI; 34 MCI with negative ¹⁸F‐FDG biomarker: 7 MCI‐ADD, 27 MCI‐MCI Number included in analysis: 85 TP = 21; FP = 30; FN = 7; TN = 27 Loss to follow‐up: none; all 85 participants appear to have been included in the analysis. |
||
| Comparative | |||
| Notes | We contacted the trial investigators who provided relevant data tor the 2 x 2 table to be completed (email on 24th January 2013). | ||
| Methodological quality | |||
| Item | Authors' judgement | Risk of bias | Applicability concerns |
| DOMAIN 1: Patient Selection | |||
| Was a consecutive or random sample of patients enrolled? | Unclear | ||
| Was a case‐control design avoided? | Yes | ||
| Did the study avoid inappropriate exclusions? | Unclear | ||
| High | Low | ||
| DOMAIN 2: Index Test All tests | |||
| Were the index test results interpreted without knowledge of the results of the reference standard? | Yes | ||
| If a threshold was used, was it pre‐specified? | No | ||
| High | Low | ||
| DOMAIN 3: Reference Standard | |||
| Is the reference standards likely to correctly classify the target condition? | Yes | ||
| Were the reference standard results interpreted without knowledge of the results of the index tests? | Unclear | ||
| Unclear | Low | ||
| DOMAIN 4: Flow and Timing | |||
| Was there an appropriate interval between index test and reference standard? | Yes | ||
| Did all patients receive the same reference standard? | Yes | ||
| Were all patients included in the analysis? | Yes | ||
| Low | |||
Mosconi 2004.
| Study characteristics | |||
| Patient sampling | People with aMCI, recruited over a 2‐year period. Sampling procedure not described. Exclusion criteria: major psychiatric or medical disease; using medication that could affect brain structure or function (previous subarachnoid or intra‐cerebral haemorrhage, intra‐cranial tumour, hydrocephalus, psychosis, major depression, alcoholism, epilepsy, ischaemic stroke, vascular dementia and other dementing illnesses, anaemia, untreated thyroid dysfunction, renal insufficiency, non‐stabilised diabetes mellitus). |
||
| Patient characteristics and setting | 37 MCI participants, diagnosed with the Petersen 2001 criteria at baseline. Gender: converters: 5 women; 3 men; non‐converters: 15 women; 14 men Age: converters: 69 ± 4 years; non‐converters: 63 ± 8 years APOEɛ4: total: APOE4(+)16; APOE4(‐) 21. APOE4(+) MCI‐non‐converters: 11/16; APOE4(+) MCI‐converters: 5/16; APOE4(‐) MCI‐non‐converters: 18/21; APOE4(‐) MCI‐converters: 3/21 MMSE: MCI‐non‐converters: 28.1 ± 1.6; MCI‐converters: 23.9 ± 1.7 Education: MCI‐non‐converters: 10.0 ± 5.0; MCI‐converters: 8.0 ± 3.0 Sources of referral: not reported Sources of recruitment: not reported. The recruitment was carried out according to the general protocol of the Network for Efficiency and Standardisation of Dementia Diagnosis research project (Herholz 2002). |
||
| Index tests | ¹⁸F‐FDG PET scan PET scans were performed using GE Advance PET devices (Milwaukee, WI). Scans were acquired in 2D mode with an axial field of view of 153 mm, an in‐plane full width at half‐maximum (FWHM) of 4.6 mm, and slice thickness of 4.25 mm. Participants were injected with a dose of 110 to 370 MBq of [¹⁸F] FDG in a resting state with eyes closed and ears unplugged in a dimly‐lighted room with minimal background noise. A polycarbonate head holder was used to reduce head movement during the scan. The uptake interval between FDG injection and scan start was on average 42 ± 19 minutes. The average scan duration was 19 ± 3 minutes. Images were reconstructed using filtered back‐projection including correction for attenuation measured by transmission scan and scatter using standard software as supplied by scanner manufacturers. Basic image processing and voxel‐based data analyses were performed using SPM99 routines (Wellcome Department of Cognitive Neurology, London, UK) implemented in MATLAB (Mathworks, Sherborn, MA). An isotropic Gaussian filter was used to smooth the spatially normalised PET images with an FWHM of 12 mm. Individual counts were normalised to mean global activity using proportional scaling to obtain relative cerebral metabolic rate for glucose (rCMRglc) values from FDG radioactivity measurements. To minimise 'edge effects' without excluding hypometabolic tissue, only those voxels with values > 80% of the mean for the whole brain were retained for all statistical analyses. Global calculation was obtained with respect to the mean voxel value. The writers defined the precuneus (PreCu), anterior (ACC), and posterior (PCC) cingulate cortex, inferior parietal lobule (IPL), superior (STG) and middle (MiTG) temporal gyrus, and superior (SFG), middle (MiFG), and inferior frontal (IFG) gyrus, on both hemispheres, as candidate areas for possible rCMRglc alterations. Threshold: no specific rCMRglc value is referred as threshold. The writers characterise a PET scan as positive or negative for significant rCMRglc reductions in certain cerebral areas with emphasis on the inferior parietal lobule (IPL). No threshold or related quantitative data are provided. Index test was conducted before follow‐up. |
||
| Target condition and reference standard(s) | Target condition: conversion from MCI to Alzheimer's disease dementia Reference standard: NINCDS‐ADRDA criteria Clinicians conducting follow‐up were blinded to APOE results. Unclear whether they were unaware of the ¹⁸F‐FDG results. |
||
| Flow and timing |
Duration of follow‐up: mean 12.1 ± 0.6 months At baseline 37 MCI. At follow‐up: 37 participants: 8 MCI‐ADD; 29 MCI‐MCI (p 2335) Sensitivity: 38%; Specificity: 97% (p 2336) Number included in analysis: 37 TP = 3; FP = 1; FN = 5; TN = 28 (calculated in Review Manager 5) Loss to follow‐up: none All participants appear to have been included in the analyses (conversion/non‐conversion outcomes were reported for 37 participants). |
||
| Comparative | |||
| Notes | Additional information were requested from the trial investigators regarding the threshold but no further information was available at the time this review was prepared (email on 5th September 2013) | ||
| Methodological quality | |||
| Item | Authors' judgement | Risk of bias | Applicability concerns |
| DOMAIN 1: Patient Selection | |||
| Was a consecutive or random sample of patients enrolled? | Unclear | ||
| Was a case‐control design avoided? | Yes | ||
| Did the study avoid inappropriate exclusions? | Yes | ||
| Low | Low | ||
| DOMAIN 2: Index Test All tests | |||
| Were the index test results interpreted without knowledge of the results of the reference standard? | Yes | ||
| If a threshold was used, was it pre‐specified? | Unclear | ||
| Unclear | Low | ||
| DOMAIN 3: Reference Standard | |||
| Is the reference standards likely to correctly classify the target condition? | Yes | ||
| Were the reference standard results interpreted without knowledge of the results of the index tests? | Unclear | ||
| Unclear | Low | ||
| DOMAIN 4: Flow and Timing | |||
| Was there an appropriate interval between index test and reference standard? | No | ||
| Did all patients receive the same reference standard? | Yes | ||
| Were all patients included in the analysis? | Yes | ||
| Low | |||
Nobili 2008.
| Study characteristics | |||
| Patient sampling | 36 participants with memory complaints in whom an objective memory deficit was demonstrated by means of neuropsychological tests and 17 healthy volunteers who gave their informed consent were recruited during university courses dedicated to elderly people. Sampling procedure not described. We only include data on performance of the index test to discriminate between people with MCI who converted to dementia and those who remained stable. Excusion criteria: presence of analphabetism, major vision disturbances, psychiatric illnesses, epilepsy, major head trauma, Parkinsonism, previous stroke or TIA and brain masses; people scoring higher than 0 on the delusion and the hallucination NPI items were excluded. |
||
| Patient characteristics and setting | 36 participants with MCI, diagnosed with the Petersen 2004 criteria at baseline, were recruited from the Outpatient clinic. Demographic characteristics are reported for 33 participants who were included in the analysis. Gender: converters: 11 women, 11 men; non‐converters: 9 women, 2 men Age: converters: 77.3 ± 4.8 years; non‐converters: 74.6 ± 5.4 years APOEɛ4: not reported on all MCI participants. converters: 4/8 (50%); non‐converters: 5/14 (36%) MMSE: converters: 27.6 ± 1.4; non‐converters: 27.4 ± 2.0 Education: converters: 8.5 ± 3.9; non‐converters: 8.8 ± 4.7 Sources of referral: not reported Sources of recruitment: outpatients, no further information |
||
| Index tests | ¹⁸F‐FDG PET scan The index test was performed within 3 months from the clinical–neuropsychological examination (mean 29.9 days in participants and 29.8 days in controls). Participants fasted for at least 6 hours. Before radiopharmaceutical injection, blood glucose was checked and was < 140 mg/dl in all cases. After a 10‐min rest in a silent and obscured room, with eyes closed and ears unplugged, participants were injected with approximately 370 MBq of ¹⁸F‐FDG PET via a venous cannula, according to the guidelines of the European Association of Nuclear Medicine (Bartenstein 2002). They remained in the room for 30 mins after injection, and were then moved to the PET room where scanning started approximately 45 mins after injection and lasted 20 mins. Threshold: not reported; visual interpretation ‐ 25 VROI (volumetric region of interest). Index test was conducted before follow‐up. |
||
| Target condition and reference standard(s) | Target condition: conversion from MCI to Alzheimer's disease dementia Reference standard: NINCDS‐ADRDA; DSM‐IV. All participants received both reference standards. Unclear whether clinicians conducting follow‐up were aware of the ¹⁸F‐FDG results. |
||
| Flow and timing |
Duration of follow‐up: mean 21.1 ± 10.9 months; mean 20.6 ± 10.3 MCI/MCI; mean 22.2 ± 12.4 MCI/ADD At baseline: 36 MCI At follow‐up: 11 converters; 22 non‐converters (Abstract) Number included in analysis: 33 TP = 9; FN = 2; TN = 20; FP = 2 (Table 4, p 2197). Sensitivity: 82%; specificity: 91% (calculated in Review Manager 5) Loss to follow‐up: 3 participants excluded from the analysis: 2 no longer showed any cognitive objective deficit after 26 and 35 months, respectively, and were excluded from the study. Another participant developed fronto‐temporal dementia, according to the current criteria (Knopman 2005) after 1 year and was excluded. |
||
| Comparative | |||
| Notes | |||
| Methodological quality | |||
| Item | Authors' judgement | Risk of bias | Applicability concerns |
| DOMAIN 1: Patient Selection | |||
| Was a consecutive or random sample of patients enrolled? | Unclear | ||
| Was a case‐control design avoided? | Yes | ||
| Did the study avoid inappropriate exclusions? | Yes | ||
| Unclear | Low | ||
| DOMAIN 2: Index Test All tests | |||
| Were the index test results interpreted without knowledge of the results of the reference standard? | Yes | ||
| If a threshold was used, was it pre‐specified? | No | ||
| High | Low | ||
| DOMAIN 3: Reference Standard | |||
| Is the reference standards likely to correctly classify the target condition? | Yes | ||
| Were the reference standard results interpreted without knowledge of the results of the index tests? | Unclear | ||
| Unclear | Low | ||
| DOMAIN 4: Flow and Timing | |||
| Was there an appropriate interval between index test and reference standard? | No | ||
| Did all patients receive the same reference standard? | Yes | ||
| Were all patients included in the analysis? | No | ||
| High | |||
Ossenkoppele 2012a.
| Study characteristics | |||
| Patient sampling | At baseline 15 participants were included in each group: MCI, AD and controls. No further details of participant sampling and recruitment were reported. We only included data on performance of the index test to discriminate between people with MCI who converted to dementia and those who remained stable. Exclusion criteria were a history of major psychiatric or neurological illness (other than AD) and the use of nonsteroidal anti‐inflammatory drugs. People with severe vascular events during the follow‐up period, such as stroke or haemorrhage, were also excluded. |
||
| Patient characteristics and setting | 15 participants diagnosed by the Petersen 1999 criteria. Data reported only on 12 MCI participants. Gender: 9 men; 3 women Age: mean 67 ± 7 years APOE ϵ4 carrier: 8 MMSE: 27 ± 3 Education: median (range): 6 (3 ‐ 7) years Sources of referral: not reported. Sources of recruitment: not reported. |
||
| Index tests | ¹⁸F‐FDG PET scan 150 ± 17 MBq ¹⁸F‐FDG was injected at baseline, and 35 mins later, a 10‐min transmission scan (3 x 5‐min frame) were performed. For regional analysis SUVr of the frontal, parietal and lateral temporal cortices, and the medial temporal lobe and posterior cingulate were calculated. Threshold: visual inspection. Threshold (SUVr of ROI) not reported Index test was conducted before follow‐up. |
||
| Target condition and reference standard(s) | Target condition: conversion from MCI to Alzheimer's disease dementia or other forms of dementia Reference standards: NINCDS‐ADRDA criteria for AD (McKhann 1984); Reference standard for the clinical criteria for FTD not reported. Unclear whether clinicians conducting follow‐up were aware of the ¹⁸F‐FDG results. |
||
| Flow and timing |
Duration of follow‐up: mean interval 2.5 years (range 2 ‐ 4 years) At baseline: 15 MCI participants. Data reported only on 12 MCI participants: 4 FDG positive test; 8 FDG negative test (from the author). At follow‐up: 12 participants: 5 MCI‐converters (4 MCI‐ADD; 1 MCI‐FTD); 8 MCI‐non‐converters MCI (8 MCI‐MCI) (from the author). Number included in analysis: 12 Conversion from MCI to ADD: TP = 3; FP = 1; FN = 1; TN = 7 Conversion from MCI to all dementia: TP = 3; FP = 1; FN = 2; TN = 6 Loss to follow‐up: 3 MCI patients refused to participate in the follow‐up study due to lack of motivation |
||
| Comparative | |||
| Notes | We contacted the trial investigators who provided the relevant data tor the 2 x 2 table to be completed and confirmed there are no overlapping participants with the Ossenkoppele 2012b study (email on 25th July 2013). | ||
| Methodological quality | |||
| Item | Authors' judgement | Risk of bias | Applicability concerns |
| DOMAIN 1: Patient Selection | |||
| Was a consecutive or random sample of patients enrolled? | Unclear | ||
| Was a case‐control design avoided? | Yes | ||
| Did the study avoid inappropriate exclusions? | Yes | ||
| Low | Low | ||
| DOMAIN 2: Index Test All tests | |||
| Were the index test results interpreted without knowledge of the results of the reference standard? | Yes | ||
| If a threshold was used, was it pre‐specified? | No | ||
| High | Low | ||
| DOMAIN 3: Reference Standard | |||
| Is the reference standards likely to correctly classify the target condition? | Yes | ||
| Were the reference standard results interpreted without knowledge of the results of the index tests? | Unclear | ||
| Unclear | Low | ||
| DOMAIN 4: Flow and Timing | |||
| Was there an appropriate interval between index test and reference standard? | Yes | ||
| Did all patients receive the same reference standard? | Yes | ||
| Were all patients included in the analysis? | No | ||
| Low | |||
Ossenkoppele 2012b.
| Study characteristics | |||
| Patient sampling | 154 participants included from the outpatient memory clinic of for assessing the impact of molecular imaging on the diagnostic process. Among those participants there were 30 people with MCI. No further details of participant sampling and recruitment were reported. We only include data on performance of the index test to discriminate between people with MCI who converted to dementia and those who remained stable. Exclusion criteria: major clinical and psychiatric disorders, recent vascular events and excessive substance abuse. |
||
| Patient characteristics and setting | 30 MCI participants diagnosed by the Petersen 2001 criteria at baseline. Gender: 23 men; 7 women Age: 64 ± 9 APOE ϵ4 carrier: not reported MMSE: 27 ± 2 Education: not reported Sources of referral: not reported Sources of recruitment: Outpatient Memory Clinic,the VU University Medical Centre, The Netherlands. |
||
| Index tests | ¹⁸F‐FDG PET scan Threshold: visual inspection. Threshold (SUVr of ROI) not reported. Index test was conducted before follow‐up. |
||
| Target condition and reference standard(s) | Target condition: conversion from MCI to Alzheimer's disease dementia or other forms of dementia Reference standards: NINCDS‐ADRDA criteria for ADD (McKhann 1984); Reference standard for the clinical criteria for FTD not reported. Reference standards performed both with and without the index test results on the total sample. Unclear whether the data reported on 12 participants relate to the reference standards performed with or without the index test results. |
||
| Flow and timing |
Duration of follow‐up: 2 years At baseline: 30 MCI: 15 FDG positive test; 15 FDG negative test (Table 1, p 4) At follow‐up: 12 participants: 7 MCI‐converters (6 MCI‐ADD; 1 FTD); 5 MCI‐non‐converters MCI (5 MCI‐MCI) (from the author) Number included in analysis: 12 Conversion from MCI to ADD: TP = 5; FP = 0; FN = 1; TN = 6 Conversion from MCI to all dementia: TP = 5; FP = 0; FN = 2; TN = 5 Loss to follow‐up:18 MCI participants. No further information. |
||
| Comparative | |||
| Notes | We contacted the trial investigators contacted who provided relevant data tor the 2 x 2 table to be completed and confirmed there are no overlapping participants with the Ossenkoppele 2012a study (email on 25th July 2013) | ||
| Methodological quality | |||
| Item | Authors' judgement | Risk of bias | Applicability concerns |
| DOMAIN 1: Patient Selection | |||
| Was a consecutive or random sample of patients enrolled? | Unclear | ||
| Was a case‐control design avoided? | Yes | ||
| Did the study avoid inappropriate exclusions? | Yes | ||
| Low | Low | ||
| DOMAIN 2: Index Test All tests | |||
| Were the index test results interpreted without knowledge of the results of the reference standard? | Yes | ||
| If a threshold was used, was it pre‐specified? | No | ||
| High | Low | ||
| DOMAIN 3: Reference Standard | |||
| Is the reference standards likely to correctly classify the target condition? | Yes | ||
| Were the reference standard results interpreted without knowledge of the results of the index tests? | Unclear | ||
| Unclear | Low | ||
| DOMAIN 4: Flow and Timing | |||
| Was there an appropriate interval between index test and reference standard? | Yes | ||
| Did all patients receive the same reference standard? | Yes | ||
| Were all patients included in the analysis? | No | ||
| High | |||
Pardo 2010.
| Study characteristics | |||
| Patient sampling | 19 MCI participants and 27 healthy controls underwent extensive medical and laboratory examination. The controls were recruited from the community. Sampling procedure not described. We only include data on performance of the index test to discriminate between participants with MCI who converted to dementia and those who remained stable. Exclusion criteria: not reported. |
||
| Patient characteristics and setting | 19 MCI participants with MCI, diagnosed by the Petersen 1999 criteria at baseline. Gender: not reported Age: mean 80 years; range: 54 ‐ 83 years APOEɛ4: not reported MMSE: not reported Education: not reported Sources of referral: not reported Sources of recruitment: Memory loss clinic, Geriatric, Research, Education, and Clinical Center, the Minneapolis Veterans Affairs Medical Center MVAMC) in Minneapolis, USA |
||
| Index tests | ¹⁸F‐FDG PET scan Participants received an intravenous injection of ¹⁸F‐FDG at a dose of 5 mCi/70 kg, as they reclined with eyes closed and ears open in a quiet dark room. After a 30‐min uptake period, they were transferred to an ECAT 953B or ECAT Exact scanner (Siemens, Knoxville, TN). Attenuation was measured. No arterial catheters were used for absolute quantitation. Baseline PET scan analysis was performed visually independently by two blinded, experienced physicians. The readers characterised the scans as normal or abnormal (if abnormal, ADD or FTD pattern). The patterns on which the PET readers characterised the scans as ADD or FTD are described in detail in the paper (p 328, paragraph 2.3). Also in 13 MCI cases and 15 controls, a computerised classifier (SVM) was applied. Using this method, 2 features were defined: lobe and cluster. Threshold: visual interpretation; threshold not prespecified. The only thresholds applied were those used for SVM analysis: Based on the lobar features, a brain lobe was labelled as MCI or normal if ≥ 50% of the cubes had the label MCI or normal respectively. The cluster feature used a template based on the average image of the MCI participants. Each cluster or connected region was identified by using a t threshold of 2. Index test was conducted before follow‐up. The readers of the PET scan were blinded to each other's opinions. |
||
| Target condition and reference standard(s) | Target condition: conversion from MCI to Alzheimer's disease dementia or other forms of dementia (FTD and LBD). Reference standard: not reported. Unclear whether clinicians conducting follow‐up were aware of the ¹⁸F‐FDG results. |
||
| Flow and timing |
Duration of follow‐up: 3 years At follow‐up: JVP characterised the baseline PET scans of the 19 MCI participants as: 6 ADD, 1 FTD, 11 HC (healthy control), 1 artefact (non‐diagnostic). In summary: 7 PET (+) participants, 11 PET (‐) participants, 1 non‐diagnostic (for all forms of dementia); MAK characterised the baseline PET scans of the 19 MCI participants as: 10 ADD, 1 ADD/FTD, 3 FTD, 5 HC. In summary: 14 PET (+) participants, 5 PET (‐) participants (for all forms of dementia). Number included in analysis: 18 participants for JVP Note: The participant with ‘artefact’ PET scan not included; 19 participants for MAK. 1) Conversion from MCI to ADD (Table 2, p 331). Reader1 (JVP) At follow‐up: TP = 2; FP = 4; FN = 6; TN = 6 Reader2 (MAK): At follow‐up: TP = 3; FP = 7; FN = 6; TN = 3 Note: The PET scan read as ADD/FTD by MAK was accounted as index test (‐) 2) Conversion from MCI to any form of dementia (Table 2, p 331) Reader1 (JVP) TP = 6; FP = 1; FN = 7; TN = 4 Reader2 (MAK) At follow‐up: TP = 9; FP = 5; FN = 5; TN = 0 Note: The PET scan read as ADD/FTD by MAK was accounted as index test (+) Loss to follow‐up: none |
||
| Comparative | |||
| Notes | |||
| Methodological quality | |||
| Item | Authors' judgement | Risk of bias | Applicability concerns |
| DOMAIN 1: Patient Selection | |||
| Was a consecutive or random sample of patients enrolled? | Unclear | ||
| Was a case‐control design avoided? | Yes | ||
| Did the study avoid inappropriate exclusions? | Unclear | ||
| High | Low | ||
| DOMAIN 2: Index Test All tests | |||
| Were the index test results interpreted without knowledge of the results of the reference standard? | Unclear | ||
| If a threshold was used, was it pre‐specified? | No | ||
| High | Low | ||
| DOMAIN 3: Reference Standard | |||
| Is the reference standards likely to correctly classify the target condition? | Unclear | ||
| Were the reference standard results interpreted without knowledge of the results of the index tests? | Unclear | ||
| High | High | ||
| DOMAIN 4: Flow and Timing | |||
| Was there an appropriate interval between index test and reference standard? | Yes | ||
| Did all patients receive the same reference standard? | Unclear | ||
| Were all patients included in the analysis? | Yes | ||
| Unclear | |||
Schmand 2012.
| Study characteristics | |||
| Patient sampling | 175 MCI participants’ data, available for all measures of interest, were used from ADNI, a multicentre project with approximately 50 medical centre and university sites across the United States and Canada. Sample procedure was not described for the study participants. Exclusion criteria: people who used antidepressant medications with anti‐cholinergic properties, or those who used drugs with narcotic properties were excluded, but use of oestrogens, cholinesterase inhibitors, or vitamin E was allowed if the dose remained stable. |
||
| Patient characteristics and setting | 89 MCI ADNI participants diagnosed by the Petersen 2010 criteria who had a ¹⁸F‐FDG scan at baseline. Demographic data reported on total sample (175 MCI). Gender: converters: 31 women, 50 men; non‐converters: 30 women, 64 men Age: converters: 74.4 ± 7.4; non‐converters: 74.1 ± 7.6 APOEɛ4: not reported MMSE: converters: 26.6 ± 1.8; non‐converters: 27.2 ± 1.7 Education: converters: 15.6 ± 3.0; non‐converters: 15.8 ± 3.9 Sources of referral: not reported Sources of recruitment: multicenter |
||
| Index tests | ¹⁸F‐FDG PET scan Using ¹⁸F‐FDG acquired, controlled, and analysed according to the ADNI protocol, ROI approaches (UC Berkeley) resulted in a set of 5 regions located in right and left angular gyri, bilateral posterior cingulate gyrus, and left middle/inferior temporal gyrus. Because these ROIs were highly correlated (Jagust 2010), we averaged them across participants. This composite ROI was used in the present analyses. Threshold: was based on the predicted probability of conversion to dementia as obtained from a logistic regression analysis with conversion as dependent variable and the rCGM of the ROI, described in the paper as the predictor. If this predicted probability was > 0.5, the ¹⁸F‐FDG was considered positive. This corresponds to a rCGM value of < 1.20; prespecified (Dr Schmand email on 13th August 2013). Index test was conducted before follow‐up. |
||
| Target condition and reference standard(s) | Target condition: conversion from MCI to Alzheimer's disease dementia Reference standard: NINCDS/ADRDA criteria of probable ADD (including a MMSE score between 20 and 26, and a CDR score of at least 0.5). Unclear whether clinicians conducting follow‐up were aware of the ¹⁸F‐FDG results. |
||
| Flow and timing |
Duration of follow‐up: mean: 2.7 ± 0.9 years; range: 0.5 ‐ 4.6 years Information from the author: At baseline: 18 participants with ¹⁸F‐FDG test positive tests; 71 participants with ¹⁸F‐FDG negative tests At follow‐up: 18 with abnormal ¹⁸F‐FDG PET scan: 9 MCI‐converters (MCI‐ADD) and 9 MCI‐non‐converters (MCI‐MCI); 71 with normal ¹⁸F‐FDG PET scan: 29 MCI‐converters (MCI‐ADD) and 42 MCI‐non‐converters (MCI‐MCI) Number included in analysis: 98 TP = 9; FP = 9; FN = 29; TN = 42 Loss to follow‐up: none |
||
| Comparative | |||
| Notes | We contacted the trial investigators contacted who provided relevant data tor the 2 x 2 table to be completed (email on 13th August 2013) | ||
| Methodological quality | |||
| Item | Authors' judgement | Risk of bias | Applicability concerns |
| DOMAIN 1: Patient Selection | |||
| Was a consecutive or random sample of patients enrolled? | Unclear | ||
| Was a case‐control design avoided? | Yes | ||
| Did the study avoid inappropriate exclusions? | Yes | ||
| Unclear | Low | ||
| DOMAIN 2: Index Test All tests | |||
| Were the index test results interpreted without knowledge of the results of the reference standard? | Yes | ||
| If a threshold was used, was it pre‐specified? | Yes | ||
| Low | Low | ||
| DOMAIN 3: Reference Standard | |||
| Is the reference standards likely to correctly classify the target condition? | Yes | ||
| Were the reference standard results interpreted without knowledge of the results of the index tests? | Unclear | ||
| Unclear | Low | ||
| DOMAIN 4: Flow and Timing | |||
| Was there an appropriate interval between index test and reference standard? | Yes | ||
| Did all patients receive the same reference standard? | Yes | ||
| Were all patients included in the analysis? | Yes | ||
| Low | |||
AD: Alzheimer's disease ADAS: Alzheimer's Disease Assessment Scale ADD: Alzheimer's disease dementia APOE Ԑ4: apolipoprotein ϵ4 allele gene status CDR: clinical dementia rating FN: false negatives FP: false positives FTD: fronto‐temporal dementia IMI: isolated memory impairment LBD: Lewy body dementia MCI: mild cognitive impairment MCI‐ADD: People with MCI converted to ADD) (MCI converters) MCI‐MCI: People with stable MCI (MCI non‐converters) MCI‐NC: People with stable MCI (MCI non‐converters) MMSE: mini‐mental state examination aMCI: amnestic MCI sna‐MCI: single‐non‐amnestic MCI P‐MCI: progressive MCI ROI: region of interest S‐MCI: stable MCI SUVr: standardised uptake value ratio
SVM: support vector machine NPV: negative predictive value PPV: positive predictive value TN: true negatives TP: true positives
Characteristics of excluded studies [ordered by study ID]
| Study | Reason for exclusion |
|---|---|
| Bastin 2010 | Insufficient data to complete 2 x 2 table. Additional data were requested from the trial investigators. Study design: threshold not used (Author's email on 14th August 2012) |
| Beckett 2010 | Study design: threshold not used. The focus of the study was to compare annual changes in rCMRglc levels between MCI converters and MCI non‐converters at follow‐up (ADNI study). |
| Charil 2011 | Study design: threshold not used. The focus of the study was to investigate annual changes in FDG‐PET scans in different study groups (ADNI study). |
| Chen 2010 | Target condition: not conversion from MCI to dementia. Study design: threshold not used. The focus of the study was the measurement of the cerebral metabolic rate for glucose over a 12‐month period (ADNI study). |
| Chételat 2001 | Study design: threshold not used. The focus of the study was to statistically compare initial PET data of people who developed ADD to those who did not at follow‐up. |
| Chételat 2005 | Target condition: not conversion from MCI to dementia. Study design: threshold not used. The focus of the study was the measurement of the cerebral metabolic rate for glucose and comparison between that measurement and neuropsychological assessment in predicting global cognitive deterioration in people with MCI over an 18‐month period. |
| Desikan 2010 | Insufficient data to complete 2 x 2 table. Additional data were requested from the trial investigators but no further information was available at the time this review was prepared. Study design: threshold not used (ADNI study). |
| Drzezga 2003 | Insufficient data to complete 2 x 2 table. Additional data were requested from the trial investigators but no further information was available at the time this review was prepared. Study design: threshold not used. The focus of the study was to evaluate changes in the baseline and follow‐up ¹⁸F‐FDG‐PET scans. |
| Forsberg 2008 | Study design: threshold not used. The focus of the study was to compare rCMRglc levels between MCI converters and MCI non‐converters at follow‐up. |
| Garibotto 2008 | Study design: threshold not used. The focus of the study was to assess education and occupation as proxies for reserve in aMCI converters. |
| Gray 2012 | Study design: threshold not used. The focus of the study was to investigate the value of combining cross‐sectional and longitudinal multi‐region FDG‐PET information for classification of Alzheimer's disease (ADNI study). |
| Hunt 2007 | Study design: threshold not used. The focus of the study was to compare rCMRglc levels between MCI converters and MCI non‐converters at follow‐up. |
| Ishii 2009 | Insufficient data to complete 2 x 2 table. Additional data were requested from the trial investigators but no further information was available at the time this review was prepared. Study design: threshold not used. The focus of the study was to compare rCMRglc levels between MCI converters and MCI non‐converters at follow‐up. |
| Ishii 2011 | Insufficient data to complete 2 x 2 table. Additional data were requested from the trial investigators but no further information was available at the time this review was prepared. |
| Jagust 2007 | Target condition: not conversion from MCI to dementia. Study design: threshold not used. |
| Kadir 2012 | Study design: threshold not used. The focus of the study was to examine dynamic changes in FDG imaging at different stages of Alzheimer's disease. |
| Kawashima 2012 | Study design: threshold not used. The focus of the study was to examine the association between baseline profiles and risk of early conversion to ADD (ADNI study). |
| Kim 2010 | Insufficient data to complete 2 x 2 table. Additional data were requested from the trial investigators. Study design: threshold not used (Author's email on 4th October 2013) |
| Landau 2011 | Study design: threshold not used. The focus of the study was to assess annual changes in biomarkers (ADNI study). |
| Landau 2012 | Insufficient data to complete 2 x 2 table. Additional data were requested from the trial investigators but no further information was available at the time this review was prepared |
| Lee 2011 | Insufficient data to complete 2 x 2 table. Additional data were requested from the trial investigators but no further information was available at the time this review was prepared. |
| Lo 2011 | Target condition: not conversion from MCI to dementia. Study design: threshold not used. The focus of the study was to investigate rates of change in level of FDG uptake (ADNI study).. |
| Lo 2012 | Target condition: not conversion from MCI to dementia. Study design: threshold not used. The focus of the study was to investigate the vascular contribution to longitudinal changes of rCMRglc in MCI and ADD participants (ADNI study). |
| Lorenzi 2010 | Target condition: not conversion from MCI to dementia. Study design: threshold not used. The focus of the study was to assess the benefit of the enrichment of MCI participants with true Alzheimer's disease cases by means of ¹⁸F‐FDG‐PET scan and other biomarkers (ADNI study). |
| Lucidi 2012 | Insufficient data to complete 2 x 2 table. Additional data were requested from the trial investigators but no further information was available at the time this review was prepared. |
| Morbelli 2010 | Insufficient data to complete 2 x 2 table. Additional data were requested from the trial investigators but no further information was available at the time this review was prepared. Study design: threshold not used. The focus of the study was to concurrently investigate patterns of hypometabolism and athrophy in people with aMCI converted to ADD. |
| Morbelli 2012 | Study design: threshold not used. The focus of the study was to explore resting‐state metabolic connectivity in people with aMCI who converted to ADD at follow‐up. |
| Pagani 2010 | Study design: threshold not used. The focus of the study was to test the hypothesis that the combination of memory and brain metabolic assessment could identify subgroups of those MCI who would convert or would not convert to dementia at follow‐up. |
| Small 1995 | Study design: threshold not used. The focus of the study was to investigate predictors of cognitive changes in middle‐aged and older adults with memory loss. |
| Torosyan 2011 | Insufficient data to complete 2 x 2 table. Additional data were requested from the trial investigators but no further information was available at the time this review was prepared. |
| Walhovd 2010 | Study design: threshold not used. The focus of the study was to combine FDG‐PET, MRI and CSF biomarkers in the 2‐year prognosis of MCI and Alzheimer's disease participants (ADNI study). |
| Zhang 2012 | Insufficient data to complete 2X2 table. Additional data were requested from the trial investigators but no further information was available at the time this review was prepared. Study design: threshold not used. The focus of the study was to assess the predictive value of longitudinal and multimodal biomarkers in conversion from MCI to ADD (ADNI study). |
ADD: Alzheimer's disease dementia ADNI: Alzhiemer's disease neurimaging initiative CSF: cerebro‐spinal fluid MCI: mild cognitive impairment MRI: magneitc resonance imaging
Differences between protocol and review
Investigation of heterogeneity:
We planned (New Reference) to investigate the following but these were not undertaken:
Spectrum of participants ((mean age, gender, Mini‐Mental State Examination (MMSE) score, apolipoprotein (APOE) ϵ4 allele gene status))
Referral centres: primary care, memory clinic, and hospital
Clinical criteria of mild cognitive impairment (MCI): Petersen criteria, revised Petersen criteria, CDR = 0.5 criteria, and different MCI classification (Matthews 2008)
¹⁸F‐FDG reduction regions
Image analysis techniques
Time between ¹⁸F‐FDG injection and positron emission tomography (PET) acquisition
¹⁸F‐FDG injection dose
¹⁸F‐FDG retention detecting regions
Reference standard(s) used: NINCDS‐ADRDA, DSM, and ICD10 for Alzheimer's disease dementia
Aspects of study quality, particularly inadequate blinding and loss to follow‐up: consider separately those studies that have more than 20% drop‐out
Sensitivity analysis to investigate the influence of limiting permitted time between index test and dementia diagnosis on overall diagnostic accuracy of the ¹⁸F‐FDG PET biomarker.
We also planned to perform a sensitivity analysis with and without the intention‐to‐diagnose approach, but we were not able to do so due to the small number of studies included.
Contributions of authors
NS: designed and drafted the protocol; overall responsibility for study selection and data extraction; completed characteristics of included and excluded studies tables; entered data into Review Manager 5 and data entry check; QUADAS‐2 assessment; set up data and analysis tables; drafted analysis plan; completed 'Summary of findings' table and additional tables; updated Methods and drafted the Results section; drafted Discussion section and finalised manuscript; managed the review process and produced progress reports, attended progress meetings and worked with all review authors to ensure that the review met publication deadlines.
MV: contributed to design; study selection; contributed to data extraction; drafted Discussion section
CH: conception, funding, design; reviewed the draft protocol and manuscript
OU: performed statistical analyses and reviewed the draft manuscript
SM: QUADAS 2 assessment; contributed to the Results and Discussion section
CS: contributed to design and drafted Index test sections; study selection and data extraction; data entry check; drafted Implication for practice and research and Author's conclusions; reviewed the draft manuscript; as the expert in the ¹⁸F‐FDG imaging overall responsibility of the review
Declarations of interest
NS, MV, CH, SM, OU, CS: declare no conflict of interest.
Nadja Smailagic and Marco Vacante are to be considered as joint first authors of this review
Edited (no change to conclusions)
References
References to studies included in this review
Anchisi 2005 {published data only}
- Anchisi D, Borroni B, Franceschi M, Kerrouche N, Kalbe E, Kerrouche N, at al. Heterogeneity of brain glucose metabolism in mild cognitive impairment and clinical progression to Alzheimer disease. Archives of Neurology 2005;62(11):1728‐33. [DOI] [PubMed] [Google Scholar]
Arnáiz 2001 {published data only}
- Arnáiz E, Jelic V, Almkvist O, Wahlund L‐O, Winbald B, Valind S, et al. Impaired cerebral glucose metabolism and cognitive functioning predict deterioration in mild cognitive impairment. Neuroreport 2001;12(4):851‐5. [DOI] [PubMed] [Google Scholar]
Berent 1999 {published data only}
- Berent S, Giordani B, Foster N, Minoshima S, Lajiness‐O'Neill R, Koeppe R, et al. Neuropsychological function and cerebral glucose utilization in isolated memory impairment and Alzheimer's disease. Journal of Psychiatric Research 1999;33(1):7‐16. [DOI] [PubMed] [Google Scholar]
Chételat 2003 {published data only}
- Chételat G, Desgranges B, Sayette V, Viadre F, Eustache F, Baron JC. Mild cognitive impairment: can FDG‐PET predict who is to rapidly convert to Alzheimer's disease?. Neurology 2003;60(8):1374‐7. [DOI] [PubMed] [Google Scholar]
Clerici 2009 {published data only}
- Clerici F. Differences in hippocampal metabolism between amnestic and non‐amnestic MCI subjects: automated FDG‐PET image analysis. Quarterly Journal of Nuclear Medicine and Molecular Imaging 2009;53(6):646‐57. [PubMed] [Google Scholar]
Drzezga 2005 {published data only}
- Drzezga A, Grimmer T, Rimenschneider M, Lautenschlager N, Siebner H, Alexopoulus, et al. Prediction of individual clinical outcome in MCI by means of genetic assessment and (18)F‐FDG PET. Journal of Nuclear Medicine 2005;46(10):1625‐32. [PubMed] [Google Scholar]
Fellgiebel 2007 {published data only}
- Fellgiebel A, Scheurich A, Bartenstein P, Müller MJ. FDG‐PET and CSF phospho‐tau for prediction of cognitive decline in mild cognitive impairment. Psychiatry Research 2007;155(2):167‐71. [DOI] [PubMed] [Google Scholar]
Galluzzi 2010 {published data only}
- Galluzzi S, Geroldi, C, Ghidoni R, Paghera B, Amicucci B, Bonetti M, et al. The new Alzheimer’s criteria in a naturalistic series of patients with mild cognitive impairment. Journal of Neurology 2010;257(12):2004–14. [DOI] [PubMed] [Google Scholar]
Herholz 2011 {published data only}
- Herholz K, Westwood S, Haense C, Dunn G. Evaluation of a calibrated (18)F‐FDG PET score as a biomarker for progression in Alzheimer disease and mild cognitive impairment. Journal of Nuclear Medicine 2011;52(8):1218‐26. [DOI] [PubMed] [Google Scholar]
Landau 2010 {published data only}
- Landau SM, Harvey D, Madison CM, Reiman EM, Foster NL, Aisen PS, et al. Comparing predictors of conversion and decline in mild cognitive impairment. Neurology 2010;75(3):230‐8. [DOI] [PMC free article] [PubMed] [Google Scholar]
Mosconi 2004 {published data only}
- Mosconi L, Perani D, Sorbi S, Herholz K, Nacmias B, Holthoff V, et al. MCI conversion to dementia and APOE genotype: a prediction study with FDG‐PET. Neurology 2004;63(12):2332‐40. [DOI] [PubMed] [Google Scholar]
Nobili 2008 {published data only}
- Nobili F, Salmaso D, Morbelli S, Girtler N, Piccardo A, Brugnolo A, et al. Principal component analysis of FDG PET in amnestic MCI. European Journal of Nuclear Medicine and Molecular Imaging 2008;35(12):2191‐202. [DOI] [PubMed] [Google Scholar]
Ossenkoppele 2012a {published data only}
- Ossenkoppele R, Tolboom N, Foster‐Dingley JC, Adriaanse SF, Boellaard R, Yaqub M, et al. Longitudinal imaging of Alzheimer pathology using [11C]PIB, [18F]FDDNP and [18F]FDG PET. European Journal of Nuclear Medicine and Molecular Imaging 2012;39(6):990‐1000. [DOI] [PubMed] [Google Scholar]
Ossenkoppele 2012b {published data only}
- Ossenkoppele R, Prins N, Pijnenburg YAL, Lemstra AW, Flier WM, Adriaanse SF, et al. Impact of molecular imaging on the diagnostic process in a memory clinic. Alzheimer's & Dementia 2012;9(4):414‐21. [DOI] [PubMed] [Google Scholar]
Pardo 2010 {published data only}
- Pardo JV, Lee JT, Kuskowski MA, Munch KR, Carlis JV, Sheikh SA, et al. Fluorodeoxiglucose positron emission tomography of mild cognitive impairment with clinical follow‐up at 3 years. Alzheimer's & Dementia 2010;6(4):326‐33. [DOI] [PMC free article] [PubMed] [Google Scholar]
Schmand 2012 {published data only}
- Schmand B, Eikelenboom P, Gool WA, Alzheimer's Disease Neuroimaging Initiative. Value of diagnostic tests to predict conversion to Alzheimer’s Disease in young and old patients with amnestic mild cognitive impairment. Journal of Alzheimer's Disease 2012;29(3):641‐8. [DOI] [PubMed] [Google Scholar]
References to studies excluded from this review
Bastin 2010 {published data only}
Beckett 2010 {published data only}
- Beckett LA, Harvey DJ, Gamst A, Donohue M, Kornak J, Zhang H, et al. The Alzheimer's Disease Neuroimaging Initiative: Annual change in biomarkers and clinical outcomes. Alzheimer's & Dementia 2010; Vol. 6, issue 3:257‐64. [1552‐5260] [DOI] [PMC free article] [PubMed]
Charil 2011 {published data only}
- Charil A, Carbonell F, Reilhac A, Deduck K, Sood R, Evans A. Changes in MRI cortical thickness and [18F]FDG PET data over 24 months in subjects from the Alzheimer's disease neuroimaging initiative (ADNI) study. Alzheimer's and Dementia Conference: Alzheimer's Association International Conference, AAIC 11 Paris France. Conference Publication. 2011.
Chen 2010 {published data only}
- Chen K, Langbaum JB, Fleisher AS, Ayutyanont N, Reschke C, Lee W, et al. Twelve‐month metabolic declines in probable Alzheimer's disease and amnestic mild cognitive impairment assessed using an empirically pre‐defined statistical region‐of‐interest: findings from the Alzheimer's Disease Neuroimaging Initiative. NeuroImage 2010; Vol. 51, issue 2:654‐64. [1053‐8119] [DOI] [PMC free article] [PubMed]
Chételat 2001 {published data only}
- Chételat G, Desgranges B, Sayette V, Lalevee C, Landeau B, Dupuy B. Metabolic profile of patients with mild cognitive impairment (MCI) destined to convert to Alzheimer's disease (AD). Society for Neuroscience Abstracts 2001;27(1):196. [Google Scholar]
Chételat 2005 {published data only}
Desikan 2010 {published data only}
- Desikan RS, Cabral HJ, Settecase F, Hess CP, Dillon WP, Glastonbury CM, et al. Automated MRI measures predict progression to Alzheimer's disease. Neurobiology of Aging 2010; Vol. 31, issue 8:1364‐74. [DOI] [PMC free article] [PubMed]
Drzezga 2003 {published data only}
- Drzezga A, Lautenschlager N, Siebner H, Reimenschneider M, Willoch F, Minoshima S, et al. Cerebral metabolic changes accompanying conversion of mild cognitive impairment into Alzheimer's disease: a PET follow‐up study. European Journal of Nuclear Medicine and Molecular Imaging 2003;30(8):1104‐13. [DOI] [PubMed] [Google Scholar]
Forsberg 2008 {published data only}
Garibotto 2008 {published data only}
- Garibotto V, Borroni B, Kalbe E, Herholz K, Salmon E, Holtoff V, et al. Education and occupation as proxies for reserve in aMCI converters and AD FDG‐PET evidence. Neurology 2008;71(17):1342‐9. [DOI] [PubMed] [Google Scholar]
Gray 2012 {published data only}
- Gray KR, Wolz R, Heckemann RA, Aljabar P, Hammers A, Rueckert D. Multi‐region analysis of longitudinal FDG‐PET for the classification of Alzheimer's disease. NeuroImage 2012;60(1):221‐9. [DOI] [PMC free article] [PubMed] [Google Scholar]
Hunt 2007 {published data only}
- Hunt A, Schönknecht P, Henze M, Seidl U, Haberkorn U, Schröder J. Reduced cerebral glucose metabolism in patients at risk for Alzheimer's disease. Psychiatry Research 2007;155(2):147‐54. [DOI] [PubMed] [Google Scholar]
Ishii 2009 {published data only}
- Ishii H, Ishikawa H, Meguro K, Tashiro M, Yamaguchi S. Decreased cortical glucose metabolism in converters from CDR 0.5 to Alzheimer's disease in a community: the Osaki‐Tajiri Project. International Psychogeriatrics 2009;21(1):148‐56. [DOI] [PubMed] [Google Scholar]
Ishii 2011 {published data only}
- Ishii K, Ito K, Senda M, Kato T, Fukuyama H, Ouchi Y, Meguro K, et al. SEAD‐J Group. FDG‐PET and automatic diagnosis systems for prediction of conversion to Alzheimer disease in subjects with mild cognitive impairments: Study on diagnosis of early Alzheimer disease‐Japan (SEAD‐J). Annual Congress of the European Association of Nuclear Medicine, Birmingham. Conference Publication. 2011.
Jagust 2007 {published data only}
- Jagust W, Reed B, Mungas D, Ellis W, Decarli C. What does fluorodeoxyglucose PET imaging add to a clinical diagnosis of dementia?. Neurology 2007;69(9):871‐7. [DOI] [PubMed] [Google Scholar]
Kadir 2012 {published data only}
- Kadir A, Almkvist O, Forsberg A, Wall A, Engler H, Langstrom B, Nordberg A. Dynamic changes in PET amyloid and FDG imaging at different stages of Alzheimer's disease. Neurobiology of Aging 2012;33(1):198.e1‐14. [DOI] [PubMed] [Google Scholar]
Kawashima 2012 {published data only}
- Kawashima S, Ito K, Kato T, SEAD‐J Study Group. Inclusion criteria provide heterogeneity in baseline profiles of patients with mild cognitive impairment: comparison of two prospective cohort studies. BMJ Open 2012;2(2):e000773. [DOI] [PMC free article] [PubMed] [Google Scholar]
Kim 2010 {published data only}
- Kim SK, Seo SW, Yoon DS, Chin J, Lee BH, Cheong HK, et al. Comparison of neuropsychological and FDG‐PET findings between early‐ versus late‐onset mild cognitive impairment: A five‐year longitudinal study. Dementia and Geriatric Cognitive Disorders 2010;29(3):213‐23. [DOI] [PubMed] [Google Scholar]
Landau 2011 {published data only}
- Landau SM, Harvey D, Madison CM, Koeppe RA, Reiman EM, Foster NL, Weiner MW, Jagust WJ, the Alzheimer's Disease Neuroimaging Initiative. Associations between cognitive, functional, and FDG‐PET measures of decline in AD and MC. Neurobiology of Aging 2011;32(7):1207‐18. [DOI] [PMC free article] [PubMed] [Google Scholar]
Landau 2012 {published data only}
- Landau SM, Mintun MA, Joshi AD, Koeppe RA, Petersen RC, Aisen PS, at al, Alzheimer's Disease Neuroimaging Initiative. Amyloid deposition, hypometabolism, and longitudinal cognitive decline. Annals of Neurology 2012;72(4):578‐86. [DOI] [PMC free article] [PubMed] [Google Scholar]
Lee 2011 {published data only}
- Lee DY, Choo LLH, Seo EH, Sohn BK, Park JH, Kim JW, et al. Combination of cerebral metabolic and cognitive information as a better predictor of the conversion to Alzheimer's disease in mild cognitive impairment: A two‐year follow‐up study. Alzheimer's & Dementia 2011;7(4 Supplement):S29. [Google Scholar]
Lo 2011 {published data only}
- Lo RY, Hubbard AlE, Shaw LM, Trojanowski JQ, Petersen RC, Aisen PS. Longitudinal change of biomarkers in cognitive decline. Archives of Neurology 2011;68(10):1257‐66. [DOI] [PMC free article] [PubMed] [Google Scholar]
Lo 2012 {published data only}
- Lo RY, Jagust W. Vascular burden and Alzheimer disease pathologic progression. Neurology 2012;79(13):1349‐55. [DOI] [PMC free article] [PubMed] [Google Scholar]
Lorenzi 2010 {published data only}
- Lorenzi M, Donohue M, Paternico D, Scarpazza C, Ostrowictzki S, Blin O, et al. Enrichment through biomarkers in clinical trials of Alzheimer's drugs in patients with mild cognitive impairment. Neurobiology 2010;31(8):1443‐51. [DOI] [PubMed] [Google Scholar]
Lucidi 2012 {published data only}
- Lucidi G, Marini S, Nacmias B, Berti V, Bessi V, Bracco L et al . Journal of Alzheimer's Disease Conference: 7th Congresso Sindem: Italian Association for the Study of Dementia Linked to the Italian Neurological Society, SIN Naples Italy. Multidisciplinary approach to MCI help to evaluate risk of conversion in AD. Journal of Alzheimer's Disease Conference: 7th Congresso Sindem: Italian Association for the Study of Dementia Linked to the Italian Neurological Society, SIN Naples Italy. 2012:(var.pagings).
Morbelli 2010 {published data only}
- Morbelli S, Piccardo A, Villavecchia G, Dessi B, Brugnolo A, Piccini A, et al. Mapping brain morphological and functional conversion patterns in amnestic MCI: a voxel‐based MRI and FDG‐PET study. European Journal of Nuclear Medicine and Molecular Imaging 2010;37(1):36‐45. [1619‐7070] [DOI] [PubMed] [Google Scholar]
Morbelli 2012 {published data only}
- Morbelli S, Drzezga A, Perneczky R, Frisoni GB, Caroli A, Berckel BNM, et al. Resting metabolic connectivity in prodromal Alzheimer's disease. A European Alzheimer Disease Consortium (EADC) project. Neurobiology of Aging 2012;33(11):2533‐50. [DOI] [PubMed] [Google Scholar]
Pagani 2010 {published data only}
- Pagani M, Dessi B, Morbelli S, Brugnolo A, Salmaso D, Piccini A. MCI patients declining and not‐declining at mid‐term follow‐up: FDG‐PET findings. Current Alzheimer Research 2010;7(4):287‐94. [DOI] [PubMed] [Google Scholar]
Small 1995 {published data only}
- Small GW, Rue A, Komo S, Kaplan A, Mandelkern MA. Predictors of cognitive change in middle‐aged and older adults with memory loss. American Journal of Psychiatry 1995;152(12):1757‐64. [DOI] [PubMed] [Google Scholar]
Torosyan 2011 {published data only}
- Torosyan N, Mason K, Dahlbom M, Silverman DH. Predictive value of FDG‐PET scans for conversion from mild cognitive impairment to dementia by subjects participating in the Alzheimer’s Disease Neuroimaging Initiative study, using a metabolic index generated with clinically routine software. Molecular Imaging and Biology Conference: 2011 World Molecular Imaging Congres, San Diego, CA United States. Conference Publication. 2011.
Walhovd 2010 {published data only}
- Walhovd KB, Fjell AM, Brewer J, McEvoy LK, Fennema‐Notestine C, Hagler DJ, et al. Combining MR imaging, positron‐emission tomography, and CSF biomarkers in the diagnosis and prognosis of Alzheimer disease. AJNR: American Journal of Neuroradiology 2010;31(2):347‐54. [DOI] [PMC free article] [PubMed] [Google Scholar]
Zhang 2012 {published data only}
- Zhang D, Shen D. Predicting future clinical changes of MCI patients using longitudinal and multimodal biomarkers. PLoS One 2012;7(3):e33182. [DOI] [PMC free article] [PubMed] [Google Scholar]
Additional references
Albert 2011
- Albert MS, DeKosky ST, Dickson D, Dubois B, Feldman HH, Fox NC, et al. The diagnosis of mild cognitive impairment due to Alzheimer’s disease: Recommendations from the National Institute on Aging‐Alzheimer’s Association workgroups on diagnostic guidelines for Alzheimer's disease. Alzheimer's & Dementia 2011;7(3):270‐9. [1552‐5260] [DOI] [PMC free article] [PubMed] [Google Scholar]
APA 1987
- American Psychiatric Association. Diagnostic and Statistical Manual of Mental Disorders (DSM‐III‐R). 3rd Edition. Washington DC: American Psychiatric Association, 1987. [Google Scholar]
APA 1994
- American Psychiatric Association. Diagnostic and Statistical Manual of Mental Disorders (DSM‐IV‐TR). 4th Edition. Washington DC: American Psychiatric Association, 1994. [Google Scholar]
Ballard 2011
- Ballard C, Gauthier S, Corbett A, Brayne C, Aarsland D, Jones E. Alzheimer's disease. Lancet 2011;377(9770):1019‐31. [PUBMED: 21371747] [DOI] [PubMed] [Google Scholar]
Bartenstein 1997
- Bartenstein P, Minoshima S, Hirsch C, Buch K, Willoch F, Mösch D, et al. Quantitative assessment of cerebral blood flow in patients with Alzheimer’s disease by SPECT. Journal of Nuclear Medicine 1997;38(7):1095–101. [PubMed] [Google Scholar]
Bartenstein 2002
- Bartenstein P, Asenbaum S, Catafau A, Halldin C, Pilowski L, Pupi A, et al. European Association of Nuclear Medicine procedure guidelines for brain imaging using [18F]FDG. European Journal of Nuclear Medicine and Molecular Imaging 2002;29(10):BP43–8. [PubMed] [Google Scholar]
Beynon 2013
- Beynon R, Leeflang MM, McDonald S, Eisinga A, Mitchell RL, Whiting P, et al. Search strategies to identify diagnostic accuracy studies in MEDLINE and EMBASE. Cochrane Database of Systematic Reviews 2013, Issue 9. [DOI: 10.1002/14651858.MR000022.pub3] [DOI] [PMC free article] [PubMed] [Google Scholar]
Birks 2006
- Birks J. Cholinesterase inhibitors for Alzheimer's disease. Cochrane Database of Systematic Reviews 2006, Issue 1. [DOI: 10.1002/14651858.CD005593] [DOI] [PMC free article] [PubMed] [Google Scholar]
Bohnen 2012
- Bohnen NI, Djang DSW, Herholz K, Anzai Y, Minoshima S. Effectiveness and safety of 18F‐FDG PET in the evaluation of dementia: a review of the recent literature. Journal of Nuclear Medicine 2012;53(1):59‐71. [DOI] [PubMed] [Google Scholar]
Bossuyt 2004
- Bossuyt PM, Reitsma JB, Bruns DE, Gatsonis CA, Glasziou PP, Irwig LM, et al. Towards complete and accurate reporting of studies of diagnostic accuracy: the STARD initiative. Family Practice 2004;21(1):4‐10. [0263‐2136] [DOI] [PubMed] [Google Scholar]
Bossuyt 2008
- Bossuyt PM, Leeflang MM. Developing criteria for including studies. Cochrane Handbook for Systematic Reviews of Diagnostic Test Accuracy. Chapter 6. Version 0.4. srdta.cochrane.org/sites/srdta.cochrane.org/files/uploads/Chapter06‐Including‐Studies%20%28September‐2008%29.pdf 2008.
Boxer 2005
Braak 1991
Bruscoli 2004
Brück 2013
- Brück A, Virta JR, Koivunen J, Koikkalainen J, Scheinin NM, Helenius H, et al. [11C]PIB, [18F]FDG and MR imaging in patients with mild cognitive impairment. European Journal of Nuclear Medicine and Molecular Imaging 2013;40(10):1567‐72. [DOI] [PubMed] [Google Scholar]
Catana 2012
- Catana C, Drzezga A, Heiss WD, Rosen BR. PET/MRI for neurologic applications. Journal of Nuclear Medicine 2012;53(12):1916‐25. [DOI] [PMC free article] [PubMed] [Google Scholar]
Crook 1986
- Crook T, Bartus RT, Ferris SH, Whitehouse P, Cohen GD, Gershon S. Report of a National Institute of Mental Health Work Group: Age associated memory impairment: proposed diagnostic criteria and measures of clinical change. Developmental Neuropsychology 1986;2:261‐76. [Google Scholar]
Del Sole 2008
- Sole A, Clerici F, Chiti A, Lecchi M, Mariani C, Magiore L, et al. Individual cerebral metabolic deficits in Alzheimer’s disease and amnestic mild cognitive impairment: an FDG‐PET study. European Journal of Nuclear Medicine and Molecular Imaging 2008;35(7):1357‐66. [DOI] [PubMed] [Google Scholar]
Drzezga 1999
- Drzezga A, Arnold S, Minoshima S, Noachtar S, Szecsi J, Winkler P, et al. 18F‐FDG PET studies in patients with extratemporal and temporal epilepsy: evaluation of an observer‐independent analysis. Journal of Nuclear Medicine 1999;40(5):737–46.. [PubMed] [Google Scholar]
Duara 1986
Dubois 2007
- Dubois B, Feldman HH, Jacova C, Dekosky ST, Barberger‐Gateau P, Cummings J, et al. Research criteria for the diagnosis of Alzheimer's disease: revising the NINCDS‐ADRDA criteria. Lancet. Neurology 2007;6(8):734‐46. [DOI] [PubMed] [Google Scholar]
Dubois 2010
- Dubois B, Feldman HH, Jacova C, Cummings JL, DeKosky ST, Barberger‐Gateau P, et al. Revising the definition of Alzheimer's disease: a new lexicon. Lancet. Neurology 2010;9(11):1118‐27. [1474‐4422] [DOI] [PubMed] [Google Scholar]
Fellgiebel 2004
- Fellgiebel A, Siessmeier T, Scheurich A, Winterer G, Bartenstein P, Schmidt LG, at al. Association of elevated phospho‐tau levels with Alzheimer‐typical 18F‐Fluoro‐2‐deoxy‐D‐glucose positron emission tomography findings in patients with mild cognitive impairment. Biological Psychiatry 2004;56(4):279‐83. [DOI] [PubMed] [Google Scholar]
Ferri 2005
- Ferri CP, Prince M, Brayne C, Brodaty H, Fratiglioni L, Ganguli M, et al. Global prevalence of dementia: a Delphi consensus study. Lancet 2005; Vol. 366, issue 9503:2112‐7. [0140‐6736] [DOI] [PMC free article] [PubMed]
Frisoni 2013
- Frisoni GB, Bocchetta M, Chételat G, Rabinovici GD, Leon MJ, Kaye J, et al. Imaging markers for Alzheimer disease: which vs how. Neurology 2013;81(5):487‐500. [DOI: 10.1212/WNL.0b013e31829d86e8] [DOI] [PMC free article] [PubMed] [Google Scholar]
Geslani 2005
Hampel 2010
- Hampel H, Frank R, Broich K, Teipel SJ, Katz RG, Hardy J, et al. Biomarkers for Alzheimer’s disease: academic, industry and regulatory perspectives. National Reviews. Drug Discovery 2010;9(7):560‐74. [DOI] [PubMed] [Google Scholar]
Haxby 1986
Herholz 1999
- Herholz K, Nordberg A, Salmon E, Perani D, Kessler J, Mielke R, et al. Impairment of neocortical metabolism predicts progression in Alzheimer’s disease. Dementia and Geriatric Cognitive Disorders 1999;10(6):494–504. [DOI] [PubMed] [Google Scholar]
Herholz 2002
Hoffman 2000
- Hoffman JM, Welsh‐Bohmer KA, Hanson M, Crain B, Hulette C, Earl N, et al. FDG PET imaging in patients with pathologically verified dementia. Journal of Nuclear Medicine 2000;41(11):1920‐8. [PubMed] [Google Scholar]
ICD‐10 2010
- World Health Organization. Statistical Classification of Diseases and Related Health Problems 10th Revision (ICD‐10). available from apps.who.int/classifications/icd10/browse/2010/en.International (accessed 16th December 2012) 2010.
ICD‐9 2006
- World Health Organization. Statistical Classification of Diseases and Related Health Problems 9th Revision (ICD‐9). 6th Edition. Vol. Hospital edition, vols. 1, 2, 3, Los Angeles, CA: Practice Management Information Corporation (PMIC), 2006. [Google Scholar]
Ishii 2001
- Ishii K, Willoch F, Minoshima S, Drzezga A, Ficaro EP, Cross DJ, et al. Statistical brain mapping of 18F‐FDG PETin Alzheimer’s disease: validation of anatomic standardization for atrophied brains. Journla of Nuclear Medicine 2001;42(4):548 –57. [PubMed] [Google Scholar]
Jagust 2010
- Jagust WJ, Bandy D, Chen K, Foster NL, Landau SM, Mathis CA, et al. The Alzheimer's Disease Neuroimaging Initiative positron emission tomography core. Alzheimer's & Dementia 2010;6:221‐9. [DOI] [PMC free article] [PubMed] [Google Scholar]
Jelic 1999
- Jelic V, Wahlund LO, Almkvist O, Johansson SE, Shigeta M, Winblad B, Nordberg A. Diagnostic accuracies of quantitative EEG and PET in mild Alzheimer’s disease. Alzheimer's Reports 1999;2(5):291‐8. [Google Scholar]
Knopman 2005
- Knopman DS, Boeve BF, Parisi JE, Dickson DW, Smith GE, Ivnik RJ. Antemortem diagnosis of frontotemporal lobar degeneration. Annals of Neurology 2005;57(4):480–8. [DOI] [PubMed] [Google Scholar]
Knottnerus 2002
- Knottnerus JA, Weel C, Muris JWM. Evaluation of diagnostic procedures. BMJ 2002; Vol. 324, issue 7335:477‐80. [0959‐8138] [DOI] [PMC free article] [PubMed]
Laforce 2010
- Laforce R Jr, Buteau JP, Paquet N, Verret L, Houde M, Bouchard RW. The value of PET in mild cognitive impairment, typical and atypical/unclear dementias: a retrospective memory clinic study. American Journal of Alzheimer's Disease and Other Dementias 2010;25(4):324‐32. [DOI] [PMC free article] [PubMed] [Google Scholar]
Leeflang 2008
- Leeflang MMG, Deeks JJ, Gatsonis C, Bossuyt PMM. Systematic reviews of diagnostic test accuracy. Annals of Internal Medicine 2008; Vol. 149, issue 12:889. [DOI] [PMC free article] [PubMed]
Lucignani 2006
- Lucignani G, Frost JF. Neurochemical imaging with emission tomography: Clinical applications. link.springer.com/chapter/10.1007/3‐540‐30005‐8_2#page‐1Diagnostic nuclear medicine (accessed January 12 2015) 2006.
Lund Manchester 1994
- The Lund and Manchester Groups. Clinical and neuropathological criteria for frontotemporal dementia. Journal of Neurology, Neurosurgery and Psychiatry 1994;57(4):416‐8. [DOI] [PMC free article] [PubMed] [Google Scholar]
Matthews 2008
Mattsson 2009
- Mattsson N, Zetterberg H, Hansson O, Andreasen N, Parnetti L, Jonsson M, et al. CSF biomarkers and incipient Alzheimer disease in patients with mild cognitive impairment. JAMA 2009;302(4):385‐93. [DOI] [PubMed] [Google Scholar]
McKeith 1996
McKeith 2006
McKhann 1984
- McKhann G, Drachman D, Folstein M, Katzman R, Price D, Stadlan EM. Clinical diagnosis of Alzheimer's disease Report of the NINCDS‐ADRDA Work Group* under the auspices of Department of Health and Human Services Task Force on Alzheimer's Disease. Neurology 1984;34(7):939‐44. [0028‐3878] [DOI] [PubMed] [Google Scholar]
McKhann 2011
- McKhann GM, Knopman DS, Chertkow H, Hyman BT, Jack CR, Kawas CH, et al. The diagnosis of dementia due to Alzheimer’s disease: Recommendations from the National Institute on Aging‐Alzheimer’s Association workgroups on diagnostic guidelines for Alzheimer's disease. Alzheimer's & Dementia 2011;7(3):263‐9. [1552‐5260] [DOI] [PMC free article] [PubMed] [Google Scholar]
McShane 2006
- McShane R, Areosa Sastre A, Minakaran N. Memantine for dementia. Cochrane Database of Systematic Reviews 2006, Issue 2. [DOI: 10.1002/14651858.CD003154.pub5] [DOI] [PubMed] [Google Scholar]
Minoshima 1995
- Minoshima S, Frey KA, Koeppe RA, Foster NL, Kuhl DE. A diagnostic approach in Alzheimer's disease using three‐dimensional stereotactic surface projections of fluorine‐18‐FDG PET. Journal of Nuclear Medicine 1995;36(7):1238‐48. [PubMed] [Google Scholar]
Morris 1993
- Morris JC. The Clinical Dementia Rating (CDR): current version and scoring rules. Neurology; Neurology 1993;43(11):2412‐4. [1526‐632X] [DOI] [PubMed] [Google Scholar]
Morris 2001
Mosconi 2009
- Mosconi L. FDG PET in the evaluation of mild cognitive impairment and early dementia. In: Silverman D editor(s). PET in the Evaluation of Alzheimer's Disease and Related Disorders. Springer, 2009:49‐65. [0387764194] [Google Scholar]
Moulin‐Romsee 2005
- Moulin‐Romsee G, Maes A, Silverman D, Mortelmans L, Laere K. Cost‐effectiveness of 18F‐fluorodeoxyglucose positron emission tomography in the assessment of early dementia from a Belgian and European perspective. European Journal of Neurology 2005;12(4):254‐63. [DOI] [PubMed] [Google Scholar]
NAO 2007
- National Audit Office. Improving Services and Support for People with Dementia. www.nao.org.uk/wp‐content/uploads/2007/07/0607604.pdf 2007.
Neary 1998
Nitrini 2000
Oddo 2004
Okello 2009
- Okello A, Edison P, Archer H, Turkheimer F, Kennedy J, Bullock R, et al. Microglial activation and amyloid deposition in mild cognitive impairment: a PET study. Neurology 2009; Vol. 72, issue 1:56‐62. [0028‐3878] [DOI] [PMC free article] [PubMed]
Patterson 2010
- Patterson JC, Lilien DL, Takalkar A, Pinkston JB. Early detection of brain pathology suggestive of early AD using objective evaluation of FDG‐PET scans. International Journal of Alzheimer's Disease 2010; Vol. 2011:ii. 946590. [DOI: 10.4061/2011/946590] [DOI] [PMC free article] [PubMed]
Petersen 1999
Petersen 2001
Petersen 2003
- Petersen RC. Conceptual overview. In: Petersen RC editor(s). Mild Cognitive Impairment: Aging to Alzheimer’s Disease. New York:: Oxford University Press, 2003:1‐14. [Google Scholar]
Petersen 2004
Petersen 2009
- Petersen RC, Roberts RO, Knopman DS, Boeve BF, Geda YE, Ivnik RJ, et al. Mild cognitive impairment: ten years later. Archives of Neurology 2009; Vol. 66, issue 12:1447‐55. [DOI] [PMC free article] [PubMed]
Petersen 2010
- Petersen RC, Aisen PS, Beckett LA, Donohue MC, Gamst AC, Harvey DJ, et al. Alzheimer’s Disease Neuroimaging Initiative (ADNI): Clinical characterization. Neurology 2010;74(3):201‐9. [DOI] [PMC free article] [PubMed] [Google Scholar]
Quinn 2014
- Quinn TJ, Fearon P, Noel‐Storr AH, Young C, McShane R, Stott DJ. Informant Questionnaire on Cognitive Decline in the Elderly (IQCODE) for the diagnosis of dementia within community dwelling populations. Cochrane Database of Systematic Reviews 2014, Issue 4. [DOI: 10.1002/14651858.CD010079] [DOI] [PubMed] [Google Scholar]
Reisberg 1982
- Reisberg B, Ferris SH, Leon MJ. Crook T. The Global Deterioration Scale for assessment of primary degenerative dementia. American Journal of Psychiatry 1982;139(9):1136‐9. [DOI] [PubMed] [Google Scholar]
Román 1993
Rosen 1984
- Rosen WG, Mohs RC, Davis KL. A new rating scale forAlzheimer’s disease. American Journal of Psychiatry 1984;141(11):1356–64. [DOI] [PubMed] [Google Scholar]
Rutter 2001
Schroeter 2009
- Schroeter ML, Stein T, Maslowski N, Neumann J. Neural correlates of Alzheimer's disease and mild cognitive impairment: a systematic and quantitative meta‐analysis involving 1351 patients. NeuroImage 2009; Vol. 47, issue 4:1196‐206. [1053‐8119] [DOI] [PMC free article] [PubMed]
Silverman 2002
- Silverman DH, Gambhir SS, Huang HW, Schwimmer J, Kim S, Small GW, et al. Evaluating early dementia with and without assessment of regional cerebral metabolism by PET: a comparison of predicted costs and benefits. Journal of Nuclear Medicine 2002;43(2):253‐66. [PubMed] [Google Scholar]
Silverman 2001
- Silverman DH, Small GW, Chang CY, Lu CS, Kung De Aburto MA, Chen W, et al. Positron emission tomography in evaluation of dementia: Regional brain metabolism and long‐term outcome. JAMA 2001;286(17):2120‐7. [DOI] [PubMed] [Google Scholar]
Silverman 2009
- Silverman DHS. Clinical interpretation of brain PET scans: performing visual assessments, providing quantifying data, and generating integrated reports. In: Silverman DHS editor(s). PET in the Evaluation of Alzheimer’s Disease and Related Disorders. New York: Springer, 2009:33‐49. [Google Scholar]
Sperling 2011
- Sperling RA, Aisen PS, Beckett LA, Bennett DA, Craft S, Fagan AM, et al. Toward defining the preclinical stages of Alzheimer’s disease: Recommendations from the National Institute on Aging‐Alzheimer's Association workgroups on diagnostic guidelines for Alzheimer's disease. Alzheimer's & Dementia 2011; Vol. 7, issue 3:280‐92. [1552‐5260] [DOI] [PMC free article] [PubMed]
Varrone 2009
- Varrone A, Asenbaum S, Vander Borght V, Booij J, Nobili F, Någren K, et al. EANM procedure guidelines for PET brain imaging using [18F]FDG, version 2. European Journal of Nuclear Medicine and Molecular Imaging 2009;36(12):2103‐10. [DOI] [PubMed] [Google Scholar]
Visser 2006
Waxman 2009
- Waxman A, Herholz K, Lewis D, Herscovitch P, Minoshima S, Ichise M, et al. Society of Nuclear Medicine procedure guideline for FDG PET brain imaging. interactive.snm.org/docs/FDG_brain_perfusion_V0%203%20(10‐1)%20Final.pdf (accessed 12th January 2015) 2009.
Whiting 2011
- Whiting PF, Rutjes AW, Westwood ME, Mallett S, Deeks JJ, Reitsma JB, et al: QUADAS‐2 Group. QUADAS‐2: a revised tool for the quality assessment of diagnostic accuracy studies. Annals of Internal Medicine 2011;155(8):529‐36. [DOI] [PubMed] [Google Scholar]
Winblad 2004
- Winblad B, Palmer K, Kivipelto M, Jelic V, Fratiglioni L, Wahlund LO, et al. Mild cognitive impairment–beyond controversies, towards a consensus: report of the International Working Group on Mild Cognitive Impairment. Journal of Internal Medicine 2004; Vol. 256, issue 3:240‐6. [1365‐2796] [DOI] [PubMed]
References to other published versions of this review
Vacante 2013
- Vacante M, Smailagic N, Sachpekidis C, Hyde C, Martin S, Ukoumunne O. The accuracy of 18FDG‐PET in the early diagnosis of Alzheimer’s disease dementia and other dementias in people with MCI. Cochrane Database of Systematic Reviews 2013, Issue 7. [DOI: 10.1002/14651858.CD010632] [DOI] [PMC free article] [PubMed] [Google Scholar]