Abstract
Sarcopenia is characterized by low skeletal muscle, a complex trait with high heritability. With the dramatically increasing prevalence of obesity, obesity and sarcopenia occur simultaneously, a condition known as sarcopenic obesity. Fat mass and obesity-associated (FTO) gene is a candidate gene of obesity. To identify associations between lean mass and FTO gene, we performed a genome-wide association study (GWAS) of lean mass index (LMI) in 2207 unrelated Caucasian subjects and replicated major findings in two replication samples including 6,004 unrelated Caucasian and 38,292 unrelated Caucasian. We found 29 single nucleotide polymorphisms (SNPs) in FTO significantly associated with sarcopenia (combined p-values ranging from 5.92 × 10⁻¹² to 1.69 × 10⁻⁹). Potential biological functions of SNPs were analyzed by HaploReg v4.1, RegulomeDB, GTEx, IMPC and STRING. Our results provide suggestive evidence that FTO gene is associated with lean mass.
Subject terms: Computational biology and bioinformatics, Computational biology and bioinformatics, Genetics, Genetics
Introduction
Sarcopenia is a complex disease described as the age-associated loss of skeletal muscle mass, strength and function impairment1,2. The low skeletal muscle mass will lead to many public health problems such as sarcopenia, osteoporosis and increased mortality3,4, especially in the elderly. Skeletal muscle is heritable with heritability estimates of 30–85% for muscle strength and 45–90% for muscle mass5. Although there are many genetic researches have shown some SNPs and copy number variants (CNVs) associated with lean mass6–14, the majority of specific genes underlying the variations in low lean body mass (LBM) are still unknown. And sarcopenia can be predicted by LMI15.
FTO gene is proved the association with fat mass, which contributes to human obesity16–21. According to many vivo studies using FTO overexpression or knockout mouse models, FTO gene can cause abnormal adipose tissues and body mass, implying a pivotal role of FTO in adipogenesis and energy homeostasis22–25. But the exact biological functions of this gene are unknown yet. In recent researches, FTO gene is proved the association with lean mass22,23,26–31. Zillikens et al. reported a series of SNPs of FTO associated with LBM and appendicular lean mass (ALM)30. In our study, we performed a GWAS to identify the associations between FTO and LMI in 2,207 unrelated Caucasians (516 men and 1,691 women). Then we replicated our findings in two replication samples, including 6,004 unrelated Caucasians and 38,292 unrelated Caucasians subjects30.
Methods
Ethic statement
This study was approved by institutional review boards of Creighton University and the University of Missouri-Kansas City. Before entering the study, all subjects provide written informed consent documents. The methods carried out in accordance with the approved study protocol.
Discovery sample
The discovery sample consisted of 2,207 unrelated Caucasian subjects of European ancestry that were recruited in Midwestern U.S. (Kansas City, Missouri and Omaha, Nebraska). All discovery subjects completed a structured questionnaire covering lifestyle, diet, family information, medical history, etc. The inclusion and exclusion criteria for cases were described in our previous publication32.
Replication sample
There were two replication samples which were performed association studies with other anthropometric phenotypes.
Replication sample 1 contains 6,004 unrelated Caucasian of European ancestry from Framingham heart study (FHS) which is a longitudinal and prospective cohort comprising >16,000 pedigree participants spanning three generations of European ancestry. Details about the FHS have reported previously33.
Replication sample 2 contains 38,292 unrelated Caucasian of European ancestry from 20 cohorts30. The details and GWAS results are from the genetic factors for osteoporosis (GEFOS) (http://www.gefos.org).
Phenotyping
In present study, LBM and fat body mass (FBM) were measured using a dual-energy X-ray absorptiometry (DXA) scanner Hologic QDR 4500W machine (Hologic Inc., Bedford, MA, USA) that was calibrated daily. Height was obtained by using a calibrated stadiometer and weight was measured in light indoor clothing by a calibrated balance beam scale. LMI was calculated as the ratio of the sum of lean soft tissue (nonfat, non-bone) mass in whole body to square of height34.
Genotyping and quality control
Genomic DNA was extracted from peripheral blood leukocytes using Puregene DNA Isolation Kit (Gentra systems, Minneapolis, MN, USA). For discovery sample, SNP genotyping with Affymetrix Genome-Wide Human SNP Array 6.0 was performed using the standard protocol recommended by the manufacturer. Fluorescence intensities were quantified using an Affymetrix array scanner 30007G. Data management and analyses were conducted using the Genotyping Command Console Software. We conducted strict quality control (QC) procedure. All subjects (n = 2,283) had a minimum call rate 95% and the final mean call rate reached a high level of 98.93%. We discarded SNPs that deviated from Hardy-Weinberg equilibrium (p < 0.01) and those containing a minor allele frequency (MAF) less than 0.01. Then we found 21,247 SNPs allele frequencies deviated from Hardy-Weinberg equilibrium, and additional 141,666 SNPs had MAF < 0.01. After QC, 746,709 SNPs remained in the discovery sample.
For replication sample 1, SNP genotyped using approximately 550,000 SNPs (Affymetrix 500 K mapping array plus Affymetrix 50 K supplemental array). For details of the genotyping method, please refer to FHS SHARe at NCBI dbGaP website (http://www.ncbi.nlm.nih.gov/projects/gap/cgi-bin/study.cgi?study_id=phs000007.v3.p2).
Genotype imputation
Genotype imputation was applied to both the discovery and replication samples, with the 1000 Genomes projects sequence variants as reference panel (as of August 2010). Reference sample included 283 individuals of European ancestry.
The details of genotype imputation process had been described earlier35. Briefly, strand orientations between reference panel and test sample were checked before imputation, and inconsistencies were resolved by changing the test sample to reverse strand or removing the SNP from the test sample. Imputation was performed with MINIMAC36. Quality control was applied to impute SNPs with the following criteria: imputation r2 > 0.5 and MAF > 0.01. SNPs failing the QC criteria were excluded from subsequent association analyses.
Statistical analyses
GWAS analysis
In discovery sample, we used the first five principal components, gender, age, age2 and FBM as covariates to screen for significance with the step-wise linear regression model implemented in R function stepAIC. Raw LMI values of discovery sample were adjusted by significant covariates (age, gender and FBM), and the residuals were normalized by inverse quantiles of standard normal distribution. MACH2QTL was used to perform genetic association analyses between SNPs and normalized residuals of LMI with an additive mode of inheritance.
Meta-analysis
Meta-analyses were performed by METAL software (https://genome.sph.umich.edu/wiki/METAL_Documentation) using the weighted fixed -effects model, which takes into account effect size and their standard errors.
The linkage disequilibrium (LD) patterns of the interested SNPs were analyzed and plotted using the Haploview program37 (http://www.broad.tamit.edu/mpg/haploview/).
Functional annotation
We used HaploReg v4.1 (https://pubs.broadinstitute.org/mammals/haploreg/haploreg.php) to search for significant SNPs with functional annotations and the RegulomeDB38 (http://www.regulomedb.org/) program to rank potential functional roles.
To investigate the association between the identified SNP polymorphisms and the nearby gene expressions, we performed cis-eQTL analysis. We used the GTEx (https://gtexportal.org) project dataset for analysis39. The GTEx project was designed to establishing a sample and data resource to enable studies of the relationship among genetic variation, gene expression, and other molecular phenotypes in multiple human tissues.
We annotated gene by constructing gene interaction networks with STRING v.10 online platform (https://string-db.org/). STRING uses information based on gene co-expression, text-mining and others, to construct gene interactive networks.
Results
Table 1 is the basic characteristics of the subjects used in discovery sample and replication sample 1. The basic characteristics of replication sample 2 are summarized in the previous research30. Genomic control inflation factor of discovery sample is 0.976. In order to avoid potential population stratification, we used the inflation factor to adjust individual p-values. Figure 1 shows the logarithmic quantile–quantile (QQ) plot of SNP-based association results. After adjustment by the genomic control approach there is no evidence of population stratification is observed. Figure 2 is Manhattan plot of the discovery sample.
Table 1.
Basic characters of study subjects.
| Discovery sample | Replication sample 1a | |||
|---|---|---|---|---|
| Male | Female | Male | Female | |
| Number | 516 | 1,691 | 2,525 | 3,479 |
| Age | 51.2 (16.1) | 51.7 (12.9) | 54.0 (13.1) | 55.9 (13.7) |
| Height (cm) | 175.9 (7.3) | 163.3 (6.3) | 176.0 (7.1) | 162.0 (6.8) |
| Weight (kg) | 86.8 (16.3) | 71.4 (16.0) | 84.4 (13.3) | 68.0 (13.8) |
| FBM (kg) | 20.6 (9.1) | 25.3 (10.8) | 24.9 (9.0) | 27.8 (10.5) |
| LBM (kg) | 66.3 (9.5) | 46.8 (7.0) | 57.3 (7.1) | 38.3 (5.2) |
| LMI (g/cm2) | 2.2 (1.0) | 1.8 (1.3) | 1.8 (0.2) | 1.5 (0.2) |
Note: The numbers within parentheses are standard deviation (SD).
aThe replication sample 1 includes 6004 unrelated Caucasian from FHS.
Figure 1.
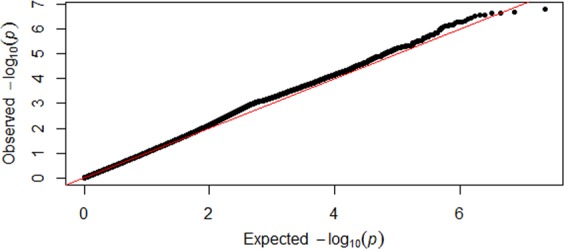
QQ plot. Logarithmic quantile–quantile (QQ) plot of individual SNP-based association for fat-adjusted LMI in the discovery sample.
Figure 2.
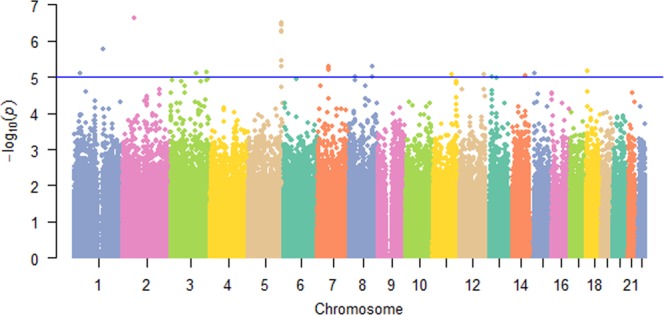
Manhattan plot of discovery GWAS samples.
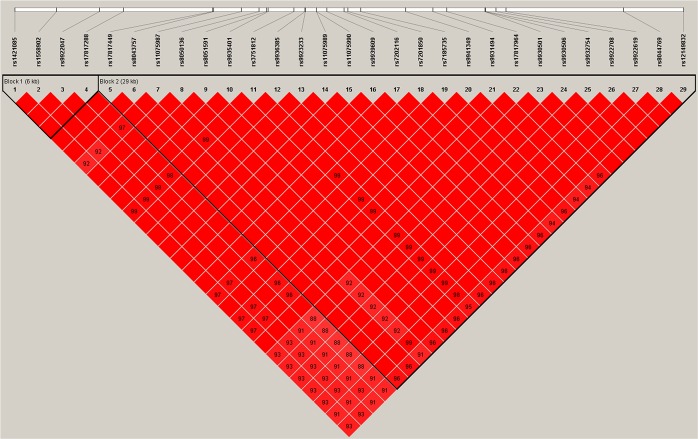
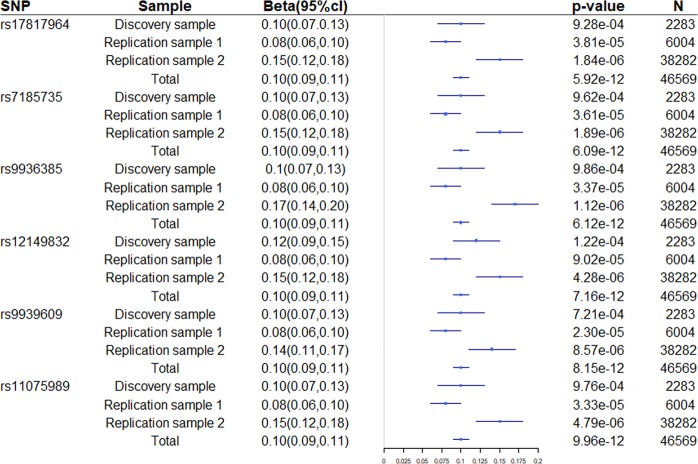
We identified 29 SNPs located in the FTO gene demonstrated associations with LMI in the discovery sample (p < 10−2). LD analysis showed that these 29 SNPs were in LD (r2 ≥ 0.91) and were located within two LD blocks (Figure 3). These SNPs were replicated in independent Caucasian replication samples (Table 2). Meta-analysis p-values ranging from 5.92 × 10⁻¹² to 1.69 × 10⁻⁹. SNP rs17817964 is the most significant SNP with combined p = 5.92 × 10⁻¹² in discovery sample and two replication samples of Caucasian. There are 6 SNPs with p value less than 1 × 10⁻¹¹. Forest plot of SNPs with combined p < 1 × 10⁻¹¹ was drawn in Figure 4. Regional plot of the gene FTO was drawn by LocusZoom in Figure 5.
Figure 3.
LD plot. Association signals of the 29 significant SNPs of the FTO gene. The Haploview block map for the 29 SNPs, showing pairwise LD in r2, was constructed for Caucasian (CEU) using the 1000 Genomes Project.
Table 2.
Significant association results for SNPs.
| SNP | position | region | Allelea | Discovery sample (LMI) | Replication sample 1 (LBM) | Replication sample 2 (LBM) | Combined p | |||||||||
|---|---|---|---|---|---|---|---|---|---|---|---|---|---|---|---|---|
| MAF | Beta | p | N | MAF | Beta | p | N | MAF | Beta | p | N | |||||
| rs17817964 | 53794154 | Intron | C/T | 0.60 | −0.10 | 9.28 × 10⁻⁴ | 2,207 | 0.60 | −0.08 | 3.81 × 10⁻⁵ | 6,004 | 0.60 | −0.15 | 1.84 × 10⁻⁶ | 38,282 | 5.92 × 10⁻¹² |
| rs7185735 | 53788739 | Intron | A/G | 0.60 | −0.10 | 9.62 × 10⁻⁴ | 2,207 | 0.59 | −0.08 | 3.61 × 10⁻⁵ | 6,004 | 0.60 | −0.15 | 1.89 × 10⁻⁶ | 38,285 | 6.09 × 10⁻¹² |
| rs9936385 | 53785257 | Intron | C/T | 0.40 | 0.10 | 9.86 × 10⁻⁴ | 2,207 | 0.41 | 0.08 | 3.37 × 10⁻⁶ | 6,004 | 0.39 | 0.17 | 1.12 × 10⁻⁶ | 36,349 | 6.12 × 10⁻¹² |
| rs12149832 | 53808996 | Intron | A/G | 0.41 | 0.12 | 1.22 × 10⁻⁴ | 2,207 | 0.41 | 0.08 | 9.02 × 10⁻⁵ | 6,004 | 0.42 | 0.15 | 4.28 × 10⁻⁶ | 38,171 | 7.16 × 10⁻¹² |
| rs9939609 | 53786615 | Intron | A/T | 0.40 | 0.10 | 7.21 × 10⁻⁴ | 2,207 | 0.41 | 0.08 | 2.30 × 10⁻⁵ | 6,004 | 0.40 | 0.14 | 8.57 × 10⁻⁶ | 38,286 | 8.15 × 10⁻¹² |
| rs11075989 | 53785965 | Intron | C/T | 0.60 | −0.10 | 9.76 × 10⁻⁴ | 2,207 | 0.59 | −0.08 | 3.33 × 10⁻⁵ | 6,004 | 0.60 | −0.15 | 4.79 × 10⁻⁶ | 38,337 | 9.96 × 10⁻¹² |
| rs11075990 | 53785981 | Intron | A/G | 0.60 | −0.10 | 9.76 × 10⁻⁴ | 2,207 | 0.59 | −0.08 | 3.33 × 10⁻⁵ | 6,004 | 0.60 | −0.15 | 4.61 × 10⁻⁶ | 38,337 | 1.02 × 10⁻¹¹ |
| rs3751812 | 53784548 | Intron | G/T | 0.60 | −0.10 | 1.06 × 10⁻³ | 2,207 | 0.59 | −0.08 | 3.34 × 10⁻⁵ | 6,004 | 0.60 | −0.15 | 4.81 × 10⁻⁶ | 38,325 | 1.10 × 10⁻¹¹ |
| rs8050136 | 53782363 | Intron | A/C | 0.40 | 0.10 | 1.10 × 10⁻³ | 2,207 | 0.42 | 0.08 | 2.89 × 10⁻⁵ | 6,004 | 0.40 | 0.14 | 6.64 × 10⁻⁶ | 38,237 | 1.17 × 10⁻¹¹ |
| rs9935401 | 53782926 | Intron | A/G | 0.40 | 0.10 | 1.01 × 10⁻³ | 2,207 | 0.41 | 0.08 | 3.53 × 10⁻⁵ | 6,004 | 0.40 | 0.14 | 5.26 × 10⁻⁶ | 38,338 | 1.28 × 10⁻¹¹ |
| rs8051591 | 53782840 | Intron | A/G | 0.60 | −0.10 | 1.01 × 10⁻³ | 2,207 | 0.59 | −0.08 | 3.54 × 10⁻⁵ | 6,004 | 0.60 | −0.14 | 5.62 × 10⁻⁶ | 38,338 | 1.35 × 10⁻¹¹ |
| rs17817449 | 53779455 | Intron | G/T | 0.40 | 0.10 | 1.01 × 10⁻³ | 2,207 | 0.41 | 0.08 | 3.62 × 10⁻⁵ | 6,004 | 0.40 | 0.14 | 5.79 × 10⁻⁶ | 38,338 | 1.44 × 10⁻¹¹ |
| rs8043757 | 53779538 | Intron | A/T | 0.60 | −0.10 | 1.01 × 10⁻³ | 2,207 | 0.59 | −0.08 | 3.61 × 10⁻⁵ | 6,004 | 0.60 | −0.14 | 5.86 × 10⁻⁶ | 38,338 | 1.45 × 10⁻¹¹ |
| rs9923233 | 53785286 | Intron | C/G | 0.40 | 0.10 | 9.86 × 10⁻⁴ | 2,207 | 0.41 | 0.08 | 3.39 × 10⁻⁵ | 6,004 | 0.41 | 0.14 | 9.59 × 10⁻⁶ | 38,242 | 1.71 × 10⁻¹¹ |
| rs17817288 | 53773852 | Intron | A/G | 0.51 | −0.09 | 2.44 × 10⁻³ | 2,207 | 0.50 | −0.08 | 3.24 × 10⁻⁵ | 6,004 | 0.51 | −0.14 | 8.61 × 10⁻⁶ | 38,016 | 5.44 × 10⁻¹¹ |
| rs1558902 | 53769662 | Intron | A/T | 0.41 | 0.09 | 2.40 × 10⁻³ | 2,207 | 0.42 | 0.08 | 4.75 × 10⁻⁵ | 6,004 | 0.41 | 0.14 | 7.52 × 10⁻⁶ | 38,261 | 5.54 × 10⁻¹¹ |
| rs7202116 | 53787703 | Intron | A/G | 0.60 | −0.10 | 9.63 × 10⁻⁴ | 2,207 | 0.59 | −0.08 | 3.68 × 10⁻⁵ | 6,004 | 0.60 | −0.16 | 1.87 × 10⁻⁵ | 28,232 | 5.69 × 10⁻¹¹ |
| rs1421085 | 53764042 | Intron | C/T | 0.41 | 0.09 | 2.30 × 10⁻³ | 2,207 | 0.42 | 0.08 | 4.87 × 10⁻⁵ | 6,004 | 0.41 | 0.14 | 7.72 × 10⁻⁶ | 38,254 | 5.73 × 10⁻¹¹ |
| rs9930506 | 53796553 | Intron | A/G | 0.56 | −0.10 | 7.99 × 10⁻⁴ | 2,207 | 0.57 | −0.07 | 3 × 10⁻⁴ | 6,004 | 0.56 | −0.13 | 4.66 × 10⁻⁵ | 37,911 | 4.96 × 10⁻¹⁰ |
| rs9922619 | 53797859 | Intron | G/T | 0.56 | −0.10 | 8.76 × 10⁻⁴ | 2,207 | 0.57 | −0.07 | 3 × 10⁻⁴ | 6,004 | 0.56 | −0.13 | 5.48 × 10⁻⁵ | 38,038 | 7.52 × 10⁻¹⁰ |
| rs9922708 | 53797234 | Intron | C/T | 0.56 | −0.10 | 8.90 × 10⁻⁴ | 2,207 | 0.57 | −0.07 | 3 × 10⁻⁴ | 6,004 | 0.56 | −0.13 | 5.70 × 10⁻⁵ | 38,038 | 7.69 × 10⁻¹⁰ |
| rs9932754 | 53796579 | Intron | C/T | 0.44 | 0.10 | 1.04 × 10⁻³ | 2,207 | 0.43 | 0.07 | 3 × 10⁻⁴ | 6,004 | 0.44 | 0.13 | 5.98 × 10⁻⁵ | 38,038 | 9.12 × 10⁻¹⁰ |
| rs9930501 | 53796540 | Intron | A/G | 0.56 | −0.10 | 1.04 × 10⁻³ | 2,207 | 0.57 | −0.07 | 3 × 10⁻⁴ | 6,004 | 0.56 | −0.13 | 6.31 × 10⁻⁵ | 38,037 | 9.62 × 10⁻¹⁰ |
| rs9931494 | 53793267 | Intron | C/G | 0.58 | −0.09 | 3.38 × 10⁻³ | 2,207 | 0.58 | −0.07 | 2 × 10⁻⁴ | 6,004 | 0.58 | −0.13 | 2.79 × 10⁻⁵ | 38,118 | 1.08 × 10⁻⁹ |
| rs7201850 | 53787950 | Intron | C/T | 0.58 | −0.09 | 3.37 × 10⁻³ | 2,207 | 0.58 | −0.07 | 2 × 10⁻⁴ | 6,004 | 0.58 | −0.13 | 2.89 × 10⁻⁵ | 38,118 | 1.12 × 10⁻⁹ |
| rs9941349 | 53791576 | Intron | C/T | 0.58 | −0.09 | 3.41 × 10⁻³ | 2,207 | 0.58 | −0.07 | 2 × 10⁻⁴ | 6,004 | 0.58 | −0.13 | 2.71 × 10⁻⁵ | 38,106 | 1.15 × 10⁻⁹ |
| rs8044769 | 53805223 | Intron | C/T | 0.52 | 0.10 | 5.37×10⁻⁴ | 2,207 | 0.52 | 0.07 | 5 × 10⁻⁴ | 6,004 | 0.52 | 0.13 | 5.79 × 10⁻⁵ | 38,303 | 1.20 × 10⁻⁹ |
| rs9922047 | 53772368 | Intron | C/G | 0.49 | −0.08 | 5.85 × 10⁻³ | 2,207 | 0.48 | −0.08 | 9.21 × 10⁻⁵ | 6,004 | 0.48 | −0.13 | 6.34 × 10⁻⁵ | 38,164 | 1.37 × 10⁻⁹ |
| rs11075987 | 53781249 | Intron | G/T | 0.51 | 0.09 | 3.09 × 10⁻³ | 2,207 | 0.51 | 0.07 | 2 × 10⁻⁴ | 6,004 | 0.51 | 0.13 | 3.97 × 10⁻⁵ | 38,185 | 1.69 × 10⁻⁹ |
aThe first allele represents the minor allele of each marker.
Figure 4.
Forest plot of SNPs with combined p-value less than 1 × 10⁻¹¹. Regression coefficient (beta) and its 95% confidence interval (CI) are presented in untransformed estimates from individual studies. “Total” refers to the combined meta-analysis.
Figure 5.
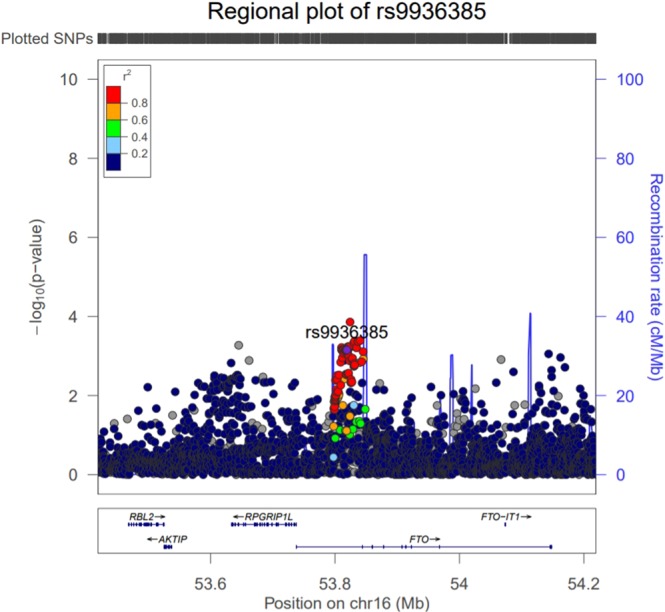
Regional plot of FTO generated using Locus Zoom.
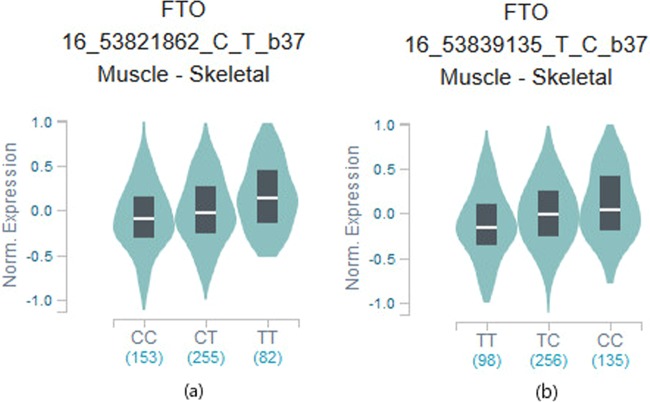
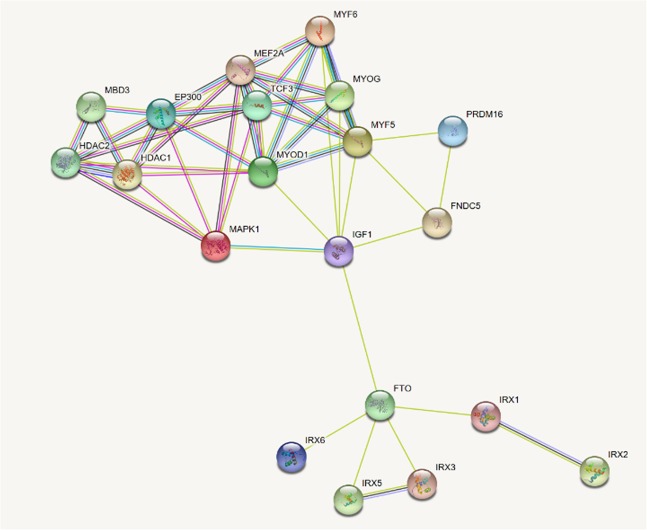
The results of biological functional annotation using HaploReg v4.1, Regulome DB and GTEx are performed in Table 3. 25 SNPs may locate in a strong enhancer region marked by peaks of several active histone methylation modifications (H3K27ac, H3K9ac, H3K4me1 and H3K4me3). SNP rs17817288 (discovery p = 2.44 × 10⁻³, combined p = 5.44 × 10⁻¹¹) occupies promoter histone marks in muscle satellite cultured cells. It was predicted to have enhancer activity by chromatin states, H3K4me1 and H3K27ac marks in skeletal muscle myoblasts cells and H3k4me1 marks in muscle satellite cultured cells. Besides it has promoter activity, implied by H3K4me3 and H3K9ac in muscle satellite cultured cells and H3K9ac in HSMM skeletal muscle myoblasts cells. Among the 29 SNPs evaluated with Regulome DB, 7 had no data. Of the 22 SNPs for which Regulome DB provided a score, 2 had a score of <3 (likely to affect the binding) including rs17817964 and rs7202116 with Regulome DB score = 2b respectively. Analyses using GTEx data reveal 11 SNPs of our GWAS results have strong signals of cis-eQTL for FTO gene in skeletal muscle tissue (p < 1 × 10⁻⁴). SNPs rs7201850 and rs8044769 were deposited in the GTEx eQTL database as a cis-eQTL for FTO in skeletal muscle with the same direction of effect (p = 1 × 10⁻⁵, Figure 6). Gene-gene interaction networks shows there are some connections between FTO and IGF-1, myogenic regulatory factors (MRFs: MYF5, MYOD1, MYOG, and MYF6) and IRX3, implying that FTO may play an important role in muscle development (Figure 7).
Table 3.
Biological function annotation.
| Variant | Promoter | Enhancer | DNAse | Proteins | Motifs | GENCODE | dbSNP | Regulome | eQTL |
|---|---|---|---|---|---|---|---|---|---|
| histone marks | histone marks | Bound | Changed | Genes | func annot | DB scorea | p –valueb | ||
| rs17817964 | 5 tissues | GATA3 | 5 altered motifs | FTO | intronic | 2b | — | ||
| rs7185735 | 6 tissues | Gcm1,Mef2 | FTO | intronic | — | — | |||
| rs9936385 | 8 tissues | 17 tissues | HDAC2,Pax-5 | FTO | intronic | 5 | — | ||
| rs12149832 | BRN | 11 tissues | BRST | XBP-1 | FTO | intronic | 6 | 4 × 10⁻⁵ | |
| rs9939609 | BRST | Nanog,Pou5f1 | FTO | intronic | — | — | |||
| rs11075989 | BRST, FAT, LNG | 6 altered motifs | FTO | intronic | 6 | — | |||
| rs11075990 | BRST, FAT, LNG | Nkx6-1,Pou4f3,Pou6f1 | FTO | intronic | 6 | — | |||
| rs3751812 | 12 tissues | 7 tissues | Mrg,TBX5,Tgif1 | FTO | intronic | 3a | — | ||
| rs8050136 | 8 tissues | BRST,CRVX,BRST | P300 | 6 altered motifs | FTO | intronic | 4 | — | |
| rs9935401 | BRST, SKIN | Cdx,HES1 | FTO | intronic | — | — | |||
| rs8051591 | BRST, CRVX, SKIN | BRST | 6 altered motifs | FTO | intronic | 6 | — | ||
| rs17817449 | 11 tissues | 5 tissues | 4 altered motifs | FTO | intronic | 5 | 4 × 10⁻⁵ | ||
| rs8043757 | 11 tissues | BRST,SKIN | Evi-1 | FTO | intronic | 5 | — | ||
| rs9923233 | 8 tissues | 14 tissues | 8 altered motifs | FTO | intronic | 5 | — | ||
| rs17817288 | MUS, LIV | 17 tissues | 6 tissues | FOXA1,FOXA2,TCF4 | 8 altered motifs | FTO | intronic | 5 | — |
| rs1558902 | LNG | 16 tissues | GI | GATA | FTO | intronic | — | 5 × 10⁻⁵ | |
| rs7202116 | 6 tissues | BLD | MAFF,MAFK | 7 altered motifs | FTO | intronic | 2b | — | |
| rs1421085 | LIV | 14 tissues | LIV,VAS | Arid3a,HNF6 | FTO | intronic | 5 | 3 × 10⁻⁵ | |
| rs9930506 | Irx | FTO | intronic | 6 | 5 × 10⁻⁵ | ||||
| rs9922619 | 6 altered motifs | FTO | intronic | 6 | — | ||||
| rs9922708 | HRT | HRT | HEN1,Pbx-1,TAL1 | FTO | intronic | 6 | 4 × 10⁻⁵ | ||
| rs9932754 | 6 altered motifs | FTO | intronic | 6 | 5 × 10⁻⁵ | ||||
| rs9930501 | Nanog,SRF | FTO | intronic | — | 4 × 10⁻⁵ | ||||
| rs9931494 | FAT | 11 altered motifs | FTO | intronic | 6 | — | |||
| rs7201850 | 7 tissues | Foxo,RORalpha1 | FTO | intronic | — | 1 × 10⁻⁵ | |||
| rs9941349 | BRN | FTO | intronic | — | — | ||||
| rs8044769 | 8 tissues | 6 tissues | JUND,CJUN | 4 altered motifs | FTO | intronic | 4 | 1 × 10⁻⁵ | |
| rs9922047 | FAT | 13 tissues | FTO | intronic | 5 | — | |||
| rs11075987 | LNG | 14 tissues | 8 tissues | STAT3 | intronic | 4 | 5 × 10⁻⁵ |
aPrediction for SNP from Regulome DB with score=2b: TF binding + any motif + DNAse Footprint + DNase peak; score = 3a: TF binding + any motif + DNase peak; score = 4: TF binding + DNase peak; score = 5: TF binding or DNase peak; score = 6: other.
bThe GWAS SNPs are the significant eQTLs for FTO in skeletal muscle from GTEx.
Figure 6.
(a) Box plot of eQTL rs7201850. (b) Box plot of eQTL rs8044769 Box plot of eQTL variant results (p = 1 × 10⁻⁵): rs7201850-muscle skeletal, rs8044769-muscle skeletal. These variants showed significant eQTL in their minor allele.
Figure 7.
Interaction network for FTO. Proteins in the interaction network were represented with nodes, while the interaction between any two proteins therein was represented with an edge. Line color indicates the type of interaction evidence including known interactions, predicted interactions and other. These interactions contain direct (physical) and indirect (functional) interactions, derived from numerous sources such as experimental repositories, computational prediction methods.
Discussion
In this study, we have performed a GWAS in 2,207 Caucasian subjects and replicated this result in three replication samples including 6,004 unrelated Caucasian from FHS and 38,292 unrelated Caucasian30. We identified 29 SNPs in FTO gene associated with LMI then we performed the potential biological function annotation of SNPs. In this study, FTO is suggested to be associated with lean mass.
FTO gene encodes a 2-oxoglutarate (2-OG) Fe(II) dependent nucleic acid demethylase belonging to the AlkB-related non-heme dioxygenase (Fe(II-)- and 2-oxoglutarate-dependent dioxygenases) superfamily of proteins. In the previous studies, FTO was identified to be related to increased risk of obesity and a T2D incurrence17,40. Studies have shown that the expression of FTO protein in lean mass and adipose tissue is related to the oxidation rate of whole body substrate. With the increase of age, the body’s carbohydrate oxidation rate decreases, the fat oxidation rate increases, and at the meanwhile FTO protein expression increases in adipose but that decreases in skeletal muscle mass41. Loos et al. have shown that homozygous Fto −/− mice have postnatal growth retardation, obviously decreasing in adipose tissue, and LBM40. According to the studies of athletes the T-allele of FTO gene rs9939609 is associated with increased lean mass for the elite rugby athletes, and for combat sports athletes the A-allele is related with decreased slow-twitch muscle fibers29,42. AMPK (AMP-activated protein kinase) is an essential part of skeletal muscle lipid metabolism and is the major cellular energy sensor. In skeletal muscle cells AMPK reduces mRNA m6A methylation and lipid accumulation by FTO-dependent demethylation at the molecular level43.
We found there are some connections between FTO and IRX3 in the gene-gene interaction networks. To evaluate phenotypic consequence associated with muscle of the FTO and IRX3 genes, we surveyed mouse knockout models. We searched the international mouse phenotyping consortium (IMPC) database (http://www.mousephenotype.org/) as well as the literature about knockout models related to muscle phenotypes. In IMPC database, of two genes that have results of DXA scan, FTO has abnormal body weight and compared to normal controls IRX3 has abnormal lean body mass in knockout mice (p < 0.05). According to the studies of FTO knockout mice, mouse have reduced fat mass as well as lean mass which is independent of its effect on food intake22,23. Besides, FTO-deficient mice showed skeletal muscle development was damaged28. Some vitro and vivo experiments have shown during myoblasts differentiation FTO expression increased and FTO silencing inhibited myoblasts differentiation28. Homozygote FTO deficiency mice have decreased body weight including decreased body size, abnormal body weight and decreased total tissue weight in the IMPC database. Because there is a greater browning of white adipose tissues, IRX3 knockout mice need more energy to expend, particularly at night. Recent findings show brown fat is associated with muscle developmental precursor Myf544,45. Homozygote IRX3 deficiency mice have decreased LBM and increased total body fat mass in the IMPC database.
Conclusion
In summary, we identified the FTO gene were significantly association with lean mass in the Caucasian subjects. However, the clear function between FTO gene and lean mass is still unknown that needs more researches to reveal.
Acknowledgements
The Framingham Heart Study is conducted and supported by the National Heart, Lung, and Blood Institute (NHLBI) in collaboration with Boston University (Contract No. N01-HC-25195). This manuscript was not prepared in collaboration with investigators of the Framingham Heart Study and does not necessarily reflect the opinions or views of the Framingham Heart Study, Boston University, or NHLBI. Funding for SHARe Affymetrix genotyping was provided by NHLBI Contract N02-HL-64278. SHARe Illumina genotyping was provided under an agreement between Illumina and Boston University. Funding support for the Framingham Whole Body and Regional Dual Xray Absorptiometry (DXA) dataset was provided by NIH grants R01 AR/AG 41398. The datasets used for the analyses described in this manuscript were obtained from dbGaP at http://www.ncbi.nlm.nih.gov/sites/entrez?db=gap through dbGaP accession phs000342.v14.p10. The study was partially supported by startup fund from University of Shanghai for Science and Technology and Shanghai Leading Academic Discipline Project (S30501). The investigators of this work were partially supported by grants from NIH (R01AG026564, RC2DE020756, R01AR057049, R01AR050496 and R03TW008221), a SCOR (Specialized Center of Research) grant (P50AR055081) supported by National Institute of Arthritis and Musculoskeletal and Skin Diseases (NIAMS) and the Office of Research on Women’s Health (ORWH), the Edward G. Schlieder Endowment and the Franklin D. Dickson/Missouri Endowment, the National Natural Science Foundation of China (31571291 to L.Z., 31501026 to Y.F.P.), the Natural Science Foundation of Jiangsu Province (BK20150323 to Y.F.P.).
Author contributions
Conceived and designed the experiments: H.W.D. Performed the experiments: S.R., L.Z., Y.F.P. and Z.X.J. Analyzed the data: Y.X.Z., Y.L., Y.F.P., L.Z., X.H., M.Z., R.H., G.S.G., Q.T. and Y.H.Z. Literature search: X.H., Y.X.Z., J.Y.W., B.L.L. and Y.L., Wrote the paper: S.R., Z.X.J. and H.W.D. All authors reviewed and approved the manuscript.
Data availability
The datasets used and/or analyzed during the current study are available from the corresponding author on a reasonable request.
Competing interests
The authors declare no competing interests.
Footnotes
Publisher’s note Springer Nature remains neutral with regard to jurisdictional claims in published maps and institutional affiliations.
References
- 1.Patel HP, et al. Prevalence of sarcopenia in community-dwelling older people in the UK using the European Working Group on Sarcopenia in Older People (EWGSOP) definition: findings from the Hertfordshire Cohort Study (HCS) Age Ageing. 2013;42:378–384. doi: 10.1093/ageing/afs197. [DOI] [PMC free article] [PubMed] [Google Scholar]
- 2.Kalinkovich A, Livshits G. Sarcopenia – The search for emerging biomarkers. Ageing Res. Rev. 2015;22:58–71. doi: 10.1016/j.arr.2015.05.001. [DOI] [PubMed] [Google Scholar]
- 3.Karakelides H, Nair KS. Sarcopenia of aging and its metabolic impact. Curr. Top. developmental Biol. 2005;68:123–148. doi: 10.1016/s0070-2153(05)68005-2. [DOI] [PubMed] [Google Scholar]
- 4.Cruz-Jentoft AJ, et al. Sarcopenia: European consensus on definition and diagnosis: Report of the European Working Group on Sarcopenia in Older People. Age ageing. 2010;39:412–423. doi: 10.1093/ageing/afq034. [DOI] [PMC free article] [PubMed] [Google Scholar]
- 5.Volpi E, Nazemi RS. Muscle tissue changes with aging. Curr. Opin. Clin. Nutr. Metab. Care. 2004;7:405–410. doi: 10.1097/01.mco.0000134362.76653.b2. [DOI] [PMC free article] [PubMed] [Google Scholar]
- 6.Seale P, et al. PRDM16 controls a brown fat/skeletal muscle switch. Nat. 2008;454:961–967. doi: 10.1038/nature07182. [DOI] [PMC free article] [PubMed] [Google Scholar]
- 7.Livshits G, Kato BS, Wilson SG, Spector TD. Linkage of genes to total lean body mass in normal women. J. Clin. Endocrinol. Metab. 2007;92:3171–3176. doi: 10.1210/jc.2007-0418. [DOI] [PubMed] [Google Scholar]
- 8.Liu XG, et al. Genome-wide association and replication studies identified TRHR as an important gene for lean body mass. Am. J. Hum. Genet. 2009;84:418–423. doi: 10.1016/j.ajhg.2009.02.004. [DOI] [PMC free article] [PubMed] [Google Scholar]
- 9.Sun L, et al. Bivariate genome-wide association analyses of femoral neck bone geometry and appendicular lean mass. PLoS one. 2011;6:e27325. doi: 10.1371/journal.pone.0027325. [DOI] [PMC free article] [PubMed] [Google Scholar]
- 10.Hai R, et al. Genome-wide association study of copy number variation identified gremlin1 as a candidate gene for lean body mass. J. Hum. Genet. 2012;57:33–37. doi: 10.1038/jhg.2011.125. [DOI] [PMC free article] [PubMed] [Google Scholar]
- 11.Guo YF, et al. Suggestion of GLYAT gene underlying variation of bone size and body lean mass as revealed by a bivariate genome-wide association study. Hum. Genet. 2013;132:189–199. doi: 10.1007/s00439-012-1236-5. [DOI] [PMC free article] [PubMed] [Google Scholar]
- 12.Urano T, Shiraki M, Sasaki N, Ouchi Y, Inoue S. Large-scale analysis reveals a functional single-nucleotide polymorphism in the 5′-flanking region of PRDM16 gene associated with lean body mass. Aging Cell. 2014;13:739–743. doi: 10.1111/acel.12228. [DOI] [PMC free article] [PubMed] [Google Scholar]
- 13.Ran S, et al. Genome-wide association study identified copy number variants important for appendicular lean mass. PLoS one. 2014;9:e89776. doi: 10.1371/journal.pone.0089776. [DOI] [PMC free article] [PubMed] [Google Scholar]
- 14.Medina-Gomez C, et al. Bivariate genome-wide association meta-analysis of pediatric musculoskeletal traits reveals pleiotropic effects at the SREBF1/TOM1L2 locus. Nat. Commun. 2017;8:121. doi: 10.1038/s41467-017-00108-3. [DOI] [PMC free article] [PubMed] [Google Scholar]
- 15.Hansen RD, Raja C, Aslani A, Smith RC, Allen BJ. Determination of skeletal muscle and fat-free mass by nuclear and dual-energy x-ray absorptiometry methods in men and women aged 51–84 y (1–3) Am. J. Clin. Nutr. 1999;70:228–233. doi: 10.1093/ajcn.70.2.228. [DOI] [PubMed] [Google Scholar]
- 16.Frayling TM, et al. A common variant in the FTO gene is associated with body mass index and predisposes to childhood and adult obesity. Sci. 2007;316:889–894. doi: 10.1126/science.1141634. [DOI] [PMC free article] [PubMed] [Google Scholar]
- 17.Thomas G, et al. The obesity-associated FTO gene encodes a 2-oxoglutarate-dependent nucleic acid demethylase. Sci. 2007;318:1469–1472. doi: 10.1126/science.1151710. [DOI] [PMC free article] [PubMed] [Google Scholar]
- 18.Scott LJ, et al. A genome-wide association study of type 2 diabetes in Finns detects multiple susceptibility variants. Sci. 2007;316:1341–1345. doi: 10.1126/science.1142382. [DOI] [PMC free article] [PubMed] [Google Scholar]
- 19.Dina C, et al. Variation in FTO contributes to childhood obesity and severe adult obesity. Nat. Genet. 2007;39:724–726. doi: 10.1038/ng2048. [DOI] [PubMed] [Google Scholar]
- 20.Loos RJ, Bouchard C. FTO: the first gene contributing to common forms of human obesity. Obes. reviews: an. Off. J. Int. Assoc. Study Obes. 2008;9:246–250. doi: 10.1111/j.1467-789X.2008.00481.x. [DOI] [PubMed] [Google Scholar]
- 21.Zabena C, et al. The FTO obesity gene. Genotyping and gene expression analysis in morbidly obese patients. Obes. Surg. 2009;19:87–95. doi: 10.1007/s11695-008-9727-0. [DOI] [PubMed] [Google Scholar]
- 22.Fischer J, et al. Inactivation of the Fto gene protects from obesity. Nat. 2009;458:894–898. doi: 10.1038/nature07848. [DOI] [PubMed] [Google Scholar]
- 23.McMurray F, et al. Adult onset global loss of the fto gene alters body composition and metabolism in the mouse. PLoS Genet. 2013;9:e1003166. doi: 10.1371/journal.pgen.1003166. [DOI] [PMC free article] [PubMed] [Google Scholar]
- 24.Gao X, et al. The fat mass and obesity associated gene FTO functions in the brain to regulate postnatal growth in mice. PLoS one. 2010;5:e14005. doi: 10.1371/journal.pone.0014005. [DOI] [PMC free article] [PubMed] [Google Scholar]
- 25.Church C, et al. Overexpression of Fto leads to increased food intake and results in obesity. Nat. Genet. 2010;42:1086–1092. doi: 10.1038/ng.713. [DOI] [PMC free article] [PubMed] [Google Scholar]
- 26.Livshits G, Malkin I, Moayyeri A, Spector TD, Hammond CJ. Association of FTO gene variants with body composition in UK twins. Ann. Hum. Genet. 2012;76:333–341. doi: 10.1111/j.1469-1809.2012.00720.x. [DOI] [PMC free article] [PubMed] [Google Scholar]
- 27.Bravard A, et al. FTO is increased in muscle during type 2 diabetes, and its overexpression in myotubes alters insulin signaling, enhances lipogenesis and ROS production, and induces mitochondrial dysfunction. Diabetes. 2011;60:258–268. doi: 10.2337/db10-0281. [DOI] [PMC free article] [PubMed] [Google Scholar]
- 28.Wang X, et al. FTO is required for myogenesis by positively regulating mTOR-PGC-1alpha pathway-mediated mitochondria biogenesis. Cell death Dis. 2017;8:e2702. doi: 10.1038/cddis.2017.122. [DOI] [PMC free article] [PubMed] [Google Scholar]
- 29.Heffernan SM, et al. Fat mass and obesity associated (FTO) gene influences skeletal muscle phenotypes in non-resistance trained males and elite rugby playing position. BMC Genet. 2017;18:4. doi: 10.1186/s12863-017-0470-1. [DOI] [PMC free article] [PubMed] [Google Scholar]
- 30.Zillikens MC, et al. Large meta-analysis of genome-wide association studies identifies five loci for lean body mass. Nat. Commun. 2017;8:80. doi: 10.1038/s41467-017-00031-7. [DOI] [PMC free article] [PubMed] [Google Scholar]
- 31.Y S Yang. Identification of risk factors for sarcopenia and its roles in Koreans through Genome Wide Association Study, Molecular Medicine & Biopharmaceutical Sciences, Graduate School of Convergence Science and Technology, Seoul National University (2017).
- 32.Deng HW, et al. A genomewide linkage scan for quantitative-trait loci for obesity phenotypes. Am. J. Hum. Genet. 2002;70:1138–1151. doi: 10.1086/339934. [DOI] [PMC free article] [PubMed] [Google Scholar]
- 33.Dawber TR, Meadors GF, Moore FE., Jr. Epidemiological approaches to heart disease: the Framingham Study. Am. J. public. health nation’s health. 1951;41:279–281. doi: 10.2105/AJPH.41.3.279. [DOI] [PMC free article] [PubMed] [Google Scholar]
- 34.Wang J, et al. Independent associations of body-size adjusted fat mass and fat-free mass with the metabolic syndrome in Chinese. Ann. Hum. Biol. 2009;36:110–121. doi: 10.1080/03014460802585079. [DOI] [PubMed] [Google Scholar]
- 35.Marchini J, Howie B, Myers S, McVean G, Donnelly P. A new multipoint method for genome-wide association studies by imputation of genotypes. Nat. Genet. 2007;39:906–913. doi: 10.1038/ng2088. [DOI] [PubMed] [Google Scholar]
- 36.Howie B, Fuchsberger C, Stephens M, Marchini J, Abecasis GR. Fast and accurate genotype imputation in genome-wide association studies through pre-phasing. Nat. Genet. 2012;44:955–959. doi: 10.1038/ng.2354. [DOI] [PMC free article] [PubMed] [Google Scholar]
- 37.Barrett JC, Fry B, Maller J, Daly MJ. Haploview: analysis and visualization of LD and haplotype maps. Bioinforma. 2005;21:263–265. doi: 10.1093/bioinformatics/bth457. [DOI] [PubMed] [Google Scholar]
- 38.Boyle AP, et al. Annotation of functional variation in personal genomes using RegulomeDB. Genome Res. 2012;22:1790–1797. doi: 10.1101/gr.137323.112. [DOI] [PMC free article] [PubMed] [Google Scholar]
- 39.The GTEx Consortium. The Genotype-Tissue Expression (GTEx) project. Nature genetics45, 580–585, 10.1038/ng.2653 (2013). [DOI] [PMC free article] [PubMed]
- 40.Loos RJ, Yeo GS. The bigger picture of FTO: the first GWAS-identified obesity gene. Nat. reviews. Endocrinol. 2014;10:51–61. doi: 10.1038/nrendo.2013.227. [DOI] [PMC free article] [PubMed] [Google Scholar]
- 41.Bravard A, et al. FTO is increased in muscle during type 2 diabetes, and its overexpression in myotubes alters insulin signaling, enhances lipogenesis and ROS production, and induces mitochondrial dysfunction. Diabetes. 2011;60:258–268. doi: 10.2337/db10-0281. [DOI] [PMC free article] [PubMed] [Google Scholar]
- 42.Guilherme J, et al. The A-allele of the FTO Gene rs9939609 Polymorphism Is Associated With Decreased Proportion of Slow Oxidative Muscle Fibers and Over-represented in Heavier Athletes. J. strength. conditioning Res. 2019;33:691–700. doi: 10.1519/jsc.0000000000003032. [DOI] [PubMed] [Google Scholar]
- 43.Wu W, et al. AMPK regulates lipid accumulation in skeletal muscle cells through FTO-dependent demethylation of N(6)-methyladenosine. Sci. Rep. 2017;7:41606. doi: 10.1038/srep41606. [DOI] [PMC free article] [PubMed] [Google Scholar]
- 44.Claussnitzer M, Hui CC, Kellis M. FTO Obesity Variant and Adipocyte Browning in Humans. N. Engl. J. Med. 2016;374:192–193. doi: 10.1056/NEJMc1513316. [DOI] [PubMed] [Google Scholar]
- 45.Schulz TJ, et al. Identification of inducible brown adipocyte progenitors residing in skeletal muscle and white fat. Proc. Natl Acad. Sci. U S Am. 2011;108:143–148. doi: 10.1073/pnas.1010929108. [DOI] [PMC free article] [PubMed] [Google Scholar]
Associated Data
This section collects any data citations, data availability statements, or supplementary materials included in this article.
Data Availability Statement
The datasets used and/or analyzed during the current study are available from the corresponding author on a reasonable request.


