Abstract
A new type of deacetylated cellulose acetate (DA)@polydopamine (PDA) composite nanofiber membrane was fabricated by electrospinning and surface modification. The membrane was applied as a highly efficient adsorbent for removing methylene blue (MB) from an aqueous solution. The morphology, surface chemistry, surface wettability, and effects of operating conditions on MB adsorption ability, as well as the equilibrium, kinetics, thermodynamics, and mechanism of adsorption, were systematically studied. The results demonstrated that a uniform PDA coating layer was successfully developed on the surface of DA nanofibers. The adsorption capacity of the DA@PDA nanofiber membrane reached up to 88.2 mg/g at a temperature of 25 °C and a pH of 6.5 after adsorption for 30 h, which is about 8.6 times higher than that of DA nanofibers. The experimental results showed that the adsorption behavior of DA@PDA composite nanofibers followed the Weber’s intraparticle diffusion model, pseudo-second-order model, and Langmuir isothermal model. A thermodynamic analysis indicated that endothermic, spontaneous, and physisorption processes occurred. Based on the experimental results, the adsorption mechanism of DA@PDA composite nanofibers was also demonstrated.
1. Introduction
In recent years, with the fast-developing dye-related industry, a massive quantity of dye wastewater is continuously discharged to the water,1 which has been a huge threat to the ecological environment and human health. Methylene blue (MB) is a commonly used cationic dye that can form a stable solution with water at room temperature.2,3 It is harmful to human health above a certain concentration due to its strong toxicity. In addition, almost all dyes are difficult to biodegrade and have some resistance to environmental conditions, making sewage treatment an urgent project.4,5 Therefore, it is particularly important to develop effective and low-cost materials to remove MB and other dyes from wastewater and refresh the environment.
Nowadays, physical, chemical, and biological treatment methods have been extensively applied to remove dye wastewater.6,7 However, those methods have disadvantages of high energy consumption, high cost, and abundant toxic by-products. Therefore, most researchers have paid attention to the adsorption method due to its simple operation process, low cost, abundant adsorbent materials, easy recycling, and high efficiency.8−10 A lot of adsorbents, such as activated carbon, zeolite, orange peel, wheat shells, SiO2, metal–organic frameworks (MOFs), and so forth,11−15 have been researched and applied. Activated carbon is a commonly used adsorbent, but its high price and non-renewable sources limit its application in the adsorption field.16 SiO2 and MOF adsorbents have the disadvantage of indirect pollution to the environment during the preparation process.17,18
Polymer membranes with micro- and nanostructures have attracted great interest from researchers because of their high specific surface area, high adsorption capacity, and low secondary pollution. Electrospinning as a simple preparation method to fabricate nanofiber membranes has been widely applied.19,20 A nanofiber membrane prepared by electrospinning showed a large specific surface area, high porosity, and excellent pore interconnectivity and has been extensively used in tissue engineering, oil/water separation, catalytic, energy, adsorption fields, and so forth.21 The main purpose of this study is to prepare an environmentally friendly cellulose acetate (CA) nanofiber membrane via electrospinning that is capable of adsorbing and removing MB from water solution.
CA, which is a member of the most important class of cellulose derivatives, has been widely used in the adsorption field because of its abundant natural sources, good biodegradability, low cost, and easy processing.22 Demirci et al. prepared a CA nanofiber membrane by electrospinning and then modified its surface by cationic polymer brushes that were used to adsorb the target DNA. The results showed that the modified CA nanofiber membrane was a good adsorbent for the purification and filtration of DNA.23 Celebioglu et al. fabricated a CA nanofiber membrane by electrospinning and then modified it with β-cyclodextrin (β-CD), which was used to remove phenanthrene from an aqueous solution. The results showed that the β-CD-modified CA nanofiber membrane demonstrated better removal of phenanthrene than the CA nanofiber membrane alone.24 Tian et al. fabricated a CA nanofiber membrane by electrospinning and then modified it with poly(methacrylic acid), which was used to adsorb heavy metal ions. The results showed that the poly(methyl methacrylate)-modified CA nanofiber membrane had a good adsorption capacity and good re-usability for heavy metal ions.25 CA nanofiber membranes have been widely used as matrix materials for adsorption due to their above-mentioned advantages. However, in order to improve the adsorption performance and extend its application, the CA nanofiber membrane needs to be modified due to its limited surface groups and chemistry properties.
A polydopamine (PDA) coating has been developed as a facile and universal method for the surface modification of various materials. A strong interface adhesion can be formed between PDA and any type of material due to the presence of abundant catechol and amine groups. Many researches have shown that PDA microspheres act as good adsorbents and have a high adsorption efficiency for heavy metal ions and dyes.26−28 However, PDA microspheres are difficult to recycle and reuse. Therefore, in this study, a CA nanofiber membrane was fabricated by electrospinning as the matrix, and then its surface was modified by a PDA coating layer to be used as an adsorbent with highly efficient and good re-utilization for removing MB from the aqueous solution. Although PDA can be easily deposited on any type of surface, it is a time-consuming process and demonstrates poor uniformity.29−31 In order to improve the uniformity and to reduce the coating time for the PDA coating layer, the CA nanofiber membrane was first deacetylated to obtain a deacetylated cellulose acetate (DA) membrane before the PDA coating process.
In this study, the CA nanofiber membrane was first fabricated by electrospinning. Then, it was deacetylated by immersing it into a NaOH solution to obtain the DA nanofiber membrane. Finally, its surface was modified by a PDA coating layer to obtain the DA@PDA nanofiber membrane. The morphology, surface chemistry, surface wettability, and effects of operating conditions on the MB adsorption ability, as well as the equilibrium, kinetics, thermodynamics, and mechanism of adsorption, were systematically studied.
2. Results and Discussion
2.1. Surface Chemical Structure of CA, DA, and DA@PDA Nanofiber Membranes
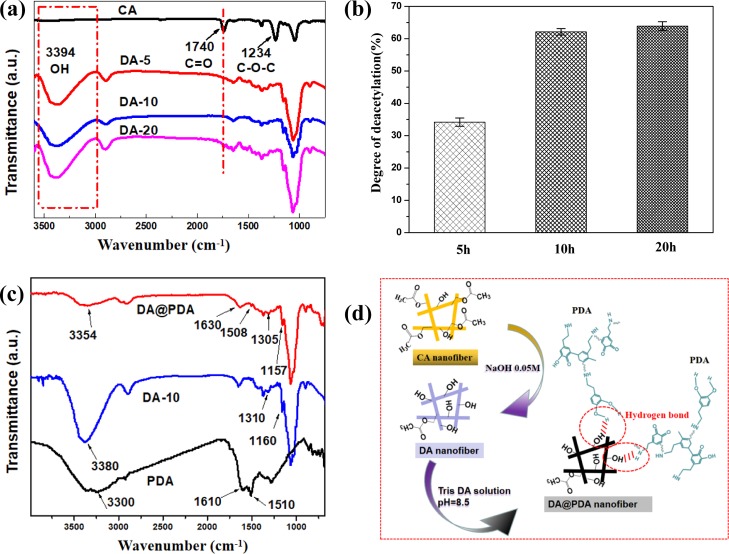
The Fourier-transform infrared spectroscopy (FTIR) spectra of CA and DA nanofiber membranes under different deacetylation times are illustrated in Figure 1a. For the CA nanofiber membrane, the peaks at 1740 and 1234 cm–1 were attributed to C=O and C–O–C, respectively.32 After deacetylation for 5, 10, and 10 h, for DA-5, DA-10, and DA-20 nanofiber membranes, respectively, the peak at 1740 cm–1 attributed to C=O disappeared, while a new peak at 3394 cm–1 attributed to −OH appeared, thus indicating that the CA nanofiber membranes were successfully deacetylated.
Figure 1.
(a) FTIR spectra of CA and DA nanofiber membranes under different deacetylation times of 5, 10, and 20 h. (b) Deacetylation degree (DD %) of DA nanofiber membranes under different deacetylation times of 5, 10, and 20 h. (c) FTIR spectra of the PDA, DA, and DA@PDA nanofiber membranes. (d) Schematic illustration of the surface modification of the CA nanofiber membrane through deacetylation and the PDA coating process.
Under different deacetylation times, the value of DD % is provided in Figure 1b. The DD % of DA-5, DA-10, and DA-20 nanofiber membranes were 34.18, 62.13, and 63.91%, respectively, suggesting that the DD % increased with the increasing deacetylation time. It is believed that the higher the DD % was generated, the more hydroxyl groups were present. It was also found that the DD % of DA nanofiber membranes showed no obvious change after deacetylating for 10 h. Therefore, the DA-10 nanofiber membrane was chosen to prepare the DA-10@PDA nanofiber membrane. If not otherwise specified, DA@PDA has been used instead of DA-10@PDA in the text.
Figure 1c provides the FTIR spectra of PDA, DA, and DA@PDA nanofiber membranes. For PDA, the peak at 3300 cm–1 was attributed to the stretching vibration of phenolic −OH and −NH2, the peak at 1610 cm–1 was attributed to the stretching vibration of the aromatic ring and the bending vibration of N–H, and the peak at 1510 cm–1 was attributed to the N–H shearing vibration of the amide group. For the DA nanofiber, the peak at 3380 cm–1 was attributed to the stretching vibration of O–H, the peak at 1310 cm–1 was attributed to the stretching vibration of C–OH, and the peak at 1160 cm–1 was attributed to the stretching vibration of C–O. For the DA@PDA composite nanofiber, its peaks were consistent with the peaks from both the DA nanofiber and PDA particles, thus implying their coexistence. Moreover, compared with the DA nanofiber and PDA particles, the peaks at 3380, 1510, 1310, and 1160 cm–1 in DA and PDA shifted to a lower wavenumber and changed to 3354, 1508, 1305, and 1157 cm–1 for the DA@PDA composite nanofiber. The peak at 1610 cm–1 on PDA transformed into a higher wavenumber and changed to 1630 cm–1 for the DA@PDA composite nanofiber. This is because hydrogen bonding occurred between the DA nanofibers and the PDA coating layers. These results indicate that the PDA coating layer was successfully coated on the DA nanofiber, and a chemical interaction between the DA and PDA molecules also formed.
Figure 1d provides a schematic illustration of the surface modification of the CA nanofiber membrane through deacetylation and the PDA coating process. After deacetylation, most of the ester groups (−O=C–O) in the CA nanofibers changed to hydroxyl groups (−OH) in the DA nanofibers. After PDA coating, the PDA coating layer adhered tightly to the surface of the DA nanofiber and a strong hydrogen bonding occurred between the phenolic O–H and N–H groups of the PDA coating layers and the hydroxyl groups of the DA nanofibers.
2.2. Morphology of CA, DA, and DA@PDA Nanofiber Membranes
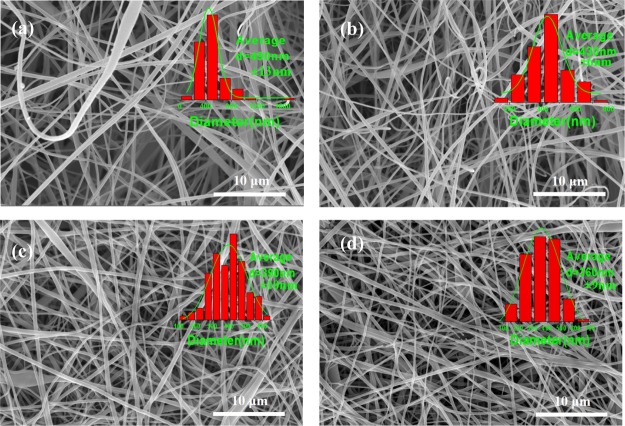
Figure 2 provides the morphology of pure CA and DA nanofibers with different deacetylation times of 5, 10, and 20 h. It can be seen that the CA, DA-5, DA-10, and DA-20 nanofibers retained their regular and good nanofiber morphology. Compared with CA nanofibers, after deacetylation, the average diameter of the DA nanofiber was lower than that of the CA nanofiber. The average diameters of the DA-5, DA-10, and DA-20 nanofibers were about 430, 390, and 360 nm, respectively, which decreased with an increasing deacetylation time.32 This could be because the ester groups (−O=C–O) of the CA nanofibers transformed into hydroxyl groups (−OH) for DA after deacetylation, which made the compactness among molecular chains increase due to the increase in the molecular arrangement regularity and the interaction between molecular chains.
Figure 2.
Scanning electron microscopy (SEM) images and diameter distributions of (a) pure CA, (b) DA-5, (c) DA-10, and (d) DA-20 nanofibers.
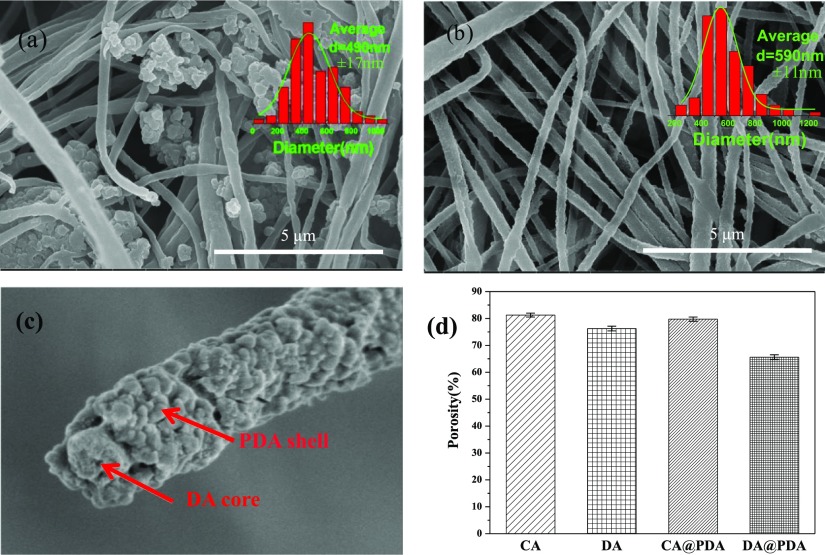
Figure 3a,b show the morphology of CA@PDA and DA@PDA composite nanofibers. The PDA coating time was 10 h. It can be seen that for the CA@PDA composite nanofibers, the PDA particles were not only attached to the surface of the CA nanofibers, but also aggregated in the space between nanofibers, leading to the blocking of the space between nanofibers. Interestingly, from Figure 3b, it can be seen that most of the PDA particles were coated along the fiber direction and formed a homogeneous PDA coating layer on the nanofiber surface. It also can be seen that the average diameter of DA@PDA composite nanofibers (590 nm) was larger than that of CA@PDA composite nanofibers (490 nm). This was because the abundant hydroxyl groups in the DA nanofibers acted as active sites to guide the PDA particles that accumulated along the fiber direction during the coating process. This significantly increased the uniformity of the PDA coating layer.
Figure 3.
SEM images of (a) CA@PDA and (b) DA@PDA composite nanofibers. (c) Cross-sectional image of DA@PDA composite nanofibers. (d) Porosity of CA, DA, CA@PDA, and DA@PDA composite nanofibers.
To further observe the structure of DA@PDA composite nanofibers, the cross section of DA@PDA composite nanofibers is shown in Figure 3c. Prior to observation by SEM, the sample was fractured using liquid nitrogen. It can be found that the typical core–shell structure was formed with DA nanofibers as the core and the PDA coating layer as the shell. Figure 3d provides the porosity of CA, CA@PDA, DA, and DA@PDA composite nanofibers. The porosity of DA slightly decreased in comparison with that of CA nanofibers. The porosity of CA@PDA and DA@PDA composite nanofibers were lower than that of corresponding CA and DA nanofibers due to the formation of the PDA coating layer on their surface.
2.3. Hydrophilicity and Specific Surface Area of DA@PDA Nanofiber Membranes
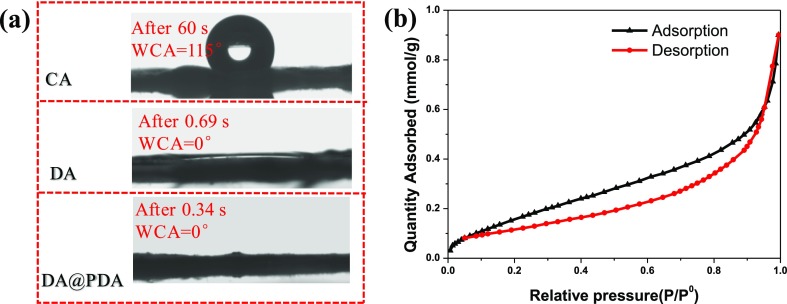
The water contact angle (WCA) of CA, DA, and DA@PDA nanofiber membranes are shown in Figure 4a. The WCA of the CA nanofiber membrane was 115°, showing a typical hydrophobic profile. As expected, the WCAs of DA and DA@PDA nanofiber membranes were about 0°, exhibiting a super-hydrophilic profile due to the existence of a large number of hydrophilic groups (hydroxyl groups), which will be beneficial for adsorption. The specific surface area of adsorbents is one of the major factors that influence their adsorption capacity when using them to remove dyes from aqueous solutions. Figure 4b provides the nitrogen adsorption–desorption isotherm of the DA@PDA nanofiber membrane obtained at 77 K. The specific surface area of the DA@PDA nanofiber membrane was calculated as 15.66 m2/g by the standard Brunauer–Emmett–Teller (BET) method, which was larger than that of traditional PDA microspheres (13.77 m2/g).33 This means that the higher is the specific surface area of the DA@PDA nanofiber membrane, the more contact there is between the MB molecules and the adsorption sites and the larger the potential adsorption capacity is of the DA@PDA nanofiber membranes for MB.
Figure 4.
(a) WCA of CA, DA, and DA@PDA nanofiber membranes. (b) Nitrogen adsorption–desorption isotherm obtained at 77 K for the DA@PDA nanofiber membrane.
2.4. MB Dye Adsorption Uptake
The adsorption uptake of CA, DA, and DA@PDA nanofiber membranes with increasing adsorption time for the adsorbing MB dye is shown in Figure 5a. It can be seen that the adsorption rate significantly decreased with the increasing adsorption time during the initial adsorption time and then remained stable. This indicates that the MB concentration had an obvious effect on the adsorption rate of the adsorbent. During the beginning of adsorption, the larger the MB concentration, the more the contact chance between the MB molecules and the DA@PDA nanofiber membrane, resulting in a higher adsorption rate. After adsorption for 24 h, the MB adsorption reached a saturated state and the adsorption uptake of the CA, DA, and DA@PDA nanofiber membranes were 4.9, 10.2, and 88.2 mg/g, respectively. The adsorption uptake of the DA@PDA nanofiber membrane was about 8.6 and 18 times higher than that of the DA and CA nanofiber membranes, respectively. This result indicated that the adsorption is essentially an equilibrium process. An increasing MB concentration will increase the driving force for the adsorption and, of course, would promote the adsorption.34
Figure 5.
(a) Adsorption capacity of CA, DA, and DA@PDA nanofiber membranes with increasing adsorption time for the adsorbing MB dye. (b) Digital photographs of the MB solution after being immersed in the representative CA, DA, and DA@PDA nanofiber membranes. (c) SEM image of the DA@PDA composite nanofiber after MB adsorption for 24 h. (Adsorption conditions: iriginal MB concentration was 50 mg/L, weight of adsorbent was 10 mg, temperature was 298 K, and pH was 6.5.)
Digital photographs of the MB solution under different adsorption times are shown in Figure 5b. When the DA@PDA nanofiber membrane was used as the adsorbent, the color of the MB solution varied from dark blue to light blue. It finally became nearly transparent with the increasing adsorption time, which suggests that most of the MB molecules in the solution were adsorbed by the CA@PDA nanofiber membrane. When CA and DA nanofiber membranes were used as the adsorbents, the color of the MB solution experienced no obvious change with the increasing adsorption time and remained dark blue after adsorbing for 24 h. From Figure 5c, it can be seen that many MB particles were adsorbed on the surface of the DA@PDA composite nanofiber, further implying the outstanding adsorption ability of the DA@PDA nanofiber membrane toward MB.
2.5. Effects of Original MB Solution pH and Concentration
Figure 6a provides the effect of the original MB solution pH on the adsorption capacity of the DA@PDA nanofiber membrane. It can be found that the adsorption capacity of the DA@PDA nanofiber membrane significantly increased with the increasing MB solution pH, from 1.43 to 92.64 mg/g when the solution pH ranged from 2 to 10. An MB removal rate of up to 93.21% was reached when the pH of the MB solution was 10, which indicates that the DA@PDA nanofiber membrane could be used as a high-efficiency adsorbent for the adsorbing MB. Furthermore, an alkaline solution was helpful for adsorbing MB. This was primarily because when the MB solution was acidic, the functional group (amino group) from the PDA protonated and presented a positive charge, while electrostatic repulsion occurred between the cationic MB molecule and the positively charged active sites of the adsorbent, resulting in a decrease of adsorption capacity.35 However, when the MB solution was alkaline, the phenol group from the PDA deprotonated and presented a negative charge, and a strong electrostatic attraction occurred between the cationic MB molecule and the negatively charged active sites of the adsorbent, resulting in an increase in the adsorption capacity.36Figure 6b provides the zeta potential of the DA@PDA nanofiber membrane at different pH values, which shows the surface charge changes of the adsorbent. It can be seen that the isoelectric point (point of zero charge) of the DA@PDA nanofiber membrane was about 4.6. When the solution pH is below 4.6, the DA@PDA nanofiber membrane showed a positive surface charge due to the protonation of the amino groups. And the electrostatic repulsion occurred between the positively charged active sites on the adsorbent and the cationic dye molecules, which will result in a decrease in the adsorption capacity of the adsorbent. When the solution pH value was above 4.6, the DA@PDA nanofiber membrane showed a negative surface charge due to the deprotonation of the phenolic groups, which will result in an increase in the MB removal efficiency.
Figure 6.
(a) Effect of the original MB solution pH on the adsorption ability of the DA@PDA nanofiber membrane; (b) zeta potential of the DA@PDA nanofiber membrane at different pH values (adsorption conditions: original MB concentration was 50 mg/L, weight of the adsorbent was 10 mg, temperature was 298 K, and adsorption time was 24 h). (c) The effect of the original MB solution concentration on the adsorption ability of the DA@PDA nanofiber membrane (adsorption conditions: temperature was 298 K, pH was 6.5, and weight of the adsorbent was 10 mg).
Figure 6c shows the effect of the original concentration of MB solution on the adsorption capacity of the DA@PDA nanofiber membrane. At the beginning of adsorption, the adsorption rate was high. It significantly decreased with the increasing adsorption time and reached equilibrium after adsorbing for 24 h. This was because, at the beginning of adsorption, a large number of active adsorption sites on the surface of the DA@PDA nanofiber membrane could be used, causing a fast adsorption rate. However, more and more active adsorption sites became occupied by the MB molecules with the increasing adsorption time. Furthermore, a strong repulsive force was generated between the adsorbed MB ions and the unadsorbed MB ions, making the remaining sites more and more difficult to occupy, until reaching an equilibrium state of adsorption and desorption.36 The equilibrium adsorption capacity of DA@PDA nanofiber membranes increased as the original MB solution concentration increased. This can be attributed to the fact that the higher original MB solution concentration provided a larger driving force to break through the mass transfer resistance of the MB.37 These results showed that the adsorption process largely relied on the original MB solution pH and concentration.
2.6. Kinetic Analysis
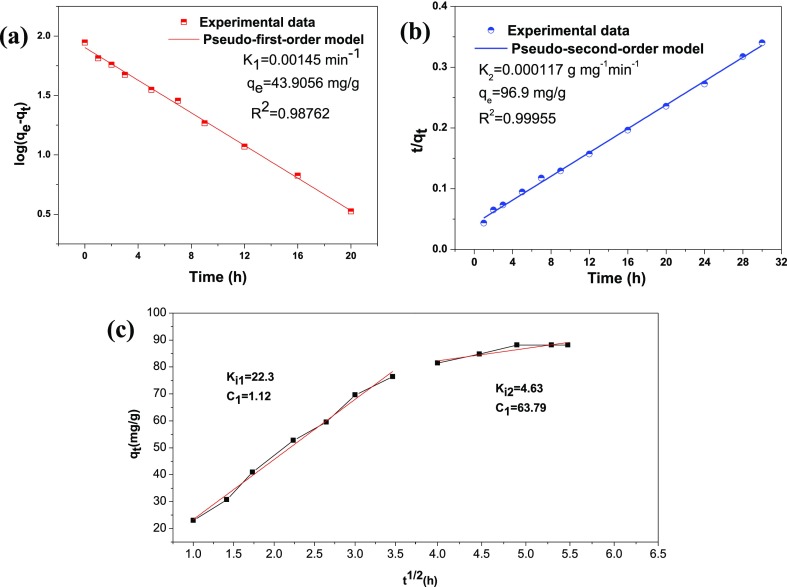
The pseudo-first-order model and pseudo-second-order model were used to understand the adsorption kinetics, as shown in Figure 7a,b. The two adsorption models can be expressed by eqs 1 and 2(38,39)
| 1 |
| 2 |
where qe (mg/g) is the amount of adsorbed MB at equilibrium, qt (mg/g) is the amount of adsorbed MB at time t, and K1 (min–1) and K2 (g/mg·min) are the pseudo-first-order rate constant and the pseudo-second-order rate constant, respectively. The pseudo-first-order kinetic model is based on the assumption that the adsorption process is the physical adsorption. The second-order model is based on the assumption that the adsorption process is the chemical adsorption, including the electron sharing and electron transfer between the adsorbent and adsorbate.
Figure 7.
(a) Pseudo-first-order kinetic model. (b) Pseudo-second-order kinetic model. (c) Intraparticle diffusion model of the DA@PDA nanofiber membrane for adsorbing MB (adsorption conditions: temperature was 298 K, and pH was 6.5).
The kinetic parameters of K1, K2, and qe, as well as the correlation coefficients (R2), were obtained by linear regression. It can be seen that the theoretical value of the adsorption capacity calculated by the pseudo-second-order model was 96.90 mg/g, which was closer to the experimental value of the adsorption capacity (88.2 mg/g). Moreover, the R2 (0.999) of the pseudo-second-order model was larger than that of the pseudo-first-order model. Those results indicated that the adsorption process of the DA@PDA nanofiber membrane followed the pseudo-second-order model rather than the pseudo-first-order model.
The Weber’s intraparticle diffusion model was applied to study the steps of the adsorption process, as shown in eq 3
| 3 |
where ki (mg/g·min) represents the intraparticle diffusion rate constant. Parameter c (mg/g) is the intercept under different adsorption processes. The intraparticle diffusion process curves of the MB adsorbed onto the DA@PDA nanofiber membrane are shown in Figure 7c.
The adsorption process can be divided into two steps. The first step is the film diffusion stage; that is, the MB molecules diffuse from the solution to the outer surface of the DA@PDA nanofiber membrane. The second step is the intraparticle diffusion stage, which is affected by the surface morphology and number of void sites of the DA@PDA nanofiber membrane. Parameter Ki1 was significantly larger than Ki2, which indicates that the intraparticle diffusion stage was a gentle process. The intercept at the second stage was larger than that at the first stage, indicating more contribution of surface adsorption in the rate-controlling step due to the boundary layer effect. Moreover, the values of R12 and R22 in the two steps were 0.99672 and 0.92274, respectively, meaning that the Weber’s intraparticle diffusion model had good applicability in studying the adsorption process.40
2.7. Adsorption Isotherm
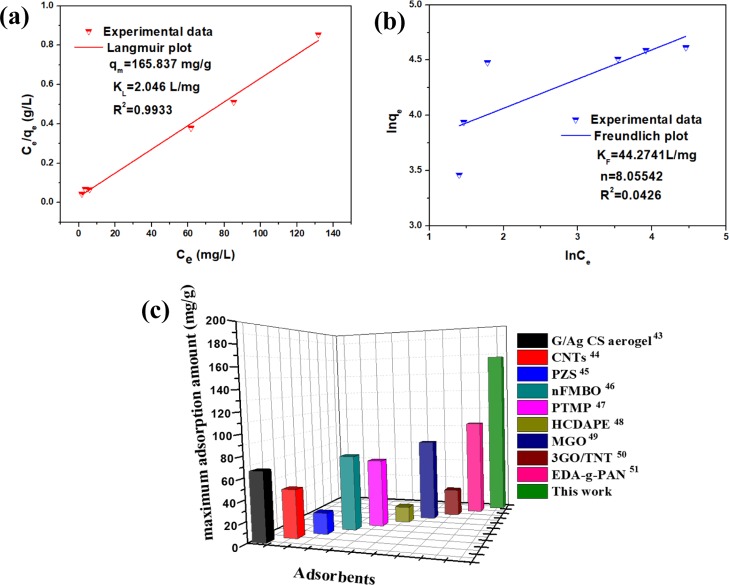
The Langmuir and Freundlich models were applied to study the equilibrium adsorption isotherm of the DA@PDA nanofiber membrane, as shown in eqs 4 and 5(41,42)
| 4 |
| 5 |
where KL (L/mg) and q0 (mg/g) are the Langmuir isothermal constants of the adsorption rate and the adsorption capacity, respectively. Parameters KF (L/mg) and n represent the Freundlich isothermal constants. For the Langmuir model, it was assumed that the adsorption was localized on a monolayer, and the adsorbent had homogeneous adsorption sites. For the Freundlich model, it was assumed that the adsorbent had multilayer adsorption sites on its heterogeneous surface.
Adsorption equilibrium is a dynamic process; that is, the adsorption equilibrium was reached when the adsorption rate was equal to the desorption rate. The adsorption isotherms simulated according to the Langmuir and Freundlich models are shown in Figure 8a,b. The original MB solution pH was 6.5, and the test temperature was 298 K. The theoretical value of the adsorption capacity qm calculated by Langmuir is about 165.837 mg/g, which confirms that the DA@PDA membrane is a good adsorbent toward MB. Furthermore, the R2 (0.9933) of the Langmuir model was larger than the R2 (0.0426) of the Freundlich model. Those results suggested that the Langmuir model was more suitable for describing the adsorption behavior of MB by DA@PDA nanofiber membranes. For comparison purposes, Figure 8c gives the adsorption capacities of different adsorbents for MB.43−51 The maximum adsorption capacities of DA@PDA composite nanofibers can reach up to 166 mg/g, which is larger than that of most of the traditional adsorbents, as shown in Figure 8c.
Figure 8.
(a) Langmuir and (b) Freundlich isothermal models of the DA@PDA nanofiber membrane for adsorbing MB (adsorption conditions: temperature was 298 K, and pH was 6.5). (c) Comparison of adsorption capacities of different adsorbents for MB at 298 K.
2.8. Thermodynamic Study
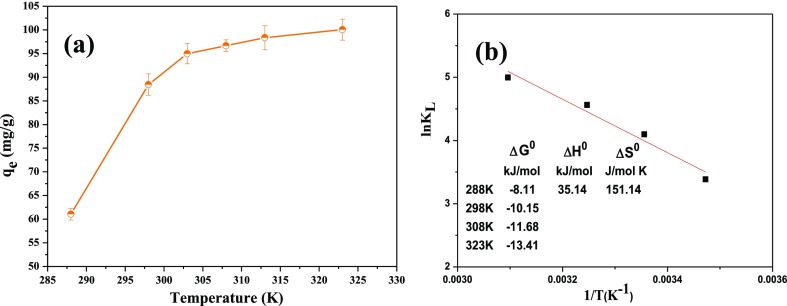
Figure 9a provides the effect of temperature on the adsorption capacity of the DA@PDA nanofiber membrane. The adsorption capacity of the DA@PDA nanofiber membrane significantly increased with increasing temperature in the range 288–323 K, which reached up to 100 mg/g at 323 K. Its corresponding removal rate was 99.8%. The results suggest that MB adsorption on the adsorbent is favored at higher temperatures within the appropriate temperature range. This result can be explained in that the mobility and diffusion of MB molecules increased with the increase of the temperature, resulting in an increase in contact with active adsorption sites on the DA@PDA nanofiber membrane. Moreover, the chemical interaction between the adsorbate and the surface function of the adsorbent increased with the increase of the temperature.52
Figure 9.
(a) Variation of the adsorption amount of MB with increasing temperature for the DA@DA nanofiber membrane (adsorption conditions: temperature was 298 K, pH was 6.5, weight of the adsorbent was 10 mg, and adsorption time was 24 h). (b) Plot of ln KL versus 1/T to determine the thermodynamic parameters.
To further study the adsorption mechanism of DA@PDA nanofiber membranes, the thermodynamic parameters, such as enthalpy change (ΔH0), Gibbs free energy change (ΔG0), and entropy change (ΔS0), were determined by eqs 6 and 7(53)
| 6 |
| 7 |
where T and R are the system absolute temperature (K) and the universal constant (8.314 J/mol·K), respectively. KL (L/mol·K) is the Langmuir equilibrium constant. The KL are 0.0925, 2.046, 0.2998, and 0.4618 L/mol·K when the temperatures are 288, 298, 308, and 323 K, respectively, based on eq 4. The ΔH0 and ΔS0 can be obtained from the intercept and slope of the lines (ln(KL) vs 1/T) in Figure 9b.
From Figure 9b, it also can be found that the ΔG0 significantly increased as the temperature increased, which indicates that the high temperature was helpful for the adsorption of MB onto the surface of the DA@PDA nanofiber membrane. All of the ΔG0 values were negative, which means that the adsorption process was spontaneous. The positive ΔH0 (35.14 kJ/mol) demonstrates that the adsorption process was a physisorption process and an endothermic process. Furthermore, the positive ΔS0 (151.14 J/mol·K) indicates that the randomness of the solid–solution interface increased when MB was combined with the active sites on the DA@PDA nanofiber membrane during adsorption. The thermodynamic parameters indicate that the DA@PDA nanofiber membrane could be used as a viable and efficient adsorbent for adsorbing MB in an aqueous solution.
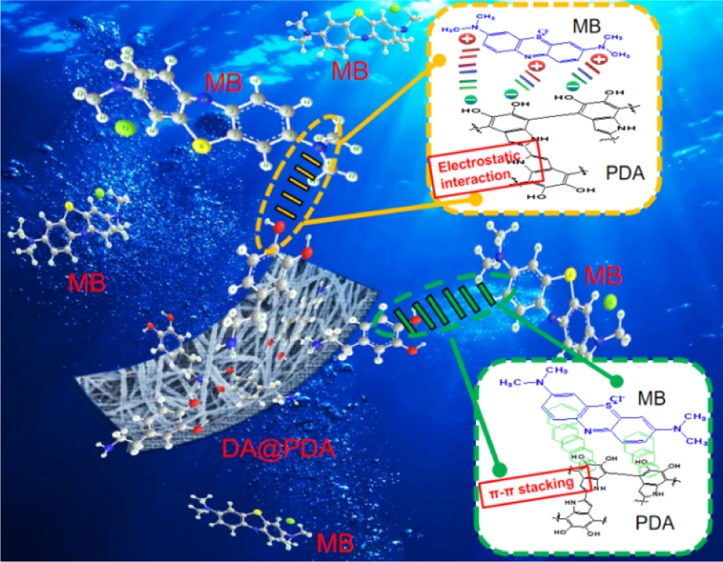
In order to further analyze the adsorption mechanism of DA@PDA composite nanofibers, the FTIR spectra of MB, DA@PDA, and DA@PDA-MB are shown in Figure 10a. In comparison with DA@PDA composite nanofibers, after adsorbing MB, the FTIR spectra of DA@PDA-MB changed significantly. The peak at 3354 cm–1 that was attributed to the stretching vibration of phenolic O–H and N–H in DA@PDA transformed into 3327 cm–1 in DA@PDA-MB. The peak at 1630 cm–1 that was attributed to the stretching vibration of the aromatic ring and bending vibration of N–H in DA@PDA transformed into 1600 cm–1 in DA@PDA-MB. The peak at 1157 cm–1 that was attributed to the stretching vibration of C–O in DA@PDA transformed into 1155 cm–1 in DA@PDA-MB. These results indicated that the phenolic O–H and N–H played a vital role in the MB adsorption process. Based on the above-mentioned changes, it can be deduced that the adsorption mechanism of DA@PDA composite nanofibers for adsorbing MB was attributable to the following reasons: (1) During the adsorption process, a large amount of phenolic O–H on the surface of DA@PDA composite nanofibers was negatively charged; thus, they could be used as effective adsorption sites for adsorbing cationic dye due to the formation of electrostatic interactions between the DA@PDA and MB molecules.54 (2) π–π stacking interactions occurred between the DA@PDA and MB molecules because both DA@PDA and MB contained abundant aromatic rings, which has been confirmed by the change of the peak at 1630 cm–1 (aromatic rings).55 Moreover, the DA@PDA composite nanofibers can be used as a highly efficient adsorbent for MB from an aqueous solution due to its advantages of nanometer scale, high specific surface area, high porosity, and good hydrophilicity. Figure 10b provides the schematic illustration of the adsorption process and adsorption mechanism of DA@PDA composite nanofibers for adsorbing MB.
Figure 10.
(a) FTIR spectrum of MB, DA@PDA, and DA@PDA-MB composite nanofibers. (b) Schematic illustration of the adsorption process and adsorption mechanism of DA@PDA composite nanofibers for adsorbing MB.
3. Conclusions
In summary, a CA nanofiber membrane was first fabricated by electrospinning, and then, it was deacetylated to obtain a DA nanofiber membrane. Subsequently, the DA nanofiber membrane was further modified by a PDA coating layer to obtain DA@PDA composite nanofibers with a core/shell structure that was applied as an environmentally friendly and highly efficient adsorbent for removing cationic MB dye from an aqueous solution. The results showed that the PDA coating layer was uniformly introduced onto the surface of DA nanofibers. The DA@PDA composite nanofibers had an excellent adsorption capacity, and its adsorption capacity of MB reached up to 88.15 mg/g at a temperature of 298 K and a pH of 6.5 after adsorption for 30 h, which was about 8.6 times higher than that of the DA nanofibers. This was because electrostatic and π–π stacking interactions occurred between the DA@PDA and MB molecules due to the existence of a large amount of phenolic O–H and aromatic rings in the PDA coating layers. The adsorption kinetics, adsorption isotherm, and thermodynamic analysis indicated that the adsorption behaviors of DA@PDA composite nanofibers for removing MB conformed to the pseudo-second-order model and the Langmuir model. Furthermore, adsorption is a spontaneous and physisorption process. These results suggest that the novel DA@PDA composite nanofibers possess great potential to be used as an environmentally friendly and highly efficient adsorbent in wastewater treatment.
4. Materials and Methods
4.1. Materials
Cellulose diacetate (CA, Mw = 30 kDa) with 39.8 wt % acetyl and 3.5 wt % hydroxyl was purchased from Shanghai Aladdin Technology Co. Ltd. N,N-Dimethylacetamide (DMAC, ≥99.5%) and absolute ethanol (EtOH) were obtained from Tianjin Zhiyuan Chemical Reagent Co. Ltd., China. Sodium hydroxide (NaOH, ≥96%) was purchased from Xiqiao Chemical Co. Ltd, China. Tris(hydroxymethyl)aminomethane (Tris) and 3,4-dihydroxyphenethylamine (dopamine) were obtained from Shanghai Aladdin Technology Co. Ltd. MB was purchased from Xiqiao Science and Technology Co. Ltd. All chemical solvents and analytical regents were used as received.
4.2. Preparation of CA, DA, and DA@PDA Nanofiber Membranes
CA powder (3.4 g) was put into a 20 mL acetone/DMAC (v/v, 2/1) solvent mixture and oscillated for 24 h at 333 K using a water bath oscillator to obtain a homogeneous 17 wt % CA electrospinning solution (Figure 11a,b). The CA nanofiber membranes were fabricated by an electrospinning instrument (Shenzhen Tongli Micro and Nano Technology Co. Ltd, China) (Figure 11c). During electrospinning, the needle inner diameter, electrospinning voltage, collection distance, injection rate, electrospinning time, environmental temperature, and humidity were 0.52 mm, 18 kV, 15 cm, 1 mL/h, 7 h, 298 K, and 40%, respectively. Before coating with PDA, the CA nanofiber membrane was first deacetylated by simply immersing it into a 100 mL 0.5 mol/L NaOH solution for 5, 10, and 20 h, which were referred to as DA-5, DA-10, and DA-20, respectively (Figure 11d). Then, they were taken out and washed 3 times using deionized water and dried in an oven at 60 °C for 5 h (Figure 11e). Next, the deacetylated DA nanofiber membrane was immersed into a 10 mM Tris-HCl buffer solution (pH = 8.5) with 2 mg/mL of dopamine and magnetically stirred at 30 °C for 40 h to form the PDA coating by dopamine self-polymerization (Figure 11f). The DA@PDA nanofiber membrane was taken out and carefully washed to remove the residual Tris-HCl solution for further characterization (Figure 11g). For reference, the CA nanofiber membrane was also treated by the PDA coating to obtain the CA@PDA nanofiber membrane by the above-mentioned process.
Figure 11.
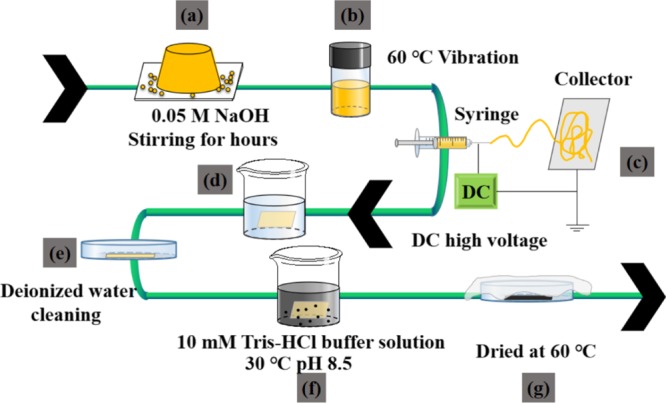
Process flow diagram for preparing a DA@PDA nanofiber membrane. (a) Weight CA powder, (b) prepare CA solution, (c) electrospinning process, (d) deacetylation process, (e) washing and drying process, (f) PDA coating process, and (g) washing and drying process.
4.3. Deacetylation Degree and Porosity Calculation
A certain weight of the CA membrane was added to 10 mL of 0.05 M NaOH solution for 5, 10, and 20 h under stirring, respectively. Then, the redundant alkali was neutralized by using 0.005 M HCl, and the phenolphthalein was used as the indicator. The deacetylation degree (DD %) of the DA nanofiber membrane was then calculated according to eqs 8–1032
| 8 |
| 9 |
| 10 |
where W is the CA membrane weight, Vb and Cb are the volume and concentration of NaOH solution, and Va and Ca are the volume and concentration of the HCl solution. The percentage of acetyl in CA was marked as acetyl (%).
A solvent replacement method was used to calculate the porosity of CA, DA, CA@PDA, and DA@PDA composite nanofibers. First, the dried samples were measured and referred to as W1. Second, the samples were put into an ethanol bath and adsorbed until the absorption equilibrium was reached. The weight of the adsorbed sample was measured and is referred to as W2. The porosity of the samples can be calculated via eq 11
| 11 |
where ρand ρ̅ are the density of ethanol and DA@PDA fiber membranes, respectively.
4.4. MB Adsorption Experiments
The MB adsorption capacities of CA, DA, and DA@PDA nanofiber membranes were evaluated by batch adsorption experiments. If not explicitly stated otherwise, the MB adsorption experiments were conducted when the MB solution, MB concentration, weight of the nanofiber membrane, temperature, and pH were 20, 50 mg/L, 10 mg, 298 K, and 6.5, respectively. The thermostatic water bath device was used to adjust the adsorption temperature. After adsorption, the remaining MB concentration in the supernatant solution was measured using a UV–visible spectrophotometer (UV-2600, Shimadzu, Japan), and a standard curve of MB was drawn at the maximum wavelength of the MB dye (665 nm). The adsorption capacity (q) and dye removal efficiency (R) of CA, DA, and DA@PDA nanofiber membranes were obtained using eqs 12 and 13, respectively, as follows56
| 12 |
| 13 |
where m is the weight (g) of the CA, DA, and DA@PDA nanofiber membranes, and V represents the volume (L) of the MB solution. C0 and Ct are the concentrations (mg/L) of the MB solution before and after adsorption, respectively.
In order to study the effect of the MB solution’s pH on the adsorption capacity, 10 mg of a nanofiber membrane was immersed in 20 mL of a 50 mg/L MB solution at 298 K, under different original pH conditions of 2–10. The MB concentration remaining in the supernatant solution after adsorbing for 24 h was investigated. The pH of the original MB solution was controlled by adding 0.1 mol/L NaOH or 0.1 mol/L HCl solution, dropwise. In order to study the adsorption isotherms, 10 mg of the nanofiber membrane was immersed into 20 mL of the MB solution at 298 K, at a pH of 6.5, under different original solution concentrations of 30, 50, and 100 mg/L. The MB solution concentration remaining in the supernatant solution after adsorbing for 24 h was investigated. In order to investigate the adsorption thermodynamic, the adsorption isotherms at different temperatures of 288, 298, 303, 308, 313, and 323 K were also studied. The other experimental parameters were the same as in the pH experiment.
4.5. Characterization
The morphologies of CA, DA, CA@PDA, and DA@PDA nanofiber membranes were observed using SEM (S-3400N, Hitachi, Japan) with an accelerating voltage of 5 kV. The SEM images were measured using the Nano Measure software to obtain the diameter distributions and the average diameters of the CA, DA, CA@PDA, and DA@PDA nanofiber membranes. The chemical structures of the CA, DA, CA@PDA, and DA@PDA nanofiber membranes were characterized using an FTIR spectrometer (Nicolet 6700, Thermo Scientific, USA). The resolution was 4 cm–1 and the wavenumber range was 400–4000 cm–1, and each sample was scanned 128 times in total. The WCA in air was measured on a machine (DSA25, KRUSS, Germany). The specific surface area of the DA@PDA nanofiber membrane was measured and calculated on an adsorption unit (3Flex 3500 Micrometrics, USA) using the BET method. At the same time, the graphic data of adsorption and desorption under a nitrogen atmosphere were obtained. The zeta potential of the DA@PDA surface was investigated to evaluate the surface zeta potential of the sample, which ranges from pH = 2 to pH = 10 using a nanometer particle size and a zeta potential analyzer (NanoPlus3, micromeritics, USA).
Acknowledgments
The authors would like to acknowledge the financial support of the Outstanding Young Scientific Research Personnel Training Plan in the Colleges and Universities of Fujian Province (grant no. GY-Z160146), the Research Fund of Fujian University of Technology (grant no. GY-Z15091, GY-Z160121), the Program of New Century Excellent Talents in the University of Fujian Province (grant no. GY-Z17065), the External Cooperative Projects of Fujian Province (grant no. 2018I0001), the Young Teachers Education Research Project (grant no. JAT170377), the National Natural Science Foundation of China (grant no. 51303027), and the China Scholarship Council and the Wisconsin Institute for Discovery (WID) at the University of Wisconsin–Madison.
The authors declare no competing financial interest.
References
- Pattnaik P.; Dangayach G. S. Analysis of influencing factors on sustainability of textile wastewater: a structural equation approach. Water, Air, Soil Pollut. 2019, 230, 156. 10.1007/s11270-019-4206-x. [DOI] [Google Scholar]
- Deng C.; Liu J.; Zhou W.; Zhang Y.-K.; Du K.-F.; Zhao Z.-M. Fabrication of spherical cellulose/carbon tubes hybrid adsorbent anchored with welan gum polysaccharide and its potential in adsorbing MB. Chem. Eng. J. 2012, 200–202, 452–458. 10.1016/j.cej.2012.06.059. [DOI] [Google Scholar]
- Russo V.; Masiello D.; Trifuoggi M.; Di Serio M.; Tesser R. Design of an adsorption column for methylene blue abatement over silica: From batch to continuous modeling. Chem. Eng. J. 2016, 302, 287–295. 10.1016/j.cej.2016.05.020. [DOI] [Google Scholar]
- He X.; Male K. B.; Nesterenko P. N.; Brabazon D.; Paull B.; Luong J. H. T. Adsorption and Desorption of Methylene Blue on Porous Carbon Monoliths and Nanocrystalline Cellulose. ACS Appl. Mater. Interfaces 2013, 5, 8796–8804. 10.1021/am403222u. [DOI] [PubMed] [Google Scholar]
- Liu Y.; Wang J.; Zheng Y.; Wang A. Adsorption of methylene blue by kapok fiber treated by sodium chlorite optimized with response surface methodology. Chem. Eng. J. 2012, 184, 248–255. 10.1016/j.cej.2012.01.049. [DOI] [Google Scholar]
- He Y.; Li G.; Wang H.; Zhao J.; Su H.; Huang Q. Effect of operating conditions on separation performance of reactive dye solution with membrane process. J. Membr. Sci. 2008, 321, 183–189. 10.1016/j.memsci.2008.04.056. [DOI] [Google Scholar]
- de Oliveira G. R.; Fernandes N. S.; de Melo J. V.; da Silva D. R.; Urgeghe C.; Martínez-Huitle C. A. Electrocatalytic properties of Ti-supported Pt for decolorizing and removing dye from synthetic textile wastewaters. Chem. Eng. J. 2011, 168, 208–214. 10.1016/j.cej.2010.12.070. [DOI] [Google Scholar]
- Deng S.; Xu H.; Jiang X.; Yin J. Poly(vinyl alcohol) (PVA)-enhanced hybrid hydrogels of hyperbranched poly(ether amine) (hPEA) for selective adsorption and separation of dyes. Macromolecules 2013, 46, 2399–2406. 10.1021/ma302330w. [DOI] [Google Scholar]
- Zhang Y.-R.; Shen S.-L.; Wang S.-Q.; Huang J.; Su P.; Wang Q.-R.; Zhao B.-X. A dual function magnetic nanomaterial modified with lysine for removal of organic dyes from water solution. Chem. Eng. J. 2014, 239, 250–256. 10.1016/j.cej.2013.11.022. [DOI] [Google Scholar]
- Zhang G.; Shi L.; Zhang Y.; Wei D.; Yan T.; Wei Q.; Du B. Aerobic granular sludge-derived activated carbon: Mineral acid modification and superior dye adsorption capacity. RSC. Adv. 2015, 5, 25279–25286. 10.1039/c4ra15216f. [DOI] [Google Scholar]
- Nuengmatcha P.; Chanthai S.; Mahachai R.; Oh W.-C. Sonocatalytic performance of ZnO/graphene/TiO2 nanocomposite for degradation of dye pollutants (methylene blue, texbrite BAC-L, texbrite BBU-L and texbrite NFW-L) under ultrasonic irradiation. Dyes Pigm. 2016, 134, 487–497. 10.1016/j.dyepig.2016.08.006. [DOI] [Google Scholar]
- Li Z.; Wang T.; Meng J.; Liu X. M.; Xu J. M.; Wang F.; Brookes P. Zeolite-supported nanoscale zero-valent iron: New findings on simultaneous adsorption of Cd(II), Pb(II), and As(III) in aqueous solution and soil. J. Hazard. Mater. 2018, 344, 1–11. 10.1016/j.jhazmat.2017.09.036. [DOI] [PubMed] [Google Scholar]
- Hasanzadeh M.; Simchi A.; Far H. S. Nanoporous composites of activated carbon-metal organic frameworks for organic dye adsorption: Synthesis, adsorption mechanism and kinetics studies. J. Ind. Eng. Chem. 2020, 81, 405–414. 10.1016/j.jiec.2019.09.031. [DOI] [Google Scholar]
- Heydari A.; Daneshafruz H.; Doostan F.; Sheibani H. Optimization and Characterization of Wheat Bran Modified by Citric Acid Using a Dry Reaction Method for Enhancement of Methylene Blue Adsorption. Int. J. Food Eng. 2018, 14, 1556–3758. 10.1515/ijfe-2018-0091. [DOI] [Google Scholar]
- Shehzad K.; Xie C.; He J. Y.; Cai X. G.; Xu W. H.; Liu J. H. Facile synthesis of novel calcined magnetic orange peel composites for efficient removal of arsenite through simultaneous oxidation and adsorption. J. Colloid Interface Sci. 2018, 511, 155–164. 10.1016/j.jcis.2017.09.110. [DOI] [PubMed] [Google Scholar]
- Gusmão K. A. G.; Gurgel L. V. A.; Melo T. M. S.; Gil L. F. Adsorption studies of methylene blue and gentian violet on sugarcane bagasse modified with EDTA dianhydride (EDTAD) in aqueous solutions: Kinetic and equilibrium aspects. J. Environ. Manage. 2013, 118, 135–143. 10.1016/j.jenvman.2013.01.017. [DOI] [PubMed] [Google Scholar]
- Khan N. A.; Hasan Z.; Jhung S. H. Adsorptive removal of hazardous materials using metal-organic frameworks (MOFs): A review. J. Hazard. Mater. 2013, 244–245, 444–456. 10.1016/j.jhazmat.2012.11.011. [DOI] [PubMed] [Google Scholar]
- Zhu Z.; Li G.; Zeng G.; Chen X.; Hu D.; Zhang Y.; Sun Y. Fast capture of methyl-dyes over hierarchical amino-Co0.3Ni0.7Fe2O4@SiO2 nanofibrous membranes. J. Mater. Chem. A 2015, 3, 22000–22004. 10.1039/c5ta06310h. [DOI] [Google Scholar]
- Takagi H.; Asano A. Effects of processing conditions on flexural properties of cellulose nanofiber reinforced “green” composites. Composites, Part A 2008, 39, 685–689. 10.1016/j.compositesa.2007.08.019. [DOI] [Google Scholar]
- Khatri Z.; Arain R. A.; Jatoi A. W.; Mayakrishnan G.; Wei K.; Kim I.-S. Dyeing and characterization of cellulose nanofibers to improve color yields by dual padding method. Cellulose 2013, 20, 1469–1476. 10.1007/s10570-013-9893-7. [DOI] [Google Scholar]
- Liu Z.; Wang H.; Wang E.; Zhang X.; Yuan R.; Zhu Y. Superhydrophobic poly(vinylidene fluoride) membranes with controllable structure and tunable wettability prepared by one-step electrospinning. Polymer 2016, 82, 105–113. 10.1016/j.polymer.2015.11.045. [DOI] [Google Scholar]
- Abedini R.; Mousavi S. M.; Aminzadeh R. A novel cellulose acetate (CA) membrane using TiO2 nanoparticles: Preparation, characterization and permeation study. Desalination 2011, 277, 40–45. 10.1016/j.desal.2011.03.089. [DOI] [Google Scholar]
- Demirci S.; Celebioglu A.; Uyar T. Surface modification of electrospun cellulose acetate nanofibers via RAFT polymerization for DNA adsorption. Carbohydr. Polym. 2014, 113, 200–207. 10.1016/j.carbpol.2014.06.086. [DOI] [PubMed] [Google Scholar]
- Celebioglu A.; Demirci S.; Uyar T. Cyclodextrin-grafted electrospun cellulose acetate nanofibers via “Click” reaction for removal of phenanthrene. Appl. Surf. Sci. 2014, 305, 581–588. 10.1016/j.apsusc.2014.03.138. [DOI] [Google Scholar]
- Tian Y.; Wu M.; Liu R.; Li Y.; Wang D.; Tan J.; Wu R.; Huang Y. Electrospun membrane of cellulose acetate for heavy metal ion adsorption in water treatment. Carbohydr. Polym. 2011, 83, 743–748. 10.1016/j.carbpol.2010.08.054. [DOI] [Google Scholar]
- Ma F.-f.; Zhang N.; Wei X.; Yang J.-h.; Wang Y.; Zhou Z.-w. Blend-electrospun poly(vinylidene fluoride)/polydopamine membranes: Self-polymerization of dopamine and the excellent adsorption/separation abilities. J. Mater. Chem. A 2017, 5, 14430–14443. 10.1039/c7ta02845h. [DOI] [Google Scholar]
- Zhang Q.; Li Y.; Yang Q.; Chen H.; Chen X.; Jiao T.; Peng Q. Distinguished Cr(VI) capture with rapid and superior capability using polydopamine microsphere: Behavior and mechanism. J. Hazard. Mater. 2018, 342, 732–740. 10.1016/j.jhazmat.2017.08.061. [DOI] [PubMed] [Google Scholar]
- Farnad N.; Farhadi K.; Voelcker N. H. Polydopamine nanoparticles as a new and highly selective biosorbent for the removal of copper (II) ions from aqueous solutions. Water, Air, Soil Pollut. 2012, 223, 3535–3544. 10.1007/s11270-012-1131-7. [DOI] [Google Scholar]
- Lv Y.; Yang H.-C.; Liang H.-Q.; Wan L.-S.; Xu Z.-K. Nanofiltration membranes via co-deposition of polydopamine/polyethylenimine followed by cross-linking. J. Membr. Sci. 2015, 476, 50–58. 10.1016/j.memsci.2014.11.024. [DOI] [Google Scholar]
- Wang J.; Zhu J. Y.; Tsehaye M. T.; Li J.; Dong G. Y.; Yuan S. S.; Li X.; Zhang Y. T.; Liu J. D.; Bruggen B. V. D. High flux electroneutral loose nanofiltration membranes based on rapid deposition of polydopamine/polyethyleneimine. J. Mater. Chem. A 2017, 5, 14447–14932. 10.1039/c7ta02661g. [DOI] [Google Scholar]
- Xu Y. C.; Wang Z. X.; Cheng X. Q.; Xiao Y. C.; Shao L. Positively charged nanofiltration membranes via economically mussel-substance-simulated co-deposition for textile wastewater treatment. Chem. Eng. J. 2016, 303, 555–564. 10.1016/j.cej.2016.06.024. [DOI] [Google Scholar]
- Ahmed F.; Arbab A. A.; Jatoi A. W.; Khatri M.; Memon N.; Khatri Z.; Kim I. S. Ultrasonic-assisted deacetylation of cellulose acetate nanofibers: A rapid method to produce cellulose nanofibers. Ultrason. Sonochem. 2017, 36, 319–325. 10.1016/j.ultsonch.2016.12.013. [DOI] [PubMed] [Google Scholar]
- Liu H.; Cai X.; Wang Y.; Chen J. Adsorption mechanism-based screening of cyclodextrin polymers for adsorption and separation of pesticides from water. Water Res. 2011, 45, 3499–3511. 10.1016/j.watres.2011.04.004. [DOI] [PubMed] [Google Scholar]
- Huang Y.; Farooq M. U.; Lai S.; Feng X.; Sampranpiboon P.; Wang X.; Huang W. Model fitting of sorption kinetics data: Misapplications overlooked and their rectifications. AIChE J. 2018, 64, 1793–1805. 10.1002/aic.16051. [DOI] [Google Scholar]
- Fu J.; Chen Z.; Wang M.; Liu S.; Zhang J.; Zhang J.; Han R.; Xu Q. Adsorption of methylene blue by a high-efficiency adsorbent (polydopamine microspheres): Kinetics, isotherm, thermodynamics and mechanism analysis. Chem. Eng. J. 2015, 259, 53–61. 10.1016/j.cej.2014.07.101. [DOI] [Google Scholar]
- Albadarin A. B.; Collins M. N.; Naushad M.; Shirazian S.; Walker G.; Mangwandi C. Activated lignin-chitosan extruded blends for efficient adsorption of methylene blue. Chem. Eng. J. 2017, 307, 264–272. 10.1016/j.cej.2016.08.089. [DOI] [Google Scholar]
- Jumadi J.; Kamari A.; Rahim N. A.; Wong S. T. S.; Yusoff S. N. M.; Ishak S.; Abdulrasool S.; et al. Removal of methylene blue and congo red by magnetic chitosan nanocomposite: characterization and adsorption studies. J. Phys.: Conf. Ser. 2019, 1397, 012027. 10.1088/1742-6596/1397/1/012027. [DOI] [Google Scholar]
- Boyd G. E.; Adamson A. W.; Myers L. S. The exchange adsorption of Ions from aqueous solutions by organic zeolites. II. Kinetics. Am. Chem. Soc. 1947, 69, 2836–2848. 10.1021/ja01203a066. [DOI] [PubMed] [Google Scholar]
- Yuh-Shan H. Citation review of Lagergren kinetic rate equation on adsorption reactions. Scientometrics 2004, 59, 171–177. 10.1023/b:scie.0000013305.99473.cf. [DOI] [Google Scholar]
- Chen L.; Bai B. Equilibrium, kinetic, thermodynamic, and in situ regeneration studies about MB adsorption by the raspberry-like TiO2@yeast microspheres. Ind. Eng. Chem. Res. 2013, 52, 15568–15577. 10.1021/ie4020364. [DOI] [Google Scholar]
- Goswami M.; Borah L.; Mahanta D.; PhuKan P. Equilibrium modeling, kinetic and thermodynamic studies on the adsorption of Cr(VI) using activated carbon derived from matured tea leaves. J. Porous Mater. 2014, 21, 1025–1034. 10.1007/s10934-014-9852-1. [DOI] [Google Scholar]
- Holmes H. N. Colloid and capillary chemistry. Science 1927, 65, 40–41. 10.1126/science.65.1672.40-a. [DOI] [Google Scholar]
- Dubey S. P.; Dwivedi A. D.; Kim I.-C.; Sillanpaa M.; Kwon Y.-N.; Lee C. Synthesis of graphene-carbon sphere hybrid aerogel with silver nanoparticles and its catalytic and adsorption applications. Chem. Eng. J. 2014, 244, 160–167. 10.1016/j.cej.2014.01.042. [DOI] [Google Scholar]
- Yao Y.; Xu F.; Chen M.; Xu Z.; Zhu Z. Adsorption behavior of methylene blue on carbon nanotubes. Bioresour. Technol. 2010, 101, 3040–3046. 10.1016/j.biortech.2009.12.042. [DOI] [PubMed] [Google Scholar]
- Chen Z.; Fu J.; Wang M.; Wang X.; Zhang J.; Xu Q. Adsorption of cationic dye (methylene blue) from aqueous solution using poly(cyclotriphosphazene-co-4,4′-sulfonyldiphenol) nanospheres. Appl. Surf. Sci. 2014, 289, 495–501. 10.1016/j.apsusc.2013.11.022. [DOI] [Google Scholar]
- Lu K.; Wang T.; Zhai L.; Wu W.; Dong S.; Gao S.; Mao L. Adsorption behavior and mechanism of Fe-Mn binary oxide nanoparticles: Adsorption of methylene blue. J. Colloid Interface Sci. 2019, 539, 553–562. 10.1016/j.jcis.2018.12.094. [DOI] [PubMed] [Google Scholar]
- AL-Hammadi S. A.; Al-Absi A. A.; Dahman O. A. B.; Saleha T. A. Poly(trimesoyl chloride-melamine) grafted on palygorskite for simultaneous ultra-trace removal of methylene blue and toxic metals. J. Environ. Manage. 2018, 226, 358–364. 10.1016/j.jenvman.2018.08.025. [DOI] [PubMed] [Google Scholar]
- Saleh T. A.; Rachman I. B.; Ali S. A. Tailoring hydrophobic branch in polyzwitterionic resin for simultaneous capturing of Hg(II) and methylene blue with response surface optimization. Sci. Rep. 2017, 7, 4573. 10.1038/s41598-017-04624-6. [DOI] [PMC free article] [PubMed] [Google Scholar]
- Jalali K.; Pajootan E.; Bahrami H. Elimination of hazardous methylene blue from contaminated solutions by electrochemically magnetized graphene oxide as a recyclable adsorbent. Adv. Powder Technol. 2019, 30, 2352–2362. 10.1016/j.apt.2019.07.018. [DOI] [Google Scholar]
- Nguyen C. H.; Juang R.-S. Efficient removal of methylene blue dye by a hybrid adsorption-photocatalysis process using reduced graphene oxide/titanate nanotube composites for water reuse. J. Ind. Eng. Chem. 2019, 76, 296–309. 10.1016/j.jiec.2019.03.054. [DOI] [Google Scholar]
- Haider S.; Binagag F. F.; Haider A.; Mahmood A.; Shah N.; Al-Masry W. A.; Khan S. U.-D.; Ramay S. M. Adsorption kinetic and isotherm of methylene blue, safranin T and rhodamine B onto electrospun ethylenediamine-grafted-polyacrylonitrile nanofibers membrane. Desalin. Water Treat. 2015, 55, 1609–1619. 10.1080/19443994.2014.926840. [DOI] [Google Scholar]
- Mouni L.; Belkhiri L.; Bollinger J.-C.; Bouzaza A.; Assadi A.; Tirri A.; Dahmoune F.; et al. Removal of Methylene Blue from aqueous solutions by adsorption on Kaolin: kinetic and equilibrium studies. Appl. Clay Sci. 2018, 153, 38–45. 10.1016/j.clay.2017.11.034. [DOI] [Google Scholar]
- Gobi K.; Mashitah M. D.; Vadivelu V. M. Adsorptive removal of Methylene Blue using novel adsorbent from palm oil mill effluent waste activated sludge: Equilibrium, thermodynamics and kinetic studies. Chem. Eng. J. 2011, 171, 1246–1252. 10.1016/j.cej.2011.05.036. [DOI] [Google Scholar]
- Xiong L.; Yang Y.; Mai J.; Sun W.; Zhang C.; Wei D.; Chen Q.; Ni J. Adsorption behavior of methylene blue onto titanate nanotubes. Chem. Eng. J. 2010, 156, 313–320. 10.1016/j.cej.2009.10.023. [DOI] [Google Scholar]
- Ai L.; Zhang C.; Liao F.; Wang Y.; Li M.; Meng L.; Jiang J. Removal of methylene blue from aqueous solution with magnetite loaded multi-wall carbon nanotube: Kinetic, isotherm and mechanism analysis. J. Hazard. Mater. 2011, 198, 282–290. 10.1016/j.jhazmat.2011.10.041. [DOI] [PubMed] [Google Scholar]
- Liu R.-L.; Liu Y.; Zhou X.-Y.; Zhang Z.-Q.; Zhang J.; Dang F.-Q. Biomass-derived highly porous functional carbon fabricated by using a free-standing template for efficient removal of MB. Bioresour. Technol. 2014, 154, 138–147. 10.1016/j.biortech.2013.12.034. [DOI] [PubMed] [Google Scholar]


