Abstract
Polymer flooding is one of the most incipient chemical-based enhanced oil recovery process that utilizes the injection of polymer solutions into oil reservoirs. The presence of a polymer in water increases the viscosity of the injected fluid, which upon injection reduces the water-to-oil mobility ratio and the permeability of the porous media, thereby improving oil recovery. The objective of this work is to investigate strategies that would help increase oil recovery. For that purpose, we have studied the effect of injection pressure and increasing polymer concentration on flooding performance. This work emphasizes on the development of a detailed mathematical model describing fluid saturations, pressure, and polymer concentration during the injection experiments and predicts oil recovery. The mathematical model developed for simulations is a black oil model consisting of a two-phase flow (aqueous and oleic) of polymeric solutions in one-dimensional porous media as a function of time and z-coordinate. The mathematical model consisting of heterogeneous, nonlinear, and simultaneous partial differential equations efficiently describes the physical process and consists of various parameters and variables that are involved in our lab-scale process to quantify and analyze them. A dimensionless numerical solution is achieved using the finite difference method. We implement the second-order high-accuracy central and backward finite-divided-difference formula along the z-direction that results in the discretization of the partial differential equations into ordinary differential equations with time as an independent variable. The input parameters such as porosity, permeability, saturation, and pore volume obtained from experimental data by polymer flooding are used in the simulation of the developed mathematical model. The model-predicted and commercial reservoir (CMG)-simulated oil production is in good agreement with experimental oil recoveries with a root-mean-square error (RMSE) in the range of 1.5–2.5 at a maximum constant pressure of 3.44 MPa as well as with temporal variation of the injection pressure between 2.41 and 3.44 MPa.
1. Introduction
Enhanced oil recovery (EOR) processes endeavor to improve the recovery of hydrocarbons from oil reservoirs following primary production using water flooding.1 In water flooding, the oil reservoirs are mandated to be operated at an elevated pressure in addition to its prevailing colossal pressure conditions subjected to its large top overburden; regulation of the same is not only very challenging, but also it may lead to some unusual hazards inside the geological core. However, oil recovery due to primary production is highly inefficient, resulting in their utmost economic thresholds of producing only 20–25% of the original oil-in-place (OOIP).2
A large proportion of crude oil remains in the reservoir after the application of primary recovery and secondary recovery processes. The entrapment of residual oil is related to the porous capillary structure of the reservoir rock. The capillary effect becomes more dominant as the relative oil structure decreases, resulting in the entrapment of oil in place by reducing the fluidity ratio between oil and aqueous phases.2,3 In the present global scenario, the development of an injection strategy having the potential of uplifting the incremental oil recovery by more than 50% OOIP has gained considerable attention in the field of research and technology.4 Among chemical-based enhanced oil recovery processes, polymer flooding is highly practiced in conventional oil reservoirs with a remarkable success rate. Polymeric solutions with high molecular weights effectively increase the viscosity of the displacing fluid, which upon injection in the reservoir core aids in the diminution of water-to-oil mobility ratio and permeability of the injected fluid.5−7 The net result is the increase in oil displacement, reservoir sweep efficiencies, and pressure gradient, especially in heterogeneous oil reservoirs.8−11
In this context, rigorous simulation studies of the experimental profiles of polymer flooding is highly necessitated. Additionally, the implementation of robust optimization techniques becomes highly crucial in the milieu of achieving maximum oil recoveries at the lowest possible capital investment. Optimization involves maximizing the objective function (cumulative oil recovery) from a polymer-flooded oil reservoir by manipulating multifarious input conditions like injection concentration, injection flow rate, etc. In recent times, many researchers have proposed mathematical models of polymer flooding to evaluate the flow of viscoelastic polymer through a porous medium. In these studies, some of the most important effects and phenomena such as dispersion-diffusion, salt effects (which reduce the injection fluid viscosity), thermal effects, effective concentration, inaccessible pore volume, polymer retention or adsorption on rock surface, permeability reduction of water phase, elastic behavior of viscoelastic polymers (which leads to pistonlike displacement of oil), equivalent shear rate in porous media, and reduction in residual oil saturation have not been considered or have not been fully investigated. Zhang et al.12 studied modeling and simulation of partially hydrolyzed polymaleic anhydride flow through porous media. The mathematical model incorporated several important effects such as polymer relaxation time, adsorption, permeability reduction factor, elongation viscosity, elastic behavior, and viscosity as a function of polymer concentration and shear rate; the prime focus was to estimate the functionality of polymer elasticity and relaxation time on EOR. A complete polymer flooding flow model incorporating polymer degradation, adsorption, elastic effects, salt effects, diffusion, inaccessible pore volume, permeability reduction of water phase, shear thinning behavior, and polymer rheology was presented by Wang and Liu.13 The flow equations for aqueous, oleic, polymer, and salt were solved by IMPES and Runge–Kutta methods for improving convergence in scale (60 m × 60 m × 3 m) in Bohai Bay offshore oilfield in China. To achieve better oil recovery, polymeric solutions can be employed in conjunction with other enhanced oil recovery processes, such as surfactant–polymer flooding, synergetic effect of alkaline–surfactant–polymer flooding (ASP), and polymer–alternating–gas processes in which the polymeric phase is envisioned to play a vital role in controlling the mobility ratio.14 To that end, more advanced and detailed polymer flooding models incorporating pH effects are mandated.
Numerous studies have focused on generating and calibrating surfactant–polymer flooding simulation profiles in predictive modeling framework that entails the computational adeptness in terms of both validation and prediction. Alsofi et al.15 performed a similar study by using the University of Texas Chemical Flood Simulator: UTCHEM. The model was built using experimental data and later on was calibrated and validated through history-matching oil-displacement core flooding results. Their predictive SP model was more unique and robust compared to the similar work in the literature.16−19 Recently, in 2016, Ferreira et al.20 presented a straightforward and low-cost aiding tool that was used to determine retention levels, inaccessible pore volume, and in situ viscosity in a single-phase one-dimensional (1D) polymer flooding experiments.
The simulation of experimental results of chemical flooding is very important for designing or optimizing decision-making variables such as cumulative oil recovery factor and net present value (from economic perspectives). Judicial selection of a reservoir simulator is highly significant for analyzing any relevant real-time investigation. The simulator should have the pertinent functionalities required not only for modeling core flooding experiments for better understanding of the polymer flow behavior during chemical flooding, but also for parametric simulation, which can be effectively employed in commercial-scale applications. Different commercial simulators utilized for modeling complex chemical-enhanced oil recovery processes were ECLIPSE by Schlumberger, STARS developed by CMG, and UTCHEM that has been created at the University of Texas at Austin for research-scale applications. UTCHEM has attractive features such as the ability of modeling lab-scale experiments and simulating complex chemical reactions as well as polymer behavior. Due to its worldwide applications, it has been used by many researchers.21−27 ECLIPSE is a fully implicit, three-phase, three-dimensional (rectangular coordinates) black oil simulator and commonly practiced in the industries for field-scale applications to model different chemical EOR processes, including surfactant and polymer flooding. Morel et al.28 performed the feasibility study of polymer injection in Dalia field using ECLIPSE polymer module and achieved commendable results about additional oil recovery and polymer injectivity. STARS by CMG is the advanced process reservoir simulator and has the potential to model both lab-scale and field-scale models. Furthermore, it has the proficiency to accommodate and simulate complex chemical-enhanced oil recovery processes such as polymer flooding, surfactant flooding, steam flooding, and in situ combustion. Thus, the different commercial simulators available for predicting the EOR process have not considered some important empirical correlations necessary for polymer flooding. Therefore, there is a need to develop a detailed model for predicting heavy-oil recovery using polymer flooding. Recently, Liang et al.29 have demonstrated the thermal stability and salinity resistance of various polymers such as diutan gum, scleroglucan, xanthan gum, and HPAM in high-temperature and high-salinity oil reservoirs for the EOR process.
The objective of this paper is to develop and integrate a detailed mathematical model for the lab-scale replica of the process in our laboratory. To that end, we carry out experiments by injecting partially hydrolyzed polyacrylamide solutions of concentration 1000–5000 ppm to a lab-scale, cylindrical heavy-oil reservoir model at different pressure magnitudes (1.03–3.44 MPa). The objective is rationalized through a scaled mathematical model and by numerically integrating a set of nonlinear, heterogeneous, and simultaneous partial differential equations describing fluid saturations, pressure, and polymer concentration, respectively, in a 1D two-phase flow of polymeric solutions across a porous media. Finally, the model-predicted results are validated by the obtained core flooding experimental mass. Furthermore, a computer program has been developed in C++ environment to perform calculations and solve water-phase saturation, pressure, and concentration equations in cylindrical coordinates. The model can be applied to predict oil recovery of other core flooding conditions. It is noteworthy that the proposed model and computational interface is quite simple and cost-effective for one-dimensional polymer flooding experimental investigations in both lab-scale and commercial-scale applications. Additionally, the oil recoveries are also successfully verified by comparison with both the commercial reservoir simulator (CMG) and experimental data. Moreover, the extended predictive control strategy with an introduction of new PI controller tuning scheme using the closed-loop data developed by Yadav et al.30 can be implemented to depict the efficiency of the controller (pressure controller) with an integration of the developed pressure equation under process uncertainty and compared to other well-developed control schemes.
2. Mathematical Modeling
The flow of polymeric solution in porous media is considered to be a complex phenomenon; therefore, the development of a detailed mathematical model is a prerequisite for depicting the physics of the process in the lab-scale replica. Polymer transport in porous media is subjected to many particular effects such as non-Newtonian fluid flow, adsorption, inaccessible pore volume, polymer retention, residual resistance factor, permeability reduction factor, and the effect of polymer concentration and shear rate on polymer solution viscosity. The aforementioned parameters are coupled together in a differential framework to evaluate the efficacy of a polymer flooding project in one-dimensional injection experiments across a porous media. The mathematical model comprising the oleic and aqueous phase saturation and pressure and polymer concentration mass balance is analyzed in a cylindrical differential element of thickness Δz (along the z-direction). During the development of the mathematical model, the following set of assumptions are made:
-
(1)
Fluid flow is isothermal and energy exchange is neglected.
-
(2)
Liquids are nonvolatile, and there are only two fluid phases (oleic and aqueous) with three species involved throughout the process (oil, water, and polymer).
-
(3)
The heavy oil is insoluble in polymer solution, and thermal equilibrium exists between oleic and aqueous phases.
-
(4)
No chemical and biological reaction takes place between the species.
-
(5)
Adsorption of polymer flooding takes place on the solid matrix inside the cylindrical core, resulting from the bulk flow and dispersion mechanism of the mass transport.
-
(6)
The bulk flow is along the z-direction, and the same is governed by Darcy’s law in a porous medium.
-
(7)
Bulk flow (due to diffusion) across the radial direction is neglected.
-
(8)
The density of the heavy oil is constant throughout the process.
-
(9)
The porous media has uniform porosity and permeability. Thus, gravity and capillary pressure effects are negligible.
Based on these assumptions, the conservation of mass equations and Darcy’s law for each component can be written as
Aqueous Phase Equation
 |
1 |
Oil Phase Equation
| 2 |
Pressure Equation
 |
3 |
Polymer Concentration Equation
 |
4 |
3. Empirical Correlations and Parameters of Model
3.1. Effect of Polymer Concentration on Solution Viscosity
We considered the Flory–Huggins equation, which describes the polymeric solution viscosity as a function of polymer concentration at zero shear rate. Polymeric solutions behave as a non-Newtonian fluid when flowing through a porous media, and their rheological behavior is characterized by a Newtonian plateau at lower shear rates. The apparent viscosity of the polymeric solution depending on polymer concentration is given as
| 5 |
3.2. Permeability Reduction
The viscoelastic flow of polymeric solutions through a porous media has a strong relationship with its retention on a rock surface. This is mainly due to the polymer adsorption, hydrodynamic retention, and mechanical entrapment.31 Adsorption of polymer causes the permeability reduction of aqueous phase. Permeability reduction factor (Rk) is often defined as the ratio of rock permeability when water flows to the rock permeability when polymer solution flows through porous media.32 This phenomenon is easily observed during lab-scale injection experiments as the pressure gradient of the postflush water increases relative to the preflush water. In this study, eq 6 was implemented to predict permeability reduction factor and was represented by the following expression13
| 6 |
3.3. Inaccessible Pore Volume
During core flooding, a fraction of pore volume that cannot be accessed by polymer molecules due to the difference in their molecular sizes and pore sizes is termed as inaccessible pore volume. It ranges between 1 and 30% of pore volume depending on the size distribution of rock and polymer. Laboratory-scale investigations indicate that it is relatively greater than adsorption loss. Manichand and Seright31 collected experimental data about inaccessible pore volume and concluded that there is no relationship between permeability and inaccessible pore volume. In this study, we assume inaccessible pore volume to be constant and was modeled by eq 7
| 7 |
4. Scaling Analysis on Mathematical Model
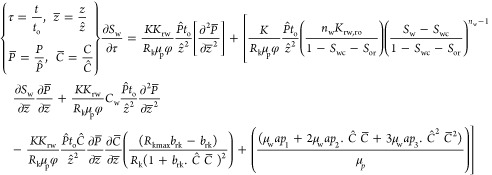
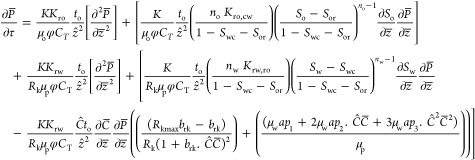
Scaling of mathematical model is very essential to eliminate relatively least significant terms from a mathematical statement. Scaling of a process model has numerous advantages, and it involves the chain rule for differentiation to simplify the associated equations. With the help of scaling, one can easily transform the dimensional variables and parameters of the real process model into its corresponding nondimensional form. Due to the proper scaling of equations, it is easy to understand which terms are effectively contributing to the process and which are less significant. In this way, size and intricacy of the original model get reduced. The scaled version of the mathematical model is given below:
Scaled Aqueous Phase Equation
 |
8 |
Here, z̅ is the dimensionless axial coordinate, P̅ is the dimensionless pressure, τ is the dimensionless time, and C̅ is the dimensionless concentration.
Scaled Oil Phase Equation
| 9 |
Scaled Pressure Equation
 |
10 |
Scaled Polymer Concentration Equation
 |
11 |
5. Discretized Mathematical Model
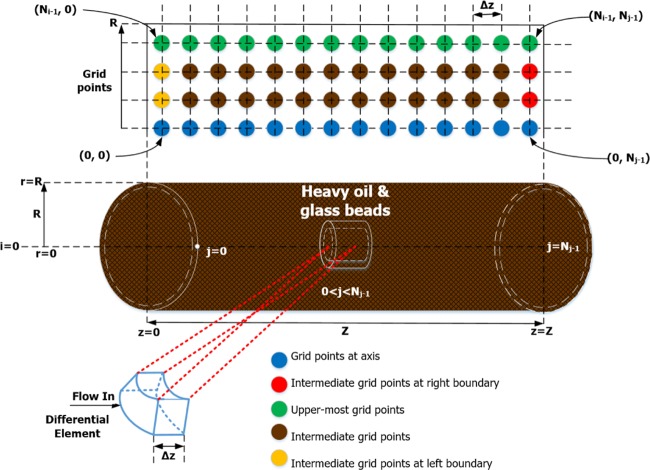
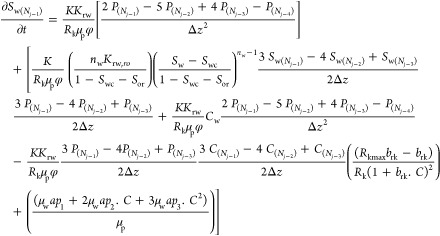
The above-mathematical model consists of a set of nonlinear, heterogeneous, and simultaneous partial differential equations that cannot be solved analytically or by manual calculations. In this study, the problem is simplified numerically using the finite difference method. We implement the second-order high-accuracy central and backward finite-divided-difference formula along the z-direction that results in the discretization of the partial differential equations into ordinary differential equations with respect to time (as the only associated independent variable). With Nj grid points along the z-direction shown in Figure 1, the discretized finite-differenced ordinary differential equations are as follows:
Figure 1.
Physical reservoir model with differential element and the arrangement of grid points.
5.1. Finite Difference for Conversion of PDE to ODE for Oleic Phase Equation
The oleic phase equation is discretized by the central and backward finite-divided-difference formula for the conversion of PDE to ODE in a cylindrical porous media.
For Intermediate Grid Points:
For 0 < j < (Nj–1)
 |
12 |
For Axis Grid Points:
when j = 0
 |
13 |
when j = (Nj–1)
 |
14 |
5.2. Finite Difference for Conversion of PDE to ODE for Aqueous Phase Equation
The aqueous phase equation is discretized by the central and backward finite-divided-difference formula for the conversion of PDE to ODE in a cylindrical porous media
For Intermediate Grid Points:
For 0 < j < (Nj–1)
 |
15 |
For Axis Grid Points:
When j = 0
 |
16 |
When j = (Nj–1)
 |
17 |
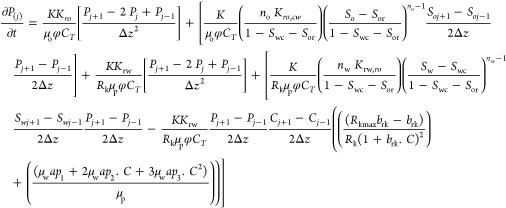
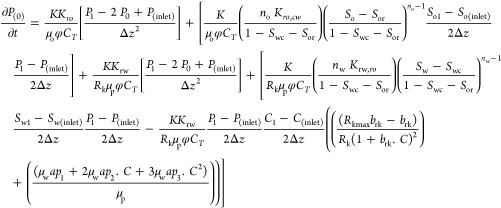
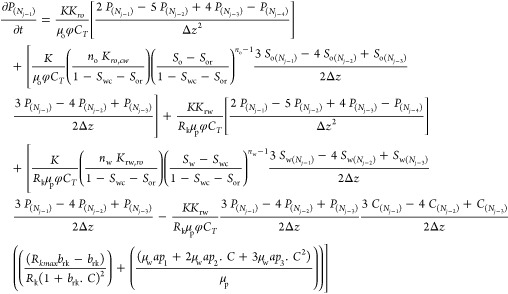
5.3. Finite Difference for Conversion of PDE to ODE for Pressure Equation
The pressure equation is discretized by the central and backward finite-divided-difference formula for the conversion of PDE to ODE in a cylindrical porous media.
For Intermediate Grid Points:
For 0 < j < (Nj–1)
 |
18 |
For Axis Grid Points:
When j = 0
 |
19 |
When j = (Nj–1)
 |
20 |
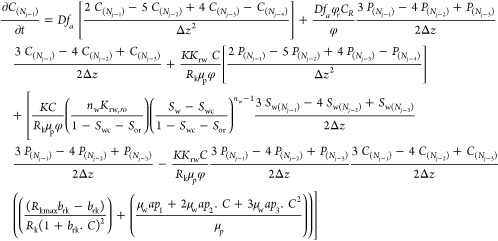
5.4. Finite Difference for Conversion of PDE to ODE for Polymer Concentration Equation
The polymer concentration equation is discretized by the central and backward finite-divided-difference formula for the conversion of PDE to ODE in a cylindrical porous media.
For Intermediate Grid Points:
For 0 < j < (Nj–1)
 |
21 |
For Axis Grid Points:
When j = 0
 |
22 |
When j = (Nj–1)
 |
23 |
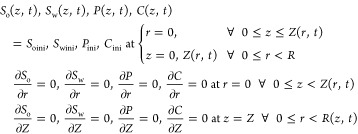
where P(t, z), Sw(t, z), So(t, z), and C(t, z) represent, respectively, the pressure, oil and aqueous phase saturation, and concentration of the polymer solution, which is a function of time and length of the porous media. K is the absolute permeability of the porous medium, Kro is the oil relative permeability, Krw is the water relative permeability, φ is the porosity of the porous media, and μo is the viscosity of the heavy oil. The bulk flow of polymer solution along the z-direction is governed by the Darcy velocity. D is the diffusion coefficient of the solvent in the porous medium and is negligible along the radial direction. Initially, there is no polymer solution injection inside the cylindrical core and heavy-oil production so that the initial length of the cylindrical core is z = 0 = zo. Thus, the initial condition at t = 0 is given below
| 24 |
The boundary conditions at t ≥ 0 are
 |
25 |
6. Results and Discussion
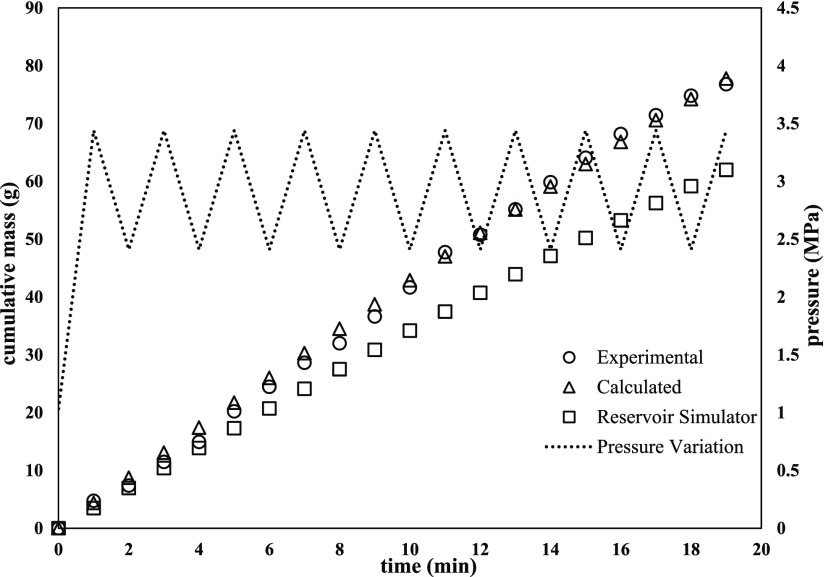
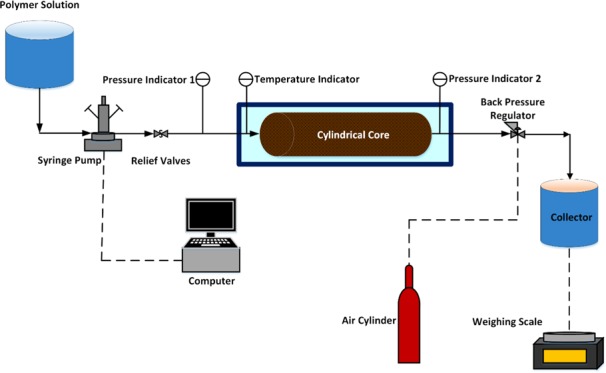
The performance of polymer flooding process and the effects of pressure variations on heavy-oil recovery process were evaluated in a homogeneous glass beads-packed physical model. For this study, experimental investigations were carried out with polymer solutions of concentrations 1000–5000 ppm at (i) constant pressure of 3.44 MPa and with (ii) time-varying pressure in the range of 1.03–3.44 MPa. For variable-pressure experiments, the injection pressure was originally set at 1.03 MPa and was increased to the maximum pressure of 3.44 MPa until the oil breakthrough. Once the oil breakthrough occurred, the temporal pressure variation was performed between 3.44 and 2.41 MPa at intervals of 1 min, using a syringe pump. All set of experiments were conducted at the room temperature of 23 ± 0.2 °C.
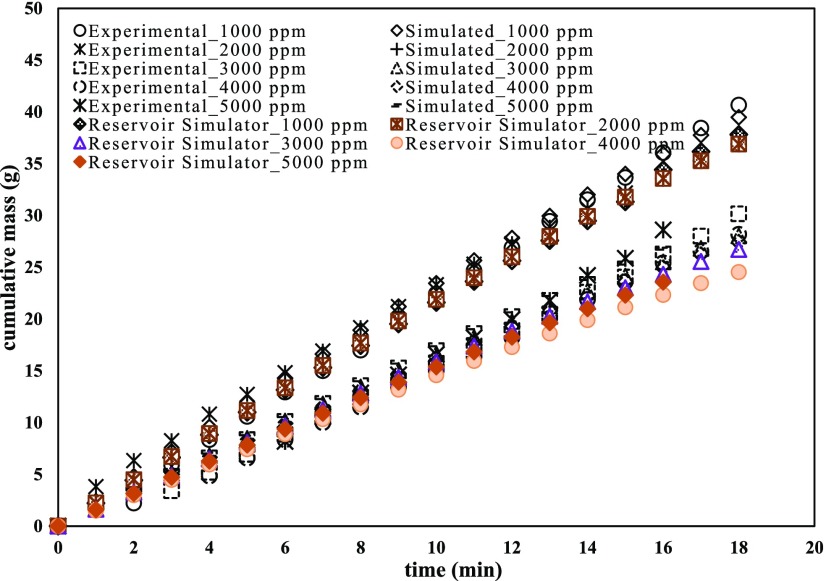
This section focuses on comparing the experimentally recovered mass of oil with the model and commercial reservoir simulator (CMG)-predicted value of oil production. The experiments consisted of five sequential injections of different concentration polymer solutions in an initially oil saturated medium. Based on the results obtained in Figure 2, it can be observed that the oil recovery exhibits a declining trend upon increasing polymer solution concentration at a maximum constant pressure of 3.44 MPa. It was also observed that the polymer solution was seeped out of the physical model prior to the oil recovery. The high injection pressure causes the compactness of the pore spaces inside the porous media. This forms a narrower path for the polymer solution to flow freely and leads to the lower oil recovery. A higher concentration of the polymer solution is directly proportional to the viscosity, and when these highly viscous displacing fluids pass through the porous media, they exhibit a shear thinning behavior due to the coil-stretched transitions of polymer chains. These polymer chain coils deform when they pass through the narrow pore spaces and lose their tendency to push more oil, resulting in poor sweep efficiency even at the maximum constant pressure of 3.44 MPa. Additionally, the higher-concentration solutions witnessed greater pressure drops during the flooding experiments compared to the ones with lower viscosity. Higher pressure drops indicate that there is greater resistance to flow due to an increase in the apparent viscosity, above that expected compared to a purely viscous fluid. This increase in flow resistance is referred to as an extension-thickening effect. Furthermore, the glass beads (monodisperse) packed bed was utilized in the flooding experiments. The level of heterogeneity in the packed bed was very small, which led to a minimal oil recovery. Even if the unequal heterogeneities would have been overcome, there would still be an insignificant change in enhanced oil recovery. Final cumulative oil production ranges from 41 to 29 g with polymer concentration ranging from 1000 to 5000 ppm. Moreover, to scrutinize the cumulative impact of periodic pressure variation with different concentrations of polymer solutions, we performed experiments by injecting the polymeric solution at different concentrations ranging between 1000 and 5000 ppm and with periodic variation of the solution injection pressure between 2.41 and 3.44 MPa. The overall increase in heavy-oil recovery with a periodic pressure variation may be attributed to the sudden change in the injection pressure of the displacing fluid within the physical reservoir model, resulting in altering the fluid velocity as the polymer solution passes through the porous media. As the polymer solution passes through the small pore areas, the velocity increases due to the periodic variations, causing a decrease in the static pressure, thereby leading to higher oil recovery. Furthermore, the periodic pressure variation can give higher oil recoveries through the viscoelastic effect. The flow of viscoelastic polymer through a packed bed can exhibit a rapid increase in the pressure drop due to the increase in apparent polymer viscosity. This increase in pressure drop has been attributed to the extensional nature of polymer flow through porous media caused by the successive expansions and contractions in the flow channels. The periodic pressure variations caused sudden expansion and contraction that the polymer chain experienced when passed through the pore throats. The pressure pulses cause the polymer to transfer the energy to the trapped oil and “snap” the oil out of the pore throats, thereby leading to a better sweep efficiency. It further creates increased pressure gradients within the porous media that provides the necessary force to keep the portion of the flow channel open, thereby leading to the incremental oil recovery. The trends in the collected data indicated that cumulative oil recovery can be improved by increasing the polymer concentration as well as increasing the injection pressure of the polymer. In comparison to the maximum constant pressure, periodic pressure variations enhanced oil recovery more than 100% with a final value of 77–58 g with polymer concentrations ranging from 1000 to 5000 ppm.
Figure 2.
Comparison of experimental, model-predicted, and numerically simulated (commercial reservoir simulator, CMG) oil recoveries using 1000–5000 ppm polymer concentration solution at a constant injection pressure of 3.44 MPa.
The computation was performed for the physical model of 1.5 D with respect to heavy oil. Equations 8–11 were solved simultaneously at the (j) node corresponding to the z coordinate, to obtain the calculated mass of produced oil. Equations were numerically integrated using adaptive step-size control, and the analytical jacobians of the above-mentioned equations were employed for integration. The algorithm was programmed to generate calculated mass (mcalculated) at the experimental time instants for a direct comparison with its experimental counterpart, (mexperimental). The computational algorithm was programmed in C++ interface and was executed on Itanium quad processor (64 bit, 1.5 GHz, 15.9 GB of RAM). The input parameters used in the extensive simulation study of the mathematical model of polymer flooding are presented in Table 1. With the utilization of the listed parameter values in the mathematical model, simulation profiles depicted that predicted oil production follows experimental oil recovery very close during the operation time of 18 min for a maximum constant pressure of 3.44 MPa as well as with periodic pressure variations between 2.41 and 3.44 MPa by varying FLOPAAM 3630s concentration in the range of 1000–5000 ppm. Root-mean-square error values were obtained by solving the scaled eqs 8–11 with various values of polymer solution concentration and with different pressure magnitudes used in this study. Figure 2 effectively illustrates the experimental and model-predicted cumulative mass of oil recovered (g) with respect to time (min) at a maximum constant pressure of 3.44 MPa. It can be further analyzed that the root-mean-square error (RMSE) was estimated to be in the range of 1.1683–1.318. In comparison, the RMSE between the experimental and commercial reservoir simulator (CMG) was calculated to be in the span of 1.51–2.36 at a constant maximum pressure of 3.44 MPa. The close agreement between the experimental, model-predicted, and CMG-predicted oil production values attests to the accuracy of the pressure variations and increasing concentration used in this work, as given in Table 2.
Table 1. Input Data for Integrated Mathematical Model for Polymer Flooding.
| parameter | value | parameter | value |
|---|---|---|---|
| Nj | 8 | brk | 0.2 |
| φ | 0.38 | Rkmax | 1.15 |
| K | 1.41e–10 | μw | 0.458e–4 |
| μo (Pa s) | 14.5 | ap1 | 15.426 |
| ρoil (kg/m3) | 977 | ap2 | 0.4228 |
| So | 0.743 | ap3 | 0.2749 |
| Sw | 0.257 | CT (1/Pa) | 4.8e–12 |
| Z (m) | 0.3 | D (m2/s) | 5e–12 |
| R (m) | 0.125 | fa | 1 |
| A (m2) | 4.9e–4 | Bw | 1 |
| Kro | 0.66 | a | 30 |
| no | 2 | b | 3800 |
| Krocw | 0.9 | ρr (kg/m3) | 2720 |
| Swc | 0.22 | Cfw (1/Pa) | 1.22e–11 |
| Sor | 0.25 | Ccap | 1, 2, 3, 4, 5 |
| Co | 5e–12 | Crp (1/Pa) | 1.57e–11 |
| Krw | 1.017e–3 | CR (1/Pa) | 9.38e–12 |
| Rk | 1.016 | nw | 2.3447 |
Table 2. Experimental and Calculated Oil Production at a Constant Injection Pressure of 3.44 MPa versus Time.
| oil production
(g) |
|||||
|---|---|---|---|---|---|
| polymer concentration (ppm) | experimental | calculated | numerical software | RMSE | relative error (%) |
| 1000 | 40.66 | 39.47 | 37.81 | 1.257 | 2.91 |
| 2000 | 37.07 | 36.89 | 34.53 | 1.274 | 0.49 |
| 3000 | 30.15 | 28.03 | 26.71 | 1.168 | 7.03 |
| 4000 | 28.17 | 27.41 | 24.53 | 1.218 | 2.70 |
| 5000 | 28.60 | 26.81 | 23.56 | 1.318 | 6.16 |
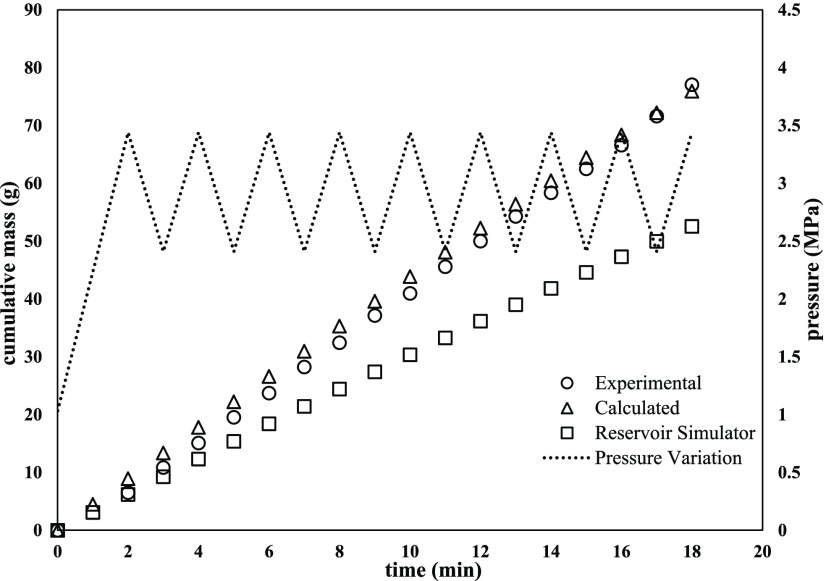
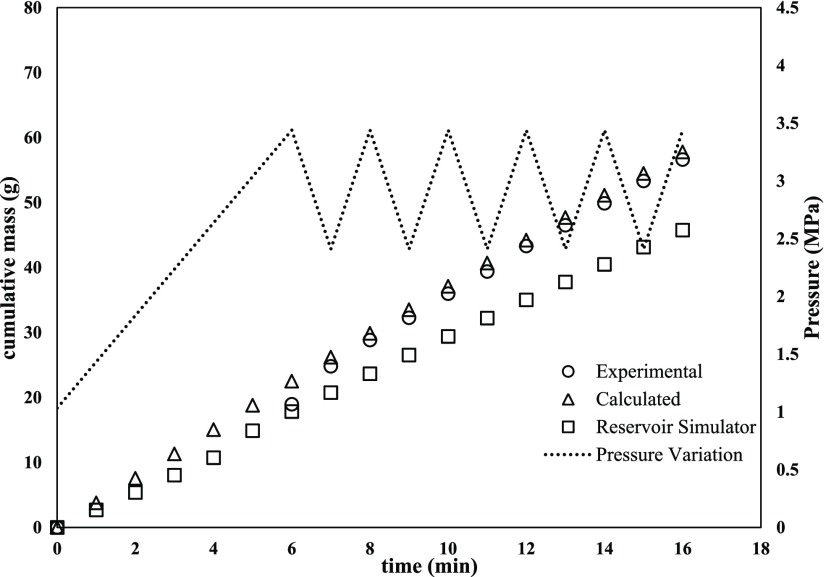
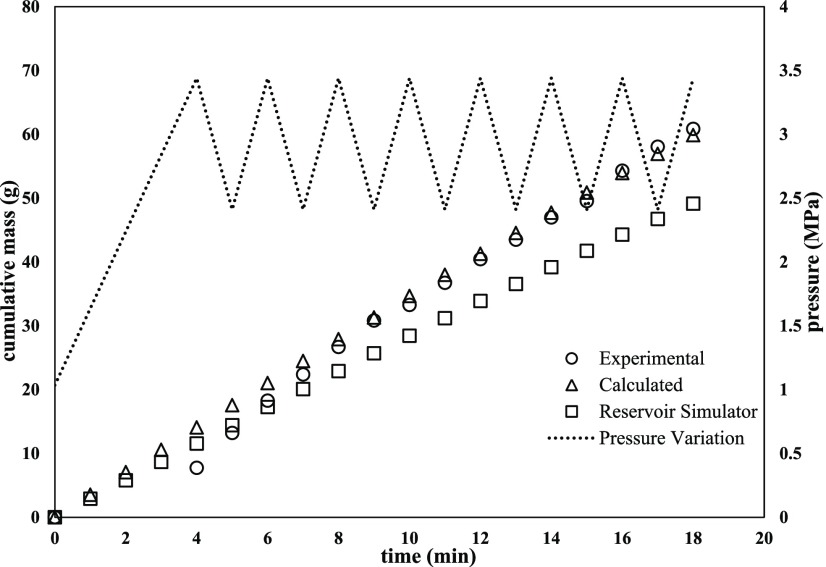
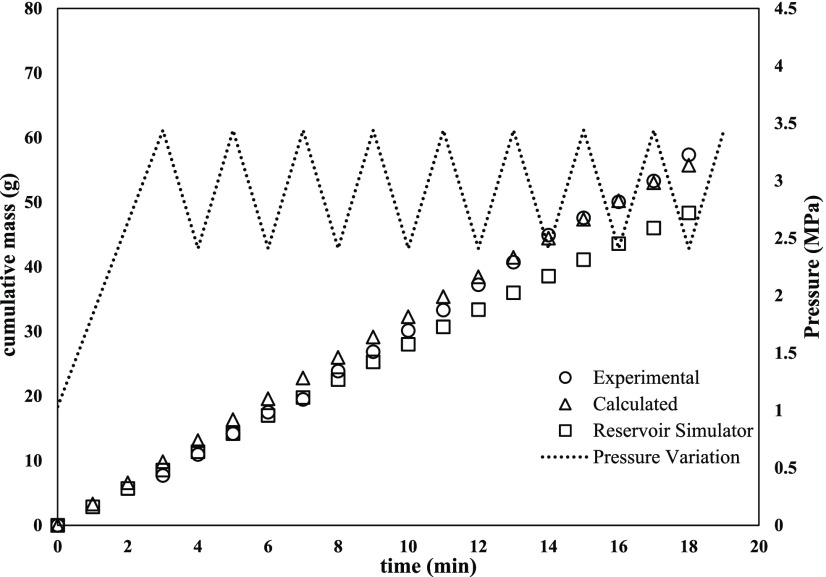
In contrast to the constant injection pressure, it can be analyzed from Figures 3–7 that the oil production increased monotonically from 40 g to the maximum of 77 g. The improvement was significant with increasing polymer concentration and with periodic pressure variation between 2.41 and 3.44 MPa. The deviation values (RMSE and % relative error) are shown in Table 3, which corroborates the accuracy of prediction even with periodic pressure variations. In these studies, the incremental oil recoveries with periodic pressure variations may be attributed to the sudden change in the injection pressure for a short time duration (or blips) within the physical reservoir model. Each such blip in pressure results in altering the fluid velocity as the polymer solution passes through the porous media. Due to the periodic variations, the velocity of the polymer solution increases as they pass through small pore areas, which eventually gets reflected in a higher oil recovery. Additionally, the periodic pressure variation can lead to higher oil recovery through the viscoelastic effect or in the process of viscoelastic polymer injection. The applicability of the proposed numerical model was validated to ensure consistent numerical results before being used to predict the oil production through comparison with core flooding experiments. The system of discretized differential equations was solved using the Runge–Kutta–Fehlberg explicit integration technique with an improved error estimation of O(h5). For the accuracy and stability of this numerical method, the time step was selected to be 0.5 s.32,33
Figure 3.
Comparison of experimental, mathematical model-predicted, and commercial reservoir-simulated (CMG) oil recoveries using 1000 ppm polymer concentration solution with varying injection pressure in the range of 1.03–3.44 MPa.
Figure 7.
Comparison of experimental, mathematical model-predicted, and commercial reservoir-simulated (CMG) oil recoveries using 5000 ppm polymer concentration solution with temporal injection pressure variation in the range of 1.03–3.44 MPa.
Table 3. Experimental and Calculated Oil Production with Time-Varying Injection Pressure between 3.44 and 2.41 MPa versus Time.
| oil production (g) |
|||||
|---|---|---|---|---|---|
| polymer concentration (ppm) | experimental | calculated | numerical software | RMSE | relative error (%) |
| 1000 | 77.05 | 75.90 | 52.54 | 2.347 | 1.46 |
| 2000 | 76.80 | 77.76 | 61.98 | 1.381 | 3.89 |
| 3000 | 60.85 | 59.85 | 49.14 | 2.343 | 1.63 |
| 4000 | 57.34 | 55.72 | 48.36 | 2.375 | 2.82 |
| 5000 | 56.62 | 57.78 | 45.76 | 1.552 | 2.05 |
Figure 4.
Comparison of experimental, mathematical model-predicted, and commercial reservoir-simulated (CMG) oil recoveries using 2000 ppm polymer concentration solution with varying injection pressure in the range of 1.03–3.44 MPa.
Figure 5.
Comparison of experimental, mathematical model-predicted, and commercial reservoir-simulated (CMG) oil recoveries using 3000 ppm polymer concentration solution with time-varying injection pressure in the range of 1.03–3.44 MPa.
Figure 6.
Comparison of experimental, mathematical model-predicted, and commercial reservoir-simulated (CMG) oil recoveries using 4000 ppm polymer concentration solution with temporal injection pressure varying in the range of 1.03–3.44 MPa.
Finally, the notion of sensitivity analysis was also introduced to investigate the robustness of the prescribed mathematical model in the presence of disparity in the magnitudes of the associated parameters. The effect of implementing 5% variation in the magnitudes of permeability, porosity, density, diffusion coefficient, and number of grid points was analyzed at a time by keeping others constant with respect to the original computation geometry. The basis for selecting these parameters was invoked from the assumptions of considering permeability, porosity, density, and diffusion coefficient constant while developing the mathematical model. On the other hand, number of grid points for the simulation study was adjusted from the user end with the objective of enhancing the accuracy in simulation profile as well as minimizing the computation time. Additionally, the perceptions of root-mean-square error (RMSE) and mean absolute percentage error (MAPE) served to aggregate the magnitudes of the errors in predictions at different points of time. RMSE was evaluated using the following formula
Similarly, MAPE was estimated using the following relation
where Xobs,i = experimental values and Xmodel,i = model-predicted values at the ith point of time. Table 3 depicts the impact of parameter variation on model-predicted final mass of oil and deviations in the simulation profile with respect to theoretically calculated values of RMSE and MAPE.
For a +5% deviation in permeability and porosity, there is no significant change in the final value of the recovered mass, as Table 4 shows 0.805% deviation with respect to the originally obtained mass compared to actual value under the prevailing conditions of pressure and temperature. Similarly, a −5% variation in density does not reflect major deviation (0.1449%) in the final recovered mass. On the other hand, a −5% variation in permeability, porosity, and diffusion coefficient and a +5% deviation in density register relatively greater deviation with respect to the final actual value of recovered mass; as the deviations are within 15% of the original profile, the model can be considered as highly applicable when simulated with respect to similar input conditions. Therefore, it can be concluded that the mathematical model is less sensitive toward the variations in the parameter values and assumptions of treating the same as constant can be accepted with a 95% confidence level.
Table 4. Sensitivity Analysis by Variation in Parameters.
| parameters of interest | original magnitude | induced variation | RMSE | MAPE | % change in final recovered mass |
|---|---|---|---|---|---|
| permeability (K) | 1.41 × 10⁻¹⁰ | +5% | 2.8335 | 10.566 | 0.8053 |
| –5% | 2.2526 | 9.5923 | 4.4536 | ||
| porosity (φ) | 0.38 | +5% | 2.8335 | 13.228 | 0.8053 |
| –5% | 6.1022 | 23.967 | 10.5298 | ||
| density of oil (ρ) | 977 | +5% | 6.1878 | 24.242 | 10.6865 |
| –5% | 2.6572 | 12.432 | 0.1449 | ||
| diffusion coefficient (D) | 5 × 10–12 | +5% | 4.2473 | 18.326 | 5.4157 |
| –5% | 2.3134 | 9.587 | 5.1257 | ||
| number of grid points (Nj) | 8 | 9 | 30.679 | 91.339 | 73.4692 |
| 7 | 13.946 | 31.431 | 37.6258 |
It is also noteworthy that for all of the induced perturbations, the overall fitness of the model is quite impressive as all of these cases register significantly low values of RMSE. For all of them, estimated root-mean-square deviations are significantly less than 10, which essentially validates the suitability of the simulation profile in real-time scaffold. Besides, all of these cases display mean absolute percentage deviation less than 20%, which suffices the suitability of the assumptions under existing state.
Contrarily, a change in the number of grid points (with keeping other parameters at their predefined values) heavily affects the simulation profile. The accuracy of the simulation profile gets diminished as it conveys higher magnitudes of RMSE (30 with 9 grid points and 14 with 7 grid points) and MAPE (91% with 9 grid points and 31% with 7 grid points). Additionally, it delineates a high deviation in the final predicted value of mass of oil (73% with 9 grid points and 37% with 7 grid points). Besides, high computation time and low prediction accuracy in comparison to the experimental profile are recorded when the simulation study is navigated with a higher number of grid points (more than 12). Thus, the selection of eight grid points is quite judicial in the context of deciphering the desired predictive modeling framework with equitable computation time.
7. Conclusions
In this research endeavor, we proposed a mathematical model incorporating coupled effects of polymer concentration on solution viscosity, permeability reduction, and inaccessible pore volume to enhance heavy-oil production in polymer flooding using constant and time-varying injection pressure as well as solvent concentration. A numerical solution of this model can be effectively employed to signify the flow of viscoelastic polymeric solutions in porous media in a lab-scale setup. The proposed mathematical model was able to tally experimentally obtained oil recovery using (1000–5000 ppm) polymer concentration, maximum constant injection pressure of 3.44 MPa, and with periodic pressure variations between 2.41 and 3.44 MPa. The model-predicted, maximized oil production yielded by the computational algorithm displayed a root-mean-square error (RMSE) in the range of 1.257–1.318 at a constant injection pressure of 3.44 MPa. On the other hand, root-mean-square error with periodic pressure variations was in the span of 1.381–2.375. Additionally, we have also successfully verified the experimental oil production with the commercial reservoir simulator (CMG) both at maximum constant pressure and with temporal pressure variation. Moreover, we performed a thorough sensitivity investigation using the scaled numerical model on important input parameters such as permeability, porosity, diffusion coefficient of polymer, number of grid points, and heavy-oil density. The sensitivity results underscore the level of uncertainty equitable for these input parameters and the overall confidence in this mathematical model and simulation study. Numerical results were extremely sensitive to the number of grid points along the axial direction (z-direction). Overall, mathematical model, computational algorithm, and simulation results indicate that solvent injection pressure (maximum constant pressure and periodic pressure variations between 2.41–3.44 MPa) has considerable potential to enhance heavy-oil recovery in a laboratory-scale polymer flooding project.
Acknowledgments
The author would like to acknowledge the Department of Chemical Engineering, Ryerson University, for providing the experimental facility.
Glossary
Nomenclature and Units
- K
absolute permeability of the medium, m2
- Kro
oil relative permeability
- Krw
water relative permeability
- Rk
permeability reduction factor
- μp
viscosity of polymer, Pa s
- φ
porosity of the media
- nw
index of water relative permeability (dimensionless)
- Krwro
oil relative permeability at irreducible water saturation
- Sor
residual oil saturation (fraction)
- Swc
residual water saturation (fraction)
- Sw
water saturation
- Cw
compressibility factor of water, 1/Pa
- Rkmax
permeability reduction parameter
- brk
permeability reduction parameter
- μw
viscosity of aqueous solution, Pa s
- ap1
viscosity parameter
- ap2
viscosity parameter
- ap3
viscosity parameter
- μo
viscosity of oil, Pa s
- no
index of oil relative permeability
- Krocw
water relative permeability at residual oil saturation
- So
oil saturation
- Co
compressibility factor of oil, 1/Pa
- CT
total compressibility, 1/Pa
- D
diffusion coefficient of polymer in free solution, m2/s
- fa
effective pore volume coefficient
- φr
porosity under the condition of reference pressure
- CR
compressibility factor of rock, 1/Pa
- C
polymer concentration
- P
injection pressure, MPa
- to
scaled time, s
- Z
length of the cylindrical core, m
The author declares no competing financial interest.
References
- Lyons W. C.; Plisga G. J.. Standard Handbook of Petroleum and Natural Gas Engineering; Gulf Professional Publishing, Elsevier, 2011; pp 64–69. [Google Scholar]
- Mai A.; Bryan J.; Goodarzi N.; Kantzas A. Insights into non-thermal recovery of heavy oil. J. Can. Pet. Technol. 2009, 48, 27–35. 10.2118/09-03-27. [DOI] [Google Scholar]
- Wang D.; Hao Y.; Delamaide E.; Ye Z.; Ha S.; Jiang X. In Results of Two Polymer Flooding Pilots in the Central Area of Daqing Oil Field. SPE Annual Technical Conference and Exhibition, Society of Petroleum Engineers, 1993; pp 3–5.
- Heimsund B. O.Mathematical and Numerical Methods for Reservoir Fluid Flow Simulation. Doctor Scientiarum Thesis, Department of Mathematics, University of Bergen: Marth, 2005. [Google Scholar]
- Green D. W.; Willhite G. P.. Enhanced Oil Recovery; Henry L. Doherty Memorial Fund of AIME; Society of Petroleum Engineers: Richardson, TX, 1998. [Google Scholar]
- Sheng J.Modern Chemical Enhanced Oil Recovery: Theory and Practice; Gulf Professional Publishing, 2010; pp 47–55. [Google Scholar]
- Sorbie K. S.Polymer-Improved Oil Recovery; Blackie and Son Ltd.: Glasgow, London, 1991. [Google Scholar]
- Alsofi A.; Blunt M. In The Design and Optimization of Polymer Flooding Under Uncertainty. Paper SPE 145110 presented at the SPE Enhanced Oil Recovery Conference; Kuala Lumpur, Malaysia, 2011; pp 19–21.
- Pye D. J. Improved secondary recovery by control of water mobility. J. Pet. Technol. 1964, 16, 911–916. 10.2118/845-PA. [DOI] [Google Scholar]
- Knight B. L.; Rhudy J. S. Recovery of high-viscosity crudes by polymer flooding. J. Can. Pet. Technol. 1977, 16, 13–19. 10.2118/77-04-07. [DOI] [Google Scholar]
- Sandiford B. B. Laboratory and field studies of water floods using polymer solutions to increase oil recoveries. J. Pet. Technol. 1964, 16, 917–922. 10.2118/844-PA. [DOI] [Google Scholar]
- Zhang Z.; Li J.; Zhou J. Microscopic roles of “viscoelasticity” in HPMA polymer flooding for EOR. Transp. Porous Media 2011, 86, 199–214. 10.1007/s11242-010-9616-6. [DOI] [Google Scholar]
- Wang J.; Liu H. A novel model and sensitivity analysis for viscoelastic polymer flooding in offshore oilfield. J. Ind. Eng. Chem. 2014, 20, 656–667. 10.1016/j.jiec.2013.05.030. [DOI] [Google Scholar]
- Li W.; Dong Z.; Sun J.; Schechter D. S. In Polymer-Alternating-Gas Simulation: A Case Study. SPE EOR Conference at Oil and Gas West Asia, 2014.
- AlSofi A. M.; Liu J. S.; Han M.; Aramco S. Numerical simulation of surfactant–polymer core flooding experiments for carbonates. J. Pet. Sci. Eng. 2013, 111, 184–196. 10.1016/j.petrol.2013.09.009. [DOI] [Google Scholar]
- Camilleri D.; Fil A.; Pope G. A.; Rouse B. A.; Sepehrnoori K. Comparison of an improved compositional micellar/polymer simulator with laboratory corefloods. SPE Reservoir Eng. 1987, 2, 441–451. 10.2118/12083-PA. [DOI] [Google Scholar]
- Huh C.; Landis L. H.; Maer N. K. Jr.; McKinney P. H.; Dougherty N. A. In Simulation to Support Interpretation of the Loudon Surfactant Pilot Tests. SPE Annual Technical Conference and Exhibition, Society of Petroleum Engineers, 1990.
- Pandey A.; Suresh Kumar M.; Beliveau D.; Corbishley D. W. In Chemical Flood Simulation of Laboratory Corefloods for the Mangala Field: Generating Parameters for Field-Scale Simulation. SPE Symposium on Improved Oil Recovery, Society of Petroleum Engineers, 2008.
- Mohammadi H.; Delshad M.; Pope G. A. Mechanistic modeling of alkaline/surfactant/polymer floods. SPE Reservoir Eval. Eng. 2009, 12, 518–527. 10.2118/110212-PA. [DOI] [Google Scholar]
- Ferreira V. H. S.; Moreno R. B. Z. L. Modeling and Simulation of Laboratory-Scale Polymer Flooding. Int. J. Eng. Technol. 2016, 16, 24–33. [Google Scholar]
- Satoh T.Treatment of Phase Behavior and Associated Properties Used in a Micellar-Polymer Flood Simulator. Doctoral Dissertation, University of Texas at Austin, 1984. [Google Scholar]
- Saad N.Field Scale Studies with a 3-D Chemical Flooding Simulator; The University of Texas at Austin: Austin, Texas, 1989.
- Bhuyan D.Development of an Alkaline/Surfactant/Polymer Compositional Reservoir Simulator; Texas University: Austin, TX, 1989.
- Goudarzi A.; Delshad M.; Mohanty K. K.; Sepehrnoori K. In Impact of Matrix Block Size on Oil Recovery Response Using Surfactants in Fractured Carbonates. SPE Annual Technical Conference and Exhibition, Society of Petroleum Engineers, 2012.
- Goudarzi A.; Delshad M.; Mohanty K. K.; Sepehrnoori K. Surfactant oil recovery in fractured carbonates: experiments and modeling of different matrix dimensions. J. Pet. Sci. Eng. 2015, 125, 136–145. 10.1016/j.petrol.2014.11.008. [DOI] [Google Scholar]
- Korrani A. K. N.; Sepehrnoori K.; Delshad M. Coupling IPhreeqc with UTCHEM to model reactive flow and transport. Comput. Geosci. 2015, 82, 152–169. 10.1016/j.cageo.2015.06.004. [DOI] [Google Scholar]
- Lashgari H. R.; Sepehrnoori K.; Delshad M. A four-phase chemical/gas model in an implicit-pressure/explicit-concentration reservoir simulator. SPE J. 2016, 21, 1086–1105. 10.2118/173250-PA. [DOI] [Google Scholar]
- Morel D. C.; Jouenne S.; Vert M.; Nahas E. In Polymer Injection in Deep Offshore Field: The Dalia Angola Case. SPE Annual Technical Conference and Exhibition, Society of Petroleum Engineers, 2008.
- Liang K.; Han P.; Chen Q.; Su X.; Feng Y. Comparative Study on Enhancing Oil Recovery under High Temperature and High Salinity: Polysaccharides Versus Synthetic Polymer. ACS Omega 2019, 4, 10620–10628. 10.1021/acsomega.9b00717. [DOI] [PMC free article] [PubMed] [Google Scholar]
- Yadav E. S.; Indiran T.; Priya S. S.; Fedele G. Parameter Estimation and an Extended Predictive-Based Tuning Method for a Lab-Scale Distillation Column. ACS Omega 2019, 4, 21230–21241. 10.1021/acsomega.9b02713. [DOI] [PMC free article] [PubMed] [Google Scholar]
- Manichand R. N.; Seright R. Field vs. laboratory polymer-retention values for a polymer flood in the Tambaredjo field. SPE Reservoir Eval. Eng. 2014, 17, 314–325. 10.2118/169027-PA. [DOI] [Google Scholar]
- Sharafi M. S.; Jamialahmadi M.; Hoseinpour S. A. Modeling of viscoelastic polymer flooding in Core-scale for prediction of oil recovery using numerical approach. J. Mol. Liq. 2018, 250, 295–306. 10.1016/j.molliq.2017.12.002. [DOI] [Google Scholar]
- Chen Z.; Huan G.; Li B. An improved IMPES method for two-phase flow in porous media. Transp. Porous Media 2004, 54, 361–376. 10.1023/B:TIPM.0000003667.86625.15. [DOI] [Google Scholar]


