Abstract
Cells experience physical deformations to the plasma membrane that can modulate cell behaviors like migration. Understanding the molecular basis for how physical cues affect dynamic cellular responses requires new approaches that can physically perturb the plasma membrane with rapid, reversible, subcellular control. Here we present an optogenetic approach based on light-inducible dimerization that alters plasma membrane properties by recruiting cytosolic proteins at high concentrations to a target site. Surprisingly, this polarized accumulation of proteins in a cell induces directional amoeboid migration in the opposite direction. Consistent with known effects of constraining high concentrations of proteins to a membrane in vitro, there is localized curvature and tension decrease in the plasma membrane. Integrin activity, sensitive to mechanical forces, is activated in this region. Localized mechanical activation of integrin with optogenetics allowed simultaneous imaging of the molecular and cellular response, helping uncover a positive feedback loop comprising SFK- and ERK-dependent RhoA activation, actomyosin contractility, rearward membrane flow, and membrane tension decrease underlying this mode of cell migration.
Keywords: optogenetics, membrane tension, mechanotransduction, integrin, amoeboid migration
Graphical Abstract
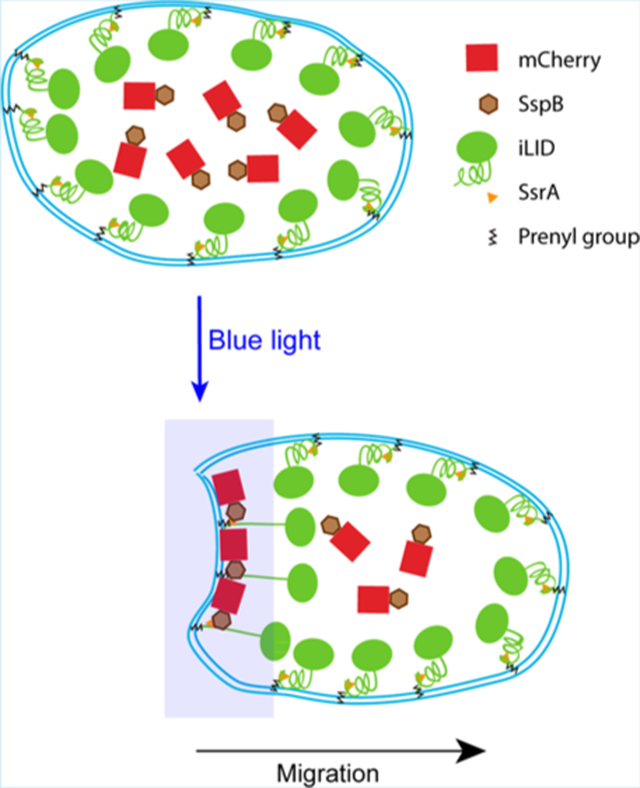
Important cell behaviors such as migration and adhesion are modulated by mechanical forces.1 The molecular mechanisms that govern this migration are not entirely clear. One of the ways mechanical forces can alter cellular behavior is through alterations of the physical properties of the plasma membrane.2–4 To decipher the molecular basis of how cells respond to mechanical forces, it is useful to develop methods to experimentally alter the properties of the plasma membrane and measure cellular responses.
Traditional methods for experimentally altering physical properties of the plasma membrane in living cells, such as osmotic buffers5,6 or substrates of varying stiffness and topographies,7,8 often lack subcellular precision and reversibility. Other methods, such as micropipette aspiration or tether pulling via optical tweezers or atomic force microscopy,9,10 are difficult to apply continually while observing responses that are dynamic in behavior, like cell migration that involves cell dislocation and shape changes. A rapidly reversible noninvasive method that can alter plasma membrane properties can be advantageous.
Optogenetic approaches have the advantage of being noninvasive and rapidly reversible. In recent years, the development of optogenetic tools has facilitated the inter-rogation of cell migration without introducing mutated signaling proteins but by recruiting native proteins at the subcellular level.11–17 In this work, we use an improved light-inducible dimer (iLID) system17 to optically recruit cytosolic proteins at high densities to localized regions of the plasma membrane, which exerts forces on the plasma membrane at the subcellular level. It has been shown in vitro that high concentrations of proteins with no known regulatory function such as green fluorescent protein (GFP) can alter membrane properties such as curvature and tension with effects on cellular processes such as endocytosis, protein sorting, and enzyme activation.18–22 Here we utilize this phenomenon in vivo to alter plasma membrane tension and curvature in a localized area of the cell through recruitment of cytosolic fluorescent proteins with no regulatory properties to the plasma membrane.
The optogenetic method presented here allows for physical properties of the plasma membrane to be manipulated with subcellular precision and fine temporal control. Surprisingly, we found that localized accumulation of proteins on one side of the plasma membrane generates directional migration in the opposite direction in macrophage cells. This mode of migration resembles RhoA-mediated amoeboid movement that lacks lamellipodia, with the cell maintaining a rounded morphology and cytoskeletal proteins, plasma membrane, and endocytosis polarized to the cell rear.14,23–25
Optogenetically localizing protein accumulation at the plasma membrane leads to altered physical properties. Polarization of a membrane tension sensor and markers of endocytosis suggest lowered tension and increased membrane curvature at the site of activation. Consistent with integrin activation by mechanical forces,26–28 optically directed protein accumulation leads to localized integrin β1 activation. It is known that integrins modulate cell migration.28–30 The optogenetic approach presented here allowed us to specifically investigate the effect of localized mechanical integrin activation on migration. We found that polarized mechanical integrin activation is sufficient to generate directional migration. Perturbation of specific signaling proteins helped identify components downstream of integrin. The ability to achieve dynamic optical control over mechanically induced migration sheds light on the mechanism that underlies this mode of cell migration.
RESULTS AND DISCUSSION
We use an improved light-induced dimerization system (iLID) to optically recruit proteins to one side of RAW 264.7 macrophage cells. iLID consists of the bacterial peptide SsrA embedded in the C-terminal helix of the light-oxygen-voltage 2 (LOV2-Jα) domain of prototropin 1. SsrA has high affinity for the protein SspB, but is sterically inaccessible for binding in the dark state. Exposure to blue light causes the Jα helix to unfold, exposing SsrA and allowing it to bind to SspB.17 Fusing iLID to the C-terminal domain of the protein K-Ras (KRasCT), which contains the CaaX sequence, allows for post-translational prenylation and the targeting of iLID to the plasma membrane.31 Transfecting cells with iLID-KRasCT along with SspB fused to a protein of interest thus enables us to recruit the protein of interest to the plasma membrane with blue light (Figure 1A).
Figure 1.
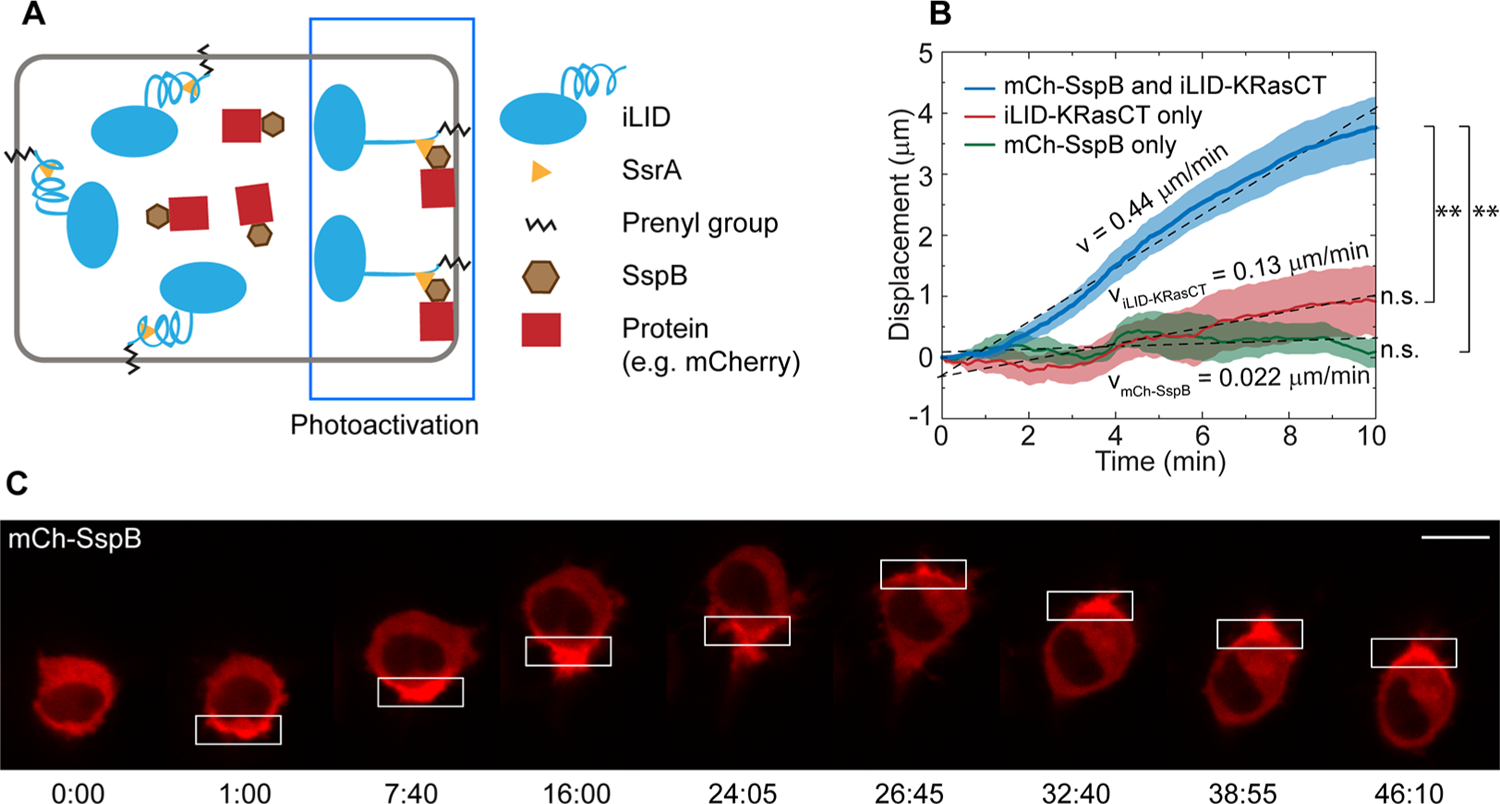
Localized protein accumulation at the plasma membrane leads to cell migration. (A) Diagram of the iLID system. Exposure to blue light induces a conformational change in membrane-associated iLID, allowing cytosolic SspB to dimerize to SsrA, thereby recruiting SspB-associated proteins to the plasma membrane. (B) Speed of cell migration as a result of polarized protein accumulation. Cells were transfected with mCh-SspB and iLID-KRasCT (blue curve, n = 40). Cells transfected with iLID-KRasCT alone (red curve, n = 11) and mCh-SspB alone (green curve, n = 8) were used as negative controls. The displacement was measured by tracking the rear of the migrating cell over time. Solid lines represent the mean and shaded regions are SEM. **p < 0.01, two-sample t test; n.s., not significant, one-sample t test (mean = 0). (C) RAW cell migration in response to localized protein accumulation. Cell is transfected with mCh-SspB (red) and iLID-KRasCT. Rectangle represents the area of photoactivation. Scale bar is 10 μm. Time is in min:sec.
We had earlier reported that optically directing a RhoA GEF, LARG, tagged with the fluorescent protein mCherry (mCh) and SspB to a localized region of the plasma membrane induces rapid and consistent cell migration in the opposite direction.14 In control experiments, mCh-SspB expressed without LARG at similar expression levels has no effect when recruited locally to the plasma membrane. However, we find that if the mCh-SspB construct is considerably overexpressed and recruited at a high concentration to a region of the plasma membrane, 27 out of 40 cells migrate in the opposite direction (Figure 1C and Movie S1).14 The remaining 13 cells do not exhibit directional migration. The direction of cell migration reverses rapidly with reversal of photoactivation side. In cells where polarized accumulation of mCh is observed, the average migration speed is 0.44 μm/min (Figure 1B) in contrast to 1.0 μm/min with LARG-mCh-SspB.14 Cell migration speed was determined by tracking the displacement of the cell rear using a previously described algorithm.14 To eliminate the possibility that the migration is simply due to cell retraction in response to high intensity laser light or cytotoxicity caused by components of the iLID system, we locally photoactivated cells transfected with mCh-SspB or iLID-KRasCT alone. This does not yield directional movement (Figure 1B), nor does photoactivation of untransfected cells (Movie S2), confirming that asymmetric protein accumulation is triggering the migration.
The 68% migration response rate mentioned above is likely due to cell-to-cell variations in the amount of mCh-SspB caused by transient transfections, which subsequently leads to variations in the ratio of mCh-SspB to iLID-KRasCT. To quantify the amount of mCh-SspB required to induce sufficiently polarized protein accumulation and, subsequently, directional migration, we measured the average migration speed of cells with respect to their mCh expression level (Figure S1A). mCh-SspB fluorescence intensity was normalized to fluorescence intensity of carboxyl-functionalized Nile Red-containing beads from Spherotech (FCM-1056–2). This allows for easier replication of the experiment by eliminating variables caused by each experimenter’s unique imaging parameters. The highest migration speeds were observed in cells where mCh-SspB fluorescence was 1.5–2.5 times that of Spherotech beads (Figure S1A). It is possible that too high levels of mCh-SspB expression result in a global increase in mCh-SspB at the plasma membrane, making it difficult to induce sufficiently polarized protein accumulation through localized activation of iLID.
We then examined the response to optically induced localized accumulation of fluorescent proteins other than mCherry. We found that cells also migrate in response to accumulation of both mTurquoise (mTurq) and YFP, with the speeds comparable to those of cells migrating due to mCh accumulation (Figure S1B). This shows that the migration is due to protein accumulation, rather than a unique property of mCh. Since they induce migration at similar speeds, mTurq and mCh are both are used in experiments below.
The ability of iLID to generate migration through protein accumulation raises the question of whether other dimerization-based optogenetic tools such as the CRY-CIBN system can be used for this purpose. Like iLID, Cryptochrome 2 (CRY2) dimerizes to its binding partner, CIBN, upon blue light exposure.32 We transfected cells with CRY2-mCh and CIBN-KRasCT and photoactivated the cells on one side. The cells exhibited directional migration, but at a speed of 0.23 μm/min, almost half that of iLID-mediated migration (Figure S1C). This shows that localized optogenetically induced protein accumulation at the plasma membrane can generate migration regardless of the specific optogenetic tool. This difference in speed between the iLID and CRY systems is expected because in contrast to CRY2 bound to CIBN which is a 170 amino acid protein,32 the SspB fusion construct will be in close proximity to the plasma membrane because it binds the SsrA peptide that is associated with the plasma membrane through an C terminal prenyl lipid (Figure 1A).17,33 Thus, light-induced dimerization in the iLID system will result in accumulation of proteins more proximal to the plasma membrane than dimerization of CRY-CIBN, which could account for the difference in migration speed.
Because polarization of cellular processes is known to take place during migration,34,35 we sought to characterize the distribution of various intracellular molecules in cells migrating as a result of protein accumulation. The migrating cells lack lamellipodia and leading edge protrusions, instead maintaining a rounded morphology (Figure 1C, Figure 2A, and Figure 3A,B). This is reminiscent of RhoA-driven amoeboid migration, which is known to be mediated by rearward flow of the plasma membrane.14,24 We used fluorescently tagged KRasCT to observe plasma membrane dynamics during this mode of migration. In cells transfected with mCh-SspB, iLID-KRasCT, and Venus-KRasCT, localized photoactivation results in rapid translocation of mCh-SspB to the photoactivation site, followed by gradual accumulation of the plasma membrane marker as the cell migrates (Figure 2A, Figure S2A, and Movie S3). Venus-KRasCT fluorescence intensity increases in the back of the cell and decreases in the front during the course of migration (Figure 2B). This indicates that in cells migrating via this mechanism there is rearward membrane flow, which is in agreement with previously reported RhoA-driven migration.14,24
Figure 2.
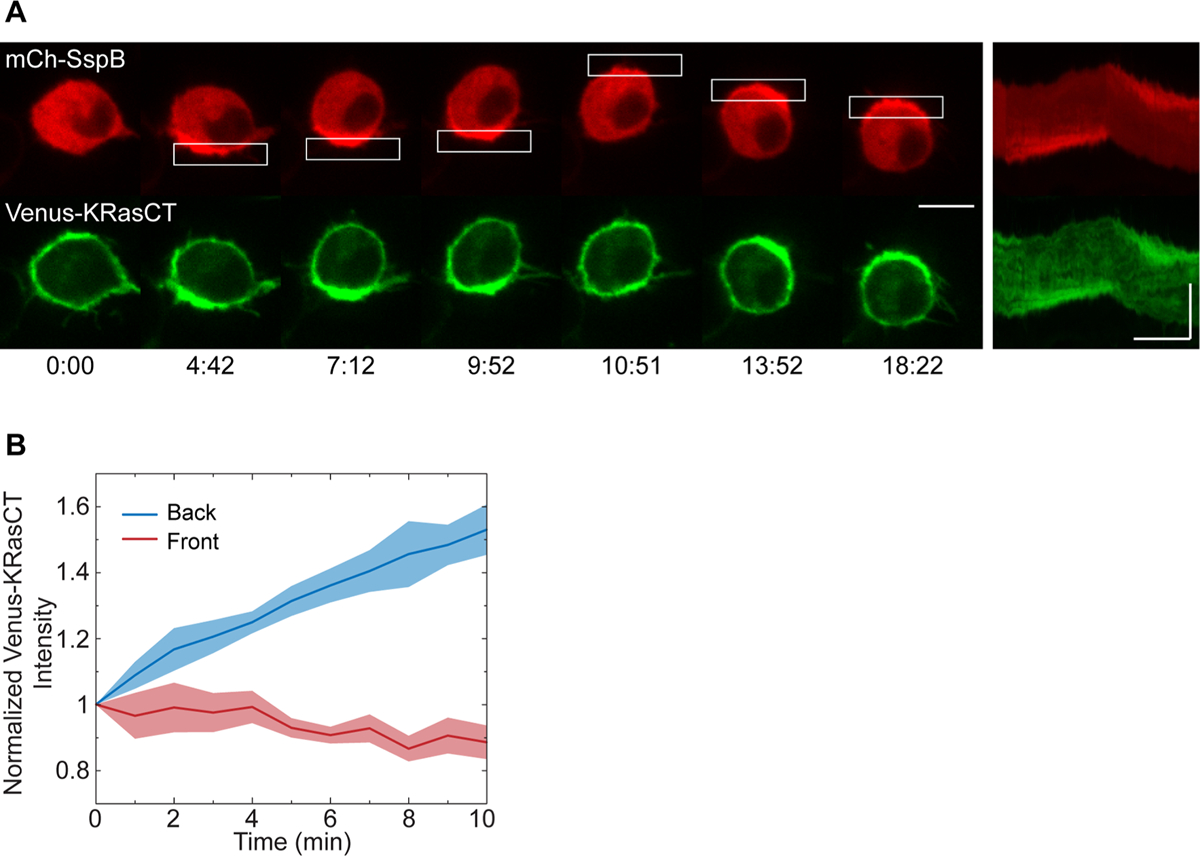
Plasma membrane dynamics during protein accumulation-driven migration. (A) Localization of plasma membrane lipids during protein accumulation-driven migration. Cell is transfected with mCh-SspB (red), iLID-KRasCT, and plasma membrane marker Venus-KRasCT (green). Kymographs are shown on the right. Rectangle represents the area of photoactivation. Image sequence scale bar is 10 μm. Kymograph scale bars are 10 μm (vertical) and 5 min (horizontal). Time is in min:sec. (B) Normalized intensity of Venus-KRasCT in the back half (blue curve) and front half (red curve) of migrating cells transfected with mCh-SspB, iLID-KRasCT, and Venus-KRasCT. Solid lines represent the mean and shaded regions are SEM. Migration was initiated at t = 0. n = 6.
Figure 3.
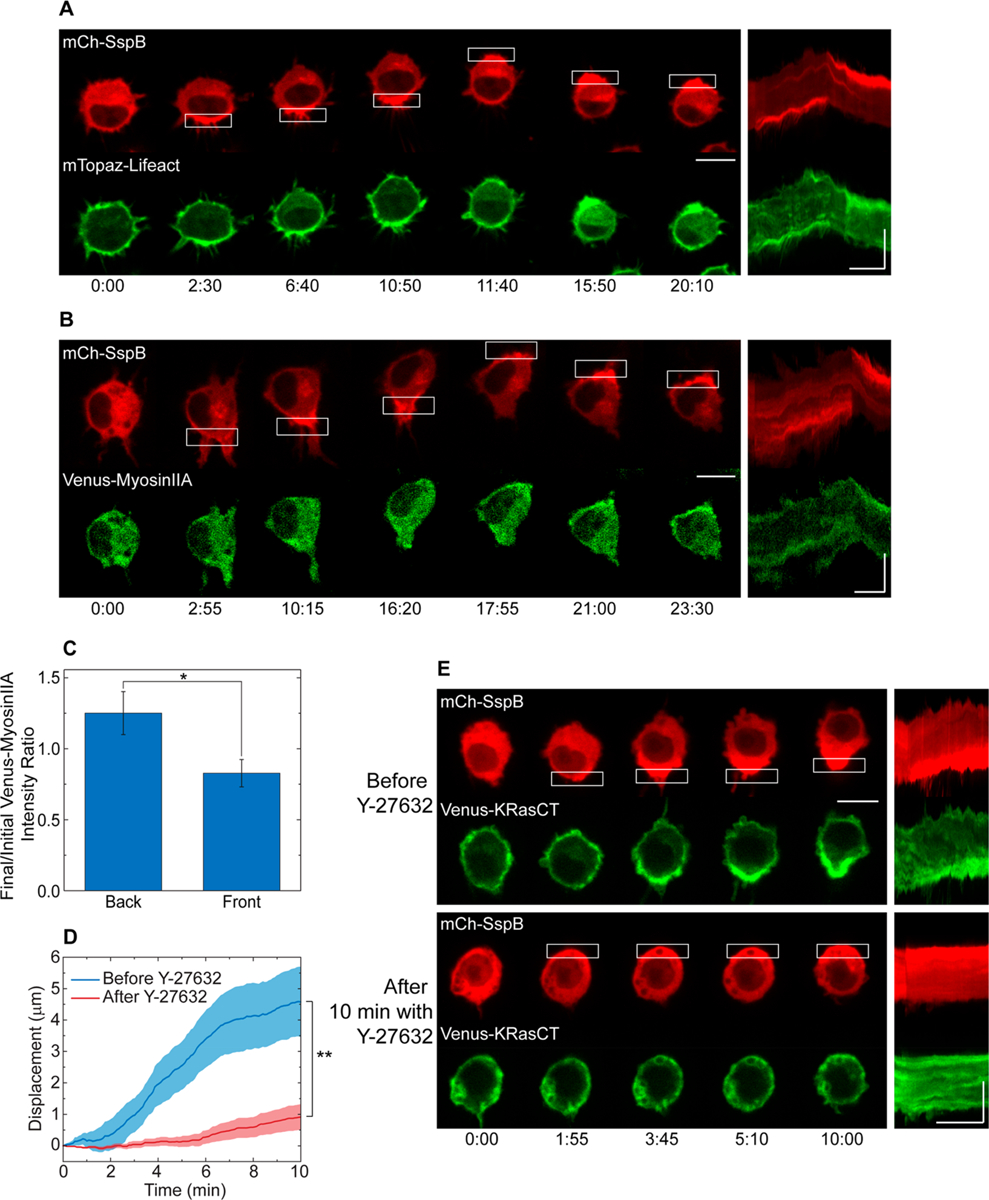
Dynamics of cytoskeletal proteins during protein accumulation-driven migration. (A) Distribution of F-actin. Cell is transfected with mCh-SspB (red), iLID-KRasCT, and F-actin marker mTopaz-Lifeact (green). (B) Distribution of myosinIIA. Cell is transfected with mCh-SspB (red), iLID-KRasCT, and Venus-myosinIIA (green). (C) Change in myosinIIA distribution in the back and front of cells transfected with mCh-SspB, iLID-KRasCT, and Venus-myosinIIA during protein accumulation-driven migration. Y-axis is the ratio of Venus-myosinIIA intensity at t = 10 min and t = 0. Migration was initiated at t = 1 min. Error bars are SEM. n = 8. (D) Speed of cells undergoing protein accumulation-driven migration before and after 30–45 min incubation with 100 μM Y-27632. Solid lines represent the mean and shaded regions are SEM. n = 11. (E) Representative cell from (D). Cell is transfected with mCh-SspB (red), iLID-KRasCT, and Venus-KRasCT (green). Kymographs are shown on the right of the image sequences. Rectangle represents the area of photoactivation. Image sequence scale bar is 10 μm. Kymograph scale bars are 10 μm (vertical) and 5 min (horizontal). Time is in min:sec. *p < 0.05, two-sample t test. **p < 0.01, paired t test.
If RhoA is indeed being activated, we also expect to observe a change in the distribution of cytoskeletal proteins. RhoA is known to activate Rho-associated protein kinase (ROCK), which promotes phosphorylation of myosin light chain (MLC) and subsequent actomyosin contractility.36 Actin filaments and myosin are therefore enhanced in areas of the cell with increased RhoA activity.14 We therefore induced polarized protein accumulation in cells transfected with mCh-SspB, iLID-KRasCT, and F-actin sensor mTopaz-Lifeact. mTopaz-Lifeact increases at the rear of the migrating cell where protein accumulation is induced (Figure 3A and Movie S3). Similarly, in cells transfected with mCh-SspB, iLID-KRasCT, and Venus-myosinIIA, myosin accumulates at the cell rear during protein accumulation-driven migration (Figure 3B,C and Movie S3). The polarization of these markers is especially evident in kymographs, which show fluorescence distribution in the cell along the axis of migration as a function of time (Figure 3A,B, right). The increase in actin and myosin at the back with corresponding increase in flow of plasma membrane lipids rearward suggests that the actomyosin cortical flow supports the membrane movement.
Rounded cell morphology along with rearward membrane flow and accumulation of cortical proteins at the cell rear are indicative of amoeboid migration mediated by RhoA activity at the back of the cell.14,23–25 Since ROCK is known to be activated by RhoA and mediates migration through actomyosin contractility and rearward membrane flow,14,36 we examined the effect of ROCK inhibition on this mode of migration. We induced protein accumulation in cells transfected with mCh-SspB, iLID-KRasCT, and Venus-KRasCT before and after incubation with Y-27632, an inhibitor of ROCK. Although robust polarization of mCh-SspB can be observed both before and after incubation with Y-27632, the migration speed of Y-27632 treated cells is significantly inhibited (Figure 3D,E, and Movie S4).
The above results all indicate that protein accumulation-driven migration is mediated by RhoA and has the characteristics of amoeboid migration. The finding that polarized optogenetic protein recruitment to the plasma membrane can induce this mode of migration is significant, since the factors mediating the transition between mesenchymal and amoeboid migration modes are of great interest to researchers. Macro-phages are thought to be the only immune cells capable of transition between mesenchymal and amoeboid modes.37,38 Tumor cells also often assume the amoeboid migration mode, the rounded morphology and enhanced contractility characteristic of this mode of migration enabling the cells to adapt their shape to better penetrate tissues and to more easily squeeze through the extracellular matrix.39–42 Tumor cell invasion or macrophage infiltration through tissues has serious patho-logical consequences. Deciphering the mechanistic basis of amoeboid migration can thus be of great value.
The ability of polarized accumulation of a fluorescent protein with no known regulatory activity to induce cell migration suggests that a physical or steric change at the plasma membrane rather than a biochemical signaling event is the initiating step for this mode of cell migration. Indeed, it is known that mechanical stimuli from the extracellular environment can play a significant role in modulating cell migration.37–39,43,44 Cells sense these external cues through membrane-associated proteins,45,46 so it is likely that the plasma membrane plays a major role in sensing mechanical forces. Consistent with this, there are suggestions that plasma membrane tension plays a role in regulating cell motility.6,47–49 Our finding that the plasma membrane marker accumulates at the back of the migrating cells suggests that membrane tension likely decreases progressively at the back of cells as the cells migrate. This is consistent with in vitro experiments which have demonstrated that restricted localization a high concentration of proteins such as GFP or disordered proteins like the C-terminal domain of epsin to membranes exerts steric pressure on the membrane and induces curvature and altered tension.19,20,50
To examine if the plasma membrane curvature and tension are affected by optically induced protein accumulation and migration, we observed the distribution of several proteins known to be sensors of membrane tension or curvature. Studies have shown that a decrease in membrane tension enhances endocytosis-related membrane changes.22 Caveolin-containing invaginations at the plasma membrane which form endocytic vesicles are known to act as buffers against changes in membrane tension, increasing in number as the tension decreases.51,52 Caveolin can therefore function as a sensor for tension changes at the plasma membrane. We transfected cells with mTurq-SspB, iLID-KRasCT, Venus-KRasCT, and mApple-caveolin and examined the distribution of mApple-caveolin after inducing migration by optically directing protein accumulation at the cell edge. After light activation, caveolin containing vesicles progressively increase at the rear of the cell in the region that was activated (Figure 4A and Movie S5). Similarly, clathrin is the key protein in clathrin-mediated endocytosis and is known to localize to areas of membrane curvature.53 It is therefore a sensor for inward membrane curvature and decreased plasma membrane tension similar to caveolin. Cells transfected with mCh-SspB, iLID-KRasCT, and EYFP-clathrin were optically stimulated to migrate and examined for the distribution of clathrin across the cell. With the initiation of migration, vesicles containing clathrin begin to appear at the back of the cell coincident with the light activated region. They increase progressively as the cell migrates (Figure 4B and Movie S5).
Figure 4.
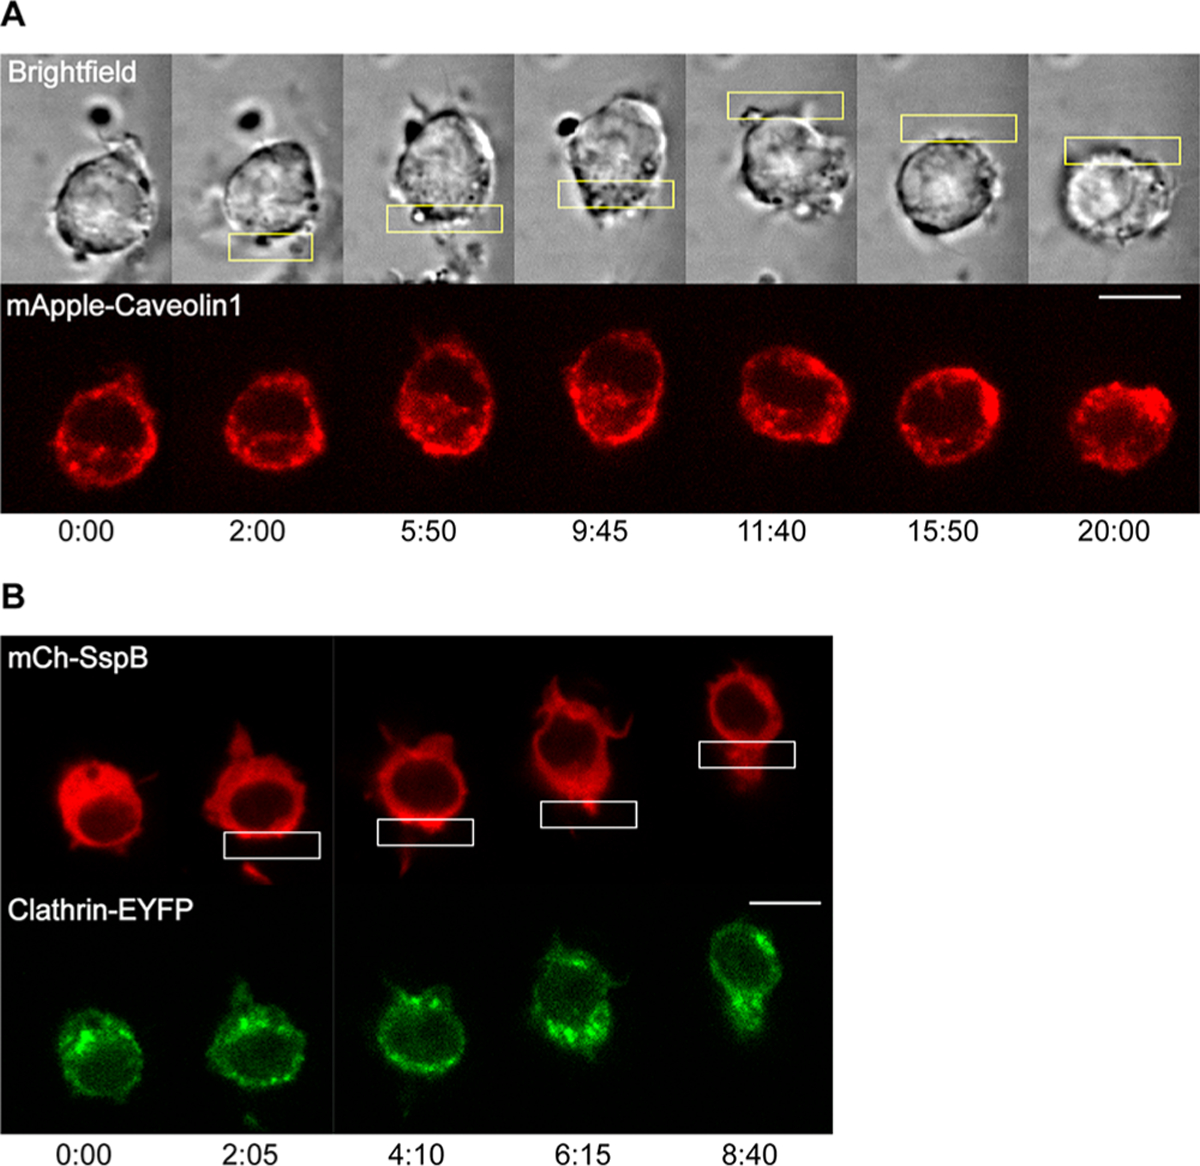
Localization of tension- and curvature-sensing endocytosis proteins during protein accumulation-driven migration. (A) Distribution of caveolin. Cell is transfected with mTurq-SspB, iLID-KRasCT, Venus-KRasCT, and mApple-caveolin1 (red). Caveolin increased at the photoactivated side in 7 out of 9 cells. (B) Distribution of clathrin. Cell is transfected with mCh-SspB (red), iLID-KRasCT, and Clathrin-EYFP (green). Clathrin increased at the photoactivated side in 7 out of 8 cells. Rectangle represents the area of photoactivation. Scale bar is 10 μm. Time is in min:sec.
Lastly, we used formin-binding protein 17 (FBP17), which is a Bin/Amphiphysin/Rvs (BAR) domain protein that binds to areas of negative membrane curvature and has been shown to work as a low membrane tension indicator.5 To verify that FBP17 can effectively detect tension changes in RAW cells, we observed its distribution in cells transfected with mCh-SspB, iLID-KRasCT, and Venus-FBP17 in the presence of osmotic buffers. Hypertonic and hypotonic buffers are known to cause a decrease and increase in plasma membrane tension, respectively.5 Indeed, FBP17 localizes to the plasma membrane in the presence of hypertonic buffer. Upon addition of hypotonic buffer, FBP17 dissociates from the plasma membrane (Figure 5A,B). Having confirmed FBP17’s effectiveness as a plasma membrane tension sensor in macrophages, we optically induced protein accumulation-driven migration and observed the distribution of FBP17. FBP17 localizes to the region of protein accumulation within minutes. Upon reversal of protein accumulation to the opposite side of the cell, FBP17 also translocates to the opposite side (Figure 5C, Figure S2B, and Movie S6).
Figure 5.
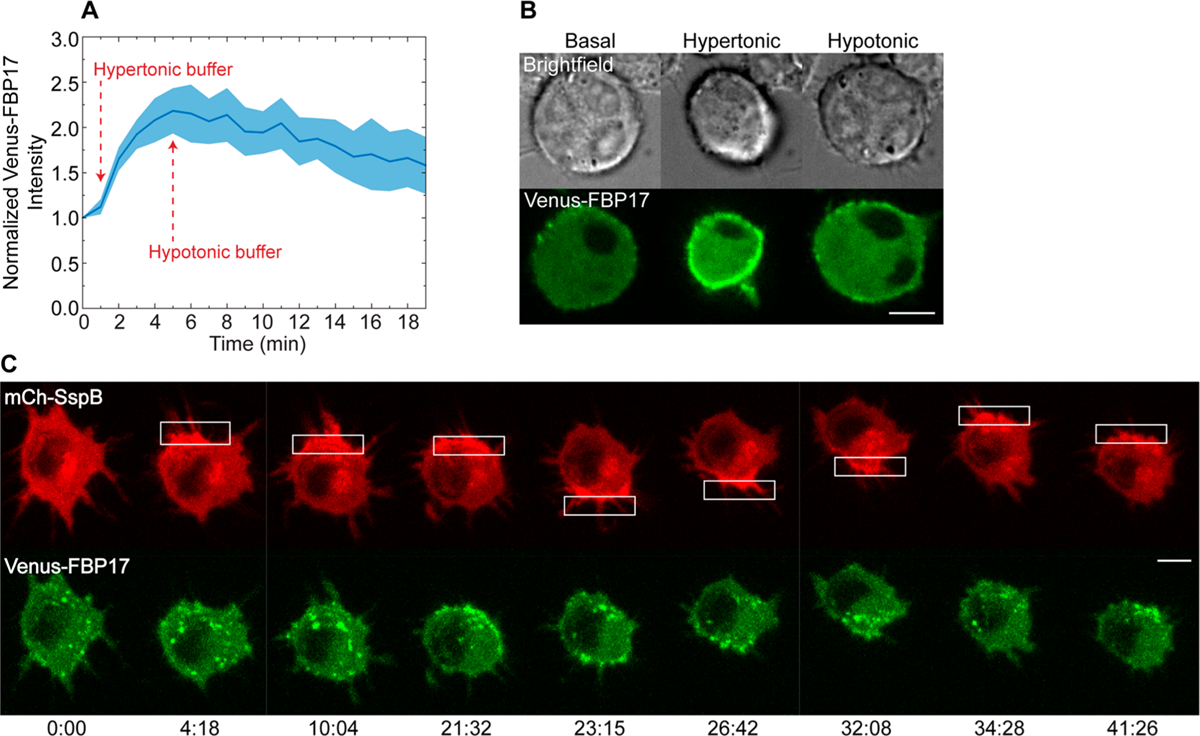
Changes in plasma membrane tension during protein accumulation-driven migration. (A) Intensity of Venus-FBP17 at the plasma membrane during low and high tension conditions. Cells were transfected with mCh-SspB, iLID-KRasCT, and Venus-FBP17. In the basal state, the cells were incubated with HBSS containing 1 g/L glucose. Hypertonic (low tension) conditions were induced by addition of 1 mL HBSS with 1 g/L glucose and 200 mM sucrose to the dish at t = 1 min. Hypotonic (high tension) conditions were induced by addition of 2 mL H2O to the same dish at t = 5 min. Solid line represents the mean and shaded regions are SEM. n = 3. (B) Representative cell from (A). (C) Distribution of FBP17 during protein accumulation-driven migration. Cell is transfected with mCh-SspB (red), iLID-KRasCT, and Venus-FBP17 (green). FBP17 increased at the photoactivated side in 5 out of 7 cells. Rectangle represents the area of photoactivation. Scale bars are 10 μm. Time is in min:sec.
The results from examining the dynamic distribution of caveolin, clathrin, and FBP17 during optically stimulated migration suggest that localized protein accumulation at the plasma membrane induces membrane curvature and a decrease in plasma membrane tension in the same region. Plasma membrane marker KRasCT can itself serve as an indicator of lowered tension, since higher concentrations of the membrane marker suggest an increase in membrane folding with consequent increase in membrane curvature and decrease in tension. This is consistent with our above results showing an increase in KRasCT at the rear of migrating cells and a decrease in the front (Figure 2A,B). The corresponding increase in endocytosis localized to the back of the cell where KRasCT accumulates provides further evidence for lowered tension because endocytosis is known to be stimulated by a decrease in plasma membrane tension.3,22,54,55 The increased endocytosis is also consistent with the migration being RhoA-mediated, as we have previously shown that polarized vesicle trafficking from back to front takes place during RhoA-driven amoeboid migration.14
Together, the above results demonstrate that localized protein accumulation decreases plasma membrane tension by creating curved regions in the membrane. This optogenetic method of protein accumulation is therefore effective as a tool for applying mechanical forces locally at the plasma membrane. It also enables physical changes in the membrane to be induced in a spatially precise, rapidly reversible, noninvasive manner, providing an advantage over more traditional methods to exert mechanical forces at the subcellular level on a cell.
In biochemical experiments with lipid vesicles, localization of high concentrations of proteins to the membrane induced curvature. This was observed with disordered proteins such as the C-terminal domain of epsin, as well as proteins with no regulatory function such as GFP,19,20,50 suggesting that the curvature is physically induced rather than the result of a signaling event. Our results with mCh in vivo are therefore consistent with those previously reported with GFP in vitro. We examined the effect of optically recruiting epsin, as well as the N-BAR domain protein amphiphysin which is known to generate and stabilize membrane curvature,21,56 to one side of the cell. Epsin and amphiphysin have a molecular weight of approximately 65 kDa and 120 kDa, respectively. Despite the nearly 2-fold difference in mass between the two proteins, Epsin-mCh-SspB and Amphiphysin-mCh-SspB generate cell migration at similar speeds to each other and to that of mCh-SspB alone (Figure 6A,B and Movie S7). This is consistent with previous findings that the percent coverage of the membrane, rather than the nature and size of the accumulated protein, determines whether membrane curvature occurs.20 Our results demonstrate that the optogenetic tool presented here is effective in recruiting proteins of varying sizes and functions to the plasma membrane at high enough concentrations to generate maximum membrane coverage in vivo, resulting in sufficient curvature and tension changes to generate migration. This is also consistent with our above findings showing that CRY-mediated protein accumulation induces cell migration at lower speeds compared to iLID (Figure S1C), likely due to the protein accumulation occurring farther from the plasma membrane and subsequently generating lower curvature and tension change.
Figure 6.

Migration induced by polarized accumulation of disordered and BAR domain proteins. (A) Migration of cells transfected with Epsin-mCh-SspB or Amphiphysin-mCh-SspB (red) and iLID-KRasCT. Rectangle represents the area of photoactivation. Scale bar is 10 μm. Time is in min:sec. (B) Speed of cells undergoing migration induced by polarized accumulation of Amphiphysin-mCh-SspB (red curve, n = 7) and Epsin-mCh-SspB (green curve, n = 8) compared to mCh-SspB alone (blue curve, n = 40, data from Figure 1B). n.s., not significant, two-sample t test.
One likely mechanism at the basis of the migration seen here is the activation of a signaling pathway induced by the localized alteration in plasma membrane curvature and tension. Integrins are attractive candidates for the upstream molecule that initiates this signaling, since they transmit forces across the plasma membrane through their associations with the extracellular matrix and the actin cytoskeleton and are known to be activated by mechanical stimuli.26,28,57,58 In support of this notion, there is evidence for changes in plasma membrane tension modulating integrin activation.59 In particular, α5β1 integrin is known to promote RhoA-mediated contractility in the cell rear during migration.27,60,61 We therefore used P4C10, an integrin β1-blocking monoclonal antibody, to determine if protein accumulation-driven migration is affected when integrin β1 activity is globally inhibited. RNAseq analysis of the RAW 264.7 cells used here showed that integrin β1 is expressed in these cells. Cells were transfected with mCh-SspB, iLID-KRasCT, and Venus-KRasCT and incubated for 3 h with either serum-free media containing P4C10 or serum-free media alone. P4C10-treated cells exhibit slowed migration compared to control cells (Figure 7A,B, and Movie S8). This demonstrates that β1 integrin activity plays a role in this mode of migration.
Figure 7.
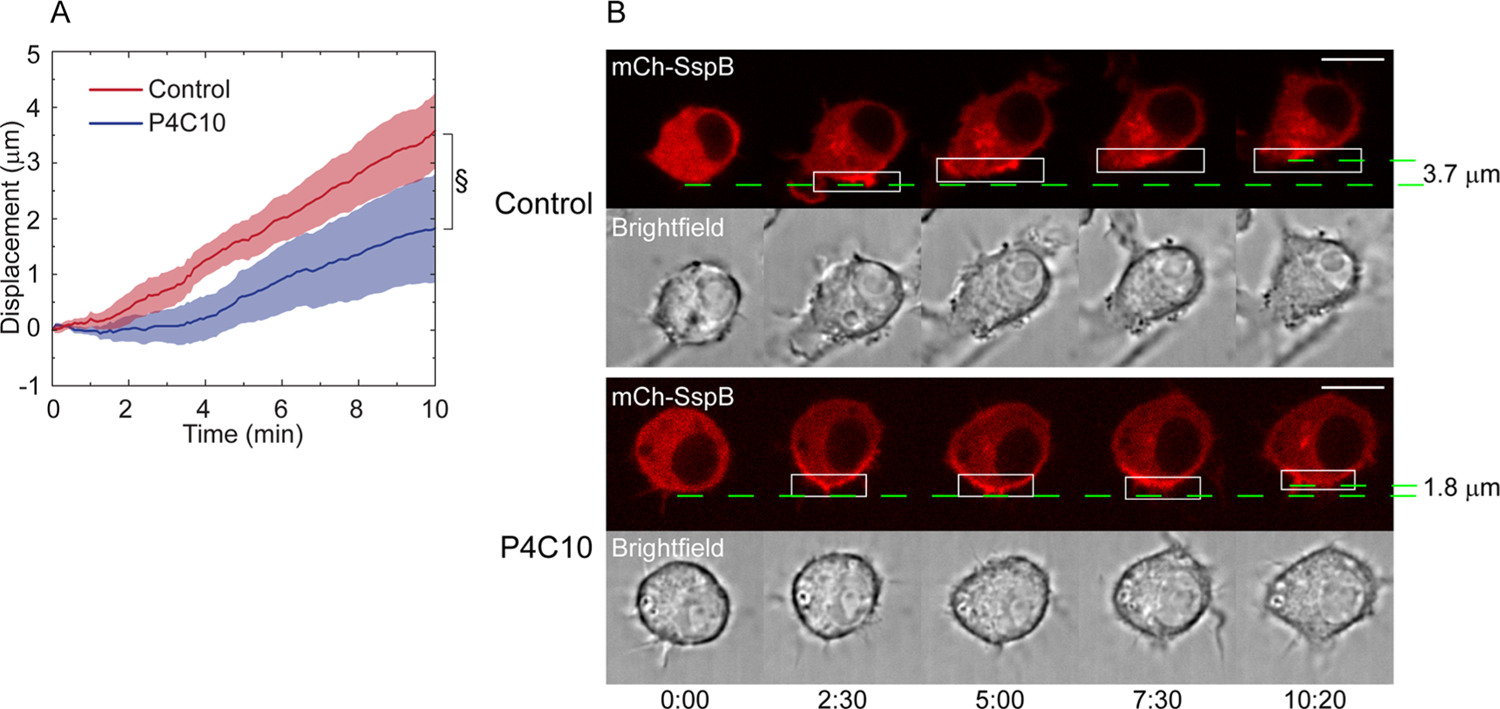
Effect of β1 integrin inhibition on protein accumulation-driven migration. (A) Speed of protein accumulation driven migration with and without incubation with P4C10, an antibody that inhibits β1 integrin activation. Cells were incubated with for 3 h with serum-free media containing P4C10 (blue curve, n = 13) or serum-free media alone (red curve, n = 12). Solid line represents the mean and shaded regions are SEM. §p = 0.069, two-sample t test. (B) Representative cell from (A). Cell is transfected with mCh-SspB (red), iLID-KRasCT, and Venus-KRasCT. Dashed green lines designate starting and ending position of the cell rear and are used to calculate the cell displacement. Rectangle represents the area of photoactivation. Scale bar is 10 μm. Time is in min:sec.
To verify that β1 integrin is activated in this migration mode, we used another monoclonal antibody, HUTS-4. It binds to epitopes 355–425 which are exposed only when the integrin assumes its active conformation.62 To test the effectiveness of this antibody as an activated integrin β1 sensor in live cells, we first used it with cells treated with 5 mM MnCl2. Mn2+ and other divalent ions are known to activate integrins and increase their binding affinity for their extracellular ligand.63,64 We indeed see an increase in AlexaFluor488-tagged HUTS-4 binding to the cell surface upon addition of 5 mM MnCl2 (Figure 8A,B). The uneven distribution of HUTS4-AlexaFluor488 at the plasma membrane can be explained by the fact that activated integrins are known to cluster into adhesion complexes.29 Indeed, previous uses of this antibody showed that it assumes a punctate distribution in cells.65
Figure 8.
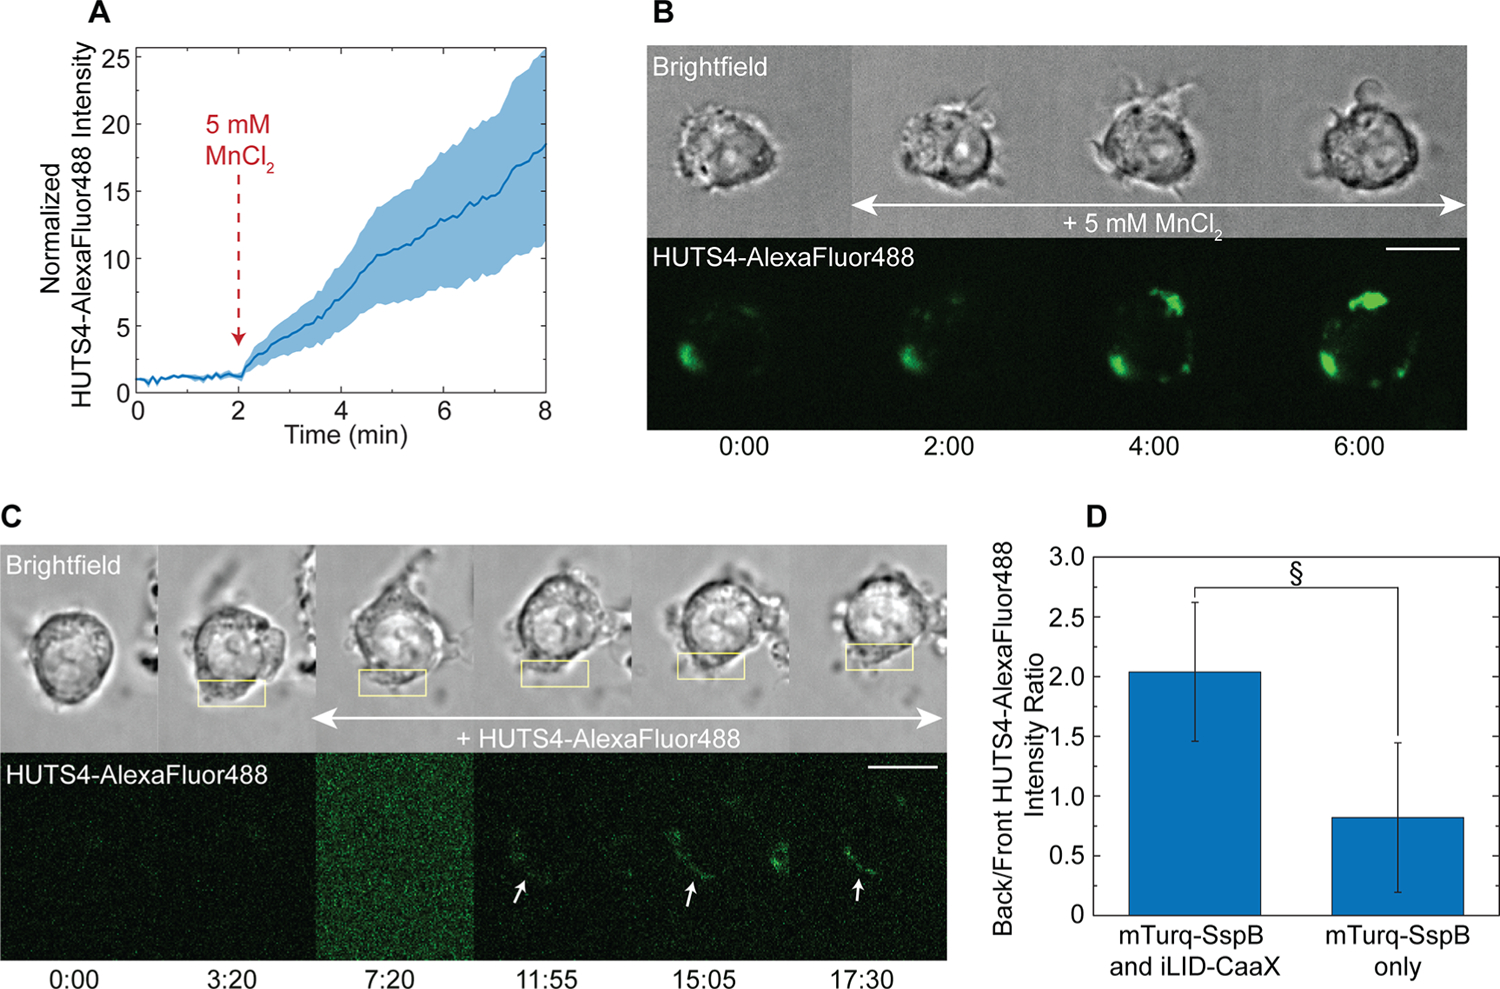
Integrin β1 activity in a cell migrating due to polarized protein accumulation. (A) Integrin β1 activity sensing with HUTS4-AlexaFluor488. Fluorescence intensity at the plasma membrane was measured over 8 min. Five mM MnCl2 was added at t = 2 min to induce integrin activation. Solid line represents the mean and shaded regions are SEM. n = 5. (B) Representative cell from (A). (C) Activation of integrin β1 during protein accumulation-driven migration. Cell is transfected with mTurq-SspB, iLID-KRasCT, and mCh-integrinβ1. Migration was initiated at t = 1:00, and HUTS4-AlexaFluor488 (green) was added to the dish at t = 7:20. HUTS4 bound to the photoactivated side in 9 out of 10 cells where polarized binding was observed. Rectangle represents the area of photoactivation. Scale bar is 10 μm. Time is in min:sec. (D) Polarization of integrin β1 activity in cells after 17 min of polarized photoactivation in the presence of HUTS4-AlexaFluor488. Cells were transfected with mCh-integrinβ1 and mTurq-SspB with iLID-KRasCT (left, n = 13) or mTurq-SspB alone as control (right, n = 11). Error bars are SEM. §p = 0.089, two-sample t test.
We then locally photoactivated cells expressing mCh-integrinβ1, mTurq-SspB and iLID-KRasCT to induce protein accumulation. Upon initiation of migration, HUTS4-Alexa-Fluor488 was added to the dish. In cells where polarized HUTS-4 binding was observed, the antibody binds preferentially to the side of the cell where protein accumulation is induced (Figure 8C,D and Movie S9). This indicates that β1 integrin is activated at the site of optically induced protein accumulation, making it the key molecule that responds to changes in plasma membrane tension. These results are consistent with evidence for integrins being activated by physical stimuli.26,28,57,66 Additionally, the effect of inward membrane curvature on integrin is consistent with evidence that stretching integrin results in activation.28,67 It is possible that inward membrane curvature induced by protein accumulation induces increased separation of integrin cytoplasmic tails, which is known to promote integrin activation.67–69
While it has previously been shown that integrin activity is polarized during migration27,28,70 and integrin β1 plays a role in the retracting cell rear,27,71 our findings show that polarized integrin activation itself can actually serve as the driving force behind migration in the opposite direction. Amoeboid migration, compared to mesenchymal, is generally thought to require lower levels of adhesions and reliance on integrins.29,30,72 Our results suggest that for amoeboid cells migrating on surfaces such as blood vessels and tissues with integrin involvement, integrin activation induced by localized alteration in membrane tension can at least in part contribute to driving directional migration.
Our results also demonstrate that the optogenetic tool presented here can be used to mechanically activate integrins in a spatiotemporally precise manner, leading to directional migration. Optogenetic approaches have thus far been used to control directional cell migration by activating native endogenous proteins without introducing mutants by using small GTPase GEFs,11,14 GPCRs,73,74 or G protein GAPs.12,13 The present approach also induces native endogenous protein activation but does so through localized integrin activation by mechanical forces.
The question remains of how integrin activation induced by protein accumulation at the plasma membrane results in RhoA-driven migration. Answering this question would provide insight into the signaling pathway behind migration induced by physical forces at the plasma membrane. Studies have shown that certain RhoA GEFs can be activated downstream of integrin activation by mechanical forces.26,27,75 We sought to identify whether this pathway was at play through pharmacological inhibition of key proteins in the pathway.
Src family kinases (SFKs) are known to be involved in RhoA GEF activation through integrins. Activated integrins form complexes with SFK and focal adhesion kinase (FAK), which in turn phosphorylate proteins with GEF or GAP activity for small GTPases.27,76 SFK member Fyn has been reported to phosphorylate and activate the RhoA GEF LARG.26 We therefore tested the effect of SFK inhibition on protein accumulation-driven migration by treating cells transfected with mCh-SspB, iLID-KRasCT, and Venus-KRasCT with 50 μM of SFK inhibitor SU6656 for 30–45 min. Inhibitor-treated cells display a 50% reduction in migration speed (Figure 9A,B and Movie S10), showing that SFKs are involved in protein accumulation-induced RhoA activation.
Figure 9.
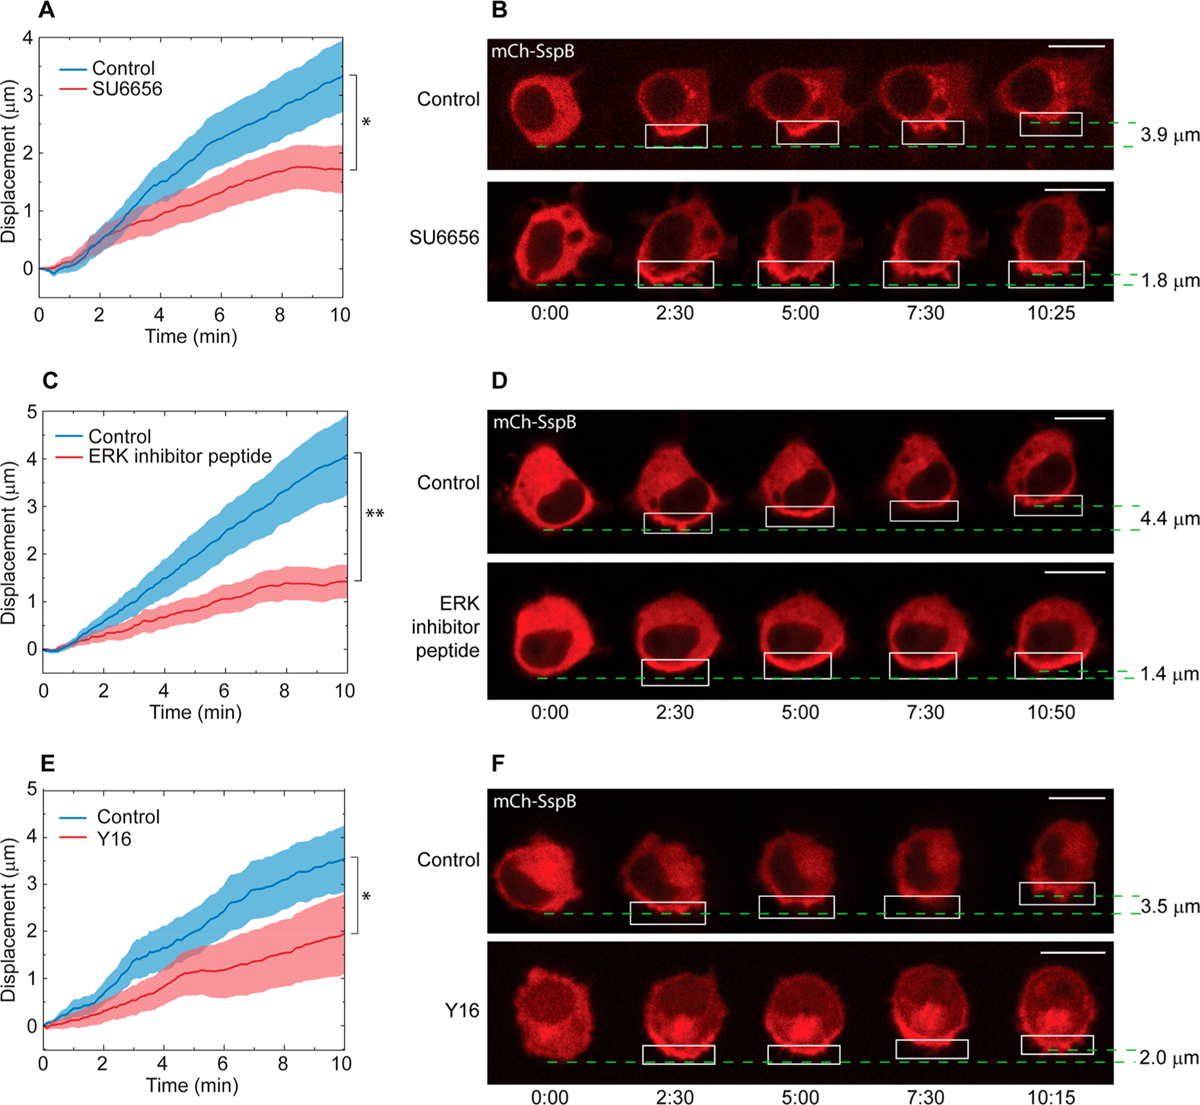
Effect of pharmacological perturbations of proteins upstream of RhoA activation on protein accumulation-driven migration. (A) Inhibition of SFK. Cells were incubated for 30–45 min with 50 μM SU6656 (red curve, n = 19) or DMSO (blue curve, n = 21) before imaging. (B) Representative cell from (A). (C) Inhibition of ERK. Cells were incubated for 30–45 min with 30 μM ERK inhibitor peptide (red curve, n = 11) or H2O (blue curve, n = 12) before imaging. (D) Representative cell from (C). (E) Inhibition of LARG. Cells were incubated for 30–45 min with 25 μM Y16 (red curve, n = 14) or DMSO (blue curve, n = 11) before imaging. (F) Representative cell from (E). Solid lines represent the mean and shaded regions are SEM. All cells were transfected with mCh-SspB, iLID-KRasCT, and Venus-KRasCT. Dashed green lines designate starting and ending position of the cell rear and are used to calculate the cell displacement. Rectangle represents the area of photoactivation. Scale bars are 10 μm. Time is in min:sec. *p < 0.05, **p < 0.01, two-sample t test.
We then tested the effect of inhibiting the GEF activity of LARG on this mode of migration using small molecule inhibitor Y16, which interacts with the DHPH domains of LARG to inhibit its association with RhoA.77 Cells were transfected with mCh-SspB, iLID-KRasCT, and Venus-KRasCT and incubated for 30–45 min with 25 μM Y16 prior to initiation of protein accumulation-driven migration. Inhibitor-treated cells exhibit a 43% reduction in migration speed compared to control cells (Figure 9E,F and Movie S10). These results demonstrate that integrin activation induced by localized protein accumulation activates RhoA via SFK-dependent LARG activation.
Extracellular signal-regulated kinase (ERK) is another protein known to regulate RhoA activation through phosphorylation of GEF-H1, a RhoA GEF activated in response to force on the cell.26,78,79 Determining its role in this mode of migration would help shed light on the pathway involved. Inhibition of ERK with 30 μM of ERK inhibitor peptide for 30–45 min inhibits the migration speed by 65% (Figure 9C,D and Movie S10). The lack of complete migration inhibition in response to ERK, SFK and LARG inhibition could be due to LARG and GEF-H1 being activated through parallel force-dependent pathways,26 with inhibition of one resulting in the upregulation of the other.
On the basis of these results, we propose a model in which integrin activation due to membrane curvature activates RhoA GEFs in a SFK- and ERK-dependent manner. The subsequent RhoA activation leads to increased actomyosin contractility in the region of protein accumulation, which leads to cell retraction and rearward membrane flow that is detected from the accumulation of the KRasCT plasma membrane marker. The localized decrease in membrane tension due to retrograde membrane flow at the back of the cell further activates integrins (Figure 10). This proposed positive feedback loop provides an explanation of how cells migrate in a RhoA-dependent amoeboid fashion as a result of physical stimuli. In addition, since ERK and SFK are known to be involved in adhesion disassembly and turnover during migration29,80 they can contribute to the migration of a cell attached to a surface as in results here.
Figure 10.
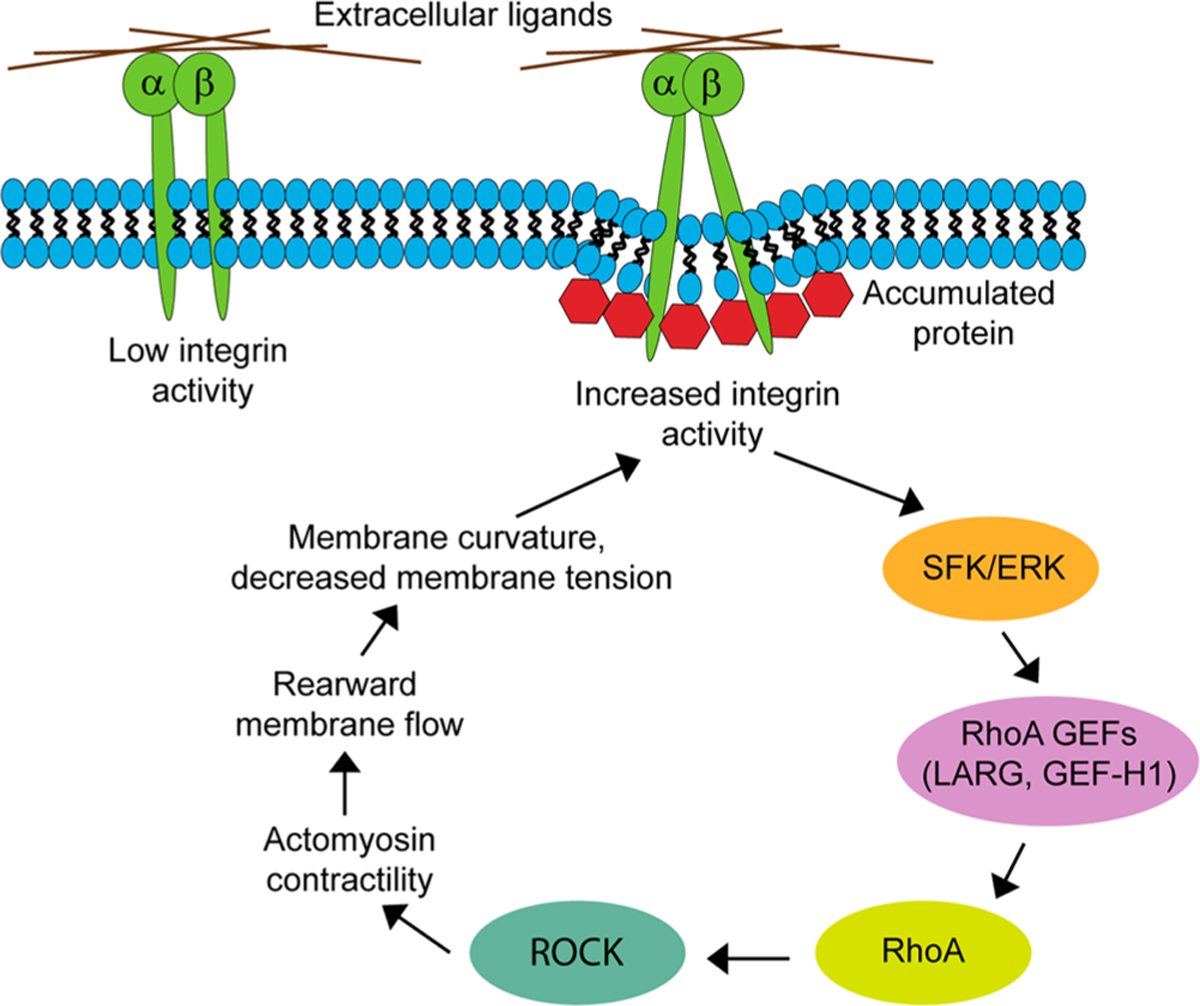
Proposed pathway that underlies cell migration driven by localized mechanically activated integrin. High concentrations of accumulated proteins at the plasma membrane induce a decrease in membrane tension and inward membrane curvature, which exerts a mechanical force on integrin and activates it. Higher integrin activity leads to SFK and ERK activation downstream. SFKs and ERK activate RhoA GEFs, LARG and GEF-H1. The resulting RhoA activation leads to ROCK activation, increased actomyosin contractility, rearward plasma membrane flow, further lowering of tension at the back, and integrin activation.
According to the above proposed model, polarized protein accumulation induces a small initial change to plasma membrane curvature and tension, which is then amplified by rearward membrane flow downstream in the positive feedback loop. However, due to the detection limit of our experimental approach, we cannot confirm the initial curvature and tension change induced by protein accumulation alone. We favor the above model because it has been shown that protein accumulation at the membrane induces alterations to membrane curvature and tension,19,20,50 and integrins are transmembrane proteins that are widely known to be modulated by physical stimuli and activate signaling proteins downstream.26,27,57,58 However, we cannot rule out an alternative model in which protein accumulation activates RhoA or another signaling molecule directly through a previously unidentified mechanism, which leads to actomyosin contractility, rearward membrane flow, and a membrane curvature and tension change further downstream.
Our model suggests that the optogenetic method of localized protein recruitment to the plasma membrane is capable of activating a native endogenous signaling pathway, demonstrating that this approach exerts mechanical stimuli on a cell in a manner that mimics forces experienced by a cell under native conditions. Additionally, ability to locally activate integrins through an optogenetically induced physical stimulus could be of use in probing the basis of other cell functions mediated by integrin activation induced by mechanical forces.
METHODS
DNA Constructs.
The following constructs were obtained from Addgene: mVenus-myosinIIA (#56389, Michael Davidson), mCherry-Lifeact-7 (#54491, Michael Davidson), mApple-Caveolin (#54872, Michael Davidson), and EYFP-Clathrin (#56584, Michael Davidson).
mCh-SspB-R73Q was cut from Tim-mCh-SspB-R73Q with KpnI and BamH1. mTurq-SspB-R73Q was made by introducing KpnI and NhrI sites on mTurq via PCR and ligating with SspB in pcDNA. Venus-FBP17 was made by ligating FBP17 (BglII and EcoR1) with Venus (HindIII and BglII) and pcDNA3.1 (HindIII and EcoR1). Venus-KRasCT was synthesized as Gblocks (HindIII-XbaI) and cut and ligated with pcDNA3.1 (HindIII-XbaI).
Transfections.
Cell culture and transfections were performed as previously described.81 Briefly, RAW 264.7 cells obtained from ATCC (Manassas, VA) were cultured in high glucose DMEM (Sigma-Aldrich, St. Louis, MO) containing 10% dialyzed fetal bovine serum (Atlanta Biologicals) and 1% penicillin-streptomycin. Cells were cultured at 37 °C with 5% CO2.
Cells that had been passaged between 4 and 15 times were used for experiments. Around 3 million cells were resuspended in 100 μL of Nucleofector Solution V containing 0.5–3 μg of the appropriate DNA. Cells were transfected via electroporation with an Amaxa Nucleofector 2b electroporator using the T-020 setting. After electroporation, cells were put into warm culture medium and plated on glass bottom dishes. The cells were imaged 4–10 h after transfection.
Reagents.
Stock solutions of Y-27632 were prepared in H2O, then diluted in HBSS containing 1 g/L glucose. Cells were imaged before and after 10 min incubation with 100 μM Y-27632. Stock solutions of Y16 and SU6656 were prepared in DMSO, then diluted in HBSS containing 1 g/L glucose. LARG inhibition experiments were performed by incubating cells for 30–45 min with 25 μM Y16 or DMSO (control). SFK inhibition experiments were performed by incubating cells for 30–45 min with 50 μM SU6656 or DMSO (control).
Stock solutions of ERK inhibitor peptide (Millipore Sigma) were prepared in water, then diluted in HBSS containing 1 g/L glucose. ERK inhibition experiments were performed by incubating cells for 30–45 min with 30 μM ERK inhibitor peptide or water (control).
HUTS-4 monoclonal antibody conjugated to AlexaFluor488 (Millipore Sigma) was diluted in cold HBSS containing 1 g/L glucose and added to the cells at a final concentration of 1 μg/mL. P4C10 (Millipore Sigma) was diluted 1:500 and added to cells in serum-free media. Cells were incubated for 3 h either with P4C10 in serum-free media or serum-free media alone (control).
Imaging.
Imaging was performed on an Andor Revolution imaging system consisting of a Leica DMI6000B microscope, Yokogawa CSU-X1 spinning disk unit, Andor iXon camera, and an Andor FRAPPA unit for localized photoactivation. For photoactivation, a 445 nm laser beam was scanned every 5 s over the designated photoactivation region at a rate of 0.9 ms/μm2 at 145 nW power. Venus, EYFP, mTopaz, and AlexaFluor488 were excited with 515 nm light and emission was collected with 528/20 nm filter (Semrock). mCherry, mApple, and AlexaFluor594 were imaged with 594 nm light and emission was collected with 628/20 nm filter (Semrock). Images were acquired every 5 s with a 63× 1.4 NA oil immersion objective (Leica). Cells were maintained at 37 °C and 5% CO2 while imaging. Andor iQ software was used to control the photoactivation area and image acquisition.
Cell Speed Analysis.
TIFF files of individual cells migrating over a period of time were exported from Andor iQ and analyzed using previously developed Python scripts.14 A Python script was used to convert one channel of the raw TIFF files (typically the channel containing the membrane marker or mCh-SspB) to kymographs showing cell position with respect to time. Kymograph outlines were manually traced in ImageJ, and a second Python script was used to generate plots of displacement of the cell rear over time from the traced kymographs using the known pixel dimensions of the images and the known time intervals between frames. The traces were averaged to create a mean trajectory and determine SEM.
Supplementary Material
ACKNOWLEDGMENTS
This work was funded by the NIH through NIGMS grants GM069027, GM107370, and GM122577. We thank Vani Kalyanaraman for DNA constructs.
Footnotes
Supporting Information
The Supporting Information is available free of charge on the ACS Publications website at DOI: 10.1021/acssyn-bio.8b00356.
Figures S1–S2 (PDF)
Supporting movie captions (PDF)
Movie S1 (AVI)
Movie S2 (AVI)
Movie S3 (AVI)
Movie S4 (AVI)
Movie S5 (AVI)
Movie S6 (AVI)
Movie S7 (AVI)
Movie S8 (AVI)
Movie S9 (AVI)
Movie S10 (AVI)
The authors declare no competing financial interest.
REFERENCES
- (1).Marjoram RJ, Lessey EC, and Burridge K (2014) Regulation of RhoA activity by adhesion molecules and mechanotransduction. Curr. Mol. Med 14 (2), 199–208. [DOI] [PMC free article] [PubMed] [Google Scholar]
- (2).Keren K (2011) Cell motility: the integrating role of the plasma membrane. Eur. Biophys. J 40 (9), 1013–27. [DOI] [PMC free article] [PubMed] [Google Scholar]
- (3).Dai J, and Sheetz MP (1995) Regulation of endocytosis, exocytosis, and shape by membrane tension. Cold Spring Harbor Symp. Quant. Biol 60, 567–71. [DOI] [PubMed] [Google Scholar]
- (4).Gauthier NC, Masters TA, and Sheetz MP (2012) Mechanical feedback between membrane tension and dynamics. Trends Cell Biol. 22 (10), 527–35. [DOI] [PubMed] [Google Scholar]
- (5).Tsujita K, Takenawa T, and Itoh T (2015) Feedback regulation between plasma membrane tension and membrane-bending proteins organizes cell polarity during leading edge formation. Nat. Cell Biol 17 (6), 749–58. [DOI] [PubMed] [Google Scholar]
- (6).Batchelder EL, Hollopeter G, Campillo C, Mezanges X, Jorgensen EM, Nassoy P, Sens P, and Plastino J (2011) Membrane tension regulates motility by controlling lamellipodium organization. Proc. Natl. Acad. Sci. U. S. A 108 (28), 11429–34. [DOI] [PMC free article] [PubMed] [Google Scholar]
- (7).Broders-Bondon F, Nguyen Ho-Bouldoires TH, Fernandez-Sanchez ME, and Farge E (2018) Mechanotransduction in tumor progression: The dark side of the force. J. Cell Biol 217, 1571. [DOI] [PMC free article] [PubMed] [Google Scholar]
- (8).Zhao W, Hanson L, Lou HY, Akamatsu M, Chowdary PD, Santoro F, Marks JR, Grassart A, Drubin DG, Cui Y, and Cui B (2017) Nanoscale manipulation of membrane curvature for probing endocytosis in live cells. Nat. Nanotechnol 12 (8), 750–756. [DOI] [PMC free article] [PubMed] [Google Scholar]
- (9).Sun M, Graham JS, Hegedus B, Marga F, Zhang Y, Forgacs G, and Grandbois M (2005) Multiple membrane tethers probed by atomic force microscopy. Biophys. J 89 (6), 4320–9. [DOI] [PMC free article] [PubMed] [Google Scholar]
- (10).Portet T, Gordon SE, and Keller SL (2012) Increasing membrane tension decreases miscibility temperatures; an experimental demonstration via micropipette aspiration. Biophys. J 103 (8), L35–7. [DOI] [PMC free article] [PubMed] [Google Scholar]
- (11).O’Neill PR, Kalyanaraman V, and Gautam N (2016) Subcellular optogenetic activation of Cdc42 controls local and distal signaling to drive immune cell migration. Mol. Biol. Cell 27 (9), 1442–50. [DOI] [PMC free article] [PubMed] [Google Scholar]
- (12).O’Neill PR, and Gautam N (2014) Subcellular optogenetic inhibition of G proteins generates signaling gradients and cell migration. Mol. Biol. Cell 25 (15), 2305–14. [DOI] [PMC free article] [PubMed] [Google Scholar]
- (13).Karunarathne WK, O’Neill PR, and Gautam N (2015) Subcellular optogenetics - controlling signaling and single-cell behavior. J. Cell Sci 128 (1), 15–25. [DOI] [PMC free article] [PubMed] [Google Scholar]
- (14).O’Neill PR, Castillo-Badillo JA, Meshik X, Kalyanaraman V, Melgarejo K, and Gautam N (2018) Membrane Flow Drives an Adhesion-Independent Amoeboid Cell Migration Mode. Dev. Cell 46 (1), 9–22. [DOI] [PMC free article] [PubMed] [Google Scholar]
- (15).Liu Q, and Tucker CL (2017) Engineering genetically-encoded tools for optogenetic control of protein activity. Curr. Opin. Chem. Biol 40, 17–23. [DOI] [PMC free article] [PubMed] [Google Scholar]
- (16).Pathak GP, Spiltoir JI, Hoglund C, Polstein LR, Heine-Koskinen S, Gersbach CA, Rossi J, and Tucker CL (2017) Bidirectional approaches for optogenetic regulation of gene expression in mammalian cells using Arabidopsis cryptochrome 2. Nucleic Acids Res. 45 (20), e167. [DOI] [PMC free article] [PubMed] [Google Scholar]
- (17).Guntas G, Hallett RA, Zimmerman SP, Williams T, Yumerefendi H, Bear JE, and Kuhlman B (2015) Engineering an improved light-induced dimer (iLID) for controlling the localization and activity of signaling proteins. Proc. Natl. Acad. Sci. U. S. A 112 (1), 112–7. [DOI] [PMC free article] [PubMed] [Google Scholar]
- (18).Chen Z, Atefi E, and Baumgart T (2016) Membrane Shape Instability Induced by Protein Crowding. Biophys. J 111 (9), 1823–1826. [DOI] [PMC free article] [PubMed] [Google Scholar]
- (19).Stachowiak JC, Schmid EM, Ryan CJ, Ann HS, Sasaki DY, Sherman MB, Geissler PL, Fletcher DA, and Hayden CC (2012) Membrane bending by protein-protein crowding. Nat. Cell Biol 14 (9), 944–9. [DOI] [PubMed] [Google Scholar]
- (20).Snead WT, Hayden CC, Gadok AK, Zhao C, Lafer EM, Rangamani P, and Stachowiak JC (2017) Membrane fission by protein crowding. Proc. Natl. Acad. Sci. U. S. A 114 (16), E3258–E3267. [DOI] [PMC free article] [PubMed] [Google Scholar]
- (21).McMahon HT, and Boucrot E (2015) Membrane curvature at a glance. J. Cell Sci 128 (6), 1065–70. [DOI] [PMC free article] [PubMed] [Google Scholar]
- (22).Shi Z, and Baumgart T (2015) Membrane tension and peripheral protein density mediate membrane shape transitions. Nat. Commun 6, 5974. [DOI] [PMC free article] [PubMed] [Google Scholar]
- (23).Ruprecht V, Wieser S, Callan-Jones A, Smutny M, Morita H, Sako K, Barone V, Ritsch-Marte M, Sixt M, Voituriez R, and Heisenberg CP (2015) Cortical contractility triggers a stochastic switch to fast amoeboid cell motility. Cell 160 (4), 673–85. [DOI] [PMC free article] [PubMed] [Google Scholar]
- (24).Tanaka M, Kikuchi T, Uno H, Okita K, Kitanishi-Yumura T, and Yumura S (2017) Turnover and flow of the cell membrane for cell migration. Sci. Rep 7 (1), 12970. [DOI] [PMC free article] [PubMed] [Google Scholar]
- (25).Fletcher SJ, and Rappoport JZ (2010) Moving forward: polarised trafficking in cell migration. Trends Cell Biol. 20 (2), 71–8. [DOI] [PubMed] [Google Scholar]
- (26).Guilluy C, Swaminathan V, Garcia-Mata R, O’Brien ET, Superfine R, and Burridge K (2011) The Rho GEFs LARG and GEF-H1 regulate the mechanical response to force on integrins. Nat. Cell Biol 13 (6), 722–7. [DOI] [PMC free article] [PubMed] [Google Scholar]
- (27).Huveneers S, and Danen EH (2009) Adhesion signaling - crosstalk between integrins, Src and Rho. J. Cell Sci 122 (8), 1059–69. [DOI] [PubMed] [Google Scholar]
- (28).Nordenfelt P, Elliott HL, and Springer TA (2016) Coordinated integrin activation by actin-dependent force during T-cell migration. Nat. Commun 7, 13119. [DOI] [PMC free article] [PubMed] [Google Scholar]
- (29).Huttenlocher A, and Horwitz AR (2011) Integrins in cell migration. Cold Spring Harbor Perspect. Biol 3 (9), a005074. [DOI] [PMC free article] [PubMed] [Google Scholar]
- (30).Schmidt S, and Friedl P (2010) Interstitial cell migration: integrin-dependent and alternative adhesion mechanisms. Cell Tissue Res. 339 (1), 83–92. [DOI] [PMC free article] [PubMed] [Google Scholar]
- (31).Gao J, Liao J, and Yang GY (2009) CAAX-box protein, prenylation process and carcinogenesis. Am. J. Transl. Res 1 (3), 312–25. [PMC free article] [PubMed] [Google Scholar]
- (32).Kennedy MJ, Hughes RM, Peteya LA, Schwartz JW, Ehlers MD, and Tucker CL (2010) Rapid blue-light-mediated induction of protein interactions in living cells. Nat. Methods 7 (12), 973–5. [DOI] [PMC free article] [PubMed] [Google Scholar]
- (33).Lungu OI, Hallett RA, Choi EJ, Aiken MJ, Hahn KM, and Kuhlman B (2012) Designing photoswitchable peptides using the AsLOV2 domain. Chem. Biol 19 (4), 507–17. [DOI] [PMC free article] [PubMed] [Google Scholar]
- (34).Krause M, and Gautreau A (2014) Steering cell migration: lamellipodium dynamics and the regulation of directional persistence. Nat. Rev. Mol. Cell Biol 15 (9), 577–90. [DOI] [PubMed] [Google Scholar]
- (35).Ridley AJ, Schwartz MA, Burridge K, Firtel RA, Ginsberg MH, Borisy G, Parsons JT, and Horwitz AR (2003) Cell migration: integrating signals from front to back. Science 302 (5651), 1704–9. [DOI] [PubMed] [Google Scholar]
- (36).Amano M, Nakayama M, and Kaibuchi K (2010) Rho-kinase/ROCK: A key regulator of the cytoskeleton and cell polarity. Cytoskeleton 67 (9), 545–54. [DOI] [PMC free article] [PubMed] [Google Scholar]
- (37).Van Goethem E, Poincloux R, Gauffre F, Maridonneau-Parini I, and Le Cabec V (2010) Matrix architecture dictates three-dimensional migration modes of human macrophages: differential involvement of proteases and podosome-like structures. J. Immunol 184 (2), 1049–61. [DOI] [PubMed] [Google Scholar]
- (38).Gui P, Labrousse A, Van Goethem E, Besson A, Maridonneau-Parini I, and Le Cabec V (2014) Rho/ROCK pathway inhibition by the CDK inhibitor p27(kip1) participates in the onset of macrophage 3D-mesenchymal migration. J. Cell Sci 127 (18), 4009–23. [DOI] [PubMed] [Google Scholar]
- (39).Wolf K, Mazo I, Leung H, Engelke K, von Andrian UH, Deryugina EI, Strongin AY, Brocker EB, and Friedl P (2003) Compensation mechanism in tumor cell migration: mesenchymal-amoeboid transition after blocking of pericellular proteolysis. J. Cell Biol 160 (2), 267–77. [DOI] [PMC free article] [PubMed] [Google Scholar]
- (40).Pankova K, Rosel D, Novotny M, and Brabek J (2010) The molecular mechanisms of transition between mesenchymal and amoeboid invasiveness in tumor cells. Cell. Mol. Life Sci 67 (1), 63–71. [DOI] [PMC free article] [PubMed] [Google Scholar]
- (41).Clark AG, and Vignjevic DM (2015) Modes of cancer cell invasion and the role of the microenvironment. Curr. Opin. Cell Biol 36, 13–22. [DOI] [PubMed] [Google Scholar]
- (42).Friedl P, and Wolf K (2003) Tumour-cell invasion and migration: diversity and escape mechanisms. Nat. Rev. Cancer 3 (5), 362–74. [DOI] [PubMed] [Google Scholar]
- (43).Oakes PW (2018) Balancing forces in migration. Curr. Opin. Cell Biol 54, 43–49. [DOI] [PMC free article] [PubMed] [Google Scholar]
- (44).Huang Q, Hu X, He W, Zhao Y, Hao S, Wu Q, Li S, Zhang S, and Shi M (2018) Fluid shear stress and tumor metastasis. Am. J. Cancer Res 8 (5), 763–777. [PMC free article] [PubMed] [Google Scholar]
- (45).Lee HJ, Diaz MF, Price KM, Ozuna JA, Zhang S, Sevick-Muraca EM, Hagan JP, and Wenzel PL (2017) Fluid shear stress activates YAP1 to promote cancer cell motility. Nat. Commun 8, 14122. [DOI] [PMC free article] [PubMed] [Google Scholar]
- (46).Butcher DT, Alliston T, and Weaver VM (2009) A tense situation: forcing tumour progression. Nat. Rev. Cancer 9 (2), 108–22. [DOI] [PMC free article] [PubMed] [Google Scholar]
- (47).Gauthier NC, Fardin MA, Roca-Cusachs P, and Sheetz MP (2011) Temporary increase in plasma membrane tension coordinates the activation of exocytosis and contraction during cell spreading. Proc. Natl. Acad. Sci. U. S. A 108 (35), 14467–72. [DOI] [PMC free article] [PubMed] [Google Scholar]
- (48).Pontes B, Monzo P, Gole L, Le Roux AL, Kosmalska AJ, Tam ZY, Luo W, Kan S, Viasnoff V, Roca-Cusachs P, Tucker-Kellogg L, and Gauthier NC (2017) Membrane tension controls adhesion positioning at the leading edge of cells. J. Cell Biol 216 (9), 2959–2977. [DOI] [PMC free article] [PubMed] [Google Scholar]
- (49).Sens P, and Plastino J (2015) Membrane tension and cytoskeleton organization in cell motility. J. Phys.: Condens. Matter 27 (27), 273103. [DOI] [PubMed] [Google Scholar]
- (50).Busch DJ, Houser JR, Hayden CC, Sherman MB, Lafer EM, and Stachowiak JC (2015) Intrinsically disordered proteins drive membrane curvature. Nat. Commun 6, 7875. [DOI] [PMC free article] [PubMed] [Google Scholar]
- (51).Jarsch IK, Daste F, and Gallop JL (2016) Membrane curvature in cell biology: An integration of molecular mechanisms. J. Cell Biol 214 (4), 375–87. [DOI] [PMC free article] [PubMed] [Google Scholar]
- (52).Sinha B, Koster D, Ruez R, Gonnord P, Bastiani M, Abankwa D, Stan RV, Butler-Browne G, Vedie B, Johannes L, Morone N, Parton RG, Raposo G, Sens P, Lamaze C, and Nassoy P (2011) Cells respond to mechanical stress by rapid disassembly of caveolae. Cell 144 (3), 402–13. [DOI] [PMC free article] [PubMed] [Google Scholar]
- (53).Scott BL, Sochacki KA, Low-Nam ST, Bailey EM, Luu Q, Hor A, Dickey AM, Smith S, Kerkvliet JG, Taraska JW, and Hoppe AD (2018) Membrane bending occurs at all stages of clathrin-coat assembly and defines endocytic dynamics. Nat. Commun 9 (1), 419. [DOI] [PMC free article] [PubMed] [Google Scholar]
- (54).Apodaca G (2002) Modulation of membrane traffic by mechanical stimuli. Am. J. Physiol Renal Physiol 282 (2), F179–90. [DOI] [PubMed] [Google Scholar]
- (55).Gauthier NC, Rossier OM, Mathur A, Hone JC, and Sheetz MP (2009) Plasma membrane area increases with spread area by exocytosis of a GPI-anchored protein compartment. Mol. Biol. Cell 20 (14), 3261–72. [DOI] [PMC free article] [PubMed] [Google Scholar]
- (56).Mim C, and Unger VM (2012) Membrane curvature and its generation by BAR proteins. Trends Biochem. Sci 37 (12), 526–33. [DOI] [PMC free article] [PubMed] [Google Scholar]
- (57).Puklin-Faucher E, and Sheetz MP (2009) The mechanical integrin cycle. J. Cell Sci 122 (2), 179–86. [DOI] [PMC free article] [PubMed] [Google Scholar]
- (58).Sun Z, Guo SS, and Fassler R (2016) Integrin-mediated mechanotransduction. J. Cell Biol 215 (4), 445–456. [DOI] [PMC free article] [PubMed] [Google Scholar]
- (59).Wang F (2009) The signaling mechanisms underlying cell polarity and chemotaxis. Cold Spring Harbor Perspect. Biol 1 (4), a002980. [DOI] [PMC free article] [PubMed] [Google Scholar]
- (60).Schiller HB, Hermann MR, Polleux J, Vignaud T, Zanivan S, Friedel CC, Sun Z, Raducanu A, Gottschalk KE, Thery M, Mann M, and Fassler R (2013) beta1- and alphav-class integrins cooperate to regulate myosin II during rigidity sensing of fibronectin-based microenvironments. Nat. Cell Biol 15 (6), 625–36. [DOI] [PubMed] [Google Scholar]
- (61).Danen EH, van Rheenen J, Franken W, Huveneers S, Sonneveld P, Jalink K, and Sonnenberg A (2005) Integrins control motile strategy through a Rho-cofilin pathway. J. Cell Biol 169 (3), 515–26. [DOI] [PMC free article] [PubMed] [Google Scholar]
- (62).Luque A, Gomez M, Puzon W, Takada Y, Sanchez-Madrid F, and Cabanas C (1996) Activated conformations of very late activation integrins detected by a group of antibodies (HUTS) specific for a novel regulatory region (355–425) of the common beta 1 chain. J. Biol. Chem 271 (19), 11067–75. [DOI] [PubMed] [Google Scholar]
- (63).Humphries MJ, Symonds EJ, and Mould AP (2003) Mapping functional residues onto integrin crystal structures. Curr. Opin. Struct. Biol 13 (2), 236–43. [DOI] [PubMed] [Google Scholar]
- (64).Campbell ID, and Humphries MJ (2011) Integrin structure, activation, and interactions. Cold Spring Harbor Perspect. Biol 3 (3), a004994. [DOI] [PMC free article] [PubMed] [Google Scholar]
- (65).Orlando C, Ster J, Gerber U, Fawcett JW, and Raineteau O (2012) Perisynaptic chondroitin sulfate proteoglycans restrict structural plasticity in an integrin-dependent manner. J. Neurosci 32 (50), 18009–17. [DOI] [PMC free article] [PubMed] [Google Scholar]
- (66).Tzima E, Irani-Tehrani M, Kiosses WB, Dejana E, Schultz DA, Engelhardt B, Cao G, DeLisser H, and Schwartz MA (2005) A mechanosensory complex that mediates the endothelial cell response to fluid shear stress. Nature 437 (7057), 426–31. [DOI] [PubMed] [Google Scholar]
- (67).Askari JA, Buckley PA, Mould AP, and Humphries MJ (2009) Linking integrin conformation to function. J. Cell Sci 122 (2), 165–70. [DOI] [PMC free article] [PubMed] [Google Scholar]
- (68).Kim M, Carman CV, and Springer TA (2003) Bidirectional transmembrane signaling by cytoplasmic domain separation in integrins. Science 301 (5640), 1720–5. [DOI] [PubMed] [Google Scholar]
- (69).Calderwood DA (2004) Integrin activation. J. Cell Sci 117 (5), 657–66. [DOI] [PubMed] [Google Scholar]
- (70).Kiosses WB, Shattil SJ, Pampori N, and Schwartz MA (2001) Rac recruits high-affinity integrin alphavbeta3 to lamellipodia in endothelial cell migration. Nat. Cell Biol 3 (3), 316–20. [DOI] [PubMed] [Google Scholar]
- (71).Lorentzen A, Bamber J, Sadok A, Elson-Schwab I, and Marshall CJ (2011) An ezrin-rich, rigid uropod-like structure directs movement of amoeboid blebbing cells. J. Cell Sci 124 (8), 1256–67. [DOI] [PubMed] [Google Scholar]
- (72).Lammermann T, Bader BL, Monkley SJ, Worbs T, Wedlich-Soldner R, Hirsch K, Keller M, Forster R, Critchley DR, Fassler R, and Sixt M (2008) Rapid leukocyte migration by integrin-independent flowing and squeezing. Nature 453 (7191), 51–5. [DOI] [PubMed] [Google Scholar]
- (73).Karunarathne WK, Giri L, Patel AK, Venkatesh KV, and Gautam N (2013) Optical control demonstrates switch-like PIP3 dynamics underlying the initiation of immune cell migration. Proc. Natl. Acad. Sci. U. S. A 110 (17), E1575–83. [DOI] [PMC free article] [PubMed] [Google Scholar]
- (74).Karunarathne WK, Giri L, Kalyanaraman V, and Gautam N (2013) Optically triggering spatiotemporally confined GPCR activity in a cell and programming neurite initiation and extension. Proc. Natl. Acad. Sci. U. S. A 110 (17), E1565–74. [DOI] [PMC free article] [PubMed] [Google Scholar]
- (75).Lessey EC, Guilluy C, and Burridge K (2012) From mechanical force to RhoA activation. Biochemistry 51 (38), 7420–32. [DOI] [PMC free article] [PubMed] [Google Scholar]
- (76).Mitra SK, and Schlaepfer DD (2006) Integrin-regulated FAK-Src signaling in normal and cancer cells. Curr. Opin. Cell Biol 18 (5), 516–23. [DOI] [PubMed] [Google Scholar]
- (77).Shang X, Marchioni F, Evelyn CR, Sipes N, Zhou X, Seibel W, Wortman M, and Zheng Y (2013) Small-molecule inhibitors targeting G-protein-coupled Rho guanine nucleotide exchange factors. Proc. Natl. Acad. Sci. U. S. A 110 (8), 3155–60. [DOI] [PMC free article] [PubMed] [Google Scholar]
- (78).Fujishiro SH, Tanimura S, Mure S, Kashimoto Y, Watanabe K, and Kohno M (2008) ERK1/2 phosphorylate GEF-H1 to enhance its guanine nucleotide exchange activity toward RhoA. Biochem. Biophys. Res. Commun 368 (1), 162–7. [DOI] [PubMed] [Google Scholar]
- (79).Scott DW, Tolbert CE, and Burridge K (2016) Tension on JAM-A activates RhoA via GEF-H1 and p115 RhoGEF. Mol. Biol. Cell 27 (9), 1420–30. [DOI] [PMC free article] [PubMed] [Google Scholar]
- (80).Webb DJ, Donais K, Whitmore LA, Thomas SM, Turner CE, Parsons JT, and Horwitz AF (2004) FAK-Src signalling through paxillin, ERK and MLCK regulates adhesion disassembly. Nat. Cell Biol 6 (2), 154–61. [DOI] [PubMed] [Google Scholar]
- (81).Meshik X, O’Neill PR, and Gautam N (2018) Optogenetic Control of Cell Migration. Methods Mol. Biol 1749, 313–324. [DOI] [PubMed] [Google Scholar]
Associated Data
This section collects any data citations, data availability statements, or supplementary materials included in this article.


