

Abstract

The synthesis of a new solid solution of the oxyhydroxide Ga5–xAlxO7(OH) is investigated via solvothermal reaction between gallium acetylacetonate and aluminum isopropoxide in 1,4-butanediol at 240 °C. A limited compositional range of 0 ≤ x ≤ 1.5 is produced, with the hexagonal unit cell parameters refined from powder X-ray diffraction (XRD) showing a linear contraction in unit cell volume with an increase in Al content. Solid-state 27Al and 71Ga nuclear magnetic resonance (NMR) spectroscopies show a strong preference for Ga to occupy the tetrahedral sites and Al to occupy the octahedral sites. Using isopropanol as the solvent, γ-Ga2–xAlxO3 defect spinel solid solutions with x ≤ 1.8 can be prepared at 240 °C in 24 h. These materials are nanocrystalline, as evidenced by their broad diffraction profiles; however, the refined cubic lattice parameter shows a linear relationship with the Ga:Al content, and solid-state NMR spectroscopy again shows a preference for Al to occupy the octahedral sites. Thermal decomposition of Ga5–xAlxO7(OH) occurs via poorly ordered materials that resemble ε-Ga2–xAlxO3 and κ-Ga2–xAlxO3, but γ-Ga2–xAlxO3 transforms above 750 °C to monoclinic β-Ga2–xAlxO3 for 0 ≤ x ≤ 1.3 and to hexagonal α-Ga2–xAlxO3 for x = 1.8, with intermediate compositions of 1.3 < x < 1.8 giving mixtures of the α- and β-polymorphs. Solid-state NMR spectroscopy shows only the expected octahedral Al for α-Ga2–xAlxO3, and for β-Ga2–xAlxO3, the ∼1:2 tetrahedral:octahedral Al ratio is in good agreement with the results of Rietveld analysis of the average structures against powder XRD data. Relative energies calculated by periodic density functional theory confirm that there is an ∼5.2 kJ mol–1 penalty for tetrahedral rather than octahedral Al in Ga5–xAlxO7(OH), whereas this penalty is much smaller (∼2.0 kJ mol–1) for β-Ga2–xAlxO3, in good qualitative agreement with the experimental NMR spectra.
Short abstract
Solvothermal reactions in 1,4-butanediol or isopropanol yield a new solid solution of the oxyhydroxide Ga5−xAlxO7(OH) or the spinel series γ-Ga2−xAlxO3, respectively. We have explored the possible composition range and the thermal stability of the materials. For γ-Ga2−xAlxO3 (x ≤ 1.3), transformation to the monoclinic β-polymorph occurs above 1000 °C, providing a convenient route to this material of interest for electronic applications.
Introduction
Polymorphism in the Al–O, Al–(OH), and Al–O–(OH) systems is well-established and has been researched extensively, in part owing to the huge importance of aluminum oxide polymorphs as supports for precious metals and other reactive species in many areas of catalysis.1,2 Alumina polymorphs (in particular γ-Al2O3) are used not only as catalyst supports but also as adsorbents, coatings, soft abrasives, or catalysts themselves, owing to their typically large surface areas and high surface activity.3 At least 11 oxides, hydroxides, and oxyhydroxides of aluminum are known.1 The thermodynamically stable polymorph of alumina, at room temperature and pressure, is α-Al2O3 (corundum), and all metastable aluminas, commonly termed transition aluminas in industry, convert to this polymorph at a sufficiently high temperature.
Gallium oxide polymorphism had received comparatively little attention until 5 years ago, when an interest in the electronic properties of various forms of the materials has attracted a growing amount of attention,4 in particular in microelectronics where the large band gap of β-Ga2O3 offers new possibilities in high-frequency power devices,5 but also in photocatalysis where mixtures of polymorphs can lead to cooperative behavior at phase junctions.6,7 Much of the previous understanding of the structures of gallium oxide polymorphs stemmed from the work of Roy and co-workers in the 1950s,8,9 and until recently, the polymorphism in the Ga–O, Ga–(OH), and Ga–O–(OH) systems remained poorly characterized despite a large number of publications on the structural characterization of gallium oxide.10−14 The recent work of some of us clarified the structures of a number of gallium oxide polymorphs, some of which contain inherent structural disorder leading to poor crystallinity.15,16 The thermodynamically stable polymorph under ambient conditions is the monoclinic β-polymorph (in contrast to the α-polymorph for aluminum oxide) whose structure contains a 1:1 octahedral:tetrahedral cation ratio, both in distorted coordination geometry.17 α-Ga2O3, structurally analogous to α-Al2O3, is metastable, but β-Ga2O3 irreversibly converts to this polymorph at high pressure because α-Ga2O3 has a smaller molar volume.18 The cation-defective spinel γ-Ga2O3 can be prepared directly by oxidation of gallium metal in an aminoalcohol.15,16,19 γ-Ga2O3 is structurally analogous to γ-Al2O3,20 both having disordered spinel structures containing small amounts of cations occupying nonspinel sites in the unit cell yet allowed in the Fd3̅m space group.16 Other less well-characterized forms of Ga2O3 include the ε- and κ-polymorphs, whose preparation is complicated by their transient nature during thermal decompositions of other gallium oxides or oxyhydroxides.15
Given the present interest in the electronic properties of gallium oxides, it is timely to consider the polymorphism of solid solutions of gallium and aluminum oxides. As noted above, although the two binary oxide systems show similarities in the types of structures adopted, they show different relative stabilities and, in fact, are accessed by different synthesis approaches. The greater preference of tetrahedral coordination by gallium is of note, and this could lead to stabilization of the various polymorphs at different temperature ranges and may alter the properties, such as surface chemistry for catalysis, or the band gap for electronic applications. Roy and co-workers reported on the polymorphism in the Ga–Al–O system in the 1950s at the same time as they performed their research with Ga2O3 polymorphism.21 von Wartenberg and Reusch had previously shown in 1932 that solid solutions of β-Ga2–xAlxO3 could be prepared at high temperatures, one of the earliest papers detailing polymorphism in the Ga–Al–O system.22 A hexagonal phase with a composition of GaAlO3 was reported by Roy and co-workers, via hydrothermal routes, although its structure was not assigned.21 This material was later investigated by MacDonald et al.,23 and several possible hexagonal space groups were suggested on the basis of systematic absences in powder X-ray diffraction (XRD) patterns, and other new ternary phases also reported. More recent work by Inoue and co-workers on the Ga–Al–O system used solvothermal synthesis to prepare γ-Ga2–xAlxO3 defect spinels.24−28 These mixed-metal γ-Ga2–xAlxO3 spinels have been explored for some catalysis applications, including their use in the selective catalytic reduction (SCR) of NO by methane,25,27−31 dehydrogenation of propane,32,33 and dimethyl ether steam re-forming.34 γ-Ga2O3 supported on γ-Al2O3 has been applied for photocatalysis.35
Experimental Section
Solvothermal synthesis of mixed aluminum–gallium oxides was investigated using temperatures lower than those applied previously by Inoue and co-workers24−28 using either 1,4-butanediol or isopropanol as a solvent. Solvothermal synthesis of the solid solution Ga5–xAlxO7(OH) was achieved from 0.4 g (1.01 mmol) of Ga(acac)3 (Sigma, 99.99%), where acac is acetylacetonate, and an appropriate amount of Al(acac)3 (Merck, ≥98%), which were added to a 20 mL PTFE liner followed by the addition of 8 mL of 1,4-butanediol. The reaction mixture was stirred at room temperature for 10 min before being sealed inside a stainless-steel autoclave and placed inside a preheated fan-assisted oven at 240 °C for 96 h. Then, the autoclave was allowed to cool naturally to ambient temperature, and the vessel opened to reveal a white powder, which was dispersed by magnetic stirring in the mother liquor followed by addition of acetone to reduce the viscosity of the diol. The material was then collected by suction filtration, washed with additional acetone, and dried overnight at 70 °C. To form γ-(Al1–xGax)2O3, 0.4 g (1.01 mmol) of Ga(acac)3 (Aldrich, 99.99%) and an appropriate amount of Al(OiPr)3 (Aldrich, ≥98%), to give a (2 – x):x Ga:Al molar ratio (0 ≤ x ≤ 1.8), were added to a PTFE liner followed by the addition of 10 mL of isopropanol. The reaction mixture was stirred at room temperature for 5 min before being sealed inside a stainless-steel autoclave and placed inside a preheated fan-assisted oven at 240 °C for 24 h. The autoclave was allowed to cool naturally to ambient temperature, and the white solid product was collected by suction filtration and then washed with copious amounts of acetone before being dried at 70 °C overnight. Thermal decomposition of the solvothermally prepared materials to β-(Al1–xGax)2O3 and α-(Al1–xGax)2O3 was guided by thermodiffractometry experiments (see below), and materials were then heated in air in muffle furnaces to 1400 °C.
Powder XRD patterns were recorded at room temperature using a Panalytical X’Pert Pro MPD instrument operating with monochromatic Cu Kα1 radiation and equipped with a PIXcel solid-state detector. Full pattern analysis of powder patterns was performed using the Pawley method within the TOPAS software to determine lattice parameters.36 A Bruker D8 Advance powder diffractometer operating with Cu Kα1/2 radiation and equipped with a VÅNTEC-1 solid-state detector with an Anton Parr XRK900 chemical reaction chamber was used to collect powder XRD data with in situ heating. A typical data collection involved heating from 30 to 810 or 900 °C at a rate of 10 °C min–1 with 30 °C intervals holding for 300 s at each interval prior to data collection to allow the temperature to equilibrate.
Scanning electron microscopy (SEM) images were recorded using a ZEISS GEMINI instrument. A small amount of sample was placed on carbon tape prior to analysis. Transmission electron microscopy (TEM) was performed using a JEOL 2000FX instrument with samples placed on holey carbon copper grids via dispersion in acetone.
Thermogravimetric analysis (TGA) coupled with differential scanning calorimetry (DSC) was used to determine mass loss in samples upon heating from room temperature to usually 1000 °C using a Mettler Toledo TGA/DSC 1-600 instrument.
Solid-state 1H nuclear magnetic resonance (NMR) spectra were recorded using a Bruker Avance III spectrometer equipped with a 14.1 T wide-bore superconducting magnet (Larmor frequency of 600.13 MHz) and standard Bruker 1.3 mm magic angle spinning (MAS) probe (MAS rate of 55 kHz) at the University of St Andrews. 1H MAS NMR spectra were recorded with signal averaging for 16 transients with a recycle interval of 60 s. Chemical shifts are reported in parts per million relative to tetramethylsilane using l-alanine as a secondary solid reference (δCH3 = 20.5 ppm).
Solid-state 27Al NMR spectra were recorded using a Bruker Avance III spectrometer equipped with a 14.1 T wide-bore superconducting magnet (Larmor frequency of 156.4 MHz) and a standard Bruker 3.2 mm MAS probe (MAS rate of 20 kHz) at the University of St Andrews. 27Al MAS NMR spectra were recorded with signal averaging for 1024–4096 transients with a recycle interval of 0.5 s for all materials apart except the β-Ga2–xAlxO3 series, for which a recycle interval of 3 s was used. An excitation pulse with an inherent flip angle of ∼4° was used to enable accurate quantitation. 1H–27Al cross-polarization (CP) MAS NMR spectra were recorded with a spin-lock pulse (ramped for 1H) of 1 ms, and high-power continuous wave decoupling of 1H (ν1 ≈ 80 kHz) was applied during acquisition. Signal averaging was carried out for 10240–20480 transients with a recycle interval of 3 s. 27Al multiple-quantum (MQ) MAS NMR spectra were recorded using an amplitude-modulated z-filtered experiment.37 Signal averaging was carried out for 240–1008 transients for each of up to 160 t1 increments of 25 μs with a recycle interval of 0.5 s. Spectra are shown after shearing and referencing according to Pike et al.38 Chemical shifts are reported in parts per million relative to 1.1 M Al(NO3)3 using Al(acac)3 as a secondary solid reference (δiso = 0.0 ppm).
Solid-state 71Ga NMR spectra were recorded using either a Bruker Avance II or Bruker Avance NEO console equipped with a 20.0 T wide-bore superconducting magnet (Larmor frequency of 259.3 MHz) and Bruker 1.3 mm double-broadband HXY probe (MAS rates of 50–55 kHz) or JEOL 1 mm double-resonance probe (MAS rate of 75 kHz) at the UK 850 MHz solid-state NMR facility. 71Ga MAS NMR spectra were recorded using a rotor-synchronized spin-echo pulse sequence with an echo delay of one rotor period (i.e., 13.3–20.0 μs). Signal averaging was carried out for 3360–56000 transients with a recycle interval of 0.5–2 s. Chemical shifts are reported in parts per million relative to aqueous Ga(NO3)3 using either LaGaO3 (δiso = 57 ppm) or GaPO4 berlinite (δiso = 111.2 ppm) as secondary solid references.
The calculation of NMR parameters was carried out using the CASTEP density functional theory (DFT) code (version 18.1),39 employing the gauge-including projector-augmented wave (GIPAW) approach40 to reconstruct the all-electron wave function in the presence of a magnetic field. Calculations were performed using the GGA PBE functional,41 with dispersion corrections provided by the scheme of Tkatchenko and Scheffler.42,43 Ultrasoft pseudopotentials were used with the inclusion of ZORA scalar relativistic effects. (A modified pseudopotential was used for gallium; see the Supporting Information for more details.) A plane-wave energy cutoff of 60 Ry (∼816 eV) was used, and integrals over the first Brillouin zone were performed using a Monkhorst–Pack grid44 with a k-point spacing of 0.03 or 0.04 2π Å–1. Optimization of atomic coordinates and unit cell parameters was carried out prior to the calculation of NMR parameters. Calculations were performed on a computing cluster at the University of St Andrews, consisting of 90 32-core Intel Broadwell nodes, an Infiniband FDR interconnect, and a 300 TB GPFS distributed file system. Typical calculation times were between 3–10 h (geometry optimization) and ∼1 h (NMR parameters), using 48 cores. Isotropic shieldings, σiso, were obtained from the trace of the absolute shielding tensor, σ, and isotropic chemical shifts, δiso, were given by δiso = −(σiso – σref)/m, where σref and m had values of 562.4 ppm and 1.07 for 27Al and 1740 ppm and 1.01 for 71Ga, respectively (see the Supporting Information). The quadrupolar coupling constant (CQ = eQVZZ/h) and the asymmetry parameter [ηQ = (VXX – VYY)/VZZ] are obtained directly from the principal components of the electric field gradient tensor, V. Q is the nuclear quadrupole moment,45 for which values of 146.6 and 107 mb were used for 27Al and 71Ga, respectively.
Results and Discussion
Ga5–xAlxO7(OH)
The hitherto unreported Ga5–xAlxO7(OH) solid solution can be achieved for a composition range of 0 ≤ x ≤ 1.5 from solvothermal reaction between Ga(acac)3 and Al(OiPr)3 in 1,4-butanediol for 96 h at 240 °C. The synthesis method is similar to that reported by Inoue and co-workers, who used solvothermal reactions to prepare γ-Ga2–xAlxO3,24 but we have used lower temperatures and extended reaction times. The previous synthetic work was performed at 300 °C for just 2 h in a nitrogen atmosphere, and the only products found in 1,4-butanediol were γ-Ga2–xAlxO3 materials (x ≤ 1.5). We found that shorter reaction times at 240 °C were unreliable as a synthesis route, yielding either γ-Ga2O3 with AlOOH, γ-Ga2–xAlxO3, or GaOOH. We found that the same reaction can be performed in 1,5-pentanediol, but the synthesis time must be even longer, requiring a minimum of 7 days, with shorter reaction times yielding only amorphous materials. Figure 1 shows powder XRD profiles fitted using the Pawley refinement method against data from Ga5–xAlxO7(OH) samples with x values of 0, 0.5, 1.0, and 1.5. These fits were performed using space group P63̅mc, with initial lattice parameters from the published structure of Ga5O7(OH).15 Clear evidence of anisotropic peak broadening was found in all three samples, although this is less prominent with an increase in Al3+ content, as there is an increase in the overall level of static disorder within the material, such that all reflections are further broadened. The use of Stephens’ phenomenological model of anisotropic peak broadening46 was essential to obtain a satisfactory profile fit. Figure 2 shows the evolution of the lattice parameters with Ga:Al ratio (see Table S1 for values of lattice parameters). The variation of the unit cell volume with elemental substitution follows Vegard’s law, with the volume of the material linearly decreasing with an increasing level of aluminum substitution. Infrared spectroscopy shows an intense O–H stretching mode observed at 3300 cm–1 (Figure S1), and a feature at 850 cm–1 that is attributed to a (Ga,Al)–O–H bending mode, as a mode at a similar wavenumber was assigned to this in both Ga5O7(OH)15 and in a computational study on Al5O7(OH).47 Solid-state 1H NMR spectra of the Ga5–xAlxO7(OH) materials (Figure S2) also confirm the presence of (Ga,Al)–OH species, with chemical shifts between 7.7 and 8.0 ppm.
Figure 1.

Pawley refinements against powder XRD data (λ = 1.54059 Å) for Ga5–xAlxO7(OH) (0 ≤ x ≤ 1.5), with insets showing the fit to a region of the data when the Stephens’ parameters were not used to correct for anisotropic peak broadening.
Figure 2.

Plot of (a) hexagonal lattice parameters and (b) unit cell volume vs composition for Ga5–xAlxO7(OH). The values for the end members (■) are taken from the literature for x values of 015 and 5.48 The x values of 0.5, 1, and 1.5 (□) were determined in this work, while the values of 2.5 (●) are those reported for “hexagonal GaAlO3” by Macdonald et al.23 The linear fits (gray lines) are the result of linear regression analysis against all of the data points.
MacDonald et al. reported a phase they identified as GaAlO3 in 1967, and their refined lattice parameters (a = 5.70 Å, c = 8.92 Å, and V = 251.0 Å3),23 fit very well with the trend in unit cell volume seen in Figure 2. It seems likely the oxyhydroxides that we now report are related materials, with the earlier assignment of composition incorrect (note that the previous work used high-temperature hydrothermal synthesis, which may have given access to materials with a greater Al content than we have achieved). Ga5O7(OH) and Al5O7(OH) are forms of the mineral 5Al2O3·H2O, known as akdalaite,49 with a synthetic form of the material initially described as tohdite.50,51 It is interesting to note that there are no reported non-aqueous solvothermal syntheses of Al5O7(OH), and it is usually synthesized by treating aluminum salts, or aluminum oxides, hydrothermally at temperatures in excess of 240 °C, typically with the application of external pressure.50 We found that Al5O7(OH) could not be prepared by reaction of either Al(OiPr)3 or Al(acac)3 in 1,4-butanediol at 240 °C, despite a wide range of reaction times being investigated.
TGA of Ga3.5Al1.5O7(OH) shows that a gradual mass loss of 1.5% commences immediately upon heating to ∼400 °C, followed by a larger mass loss of 2.5% occurring between 400 and 600 °C (Figure S3). This second mass loss is consistent with the dehydration of Ga3.5Al1.5O7(OH) because it occurs over the same temperature range over which the material is observed to decompose in the thermodiffractometry experiment (see below), and the mass loss of 2.5% is consistent with the expected mass loss of ∼2.2% on conversion to “Ga1.4Al0.6O3”. The first observed gradual mass loss could possibly be attributed to the loss of excess surface diol. TEM shows that Ga3.5Al1.5O7(OH) consists of large, thin hexagonal plates (Figure 3). The anisotropic peak broadening observed by XRD is likely a consequence of the morphology of the material, as was also reported for the pure gallium analogue.15
Figure 3.

(a) SEM image and (b) TEM image of Ga3.5Al1.5O7(OH).
The structure of Ga5O7(OH) contains both tetrahedral and octahedral sites for the trivalent cations, occupied in a 1:4 ratio.15 Given the different coordination preferences of Al and Ga, solid-state NMR spectroscopy was used to determine the relative proportion of each site occupied in the samples of Ga5–xAlxO7(OH) with x values of 0, 0.5, 1, and 1.5.
In oxides, the 27Al isotropic chemical shift ranges for tetrahedral and octahedral coordination environments are well separated at 80 to 50 and 15 to −10 ppm, respectively.52 In principle, the same is true for 71Ga NMR, which has isotropic chemical shift ranges of approximately 220 to 110 ppm and approximately 80 to −40 ppm for tetrahedrally and octahedrally coordinated Ga, respectively,52 but the larger second-order quadrupolar broadening usually requires the use of higher external magnetic fields (here, B0 = 20.0 T) to afford sufficiently high resolution to allow accurate quantitation of these species.16Figure 4a shows the 71Ga MAS NMR spectrum of Ga5O7(OH), which contains three resonances with NMR parameters listed in Table 1 (indicated by the red and gray lines in Figure 4a). These resonances can be assigned by their isotropic chemical shifts and relative intensities to octahedral Ga1 (δiso = 80 ppm), octahedral Ga2 (δiso = 20 ppm), and tetrahedral Ga3 (δiso = 132 ppm) in the structure of Ga5O7(OH) reported by Playford et al.15 The relatively small quadrupolar coupling constant (CQ) observed for Ga2 indicates that its coordination environment is close to ideal, whereas the much larger CQ observed for Ga1 reflects the fact that this site is coordinated by five oxides and one hydroxide, leading to a lowering of the local symmetry, a distortion of the coordination environment, and a much larger electric field gradient (EFG, responsible for the magnitude of CQ(53)) at the Ga site. Interestingly, the signal attributed to tetrahedral Ga3 also displays a very large CQ compared to that of the β-polymorph of Ga2O3 (∼11 MHz for the tetrahedral site).16 However, it can be seen from the structure of Playford et al.15 that this site in Ga5O7(OH) is significantly distorted, with O–Ga–O angles ranging from 102° to 115°.
Figure 4.

(a) 71Ga (20.0 T, 75 kHz MAS) NMR spectrum of Ga5O7(OH) (black), spectrum simulated using the parameters given in Table 1 (red), and individual line shapes corresponding to the three Ga signals (gray). (b) 71Ga (20.0 T, 55 kHz MAS) NMR spectra, (c) 27Al (14.1 T, 20 kHz MAS) NMR spectra, and (d) δ1 projections of 27Al (14.1 T, 20 kHz MAS) MQMAS NMR spectra (see Figure S4 for two-dimensional spectra) of Ga5–xAlxO7(OH) (x = 0.5, 1.0, and 1.5).
Table 1. 71Ga NMR Parameters of Ga5O7(OH) Obtained from Fitting the Spectrum in Figure 4a.
| site | relative integral | δiso (ppm) | CQ (MHz) | ηQ |
|---|---|---|---|---|
| Ga1 | 3.0 | 81(2) | 11.3(2) | 0.75(5) |
| Ga2 | 1.0 | 20(2) | 5.7(2) | 0.05(5) |
| Ga3 | 1.0 | 132(5) | 15.0(2) | 0.05(2) |
Panels b and c of Figure 4 show 71Ga and 27Al MAS NMR spectra of Ga5–xAlxO7(OH) (x = 0.5, 1.0, and 1.5). It is particularly apparent from the 27Al NMR spectra that the Al shows a strong preference for substitution in the octahedral sites, with an AlIV:AlVI ratio of ∼1:220 observed for Ga3.5Al1.5O7(OH) (cf. 1:4 for random substitution). Interpreting the 71Ga NMR spectra is more challenging as the resonances are not as well resolved as for 27Al, and the signal from tetrahedral Ga3 is so broad that it is difficult to detect visually that its relative proportion is increasing. Accurate spectral decomposition also becomes more challenging as the local disorder introduced by Al leads to further broadening of the spectral resonances. High-resolution 27Al multiple-quantum (MQ) MAS NMR spectra were recorded for these materials, and the isotropic (δ1) projections are shown in Figure 4d (see Figure S4 for the two-dimensional spectra). Surprisingly, the MQMAS spectra reveal three signals for octahedral Al for all three compositions. While it is not possible to extract δiso and CQ directly from the MQMAS spectrum of a disordered material (owing to the distribution of these two parameters arising from the inherent distribution of chemical sites present),54 the position of the center of gravity of a resonance within the spectrum can still provide information about the mean chemical shift, ⟨δiso⟩, and mean quadrupolar product,53⟨PQ⟩, where
| 1 |
Table 2 reports these mean values for the three resonances observed for each of the three samples of Ga5–xAlxO7(OH). The first, signal I, has values of ⟨δiso⟩ and ⟨PQ⟩ similar to those predicted for substitution of Al onto site 1 and signal III values similar to those predicted for substitution onto site 2. Signal II, however, has a ⟨δiso⟩ value consistent with substitution onto site 1 but a different ⟨PQ⟩, suggesting some variation in the local or medium-range environment.
Table 2. 27Al NMR Parameters of Ga5–xAlxO7(OH) Obtained from the MQMAS Spectra Shown in Figure S4 (and the corresponding projections shown in Figure 4d).
| Ga4.5Al0.5O7OH |
Ga4.0Al1.0O7OH |
Ga3.5Al1.5O7OH |
||||
|---|---|---|---|---|---|---|
| ⟨δiso⟩ (ppm) | ⟨PQ⟩ (MHz) | ⟨δiso⟩ (ppm) | ⟨PQ⟩ (MHz) | ⟨δiso⟩ (ppm) | ⟨PQ⟩ (MHz) | |
| signal I | 21(1) | 4.6(2) | 21(1) | 4.7(2) | 20(1) | 5.1(2) |
| signal II | 20(1) | 3.5(2) | 19(1) | 3.8(2) | 18(1) | 3.8(2) |
| signal III | 11(1) | 2.2(2) | 11(1) | 2.1(2) | 11(1) | 2.1(2) |
DFT calculations can often be used to provide insight into the NMR spectra of disordered materials where the disorder arises from simple substitutions of one atom for another,54 as is expected to be the case for Ga5–xAlxO7OH. In this case, seven model structures were generated by substituting one or two Al atoms into the structure of Ga5O7OH of Playford et al.,15 corresponding to 10% or 20% Al substitution, respectively. For further details of the model structures, see section S2 of the Supporting Information. All models were optimized prior to calculation of the reported energies and NMR parameters. When considering the model structures with one Al per unit cell, substitution onto site 1 (i.e., Ga1) is most energetically favored [by 0.215 eV per cell (10.4 kJ mol–1) relative to Ga2 and 0.519 eV per cell (25.0 kJ mol–1) relative to Ga3]. Given the greater energetic preference for substitution for Ga1, as well as the greater number of these sites in the crystal structure, it is unsurprising that a significant amount of Al1 is observed in experimental NMR spectra and that Al3 is not observed at all. However, experimentally an additional resonance is observed in the 27Al MQMAS spectrum, even for the sample with the lowest Al content, perhaps suggesting that the Al atoms adopt some degree of ordering or clustering.
By including two Al atoms per cell, we are able to investigate the effects of their relative positions on the calculated 27Al NMR parameters. Again, it is seen that placing the second Al also on site 1 is most energetically favorable (0.276 eV per cell relative to Al1 and Al2 and 0.556 eV per cell relative to Al1 and Al3) and that the two possible relative positions of Al1 and Al1 (i.e., bridged by Al–OH–Al or isolated) are energetically very similar (with a difference of only 0.060 eV per cell). However, the values of CQ calculated for these two atomic arrangements are quite different, with the Al in an Al1–OH–Al1 motif having a CQ of 5.0 MHz and two isolated Al1 atoms having a CQ of 3.4 MHz (compared to 4.7 MHz for a single isolated Al1 in the cell). This suggests that signals I and II in Table 2 can be assigned to Al1–OH–Al1 and isolated Al1, respectively. The presence of Al2 in the same cell as Al1 is predicted to lead to an even smaller CQ for Al1 of 2.8 MHz, and while a clear resonance is not observed for this species (because of the low Al population on site 2), such species may be responsible for the tail to lower δ1 seen in Figure 4d. The 27Al NMR spectra, therefore, can be seen as evidence that Al has a strong preference for site 1 and Al cannot be homogeneously distributed throughout the material as, even for the lowest Al content (Ga4.5Al0.5O7OH), a signal is observed for Al1 near the other Al1 (i.e., Al-rich regions).
It should also be noted in the 71Ga MAS NMR spectra of Ga5–xAlxO5OH, shown in Figure 4b, that an additional resonance at ∼145 ppm is observed. There is no evidence from any of the calculations that Al substitution should give rise to a resonance in this position, and the most likely assignment is that it is part of the line shape for the tetrahedral Ga in a minor impurity of β-Ga2–xAlxO3 (see below for further discussion of this phase).
γ-Ga2–xAlxO3
The synthesis of γ-Ga2–xAlxO3 in 1,4-butanediol at 240 °C was found to be rather unreliable at short reaction times, often forming unwanted byproducts, such as AlOOH (boemite) and diaspore-type GaOOH (tsumgallite). However, changing the solvent to isopropanol was found to provide a reliable route to γ-Ga2–xAlxO3 spinels, and solid solutions containing up to 90% Al3+ could be obtained (i.e., x ≤ 1.8). This exceeds the compositional range reported by Inoue and co-workers in their higher-temperature synthesis in 1,4-butanediol.24 The use of isopropanol may allow better mixing of the regents due to its lower viscosity. The XRD profiles (Figure 5) show that these materials have very broad Bragg reflections indicative of poorly crystalline materials and likely consist of nanosized crystallites. Scherrer analysis of the peak broadening gives estimated crystallite domain sizes ranging from ∼10 nm (x = 0) to ∼7 nm (x = 1.8), confirming the nanocrystalline nature of the materials. BET surface area measurements confirmed that all of these materials have a very large surface area of ∼200 m2 g–1. The powder XRD profiles can be fitted to a cubic crystal system in space group Fd3̅m, typical for spinel oxides, and Pawley refinements allowed the unit cell lattice parameter to be refined, revealing a linear decrease in this with an increase in Al3+ content (Figure 6). A peak due to an unidentified impurity around a 2θ of 42.5° is prominent in the 90% Al3+-substituted spinel, indicating that 90% has likely reached the limit of substitution in this solid solution by this synthesis method. No Rietveld analysis was undertaken because of the broadness of the peaks. EDX using SEM gives good agreement with the expected metal ratios in the samples (see Table S6).
Figure 5.

Pawley refinements against powder XRD data (λ = 1.54059 Å) for γ-Ga2–xAlxO3 spinels (0 ≤ x ≤ 1.8). The asterisk denotes an impurity phase in the x = 1.8 material.
Figure 6.

Plot of the spinel lattice parameter for γ-Ga2–xAlxO3 with increasing aluminum substitution and comparison to that of a reference γ-Al2O3 material.55
The 71Ga and 27Al MAS NMR spectra of γ-Ga2–xAlxO3 are shown in Figure 7. All spectra contain broadened resonances with characteristic tails to lower shift, indicative of static disorder. For 71Ga, it should be noted that the signal-to-noise ratio is lower for samples with greater Al content owing to a combination of the low Ga content and the very small volume (∼0.8 μL) of the 1 mm rotors required to achieve the rapid MAS rate. As for the Ga5–xAlxO7(OH) series described above, the Al in γ-Ga2–xAlxO3 exhibits a strong preference for octahedral coordination and even with 90% Al substitution (x = 1.8), 95% of the octahedral cations are Al, but only 74% of the tetrahedral cations. This is consistent with earlier work by Areán et al.,56 who used 27Al and 71Ga MAS NMR spectroscopy to characterize γ-Ga2–xAlxO3 with x = 0.4, 1.0, and 1.6 and observed very similar behavior. From the integrated spectral intensities of the 71Ga and 27Al MAS NMR spectra, it is possible to derive the bulk compositions for the γ-Ga2–xAlxO3 materials, shown in Table 3.
Figure 7.

(a) 71Ga (20.0 T, 75 kHz MAS) NMR spectra and (b) 27Al (14.1 T, 20 kHz MAS) NMR spectra of γ-Ga2–xAlxO3.
Table 3. Relative Occupation of Tetrahedral and Octahedral Sites in γ-Ga2–xAlxO3 as Determined from the 27Al and 71Ga MAS NMR Spectra in Figure 7 and Overall Formulas (represented in defect spinel and AB2O4 notation) Derived from Them.
| 27Al NMR |
71Ga NMR |
formula |
||||
|---|---|---|---|---|---|---|
| x | % AlIV | % AlVI | % GaIV | % GaVI | defect spinel | AB2O4 |
| 0.0 | – | – | 26.8 | 73.2 | γ-(Ga0.535)tet[Ga1.465]octO3 | (Ga0.713)tet[Ga1.953]octO4 |
| 0.6 | 5.2 | 94.8 | 33.6 | 66.4 | γ-(Ga0.470Al0.031)tet[Ga0.930Al0.569]octO3 | (Ga0.626Al0.419)tet[Ga1.24Al0.759]octO4 |
| 1.0 | 7.7 | 92.3 | 39.3 | 60.7 | γ-(Ga0.393Al0.077)tet[Ga0.607Al0.923]octO3 | (Ga0.524Al0.103)tet[Ga0.809Al1.23]octO4 |
| 1.5 | 14.7 | 85.3 | 63.5 | 36.5 | γ-(Ga0.318Al0.221)tet[Ga0.183Al1.28]octO3 | (Ga0.424Al0.295)tet[Ga0.244Al1.706]octO4 |
| 1.8 | 19.4 | 80.6 | 61.8 | 38.2 | γ-(Ga0.124Al0.349)tet[Ga0.076Al1.45]octO3 | (Ga0.165Al0.465)tet[Ga0.101Al1.935]octO4 |
In all five materials, the octahedral sites are almost fully occupied, meaning that the vacancies are located mainly on the tetrahedral sites. In the pure gallium oxide sample, the tetrahedral:octahedral ratio is ∼1:2.7, which is an occupancy of the octahedral sites substantially larger than that found in disordered γ-gallium oxide prepared from amorphous gels (1:2.1 ratio).16 These NMR and compositional data are also plotted graphically in Figure 8 to show how the changes in relative octahedral:tetrahedral proportion and site occupancy depend upon the composition of the spinel. It should be noted that this is an oversimplification, however, because partial occupation of nonspinel sites may also be possible, as has been found in both the crystalline pure γ-Al2O3 and γ-Ga2O3 structures.15,16,20 These extra sites also have tetrahedral and octahedral coordination; however, the disordered nature of these materials causes broadening in the NMR spectra, and it was not possible to resolve additional signals for these sites. It has also been proposed that the occupancy of extra sites is greater in the poorly crystalline samples of γ-Ga2O316 than in more crystalline samples, so it is likely that similar additional sites are occupied in these new materials. Additionally, it is known that γ-Ga2O3 exhibits a surface reconstruction that is enriched in octahedral sites,16 and 1H–27Al cross-polarization (CP) MAS NMR experiments (Figure S10) support a similar reconstruction here. The CP MAS experiment transfers magnetization from 1H (which should be found mainly in surface OH species) to nearby 27Al nuclei and is, therefore, effectively surface selective. However, it should be noted that, even in these surface-selective spectra, very little signal is observed for pentacoordinate Al, which has previously been observed by NMR spectroscopy for γ-Al2O3 using surface-selective dynamic nuclear polarization (DNP) measurements57−59 and has additionally been observed in MAS experiments by Areán et al. for γ-Ga2–xAlxO3 with x = 0.4, 1.0, and 1.6.56 It can, therefore, be concluded that the materials studied here have a surface that is enriched with octahedral Al relative to the bulk material.
Figure 8.

(a) Plot showing the proportion of tetrahedral (IV) and octahedral (VI) Al and Ga cations (solid lines and symbols), and the overall proportion of octahedral and tetrahedral cations (dashed lines), in γ-Ga2–xAlxO3. (b) Plot showing the amount of Al substitution on the tetrahedral and octahedral sites (solid lines) and the overall level of Al substitution in γ-Ga2–xAlxO3 (dashed line). All values were derived from the integrated spectral intensities from the 27Al and 71Ga NMR spectra shown in Figure 7.
β-Ga2–xAlxO3 and α-Ga2–xAlxO3
The thermal decomposition of the Ga5–xAlxO7(OH) materials is complex and, as for the pure aluminum60 and gallium15 end members, occurs via mixtures of poorly crystalline ε-(Al,Ga)2O3 and κ-(Al,Ga)2O3, where it is difficult to determine if phase separation has taken place (Figures S4 and S5). Instead, we focus on the high-temperature phase transformation of the γ-Ga2–xAlxO3 spinels, because this occurs without phase separation. Substitution of aluminum for gallium in the spinel enhances the thermal stability of these phases over the pure gallium version (Figure S11): while pure nanocrystalline γ-Ga2O3 transforms directly into the thermodynamically stable polymorph, β-Ga2O3, at around 750 °C, a higher temperature (>900 °C) is required for the transformation of aluminum-substituted samples. At 90% Al substitution, the spinel converts directly into α-Ga0.2Al1.8O3 without prior transformation into the β-polymorph. Rietveld analysis of a sample of α-Ga0.2Al1.8O3 shows that the occupancy of the metal site for Ga and Al refines to 0.09 and 0.91, respectively, in agreement with the nominal formula (Figure 9 and Table 4). 27Al and 71Ga MAS NMR spectra are consistent with the presence of only octahedral cations in this material (Figure S13).
Figure 9.

Rietveld plot of α-Ga0.2Al1.8O3 against powder X-ray diffraction data (λ = 1.54059 Å).
Table 4. Refined Crystal Parameters for α-Ga0.2Al1.8O3a.
| atom | Wyckoff site | x | y | z | occupancy | Beq (Å2) |
|---|---|---|---|---|---|---|
| Ga | 12c | 0 | 0 | 0.35289(8) | 0.09(6) | 0.22(5) |
| Al | 12c | 0 | 0 | 0.35289(8) | 0.91(6) | 0.22(5) |
| O | 18e | 0.3057(3) | 0 | 0.25 | 1.0 | 0.22 |
Lattice parameters a = 4.78281(5) Å, c = 13.04096(15) Å, space group R3̅cH. Rp = 12.5%. wRp = 19.0%. GoF = 1.247. The thermal parameter for oxygen was fixed to achieve a satisfactory fit.
Transformation of the mixed aluminum–gallium oxide spinels into phase-pure β-Ga2–xAlxO3 occurs for ≤65% Al3+ substitution (x = 1.3), while the spinel phase separates into β-Ga2–xAlxO3 and α-Ga2–xAlxO3 for 1.3 < x < 1.8. Rietveld refinement against powder XRD data showed that no other crystalline phases were present in the β-Ga2–xAlxO3 samples (Figure 10). Two constraints were placed during the refinement. (i) The total occupancy of each site was fixed at 1.0 to maintain the charge balance against the oxide, and (ii) the total intended Al:Ga ratio from the synthesis was fixed. Refinement statistics and refined crystal parameters for all samples can be found in Tables S7–S10. The change in the cell volume with an increase in aluminum content follows a linear relationship, obeying Vegard’s law, and a decrease in the cell parameters with an increase in aluminum content is expected because of the smaller size of the Al3+ cation; an increase in the β cell angle is also seen.
Figure 10.

Rietveld refinement against powder XRD data (λ = 1.54059 Å) for β-Ga2–xAlxO3 in the composition range of 0 ≤ x ≤ 1.3.
The structural refinements show that for all samples there is a significant amount of aluminum on the tetrahedral site, even for that with the lowest aluminum content. The Al(IV):Al(VI) ratio in the β-polymorph remains close to 1:2 across the composition range but shows a small increase (i.e., an increase in tetrahedral occupation) with an increase in Al substitution over values of x between 0.2 and 1.3. While Al still displays a preference for octahedral coordination [the Al(IV):Al(VI) ratio in β-Ga2–xAlxO3 is 1:1], this preference is less pronounced than that observed above for Ga5–xAlxO7(OH) and γ-Ga2–xAlxO3. This conclusion is also supported by DFT calculations, which suggest that substitution of Al onto a tetrahedral site in β-Ga2–xAlxO3 is less disfavored than in Ga5–xAlxO7OH, with an energy penalty of ∼2.0 kJ/mol of cations in β-Ga1.75Al0.25O3, compared with ∼5.2 kJ/mol of cations for Ga4.5Al0.5O5OH (see the Supporting Information for details). 27Al MAS NMR spectroscopy (Figure 11) confirms that Al adopts tetrahedral and octahedral coordination throughout the series, with the Al(IV):Al(VI) ratio varying systematically from 1:2.25 (∼31% tetrahedral Al) for x = 0.2 to 1:1.44 (∼41% tetrahedral Al) for x = 1.3.
Figure 11.

27Al (14.1 T, 20 kHz MAS) NMR spectra of β-Ga2–xAlxO3. The minor resonance at −50 ppm in all spectra is a spinning side band.
As shown in Figure 12a, the relative site occupancies derived from the Rietveld refinements and 27Al NMR spectra are in good agreement for all compositions. Figure 12b shows the fraction of octahedral and tetrahedral sites occupied by Al (from the average of the values obtained from the Rietveld refinements and 27Al NMR spectra) for each composition, which confirms the slight preference for Al to occupy octahedral sites across the whole composition range. The average overall formulas derived from these data for all β-Ga2–xAlxO3 materials studied are listed in Table 5.
Figure 12.
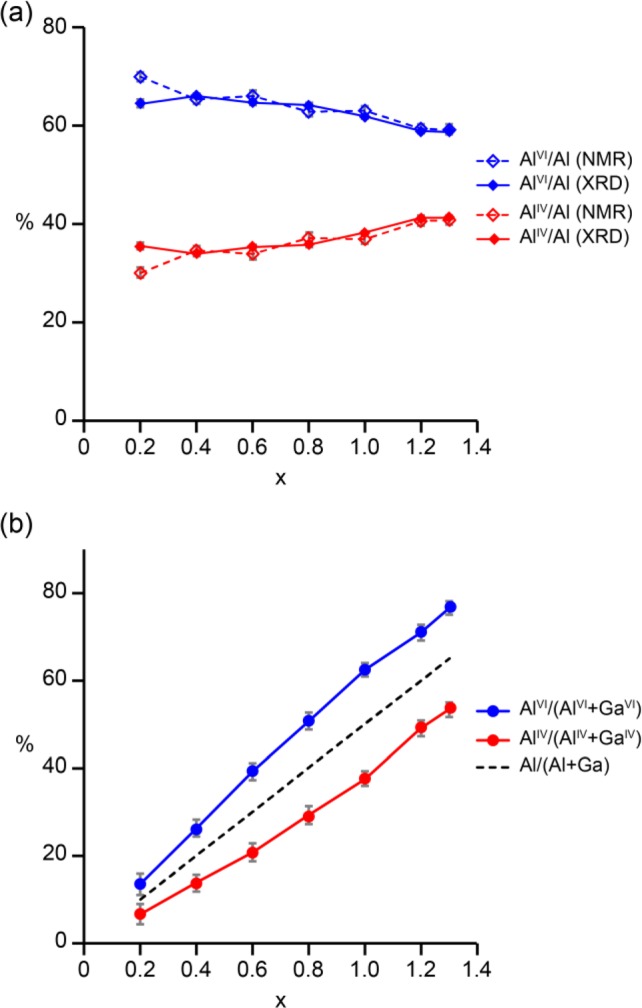
(a) Plot showing the proportion of tetrahedral (IV) and octahedral (VI) Al sites in β-Ga2–xAlxO3, as determined by Rietveld refinement (solid lines) and 27Al NMR spectroscopy (dashed lines). (b) Plot showing the proportion of Al substitution on the tetrahedral and octahedral sites (solid lines) and the overall level of Al substitution in β-Ga2–xAlxO3 (dashed line). Note that the error bars in panel a are mainly smaller than the size of the points.
Table 5. Relative Occupation of Tetrahedral and Octahedral Sites in β-Ga2–xAlxO3 as Determined from the Average of the Values from Rietveld Refinement and 27Al MAS NMR Spectra and Overall Formulas Derived from Them.
| x | AlIV (%) | AlVI (%) | formula |
|---|---|---|---|
| 0.0 | – | – | β-(Ga1.0)tet[Ga1.0]octO3 |
| 0.2 | 32.8 | 67.2 | β-(Ga0.934Al0.066)tet[Ga0.866Al0.134]octO3 |
| 0.4 | 34.3 | 65.7 | β-(Ga0.863Al0.137)tet[Ga0.737Al0.263]octO3 |
| 0.6 | 334.6 | 65.4 | β-(Ga0.792Al0.208)tet[Ga0.608Al0.392]octO3 |
| 0.8 | 36.6 | 63.4 | β-(Ga0.708Al0.292)tet[Ga0.492Al0.508]octO3 |
| 1.0 | 37.6 | 62.4 | β-(Ga0.624Al0.376)tet[Ga0.376Al0.624]octO3 |
| 1.2 | 40.9 | 59.1 | β-(Ga0.509Al0.491)tet[Ga0.291Al0.709]octO3 |
| 1.3 | 41.0 | 59.0 | β-(Ga0.466Al0.534)tet[Ga0.234Al0.766]octO3 |
There is very little difference in the refined crystal structure parameters between samples fired at 1200 and 1400 °C (Table S11), implying that the Al adopts tetrahedral coordination immediately upon phase transformation from the mixed-metal spinels, rather than forming an initial β-polymorph with a smaller number of tetrahedral Al species, followed by rearrangement at a higher temperature.
As one would expect, the average Al/Ga–O interatomic distance becomes smaller with an increase in aluminum substitution in β-Ga2–xAlxO3 with a decrease in the average Al/Ga–O tetrahedral distance from 1.816 to 1.789 Å and a decrease in the average Al/Ga–O octahedral distance from 2.005 to 1.944 Å from x = 0.2 to x = 1.3, respectively (see Table S12). Pure β-Ga2O3 shows a significant distortion of the octahedral sites away from regular octahedral geometry,17 which is also present in all β-Ga2–xAlxO3 samples in this work. The tetrahedral sites also appear to be significantly distorted for all samples, with the O–Ga/Al–O angles falling in the range of 104–120°, a feature also observed in the single-crystal reinvestigation of β-Ga2O3 by Åhman et al.17 The 27Al NMR spectra of β-Ga2–xAlxO3 (Figure 11) confirm that there is a large EFG at the tetrahedral site, leading to CQ vales of ∼5.0 MHz (and a similarly large CQ of ∼11 MHz is observed for β-Ga2O316).
Conclusions
Solvothermal synthesis allows the formation of mixed aluminum–gallium oxides and oxyhydroxides using temperatures lower than those previously reported. The new solid solution Ga5–xAlxO7(OH) (0.5 ≤ x ≤ 1.5) has been structurally authenticated, and the “hexagonal GaAlO3” reported in the literature is a likely member of this family. The γ-Ga2–xAlxO3 spinels form as poorly crystalline powders that can be thermally transformed into the high-temperature phases β-Ga2–xAlxO3 (0 ≤ x ≤ 1.3) and α-Ga2–xAlxO3 (x = 1.8). This provides highly crystalline samples for which a detailed solid-state NMR spectroscopic investigation allows the distribution of site occupancies to be determined. Given the growing interest in gallium oxide polymorphs in applications such as electronics and photocatalysis, and the long-standing study of aluminum oxides as catalyst supports in heterogeneous catalysis, our results will provide reference data for understanding structure–property relationships in these fields.
Acknowledgments
D.S.C. is grateful to the EPSRC for the award of an industrial CASE studentship, partly funded by Johnson Matthey plc. S.E.A., D.M.D., and J.E.H. thank the ERC (EU FP7 Consolidator Grant 614290 “EXONMR”) for funding. S.E.A. thanks the Royal Society and Wolfson Foundation for a merit award. The UK 850 MHz solid-state NMR Facility used in this research was funded by EPSRC and BBSRC (Contract Reference PR140003), as well as the University of Warwick, including via partial funding through Birmingham Science City Advanced Materials Projects 1 and 2 supported by Advantage West Midlands (AWM) and the European Regional Development Fund (ERDF). Collaborative assistance from the 850 MHz Facility Manager (Dinu Iuga, University of Warwick) is acknowledged. EPSRC is also thanked for computational support through the Collaborative Computational Project on NMR Crystallography (CCP-NC), via EP/M022501/1 and EP/J501542/1. The research data (and/or materials) supporting this publication can be accessed at http://doi.org/10.17630/3cea1660-1368-442d-a012-d63e16e2a7c3.61
Supporting Information Available
The Supporting Information is available free of charge at https://pubs.acs.org/doi/10.1021/acs.inorgchem.9b03459.
Additional experimental data for Ga5–xAlxO7(OH), further details of DFT calculations, and additional experimental data for γ-Ga2–xAlxO3, α-Ga2–xAlxO3, and β-Ga2–xAlxO3 (PDF)
The authors declare no competing financial interest.
Supplementary Material
References
- Levin I.; Brandon D. Metastable alumina polymorphs: Crystal structures and transition sequences. J. Am. Ceram. Soc. 1998, 81, 1995–2012. 10.1111/j.1151-2916.1998.tb02581.x. [DOI] [Google Scholar]
- Trueba M.; Trasatti S. P. γ-Alumina as a support for catalysts: A review of fundamental aspects. Eur. J. Inorg. Chem. 2005, 2005, 3393–3403. 10.1002/ejic.200500348. [DOI] [Google Scholar]
- K. Wefers C. M.Oxides and Hydroxides of Aluminum; ALCOA Laboratories: Pittsburgh, PA, 1987; p 20. [Google Scholar]
- Stepanov S. I.; Nikolaev V. I.; Bougrov V. E.; Romanov A. E. Gallium Oxide: Properties and Applications - A Review. Rev. Adv. Mater. Sci. 2016, 44, 63–86. [Google Scholar]
- Higashiwaki M.; Jessen G. H. Guest Editorial: The dawn of gallium oxide microelectronics. Appl. Phys. Lett. 2018, 112, 060401. 10.1063/1.5017845. [DOI] [Google Scholar]
- Wang X.; Xu Q.; Li M. R.; Shen S.; Wang X. L.; Wang Y. C.; Feng Z. C.; Shi J. Y.; Han H. X.; Li C. Photocatalytic Overall Water Splitting Promoted by an α–β phase Junction on Ga2O3. Angew. Chem., Int. Ed. 2012, 51, 13089–13092. 10.1002/anie.201207554. [DOI] [PubMed] [Google Scholar]
- Jin S. Q.; Wang X.; Wang X. L.; Ju M. G.; Shen S.; Liang W. Z.; Zhao Y.; Feng Z. C.; Playford H. Y.; Walton R. I.; Li C. Effect of Phase Junction Structure on the Photocatalytic Performance in Overall Water Splitting: Ga2O3 Photocatalyst as an Example. J. Phys. Chem. C 2015, 119, 18221–18228. 10.1021/acs.jpcc.5b04092. [DOI] [Google Scholar]
- Roy R.; Hill V. G.; Osborn E. F. Polymorphism of Ga2O3 and the System Ga2O3-H2O. J. Am. Chem. Soc. 1952, 74, 719–722. 10.1021/ja01123a039. [DOI] [Google Scholar]
- Roy R.; Hill V. G.; Osborn E. F. Polymorphs of Alumina and Gallia. Ind. Eng. Chem. 1953, 45, 819–820. 10.1021/ie50520a047. [DOI] [Google Scholar]
- Lavalley J. C.; Daturi M.; Montouillout V.; Clet G.; Otero Areán C.; Rodríguez Delgado M.; Sahibed-dine A. Unexpected similarities between the surface chemistry of cubic and hexagonal gallia polymorphs. Phys. Chem. Chem. Phys. 2003, 5, 1301–1305. 10.1039/b211767n. [DOI] [Google Scholar]
- Rodríguez Delgado M.; Otero Areán C. Surface chemistry and pore structure of β-Ga2O3. Mater. Lett. 2003, 57, 2292–2297. 10.1016/S0167-577X(02)01214-4. [DOI] [Google Scholar]
- Yoshioka S.; Hayashi H.; Kuwabara A.; Oba F.; Matsunaga K.; Tanaka I. Structures and energetics of Ga2O3 polymorphs. J. Phys.: Condens. Matter 2007, 19, 346211. 10.1088/0953-8984/19/34/346211. [DOI] [Google Scholar]
- Penner S.; Zhuo C.; Thalinger R.; Grunbacher M.; Hejny C.; Vanicek S.; Noisternig M. Physico-chemical properties of unusual Ga2O3 polymorphs. Monatsh. Chem. 2016, 147, 289–300. 10.1007/s00706-015-1628-z. [DOI] [Google Scholar]
- Shi L. H.; Zhang J.; Wu S.; Li Y. G.; Jiang L. N.; Cui Q. L. Phase Evolution of Ga2O3 Produced from Morphology-Controllable alpha-GaOOH Nanocrystals. J. Am. Ceram. Soc. 2014, 97, 2607–2614. 10.1111/jace.12953. [DOI] [Google Scholar]
- Playford H. Y.; Hannon A. C.; Barney E. R.; Walton R. I. Structures of Uncharacterised Polymorphs of Gallium Oxide from Total Neutron Diffraction. Chem. - Eur. J. 2013, 19, 2803–2813. 10.1002/chem.201203359. [DOI] [PubMed] [Google Scholar]
- Playford H. Y.; Hannon A. C.; Tucker M. G.; Dawson D. M.; Ashbrook S. E.; Kastiban R. J.; Sloan J.; Walton R. I. Characterization of Structural Disorder in γ-Ga2O3. J. Phys. Chem. C 2014, 118, 16188–16198. 10.1021/jp5033806. [DOI] [Google Scholar]
- Åhman J.; Svensson G.; Albertsson J. A reinvestigation of β-gallium oxide. Acta Crystallogr., Sect. C: Cryst. Struct. Commun. 1996, 52, 1336–1338. 10.1107/S0108270195016404. [DOI] [Google Scholar]
- Wang H.; He Y.; Chen W.; Zeng Y. W.; Stahl K.; Kikegawa T.; Jiang J. Z. High-pressure behavior of β-Ga2O3 nanocrystals. J. Appl. Phys. 2010, 107, 033520. 10.1063/1.3296121. [DOI] [Google Scholar]
- Kim S. W.; Iwamoto S.; Inoue M. Solvothermal oxidation of gallium metal. Ceram. Int. 2009, 35, 1603–1609. 10.1016/j.ceramint.2008.09.005. [DOI] [Google Scholar]
- Smrčok L.; Langer V.; Křestan J. γ-Alumina: a single-crystal X-ray diffraction study. Acta Crystallogr., Sect. C: Cryst. Struct. Commun. 2006, 62, I83–I84. 10.1107/S0108270106026850. [DOI] [PubMed] [Google Scholar]
- Hill V. G.; Roy R.; Osborn E. F. The System Alumina-Gallia-Water. J. Am. Ceram. Soc. 1952, 35, 135–142. 10.1111/j.1151-2916.1952.tb13087.x. [DOI] [Google Scholar]
- von Wartenerg H.; Reusch H. J. Schmelzdiagramme höchstfeuerfester Oxyde. IV. (Aluminiumoxyd)Oxyde. IV. (Aluminiumoxyd). Z. Anorg. Allg. Chem. 1932, 207, 1–20. 10.1002/zaac.19322070102. [DOI] [Google Scholar]
- Macdonald J.; Gard J.; Glasser F. Preparation and crystal chemistry of some mixed metal sesquioxides containing Fe, Al, Ga, Cr, Sc and In. J. Inorg. Nucl. Chem. 1967, 29, 661–671. 10.1016/0022-1902(67)80321-X. [DOI] [Google Scholar]
- Takahashi M.; Inoue N.; Takeguchi T.; Iwamoto S.; Inoue M.; Watanabe T. Synthesis of γ-Ga2O3-Al2O3 solid solutions by the glycothermal method. J. Am. Ceram. Soc. 2006, 89, 2158–2166. 10.1111/j.1551-2916.2006.01060.x. [DOI] [Google Scholar]
- Takahashi M.; Nakatani T.; Iwamoto S.; Watanabe T.; Inoue M. Performance of solvothermally prepared Ga2O3-Al2O3catalysts for SCR of NO with methane. Appl. Catal., B 2007, 70, 73–79. 10.1016/j.apcatb.2006.01.018. [DOI] [Google Scholar]
- Masuda T.; Watanabe T.; Miyahara Y.; Kanai H.; Inoue M. Synthesis of Ga2O3-Al2O3 Catalysts by a Coprecipitation Method for CH4-SCR of NO. Top. Catal. 2009, 52, 699–706. 10.1007/s11244-009-9211-7. [DOI] [Google Scholar]
- Nakatani T.; Watanabe T.; Takahashi M.; Miyahara Y.; Deguchi H.; Iwamoto S.; Kanai H.; Inoue M. Characterization of γ-Ga2O3-Al2O3 Prepared by Solvothermal Method and Its Performance for Methane-SCR of NO. J. Phys. Chem. A 2009, 113, 7021–7029. 10.1021/jp901569s. [DOI] [PubMed] [Google Scholar]
- Masuda T.; Watanabe T.; Miyahara Y.; Iwamoto S.; Kanai H.; Inoue M. Photoluminescence of propylene adsorbed on γ-Ga2O3-Al2O3 solid solutions in relation to their catalysis for CH4-SCR of NO. J. Mol. Catal. A: Chem. 2009, 307, 71–76. 10.1016/j.molcata.2009.03.012. [DOI] [Google Scholar]
- Takahashi M.; Inoue N.; Nakatani T.; Takeguchi T.; Iwamoto S.; Watanabe T.; Inoue M. Selective catalytic reduction of NO with methane on γ-Ga2O3-Al2O3 solid solutions prepared by the glycothermal method. Appl. Catal., B 2006, 65, 142–149. 10.1016/j.apcatb.2006.01.007. [DOI] [Google Scholar]
- Miyahara Y.; Takahashi M.; Masuda T.; Imamura S.; Kanai H.; Iwamoto S.; Watanabe T.; Inoue M. Selective catalytic reduction of NO with C1-C3 reductants over solvothermally prepared Ga2O3-Al2O3 catalysts: Effects of water vapor and hydrocarbon uptake. Appl. Catal., B 2008, 84, 289–296. 10.1016/j.apcatb.2008.04.005. [DOI] [Google Scholar]
- Miyahara Y.; Watanabe T.; Masuda T.; Kanai H.; Deguchi H.; Inoue M. Evaluation of catalytic activity of Ga2O3-Al2O3 solid solutions for CH4-SCR by UV-vis spectra after adsorption of C3H6 as a probe. J. Catal. 2008, 259, 36–42. 10.1016/j.jcat.2008.07.007. [DOI] [Google Scholar]
- Chen M.; Xu J.; Su F. Z.; Liu Y. M.; Cao Y.; He H. Y.; Fan K. N. Dehydrogenation of propane over spinel-type gallia-alumina solid solution catalysts. J. Catal. 2008, 256, 293–300. 10.1016/j.jcat.2008.03.021. [DOI] [Google Scholar]
- Xiao H.; Zhang J. F.; Wang P.; Wang X. X.; Pang F.; Zhang Z. Z.; Tan Y. S. Dehydrogenation of propane over a hydrothermal-synthesized Ga2O3-Al2O3 catalyst in the presence of carbon dioxide. Catal. Sci. Technol. 2016, 6, 5183–5195. 10.1039/C5CY02161H. [DOI] [Google Scholar]
- Mathew T.; Yamada Y.; Ueda A.; Shioyama H.; Kobayashi T. Metal oxide catalysts for DME steam reforming: Ga2O3 and Ga2O3-Al2O3 catalysts with and without copper. Appl. Catal., A 2005, 286, 11–22. 10.1016/j.apcata.2005.02.030. [DOI] [Google Scholar]
- Akatsuka M.; Yoshida T.; Yamamoto N.; Yamamoto M.; Ogawa S.; Yagi S. XAFS analysis for quantification of the gallium coordinations in Al2O3-supported Ga2O3 photocatalysts. J. Phys.: Conf. Ser. 2016, 712, 012056 10.1088/1742-6596/712/1/012056. [DOI] [Google Scholar]
- Coelho A. A. TOPAS and TOPAS-Academic: an optimization program integrating computer algebra and crystallographic objects written in C plus. J. Appl. Crystallogr. 2018, 51, 210–218. 10.1107/S1600576718000183. [DOI] [Google Scholar]
- Amoureux J. P.; Fernandez C.; Steuernagel S. Z filtering in MQMAS NMR. J. Magn. Reson., Ser. A 1996, 123, 116–118. 10.1006/jmra.1996.0221. [DOI] [PubMed] [Google Scholar]
- Pike K. J.; Malde R. P.; Ashbrook S. E.; McManus J.; Wimperis S. Multiple-quantum MAS NMR of quadrupolar nuclei. Do five-, seven- and nine-quantum experiments yield higher resolution than the three-quantum experiment?. Solid State Nucl. Magn. Reson. 2000, 16, 203–215. 10.1016/S0926-2040(00)00081-3. [DOI] [PubMed] [Google Scholar]
- Clark S. J.; Segall M. D.; Pickard C. J.; Hasnip P. J.; Probert M. J.; Refson K.; Payne M. C. First principles methods using CASTEP. Z. Kristallogr. - Cryst. Mater. 2005, 220, 567–570. 10.1524/zkri.220.5.567.65075. [DOI] [Google Scholar]
- Pickard C. J.; Mauri F. All-electron magnetic response with pseudopotentials: NMR chemical shifts. Phys. Rev. B: Condens. Matter Mater. Phys. 2001, 63, 245101. 10.1103/PhysRevB.63.245101. [DOI] [Google Scholar]
- Perdew J. P.; Burke K.; Ernzerhof M. Generalized gradient approximation made simple. Phys. Rev. Lett. 1996, 77, 3865–3868. 10.1103/PhysRevLett.77.3865. [DOI] [PubMed] [Google Scholar]
- Tkatchenko A.; Scheffler M. Accurate Molecular Van Der Waals Interactions from Ground-State Electron Density and Free-Atom Reference Data. Phys. Rev. Lett. 2009, 102, 073005 10.1103/PhysRevLett.102.073005. [DOI] [PubMed] [Google Scholar]
- McNellis E. R.; Meyer J.; Reuter K. Azobenzene at coinage metal surfaces: Role of dispersive van der Waals interactions. Phys. Rev. B: Condens. Matter Mater. Phys. 2009, 80, 205414. 10.1103/PhysRevB.80.205414. [DOI] [Google Scholar]
- Monkhorst H. J.; Pack J. D. Special Points For Brillouin-Zone Integrations. Phys. Rev. B 1976, 13, 5188–5192. 10.1103/PhysRevB.13.5188. [DOI] [Google Scholar]
- Pyykko P. Year-2017 nuclear quadrupole moments. Mol. Phys. 2018, 116, 1328–1338. 10.1080/00268976.2018.1426131. [DOI] [Google Scholar]
- Stephens P. W. Phenomenological model of anisotropic peak broadening in powder diffraction. J. Appl. Crystallogr. 1999, 32, 281–289. 10.1107/S0021889898006001. [DOI] [Google Scholar]
- Demichelis R.; Noel Y.; Zicovich-Wilson C. M.; Roetti C.; Valenzano L.; Dovesi R. Ab-initio quantum mechanical study of akdalaite (5Al2O3·H2O): Structure and vibrational spectrum. J. Phys.: Conf. Ser. 2008, 117, 012013 10.1088/1742-6596/117/1/012013. [DOI] [Google Scholar]
- Yamaguchi G.; Yanagida H.; Ono S. The Crystal Structure of Tohdite. Bull. Chem. Soc. Jpn. 1964, 37, 1555–1557. 10.1246/bcsj.37.1555. [DOI] [Google Scholar]
- Shpanov Y. P.; Sidorenko G. A.; Stolyarova T. I. Akdalaite, a new hydrated variety of alumina. Int. Geol. Rev. 1971, 13, 675–680. 10.1080/00206817109475484. [DOI] [Google Scholar]
- Yamaguchi G.; Yanagida H.; Ono S. A New Alumina Hydrate, “Tohdite” (5Al2O3·H2O). Bull. Chem. Soc. Jpn. 1964, 37, 752–754. 10.1246/bcsj.37.752. [DOI] [Google Scholar]
- Hwang S.-L.; Shen P.; Chu H.-T.; Yui T.-F. A New Occurrence and New Data on Akdalaite, a Retrograde Mineral from UHP Whiteschist, Kokchetav Massif, Northern Kazakhstan. Int. Geol. Rev. 2006, 48, 754–764. 10.2747/0020-6814.48.8.754. [DOI] [Google Scholar]
- MacKenzie K. J. D.; Smith M. E.. Multinuclear Solid-State NMR of Inorganic Materials; Pergamon Press: Oxford, U.K., 2002. [Google Scholar]
- Ashbrook S. E.; Sneddon S. New Methods and Applications in Solid-State NMR Spectroscopy of Quadrupolar Nuclei. J. Am. Chem. Soc. 2014, 136, 15440–15456. 10.1021/ja504734p. [DOI] [PubMed] [Google Scholar]
- Moran R. F.; Dawson D. M.; Ashbrook S. E. Exploiting NMR spectroscopy for the study of disorder in solids. Int. Rev. Phys. Chem. 2017, 36, 39–115. 10.1080/0144235X.2017.1256604. [DOI] [Google Scholar]
- Gutierrez G.; Taga A.; Johansson B. Theoretical structure determination of γ-Al2O3. Phys. Rev. B: Condens. Matter Mater. Phys. 2001, 65, 012101. 10.1103/PhysRevB.65.012101. [DOI] [Google Scholar]
- Areán C. O.; Delgado M. R.; Montouillout V.; Massiot D. Synthesis and characterization of spinel-type gallia-alumina solid solutions. Z. Anorg. Allg. Chem. 2005, 631, 2121–2126. 10.1002/zaac.200570027. [DOI] [Google Scholar]
- Lee D.; Duong N. T.; Lafon O.; De Paepe G. Primostrato Solid-State NMR Enhanced by Dynamic Nuclear Polarization: Pentacoordinated Al3+ Ions Are Only Located at the Surface of Hydrated γ-Alumina. J. Phys. Chem. C 2014, 118, 25065–25076. 10.1021/jp508009x. [DOI] [Google Scholar]
- Rankin A. G. M.; Webb P. B.; Dawson D. M.; Viger-Gravel J.; Walder B. J.; Emsley L.; Ashbrook S. E. Determining the Surface Structure of Silicated Alumina Catalysts via Isotopic Enrichment and Dynamic Nuclear Polarization Surface-Enhanced NMR Spectroscopy. J. Phys. Chem. C 2017, 121, 22977–22984. 10.1021/acs.jpcc.7b08137. [DOI] [PMC free article] [PubMed] [Google Scholar]
- Mais M.; Paul S.; Barrow N. S.; Titman J. J. Dynamic Nuclear Polarisation Enhanced Solid-State Nuclear Magnetic Resonance Studies of Surface Modification of γ-Alumina. Johnson Matthey Technol. Rev. 2018, 62, 271–278. 10.1595/205651318X696765. [DOI] [Google Scholar]
- Okumiya M.; Yamaguchi G.; Yamada O.; Ono S. The Formation of κ and κ′-Al2O3 from the Dehydration of Tohdite 5Al2O3·H2O. Bull. Chem. Soc. Jpn. 1971, 44, 418–423. 10.1246/bcsj.44.418. [DOI] [Google Scholar]
- Cook D. S.; Hooper J. E.; Dawson D. M.; Fisher J. M.; Thompsett D.; Ashbrook S. E.; Walton R. I.. Synthesis and Polymorphism of Mixed Aluminum-Gallium Oxides. Dataset. University of St Andrews Research Portal, 2019. 10.17630/3cea1660-1368-442d-a012-d63e16e2a7c3 [DOI] [PMC free article] [PubMed]
Associated Data
This section collects any data citations, data availability statements, or supplementary materials included in this article.