Abstract
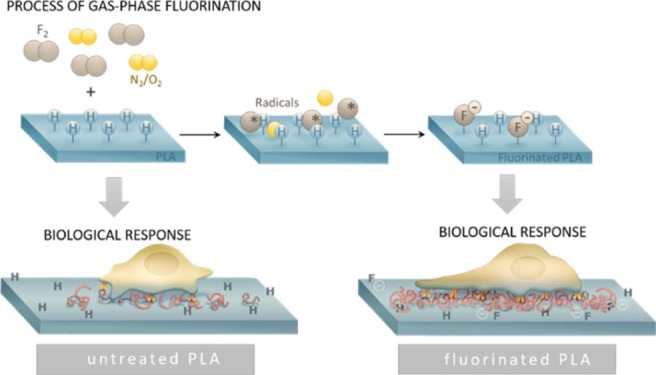
For the regeneration or creation of functional tissues, biodegradable biomaterials including polylactic acid (PLA) are widely preferred. Modifications of the material surface are quite common to improve cell–material interactions and thereby support the biological outcome. Typical approaches include a wet chemical treatment with mostly hazardous substances or a functionalization with plasma. In the present study, gas-phase fluorination was applied to functionalize the PLA surfaces in a simple and one-step process. The biological response including biocompatibility, cell adhesion, cell spreading, and proliferation was analyzed in cell culture experiments with fibroblasts L929 and correlated with changes in the surface properties. Surface characterization methods including surface energy and isoelectric point measurements, X-ray photoelectron spectroscopy, and atomic force microscopy were applied to identify the effects of fluorination on PLA. Gas-phase fluorination causes the formation of C–F bonds in the PLA backbone, which induce a shift to a more hydrophilic and polar surface. The slightly negatively charged surface dramatically improves cell adhesion and spreading of cells on the PLA even with low fluorine content. The results indicate that this improved biological response is protein- but not integrin-dependent. Gas-phase fluorination is therefore an efficient technique to improve cellular response to biomaterial surfaces without losing cytocompatibility.
Introduction
The biocompatibility of a biomaterial is particularly influenced by its ability to support cellular activity. Cell adhesion to a biomaterial surface is a key parameter for the successful application of a material especially in the field of tissue engineering.1,2 Proliferation, migration, and differentiation of cells are regulated by signals stimulated by cell surface interactions.3,4 Consequently, manipulating surface properties to improve cell adhesion represents an important aspect in biomaterial research.
Biodegradable polymers are widely used as two- or three-dimensional substrates for cell growth because they show suitable mechanical properties, transparency, and low immunogenicity. In particular, polylactic acid (PLA) has been extensively studied for biomedical applications.5 In contrast to the advantageous bulk properties, the surface properties of such polymers are usually not cell-friendly. Hydrophobicity, low surface energy, and lack of active functional groups at the surface lead to poor cell adhesion, cell spreading, and proliferation.6 In order to facilitate cell attachment, various methods have been developed to improve surface wettability, surface energy, surface charge, and chemical composition. Common strategies include coating with bioactive proteins, introducing functional groups, or nanostructuring7 at the surface of biodegradable polymers. For this purpose, many different approaches are available: wet chemical treatment, peroxide oxidation, high-energy radiation,8 and plasma treatment.9,10
Chemical treatments are quite harsh and can worsen bulk properties such as mechanical strength and degradation rate. During low-temperature plasma treatment using process gases such as nitrogen, ammonia, argon, helium, or oxygen, functional groups with different polarities are incorporated or cross-linked via free radicals, and changes of surface morphology can be induced.8 Plasma treatment on PLA, for example, results in increased hydrophilicity and moderately wettable surfaces. In addition, protein adsorption, cellular attachment, and spreading are improved.11−13 However, plasma treatment does not offer long-term stability and the surface tends to recover within weeks.14
Direct gas-phase fluorination is a completely different process to modify the surface properties. This process is widely used to improve adhesion,15 printability, barrier properties, gas separation properties,16 friction coefficients,17 antibacterial properties,18 UV shield, and chemical resistance19 of polymers. Direct fluorination of polymers is a heterogeneous reaction in the presence of fluorine (F2) and other gases, resulting in a radical chain reaction at the surface of the material. It starts with the spontaneous formation of fluorine radicals which disrupt C–H bonds and form new C–F, C–F2, and C–F3 groups. A total fluorination (Teflon-like structure) results in strong hydrophobic surfaces and requires treatment times of several weeks or months.16 However, in most cases, the polymer chain is not fully fluorinated. Partially fluorinated surfaces show increased polarity and improved wettability. In the presence of oxygen, a so-called oxyfluorination takes place. The formation of oxygen-containing, polar surface functionalities is seen as the cause for improved wettability.20 However, the incorporation of fluorine atoms itself induces an increase in the dielectric constant, resulting in a higher polarity too.21,22
The process of gas-phase fluorination does not require pretreatment and can be performed at room temperature (RT), which is important for temperature-sensitive materials. In addition, the effects are stable over months.15
As far as we know, gas-phase fluorination has not been used to date to influence the surface properties of implant materials or biodegradable polymers. The aim of the present study was to investigate the effects of fluorinated PLA surfaces on cell compatibility, cell adhesion, and proliferation and to correlate the biological response with surface properties.
Results
The PLA films treated with different fluorine concentrations showed no obvious changes concerning optical appearance and handling. Several characterization methods were applied to investigate how the surface of PLA was affected by the treatment.
Surface Properties
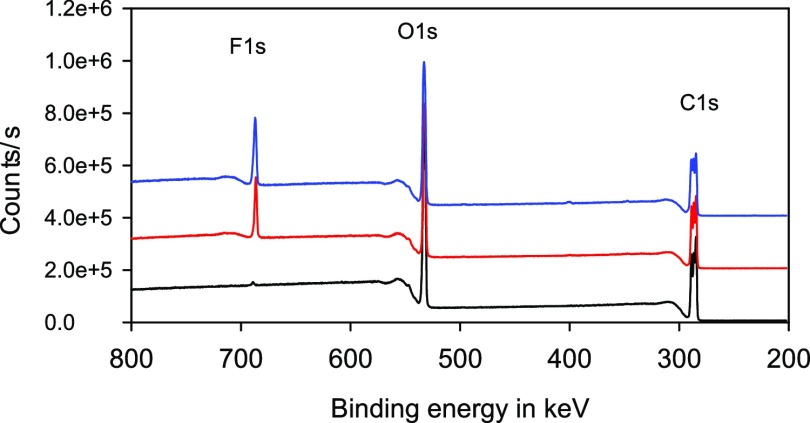
At first, the chemical composition of the PLA surface after gas-phase fluorination was investigated. The elemental composition was measured using X-ray photoelectron spectroscopy (XPS). Figure 1 shows the XPS wide spectra of PLA films without fluorination, fluorination with 5 and 10 vol % fluorine in the reactor. The concentration of the elements fluorine, oxygen, and carbon was calculated as atomic percent and expressed as fluorine to carbon F/C or oxygen to carbon O/C ratio.
Figure 1.
XPS wide spectra of PLA films without fluorination (black) and fluorination with 5 vol % fluorine in the reactor (red) and 10 vol % fluorine in the reactor (blue), purging gas: nitrogen.
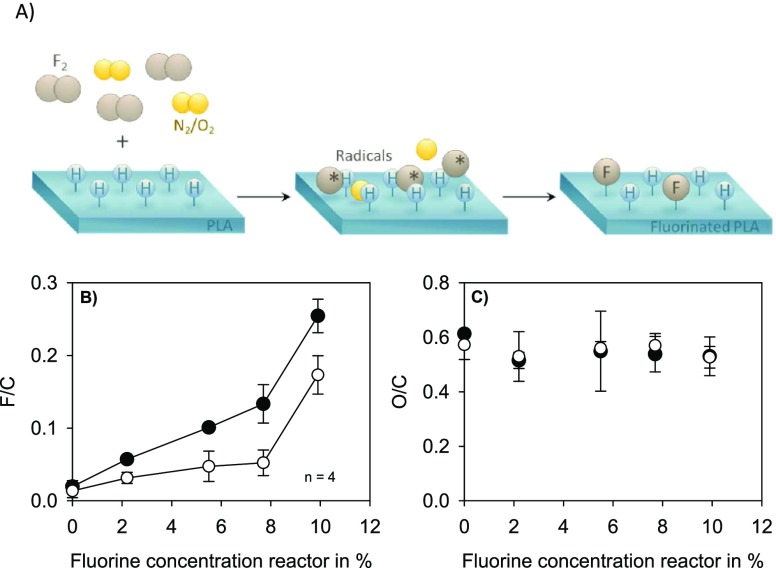
Fluorine and oxygen concentrations depending on the fluorine concentration and the purging gas in the reactor are shown in Figure 2B,C. XPS analyses revealed that the incorporation of fluorine differs significantly with the purging gas used. In the presence of nitrogen, more fluorine is bound to the polymer surface compared to purging gas containing oxygen. Additionally, low fluorine concentrations in the reactor resulted in slight incorporation into the PLA surface. Samples treated with the highest fluorine concentration (10%), however, showed a significant increase in fluorine content. The incorporation is obviously not linear to the fluorine concentration in the reactor. A maximum of approximately 25% of fluorine atoms in relation to the carbon atoms was found in the presence of nitrogen. The oxygen concentration does not change significantly, neither with increasing fluorine concentration nor as a function of the purge gas.
Figure 2.
Schematic illustration of the gas-phase fluorination process (A). Surface properties of PLA samples after gas-phase fluorination at different fluorine concentrations in the reactor. Fluorine (B) and oxygen (C) concentration at the surface of PLA with purge gas nitrogen (●) and air (◯).
Because of the different fluorine contents that appeared after gas-phase fluorination, it was possible to analyze a biological response in a dose-dependent manner (low to high fluorine content at the surface of PLA). In order to better understand the effects of the treatment, the following data were referred to the fluorine concentration at the surface of the material and not to the reactor concentration during the treatment.
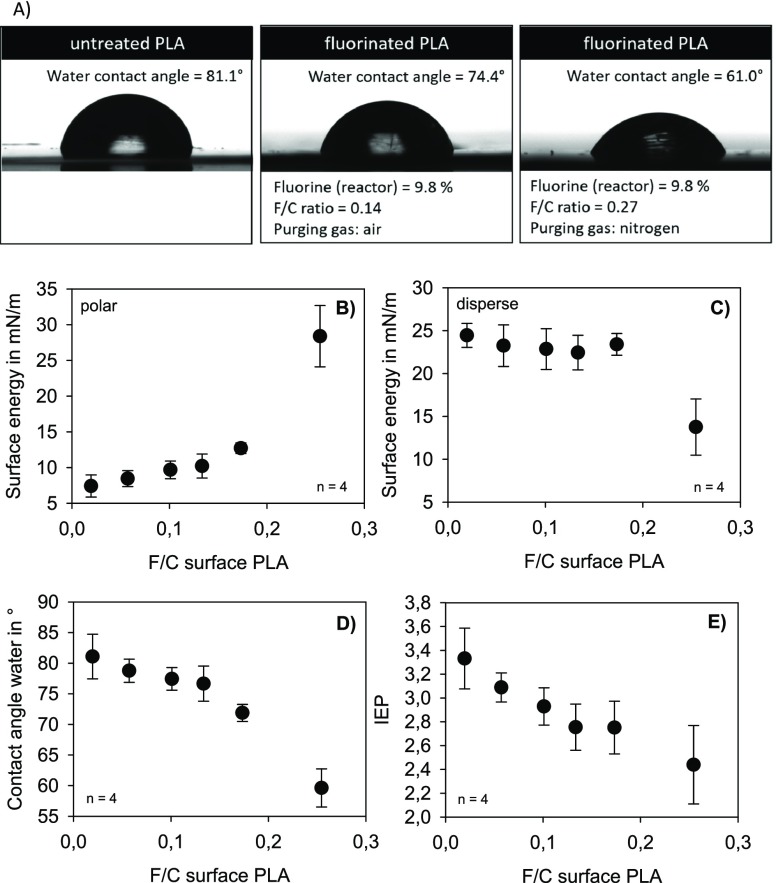
A biological response to a surface is strongly influenced by hydrophobicity and surface charge. In order to characterize the effects of gas-phase fluorination on PLA, the contact angle, the surface energy, and the isoelectric point (IEP) were measured (Figure 3 and Table 1).
Figure 3.
Water drops (WCA) on untreated and fluorinated PLA surfaces (A). Polar (B) and disperse part (C) of surface energy, contact angle of water (D), and IEP (E) of fluorinated PLA films depending on the fluorine–carbon ratio (F/C) at the surface of PLA.
Table 1. Elemental Composition and Physical Surface Properties of Fluorinated PLA Films Depending on the Fluorine Concentration and the Purging Gas in the Reactor.
| fluorine concentration reactor in % | purging gas | F/C surface PLA | IEP | WCA in (deg) | surface energy polar part in mN/m | surface energy disperse part in mN/m |
|---|---|---|---|---|---|---|
| 0 | 0.02 ± 0.01 | 3.3 ± 0.3 | 81.1 ± 3.9 | 6.8 ± 1.3 | 24.5 ± 2.1 | |
| 2.2 | N2 | 0.06 ± 0.003a | 3.1 ± 0.1 | 78.8 ± 1.9 | 8.5 ± 1.1 | 23.2 ± 2.4 |
| 5.6 | N2 | 0.10 ± 0.005a | 2.9 ± 0.2 | 77.4 ± 1.9 | 9.7 ± 1.2 | 22.9 ± 2.4 |
| 7.7 | N2 | 0.13 ± 0.026a | 2.8 ± 0.2 | 76.7 ± 2.9 | 10.2 ± 1.7 | 22.4 ± 2.0 |
| 9.8 | N2 | 0.25 ± 0.023a | 2.4 ± 0.3a | 59.6 ± 3.1a | 28.4 ± 4.3a | 13.8 ± 3.3a |
| 2.2 | air | 0.03 ± 0.008 | 3.1 ± 0.1 | 79.6 ± 1.7 | 7.7 ± 0.9 | 24.4 ± 1.8 |
| 5.6 | air | 0.05 ± 0.021 | 3.0 ± 0.3 | 79.0 ± 1.5 | 8.1 ± 0.5 | 24.0 ± 0.8 |
| 7.7 | air | 0.05 ± 0.002a | 2.8 ± 0.3 | 76.3 ± 2.8 | 9.5 ± 1.4 | 24.1 ± 1.1 |
| 9.8 | air | 0.17 ± 0.026a | 2.8 ± 0.2 | 71.9 ± 1.4a | 12.7 ± 0.7a | 23.4 ± 1.3a |
Significance between untreated PLA and fluorinated PLA at the corresponding concentration.
Compared to untreated PLA, only a slight decrease of the water contact angle (WCA) (as a measure of hydrophilicity) and polarity could be observed with a fluorine–carbon ratio (F/C ratio) ≤0.15. A fluorine content >0.15 results in an abrupt decrease of the WCA and an increase in surface polarity. The surface of PLA after fluorination changes from predominantly hydrophobic to moderately hydrophobic, which means that the wettability increases.
Modifications of the surface can also result in changes in the number or composition of charged functional groups. Measuring the IEP helps to identify such modifications. Figure 3E shows the IEPs of PLA surfaces with the different fluorine concentrations. The IEP shifts toward the lower pH values, which indicates an increase in negative charges on the PLA surface.
The data suggest that the surface properties of PLA change to less hydrophobic, more polar, and more negative charges after fluorination. In order to prove whether this has any effect on the cellular behavior, the material was analyzed in cell culture experiments.
Biological Response to Fluorinated PLA
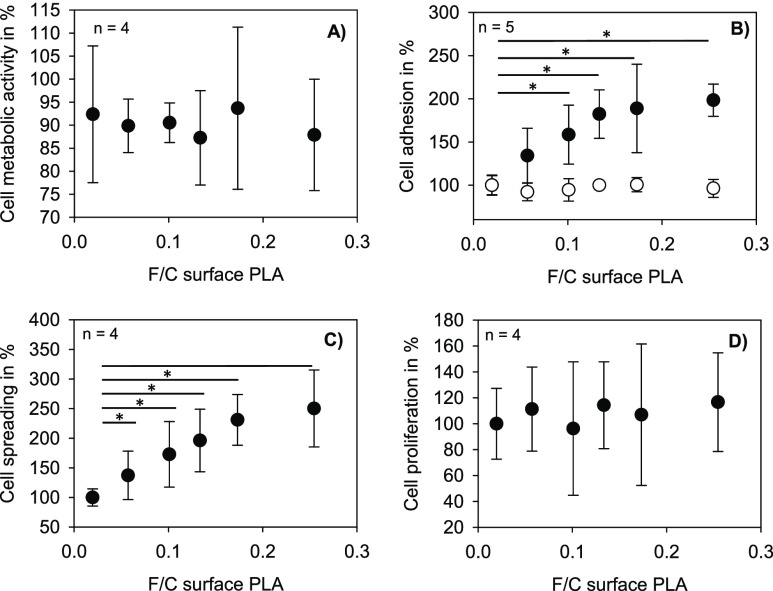
In order to exclude any toxic effect of fluorination on cells, the metabolic activity of L929 fibroblast cells was investigated using the XTT assay. The cells were analyzed after a 2 day incubation with treated or untreated PLA films. None of the fluorine concentrations reduced the metabolic activity below 80%, proving that fluorination does not significantly affect the cytocompatibility. Next, the adhesion of cells to the surface of treated PLA was analyzed. Therefore, L929 fibroblast cells were seeded on top of the PLA films. After a short incubation time, attached cells were measured and compared with cells seeded on the untreated PLA films. As shown in Figure 4B, a significantly higher number of adherent cells could be detected on fluorinated PLA surfaces. The number further increased with rising fluorine concentration. Next, the cell adhesion in the presence and absence of fetal bovine serum (FBS) was analyzed to evaluate the influence of proteins in this setting. L929 fibroblasts were seeded on untreated and fluorinated PLA using culture media with 10% of FBS and without FBS. The effect of the improved cell adhesion on fluorinated surfaces was completely lost without serum (Figure 4B).
Figure 4.
Metabolic activity (A) after 48 h, adhesion (B) with 10% FBS (●) and without FBS (◯) (30 min), cell spreading (C) after 2 h, and proliferation (D) (24 h) of L929 fibroblasts after incubation on PLA films with different fluorination degrees (post hoc significance test, Holm–Bonferroni).
Additionally, analyses of cell spreading showed a clear difference between treated and untreated PLA (Figures 4C, 5). The cell spreading area was considerably higher on treated surfaces compared to untreated PLA. Similar to cell adhesion, cell spreading was influenced in a fluorine-concentration-dependent manner. In order to investigate if the improved adhesion and spreading to fluorinated PLA surfaces also influences cell proliferation, 5-bromo-2′-deoxyuridine (BrdU) analyses were performed. As Figure 4D shows, no significant increase in cellular proliferation could be detected.
Figure 5.
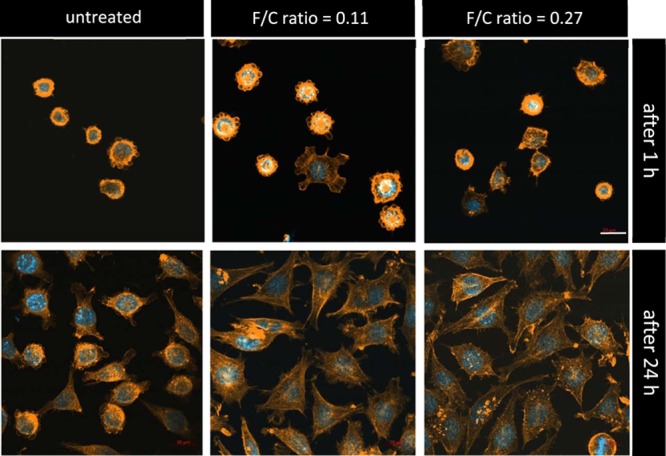
Spreading of L929 fibroblasts 1 h and 24 h after seeding on untreated (left) and fluorinated (middle, right) PLA surfaces. Cells were stained with DAPI (blue) and phalloidin-TRITC (orange). Scale bar: 20 μm.
It appeared that fluorination promotes adhesion and spreading of cells on the PLA material. There is a correlation between the decrease in hydrophobicity, the increase in polarity, and the number of negative charges at the surface. However, the increase in cell adhesion and spreading at low fluorine concentrations are higher than the gradient of the change of the surface properties. However, metabolic activity and proliferation of the cells are not affected. In the following, more detailed analyses regarding the chemical composition and the surface structure were performed to identify possible reasons for those effects.
Chemical Composition of the PLA Surface after Fluorination
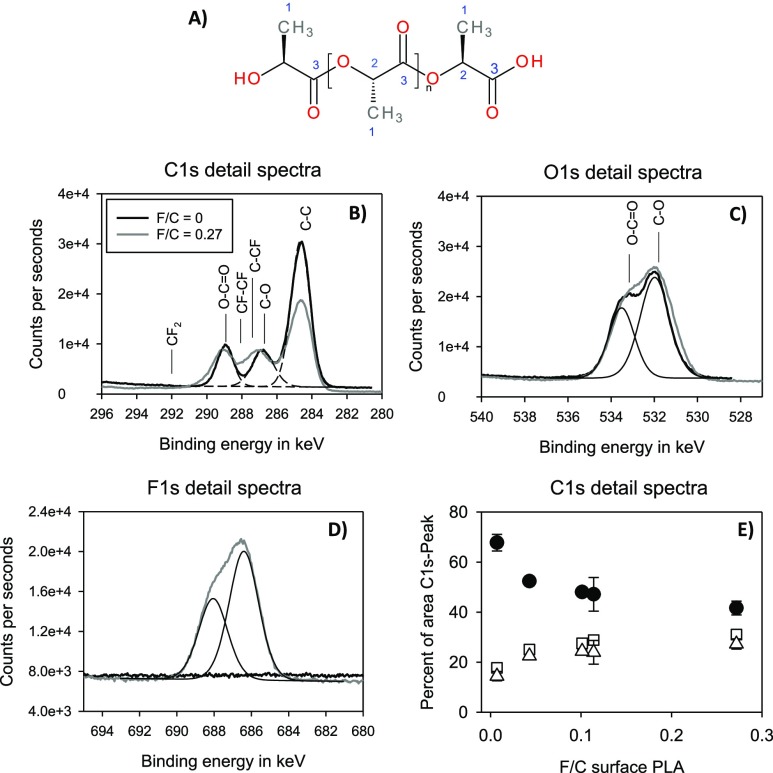
In order to characterize the chemical bonds at the PLA surface, high-resolution spectra of carbon and oxygen were analyzed using XPS. The C 1s spectra of untreated PLA samples showed three peaks: C–C or C–H, C–O, and O–C=O (Figure 6B). As the degree of fluorination increases, the proportion of C–C and C–H bonds decreases (Figure 6E). The C–F peaks are masked by the C–O and O–C=O peaks. At the highest fluorine concentration, a shift to higher binding energies and a broadening of the C–O and O–C=O peaks can be monitored. Unfolding of the C 1s peak with further peak components was not effective because no clear distinction can be made between the C–O and O–C=O peaks because of the superposition of C–O and O–C=O peaks with C–F peaks. New peaks, such as those observed with fluorination of polyethylene,15 did not appear.
Figure 6.
(A) Chemical structure of PLA. (B–D) Detailed spectra and curve fitting of untreated PLA (black) and PLA modified with 10% of fluorine (gray line). (E) Proportion of functional groups at the surface of fluorinated and untreated PLA depending on the fluorine concentration at the surface (●: C–C, C–H; △: C–O, C–CF; □: O–C=O, and CF–CF).
The O 1s spectra of oxygen showed two oxygen bonds (C–O and O–C=O) (Figure 6C). No changes could be observed after fluorination, indicating that the increase in the proportion of the C–O/C–F peaks in Figure 6D can be attributed to an increase in C–F bonds.
The detailed spectra of fluorine show two peaks in the fluorinated samples. The proportion of functional groups containing fluorine rises with increasing fluorine concentration in the reactor (Figure 6E).
Obviously, fluorination results in the replacement of hydrogen by fluorine atoms. The formation of functional groups such as carboxyl or hydroxyl groups could not be affirmed.
Surface Roughness
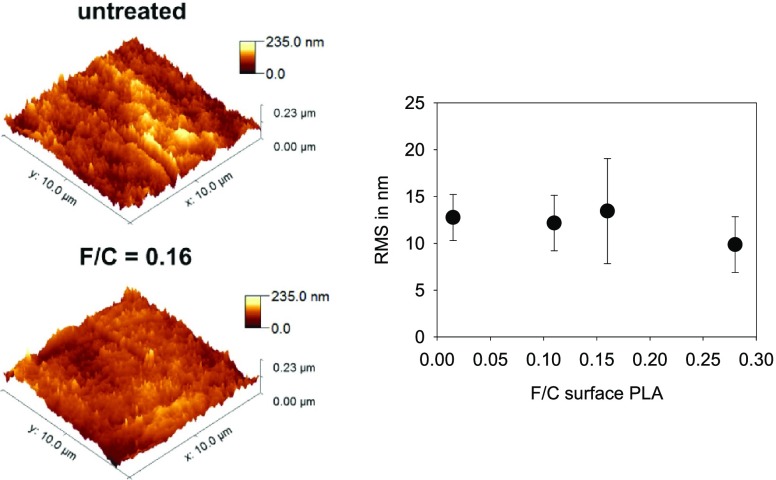
The roughness of treated and untreated PLA was analyzed using atomic force microscopy (AFM). No differences appeared after fluorination (Figure 7), indicating that the surface structure is not the reason for increased cell adhesion.
Figure 7.
Three-dimensional projection of the AFM height images and roughness of untreated and fluorinated PLA surfaces measured with AFM.
Protein Adsorption
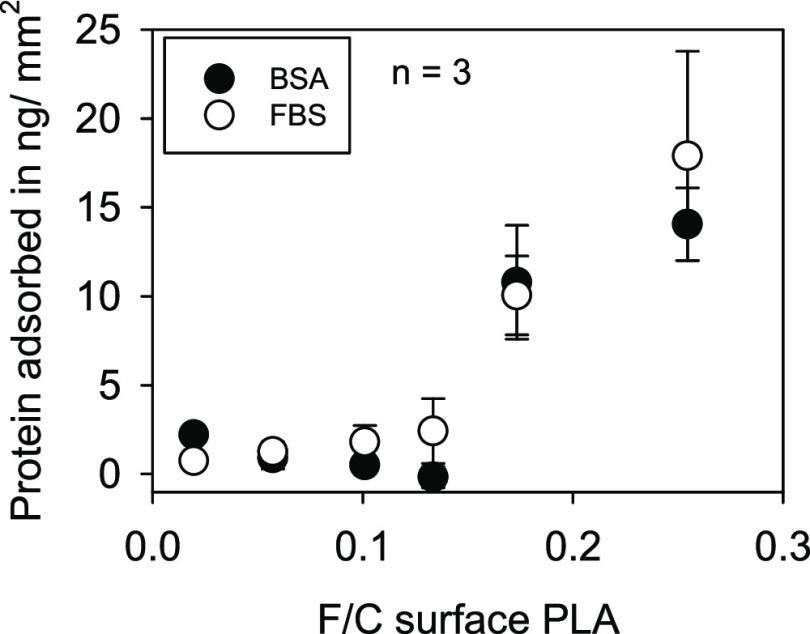
The cell adhesion studies revealed that the improved attachment to fluorinated PLA ceases in the absence of FBS. In order to prove whether protein adsorption plays a role in this setting, the binding of two different model protein solutions [bovine serum albumin (BSA) and FBS] to PLA was investigated. The proteins were incubated at the surface of PLA samples for 20 min at 37 °C, desorbed with 2% of sodium dodecyl sulfate (SDS) at 95 °C, and measured using the bicinchoninic acid (BCA) assay. As shown in Figure 8, adsorption of the proteins was not significantly affected at low fluorine concentrations (F/C < 0.15). However, the binding sharply increased at concentrations F/C > 0.15 similar to the increase in hydrophilicity and polarity.
Figure 8.
Amount of proteins bound to PLA films with varying fluorine content after 20 min.
Integrin-Dependent Cell Adhesion
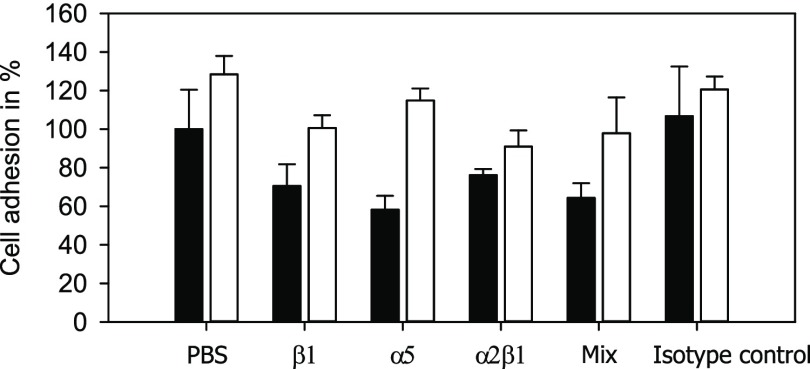
Usually, integrin receptors play a crucial role in the adhesion of cells to a biomaterial. In order to analyze whether integrins are important for the increased adhesion to fluorinated PLA, cells were incubated with antibodies against those receptors. The integrin function is then switched off. Cell adhesion experiments were performed in the presence of blocking antibodies against integrin subunits β1, α5, and α2β and compared to vehicle [phosphate-buffered saline (PBS)] and isotype control (Figure 9). In the presence of integrin-blocking antibodies, the cells showed a slightly but not significantly reduced adhesion to treated and untreated PLA samples, indicating that integrins are involved in the cellular attachment to PLA. However, the amplified adhesion to fluorinated surfaces remained, indicating that integrins are not involved in the elevated level of adhesion to fluorinated PLA.
Figure 9.
Cell adhesion to untreated (■) and fluorinated [□] PLA films in the presence of integrin-blocking antibodies. Antibodies to integrin subunits β1, α5, and α2β and a mixture (Mix) of all three antibodies were used with a final concentration of 10 μg/mL.
Discussion
PLA is a thermoplastic aliphatic polyester which is biodegradable and biocompatible. These properties play an important role for applications in medicine. A disadvantage of PLA, which restricts the medical use, is the hydrophobicity of the surface and the absence of specific functional groups for adhesion and growth of cells.8 Therefore, surface properties of PLA have to be modified to enhance the cell–material interactions. An effective approach to modify the surface is the direct fluorination. This process enables a one-step functionalization and proceeds at practically acceptable rates at RT. Because fluorination is one of the most effective dry chemical methods to modify and control physicochemical properties of polymers over a wide range of applications, this process has become an important tool of great interest.23 Compared to other fluorination strategies such as fluorination with hydrofluoric acid (HF),24 the process is less hazardous (including no skin contact and no inhalation) because it takes place in a closed reactor system and excess fluorine is added to calcium carbonate reacting into the nontoxic, environmentally neutral, and water-insoluble mineral CaF2.
In general, the chemical composition and the properties of fluorinated surfaces depend on experimental conditions (time, temperature, pressure, partial pressure of F2, and composition of gaseous mixture) and the nature of the polymer material. In the presence of oxygen, the −COF groups can be formed, which can be converted into −COOH groups under atmospheric moisture conditions.23 In the present study, XPS analyses of fluorinated PLA films confirm an incorporation of fluorine into the polymer chain of PLA. The fluorine concentration in the reactor <7.7% results in a weak fluorine content at the surface. By using 9.8% of fluorine in the reactor, the amount of fluorine in the backbone of PLA increases significantly. About 25% of the carbon atoms at the surface were bound to fluorine atoms. With oxygen-containing purging gas, the amount of incorporated fluorine is reduced. This is in line with the literature, showing that the presence of oxygen inhibits the incorporation of fluorine in polymer backbones.25 Evaluation of the C 1s detailed spectra shows that the C–H bonds decrease with increasing fluorine concentration. Unfortunately, the binding energies of the C–O bonds and C–F bonds overlap so that it is not possible to quantify the C–F bonds. Nevertheless, the results of the XPS investigations suggest that hydrogen atoms in the polymer chain are replaced by fluorine atoms. Neither the C 1s nor the O 1s spectra show any change in the C–O bonds. The formation of additional oxygen-containing functionalities can therefore not be assumed.
The detailed spectrum of F 1s showed two peaks. The reason for this could not be clarified. F 1s peak shapes are normally symmetrical. Fluorine tends to induce large chemical shifts in other elements, but within a given class of fluorine compounds (metal fluoride or organic fluorine), the shifts in the F 1s peak are small. In addition, it is known that in different polymers, fluorine has different binding energies.26 A higher degree of fluorination (F/C > 0.5) induces a shift of the binding energy to higher values.27 The presence of inorganic fluorine is unlikely because no other elements can be detected in the overview spectra.
With increasing fluorine concentration at the PLA surface, the hydrophilicity and the polarity of the PLA surface increases, but not linearly. Both rise weakly in the range of low fluorine concentrations and strongly at higher concentrations. Additionally, the change of the IEP to lower pH values indicates an increase in negative charges. XPS analyses of fluorinated PLA in the present study indicate no additional oxygen-containing groups at the surface. The reason for the increased polarity and wettability is probably not oxygen but simply the incorporation of the very electronegative fluorine. Fluorine leads to a polarization of the C–F bond, the covalent characteristic decreases, and the electrostatic properties increase. Therefore, the fluorine atom in a C–F bond interacts with other molecules via electrostatic dipole interactions.28 While in partially fluorinated carbon compounds water molecules interact with the surface via a strong electric field,21 100% of fluorination (Teflon) leads to such a strong decrease in the electric field that water molecules can no longer interact with those types of surfaces (“polar hydrophobicity”).29
Often, the functionalization of polymer surfaces has profound effects on their biological response. The interaction of a biomaterial surface with the surrounding tissue after implantation can be divided into different phases: during the first stage, a water shell is formed on the surface of the material. Second, a layer of plasma proteins is adsorbed. During the third stage, the cells reach the implant and interact with the implant and the protein coating. Protein adsorption is a complex process of adsorption, desorption, competition between different proteins, rearrangements, and conformational changes over a period of time.30 Proteins tend to adhere more strongly to nonpolar than to polar surfaces, to areas with high surface tension than those with low surface tension, and to charged surfaces than to uncharged surfaces. A rather general experimental finding is an increase in adsorption on hydrophobic surfaces compared to hydrophilic surfaces.31
In general, cells bind to extracellular matrix or adsorbed proteins through cell membrane receptors. One class of receptors include integrins, which bind selectively to specific binding sites such as the Arg-Gly-Asp (RGD) tripeptide found in cell adhesive extracellular proteins such as vitronectin, laminin, and fibronectin. In addition, these focal adhesions formed by the integrin extracellular protein interaction stimulate signals that directly influence proliferation, migration, and differentiation of cells.15
The present study could show that cell adhesion and cell spreading in a range up to an F/C ratio of 0.25 can be significantly improved by fluorination. Protein adsorption was found to be increased at F/C ratios >0.15. The latter can be attributed to the amplification of wettability, the increase in polarity, and the introduction of negative charges, although the relationship is not linear. However, the cells analyzed in the present study seem to be more sensitive to surface modifications than the physically measurable surface properties. In the presence of proteins, cells adhered much better to fluorinated PLA even at low fluorine content at the surface. On the other hand, in the absence of proteins (FBS), improved cellular adhesion to fluorinated PLA surfaces could not be detected anymore.
A correlation between improved cell adhesion of human fibroblasts and reduced hydrophobicity of plasma-modified PLA surfaces has been found, for example, by Jacobs et al.11 However, the effects were not stable over a period of time. Alves et al.12 could show that a treatment of PLA with oxygen radio frequency glow discharge (RFGD) increases the hydrophilicity and the number of functional groups. This improved the adsorption of various proteins including vitronectin, BSA, and fibronectin from single protein solutions. In the absence of preadsorbed proteins, osteoblast-like cells and fetal rat calvarial cells showed no improved adhesion after surface treatment anymore similar to the present study.12 The relationship between wettability (hydrophilicity), protein adsorption, and cell adhesion is discussed extensively. In a series of studies, Tamada and Ikada were able to show for numerous different polymers that moderately hydrophobic surfaces with WCAs between 60 and 70° are optimal for protein adsorption and cell adhesion.32,33 In contrast, Faucheux et al.34 could show that adsorption of fibronectin and formation of focal contacts via the integrin β1 subunit are particularly pronounced on moderately hydrophobic surfaces.
The results of the present study are similar to all these observations. Although an increased protein mass deposition with F/C < 0.15 could not be quantified using the BCA assay, the reason for the improved cell adhesion is probably an enhanced binding of proteins to the fluorinated PLA surfaces. Protein adsorption studies performed by Khalifehzadeh et al.35 showed that the amount of protein remaining after desorption of fluorinated surfaces is significantly increased compared to that of untreated surfaces. Analyses of proteins remaining at the surface were not performed in the present study. The cell adhesion experiments revealed two further unexpected results. First of all, adhesion of L929 fibroblasts to untreated PLA in serum-free media was similar to control conditions (with serum). Indeed, Grinnell and Feld36 described similar effects with human skin fibroblasts and found that fibroblasts secrete and expose fibronectin at the cell surface, thereby enabling cellular adhesion in the absence of serum. Second, the cells analyzed in the present study did not respond to fluorination in the absence of serum. The mechanism behind this is unknown. Integrin receptors are obviously not involved in the improved adhesion to fluorinated PLA because integrin blocking did not have an effect apart from a slightly reduced adhesion in both settings (untreated and fluorinated PLA). Lee et al.37 reported a very low adhesion rate to PLA of <10% in the presence of integrin β1 blocking for mesenchymal stem cells and chondrocytes. However, other cells including primary endothelial cells and tumor cell lines were also tested in the present study. No reduction of cellular adhesion in the presence of integrin-blocking antibodies was observed (data not shown). There are some hints that the initial adhesion of cells to charged surfaces is regulated via integrin-dependent but also integrin-independent mechanisms.38 Perhaps fluorinated PLA enables an additional opportunity for cells to bind to the surface via an integrin-independent, probably charge-dependent, mechanism.
An influence of the surface roughness on cell adhesion is well described.39,40 The present study did not measure any changes of the surface roughness.
In contrast to plasma treatment and oxygen RFGD, the main advantage of gas-phase fluorination is its long-term stability.15 Incorporation of fluorine did not affect the cytocompatibility of the material. Although cellular proliferation was not accelerated, an increase in adhesion and spreading of cells at fluorinated PLA surfaces can have a significant impact on the therapeutic success of an implant.
In addition to cytocompatibility, biodegradability of the fluorinated PLA is also probably not affected. It has not yet been investigated so far, but the changes in the polymer backbone are restricted to the PLA surface. The present study measured a maximum degree of fluorination of F/C = 0.3, which means that only at the surface of the PLA, a maximum of 30% of all carbon atoms are bound to a fluorine atom instead of a hydrogen atom. Thus, the bulk material is left unchanged. The hydrolysis-sensitive ester bond O–C=O most likely remains unaffected.
Polymers can also be fluorinated using wet chemical treatments. Chen et al.,24 for example, studied fluorinated PEEK (polyetheretherketone) for dental applications. Incorporation of fluorine into the polymer surface was performed using plasma, followed by HF treatment. The authors observed an increase in cell adhesion, spreading, proliferation, and alkaline phosphatase activity of rat bone-marrow-derived mesenchymal stem cells. The fluorinated material also showed in vitro bacteriostatic effects and an enhancement of in vivo osseointegration. However, the fluorination process used is laborious and requires hazardous chemicals. Similarly, in a study of Khalifehzadeh et al.,35 a multistep process including the radio frequency plasma treatment followed by a chemical addition of a perfluoro compound was used to improve the hemocompatibility of PLA. An increase in protein adsorption and a reduced binding of platelets to the material could be shown. Compared to these procedures, the use of gaseous fluorine in gas mixtures applied in a closed reactor is much easier to handle and to be automatized.
Conclusions
The results show that direct gas-phase fluorination is a simple, well-feasible method to improve the PLA cytocompatibility, in particular cellular adhesion and spreading. The partial exchange of hydrogen atoms by more electronegative fluorine atoms makes the surface more hydrophilic and polar. This creates a surface with optimized properties for protein adsorption and cell adhesion to PLA.
Experimental Section
Preparation of PLA Films
The PLA granulate (IngeoTM Biopolymer 6202D, NatureWorks LLC, Minnetonka, USA) was dried at 50 °C overnight in a vacuum oven and stored in a desiccator. A defined weight of granulate was pressed with a mechanical press (PW 40EH, Paul-Otto Weber GmbH, Remshalden, Germany) at 20 kN and 185 °C into films with a thickness of approximately 20 μm. In order to avoid agglutination of the metal stamp and the PLA films, a polytetrafluoroethylene-coated glass fabric separating film was used. The surface of the PLA films was cleaned with isopropanol.
Gas-Phase Fluorination of PLA Films
Gas-phase fluorination was performed in a batch reactor (Fluor Technik System GmbH, Lauterbach, Germany). Therefore, the PLA films were placed in the reactor at RT. Prior to fluorination, the reactor was purged three times either with nitrogen or with synthetic air. During fluorination, the reactor was filled with a mixture of synthetic air or nitrogen and fluorine gas (10% in nitrogen, Air Liquide, Paris, France). Fluorine concentrations of 2.2, 5.6, 7.7, and 9.8 vol % in nitrogen or air mixtures were tested. The overall pressure was 10, 18, 36, and 550 mbar with a reaction time of 60 s. At the end of the reaction, the fluorine gas was replaced by synthetic air or nitrogen lasting 30 min. For each fluorine condition (fluorine concentration, purging gas), a minimum of four independent replicates were prepared.
Contact Angle and Surface Energy
Static contact angles were measured using an optical contact angle measuring and contour analysis system (OCA35, Data Physics, Filderstadt, Germany). Drops of three liquids with different polarities (water and ethylene glycol as polar liquids and diiodomethane as a nonpolar liquid) were placed on a sample and recorded (seven drops per measurement point). The contact angles were calculated using the ellipse fitting method. The surface free energy was calculated according to Owens, Wendt, Rabel, and Kaelble (OWRK)41 using the contact angles of all three liquids. The surface free energy was divided into a polar and a disperse part.
XPS Characterization
XPS analyses were performed with the Kratos Axis Ultra (Kratos, Manchester, Great Britain) using an Al-Kα monochromatic source (15 keV) at 225 W. Areas (300 × 700 μm) of each location were measured. Wide and detailed spectra were recorded and fitted using the instrument software. Charges were neutralized using the Kratos magnetic confinement charge compensation system. Spectra have been charge-corrected to the main line of the carbon 1s spectrum and set to 284.6 eV. Fluorine concentration and high-resolution spectra were measured at six different locations per sample.
Isoelectric Point
The IEP was measured by determining the zeta potential as a function of the pH value in a Surpass electrokinetic analyzer (Anton Paar, Graz, Austria). Aqueous potassium chloride solution (1 mM) was used as the electrolyte medium. Hydrochloric acid (HCl) and sodium hydroxide (NaOH) aqueous solutions were used to adjust the pH value. The samples were glued on two stamps forming a flow channel of approximately 100 μm. The electrolytes were pumped passing the sample surfaces with a pressure ramp (maximum 300 mbar). The resulting charges were measured with electrodes at the start and the end of the flow channel. The zeta potentials were calculated according to the Helmholtz–Smoluchowski equation (eq 1)42 from the streaming current.
| 1 |
where ζ denotes the zeta potential, and η, ε0, and ε denote the viscosity, vacuum permittivity, and dielectric constant of the electrolyte solution, respectively. ζ = 0 represents the IEP. The IEP was measured as duplicate.
Surface Roughness
The surface roughness was determined using the NanoWizard III atomic force microscope (Bruker JPK Instruments AG BioAFM, Berlin, Germany) under ambient conditions and silicon cantilevers (Pointprobe NCH, NanoWorld AG, Neuchâtel, Switzerland). The cantilever parameters were as follows: resonance frequency ω0 ≈ 308 kHz, tip radius <8 nm, half opening angle α = 35°, and spring constant k = 24 N/m (determined as in ref (43)). For roughness measurements, an area of 10 × 10 μm2 was imaged with amplitude-modulated AFM (AM-AFM) using a free amplitude A0 = 45 nm and a set point A/A0 = 0.75. The route-mean-square roughness of the AM-AFM height images was analyzed using the Gwyddion software.
Protein Adsorption
The PLA films with a diameter of 13 mm were incubated in a BSA (Sigma-Aldrich, St. Louis, USA) solution (100 μg/mL) or FBS (Sigma-Aldrich, 10% in PBS w/Ca++, Mg++) solution for 20 min at 37 °C. The supernatant was discarded and the films were washed three times with distilled water and dried. Afterward, samples were incubated in 200 μL of PBS (w/Ca++, Mg++, Sigma-Aldrich) with 2% SDS (Sigma-Aldrich, St. Louis, USA) into nonbinding reaction vessels (Greiner Bio-One, Kremsmuenster, Austria) for 20 min at 95 °C with shaking to detach the proteins from the surface. The protein content in the solution was finally determined using the Pierce BCA (bicinchoninic acid) protein assay (Thermo Fisher Scientific, Waltham, USA) and standard curves of diluted BSA solutions (in PBS w/Ca++, Mg++).
Cell Cultivation
L929 murine fibroblasts (CLS Cell Lines Service GmbH, Eppelheim, Germany) were grown as monolayer cultures in T75 flasks (Greiner Bio-One) at 37 °C in an atmosphere containing 5% of CO2 and with a relative humidity of 95%. The L929 cells were cultivated in Dulbecco’s modified Eagle’s medium/Ham’s F12 (50:50) medium (Sigma-Aldrich) supplemented with 10% of FBS (Sigma-Aldrich) and 1% of l-glutamine (Sigma-Aldrich). Cells were subcultured twice a week using 0.05% trypsin (Thermo Fisher Scientific, Waltham, USA). The cell number was determined with a Neubauer counting chamber (Paul Marienfeld, Lauda-Königshofen, Germany). For experiments, cells were plated in triplicates in 24-well or 96-well plates (Greiner Bio-One, Kremsmuenster, Austria).
Cell Adhesion Assay
PLA films were immersed in 70% of ethanol for 30 min and air-dried. Test wells of 24-well plates were covered with fluorinated and untreated PLA films and incubated with culture media (with or without FBS) for 30 min at 37 °C in a 5% CO2 incubator. The L929 cells (4.2 × 10⁵ cells/cm2) were added and incubated for at least 20 min at 37 °C in an atmosphere containing 5% of CO2. After a sufficient incubation time (at least 20 min), unattached cells were separated from bound cells using a multistep pipette (Eppendorf, Hamburg, Germany). Therefore, culture media were carefully removed and the wells were washed with PBS (w/Ca++, Mg++) with a constant volume and pressure. Afterward, PBS was discarded and cells were lysed with 200 μL of phosphatase lysis buffer (81 mM trisodium citrate, 31 mM citric acid, 0.1% Triton X100, 1.85 mg/mL of PNP [4-nitrophenyl phosphate disodium salt hexahydrate] substrate, pH 5.4). The reaction was stopped using 133 μL of 2 M NaOH, and 250 μL of supernatant was transferred in a 96-well plate and absorption was measured at 405 nm using a plate reader (SpectraMax i3x, Molecular Devices, San José, USA). Cellular adhesion to untreated PLA was set to 100%. All samples were analyzed in triplicates.
Cell Spreading
PLA films were immersed in 70% of ethanol for 30 min and air-dried. The 24-well plates were covered with fluorinated and untreated PLA films and incubated with culture media for 30 min at 37 °C in a CO2 incubator. L929 cells (3.2 × 10⁵ cells/cm2) were added and incubated at the surface of the PLA films for 1 h at 37 °C in an atmosphere containing 5% of CO2. The media were discarded and the cells were fixed with 3% of paraformaldehyde (Sigma-Aldrich, St. Louis, USA) for 30 min at RT. The fixed cells were washed three times with PBS and permeabilized using 0.1% of Triton X100 (Thermo Fisher Scientific, Waltham, USA) in PBS for 10 min at RT. After two washing steps with PBS, the cells were stained with phalloidin-TRITC (Sigma-Aldrich, St. Louis, USA) for 1 h at RT in the dark. The spreading area of the cells was determined using microscopic images at 100-fold magnification and ImageJ software. Untreated PLA represented 100%. In one experiment, three wells per sample were analyzed with three microscopic images per well.
BrdU Cell Proliferation Assay
The PLA films were immersed in 70% of ethanol for 30 min and air-dried. Fluorinated and untreated PLA films were placed in 96-well plates and incubated with culture media for 30 min at 37 °C in a CO2 incubator. The L929 cells (1.8 × 10⁵/cm2) were added to each well and incubated for 24 h at 37 °C in an atmosphere containing 5% of CO2. Cell proliferation was determined using the BrdU assay according to the instructions of the manufacturer (Roche Diagnostics, Rotkreuz, Switzerland). In brief, BrdU labeling solution was added to the cells and incubated for 2 h at 37 °C in a CO2 incubator. After fixing and denaturing the cells, the incorporated BrdU was detected using the anti-BrdU-POD working and substrate solution. The BrdU fluorescence signal was measured at 370 nm (reference 492 nm) using a plate reader (SpectraMax i3x, Molecular Devices, San José, USA). The signal of cells on untreated films was defined as 100%. All samples were analyzed in triplicates.
XTT Cytotoxicity Test
A cytotoxicity test was performed according to DIN EN ISO 10993-5. In brief, L929 cells (2.6 × 10⁵ cells/cm2) were plated in 24-well plates in a culture medium without phenol red and incubated at standard cultivation conditions (37 °C, 5% of CO2). After 24 h, the medium was replaced by a fresh culture medium (without phenol red), and fluorinated and untreated PLA films were carefully placed on top of the cell layer. The cells were incubated again for 24 h at standard cultivation conditions. On the following day, the metabolic activity of cells was analyzed using the PromoKine XTT Colorimetric Cell Viability Kit III (Promocell GmbH, Heidelberg, Germany). The assay was performed according to the protocol of the manufacturer. In brief, cells were incubated with XTT reagent under standard cultivation until the dye appeared (around 2 h). Thereafter, 100 μL of the medium containing the dye was transferred in a 96-well plate and absorbance was measured in a plate reader at 450 nm (reference 620 nm). The blank value (well with medium, but without cells) was subtracted from the optical density values of the samples. Cells without PLA (no sample) were defined as 100% viable. All samples were analyzed in triplicates.
Integrin Blocking
Integrin-dependent cell adhesion was measured as described by Mould.44 In brief, L929 cells were detached from culture flasks using Accutase (Sigma-Aldrich, St. Louis, USA) and incubated with antibodies against different integrin subunits (anti-integrin β1 [P5D2], Santa Cruz Biotechnology, Dallas, USA; anti-integrin α5 [P1D6], Abcam, Cambridge, Great Britain; anti-integrin α2β1 [P1E6], Abcam, Cambridge, Great Britain; diluted in PBS [w/Ca++, Mg++]; and a final concentration of 10 μg/mL per well) in a culture medium for 15 min at 37 °C in a CO2 incubator. PLA films were placed in 96-well plates, washed with 100 μL of PBS, and covered with a 50–100 μL cell suspension–antibody mixture containing 150 000 cells/mL. After 15 min, cell adhesion was analyzed as described before (cell adhesion assay). An isotype control (mouse anti-rat IgG, Jackson) and the vehicle (PBS) were used as controls. Cellular adhesion to untreated PLA in the presence of PBS was set to 100%. All samples were analyzed in triplicates.
Statistical Analysis
Experiments were performed with a minimum of four independent replicates. The mean values of the technical replicates were used to perform an analysis of variance (one-way ANOVA) with a significance level of p = 0.05 and a post hoc test according to Holm–Bonferroni (paired mean value comparison with adjusted significance level).
Acknowledgments
This study was supported by The Deutsche Forschungsgemeinschaft (DFG) grant numbers ME 3734/6-1, BR 5604/1-1, and SCHU 1979/14-1.
Author Contributions
The manuscript was written through contributions of all authors. All authors have given approval to the final version of the manuscript.
The authors declare no competing financial interest.
References
- Wolfenson H.; Lavelin I.; Geiger B. Dynamic Regulation of the Structure and Functions of Integrin Adhesions. Dev. Cell 2013, 24, 447–458. 10.1016/j.devcel.2013.02.012. [DOI] [PMC free article] [PubMed] [Google Scholar]
- Kim B.-S.; Park I.-K.; Hoshiba T.; Jiang H.-L.; Choi Y.-J.; Akaike T.; Cho C.-S. Design of Artificial Extracellular Matrices for Tissue Engineering. Prog. Polym. Sci. 2011, 36, 238–268. 10.1016/j.progpolymsci.2010.10.001. [DOI] [Google Scholar]
- Moreno-Layseca P.; Streuli C. H. Signalling Pathways Linking Integrins with Cell Cycle Progression. Matrix Biol. 2014, 34, 144–153. 10.1016/j.matbio.2013.10.011. [DOI] [PubMed] [Google Scholar]
- Vitillo L.; Baxter M.; Iskender B.; Whiting P.; Kimber S. J. Integrin-Associated Focal Adhesion Kinase Protects Human Embryonic Stem Cells from Apoptosis, Detachment, and Differentiation. Stem Cell Rep. 2016, 7, 167–176. 10.1016/j.stemcr.2016.07.006. [DOI] [PMC free article] [PubMed] [Google Scholar]
- Asti A.; Gioglio L. Natural and Synthetic Biodegradable Polymers: Different Scaffolds for Cell Expansion and Tissue Formation. Int. J. Artif. Organs 2014, 37, 187–205. 10.530/ijao.5000307. [DOI] [PubMed] [Google Scholar]
- De Geyter N.; Morent R.; Desmet T.; Trentesaux M.; Gengembre L.; Dubruel P.; Leys C.; Payen E. Plasma Modification of Polylactic Acid in a Medium Pressure DBD. Surf. Coat. Technol. 2010, 204, 3272–3279. 10.1016/j.surfcoat.2010.03.037. [DOI] [Google Scholar]
- Neděla O.; Slepička P.; Švorčík V. Surface Modification of Polymer Substrates for Biomedical Applications. Materials 2017, 10, 1115. 10.3390/ma10101115. [DOI] [PMC free article] [PubMed] [Google Scholar]
- Demina T. S.; Gilman A. B.; Zelenetskii A. N. Application of High-Energy Chemistry Methods to the Modification of the Structure and Properties of Polylactide (a Review). High Energy Chem. 2017, 51, 302–314. 10.1134/s0018143917040038. [DOI] [Google Scholar]
- Morent R.; De Geyter N.; Desmet T.; Dubruel P.; Leys C. Plasma Surface Modification of Biodegradable Polymers: A Review. Plasma Processes Polym. 2011, 8, 171–190. 10.1002/ppap.201000153. [DOI] [Google Scholar]
- Intranuovo F.; Gristina R.; Fracassi L.; Lacitignola L.; Crovace A.; Favia P. Plasma Processing of Scaffolds for Tissue Engineering and Regenerative Medicine. Plasma Chem. Plasma Process. 2016, 36, 269–280. 10.1007/s11090-015-9667-0. [DOI] [Google Scholar]
- Jacobs T.; Declercq H.; De Geyter N.; Cornelissen R.; Dubruel P.; Leys C.; Beaurain A.; Payen E.; Morent R. Plasma Surface Modification of Polylactic Acid to Promote Interaction with Fibroblasts. J. Mater. Sci.: Mater. Med. 2013, 24, 469–478. 10.1007/s10856-012-4807-z. [DOI] [PubMed] [Google Scholar]
- Alves C. M.; Yang Y.; Marton D.; Carnes D. L.; Ong J. L.; Sylvia V. L.; Dean D. D.; Reis R. L.; Agrawal C. M. Plasma Surface Modification of Poly (D, L-lactic Acid) as a Tool to Enhance Protein Adsorption and the Attachment of Different Cell Types. J. Biomed. Mater. Res., Part B 2008, 87B, 59–66. 10.1002/jbm.b.31068. [DOI] [PubMed] [Google Scholar]
- Rimpelová S.; Peterková L.; Kasálková N. S.; Slepička P.; Švorčík V.; Ruml T. Surface Modification of Biodegradable Poly (L-Lactic Acid) by Argon Plasma: Fibroblasts and Keratinocytes in the Spotlight. Plasma Processes Polym. 2014, 11, 1057–1067. 10.1002/ppap.201400021. [DOI] [Google Scholar]
- Morent R.; De Geyter N.; Trentesaux M.; Gengembre L.; Dubruel P.; Leys C.; Payen E. Influence of Discharge Atmosphere on the Ageing Behaviour of Plasma-Treated Polylactic Acid. Plasma Chem. Plasma Process. 2010, 30, 525–536. 10.1007/s11090-010-9233-8. [DOI] [Google Scholar]
- Kranz G.; Lüschen R.; Gesang T.; Schlett V.; Hennemann O. D.; Stohrer W. D. The Effect of Fluorination on the Surface Characteristics and Adhesive Properties of Polyethylene and Polypropylene. Int. J. Adhes. Adhes. 1994, 14, 243–253. 10.1016/0143-7496(94)90037-x. [DOI] [Google Scholar]
- Kharitonov A. P.; Kharitonova L. N. Surface Modification of Polymers by Direct Fluorination: A Convenient Approach to Improve Commercial Properties of Polymeric Articles. Pure Appl. Chem. 2009, 81, 451–471. 10.1351/pac-con-08-06-02. [DOI] [Google Scholar]
- Zhu Z.; Xia Y.; Niu G.; Liu J.; Wang C.; Jiang H. Effect of Direct Fluorination on the Mechanical and Scratch Performance of Nitrile Butadiene Rubber. Wear 2017, 376–377, 1314–1320. 10.1016/j.wear.2016.12.013. [DOI] [Google Scholar]
- Arita K.; Shinonaga Y.; Nishino M. Plasma-Based Fluorine Ion Implantation into Dental Materials for Inhibition of Bacterial Adhesion. Dent. Mater. J. 2006, 25, 684–692. 10.4012/dmj.25.684. [DOI] [PubMed] [Google Scholar]
- Vega-Cantú Y.; Hauge R.; Norman L.; Billups W. E. Enhancement of the Chemical Resistance of Nitrile Rubber by Direct Fluorination. J. Appl. Polym. Sci. 2003, 89, 971–979. 10.1002/app.12212. [DOI] [Google Scholar]
- Du Toit F. J.; Sanderson R. D.; Engelbrecht W. J.; Wagener J. B. The Effect of Surface Fluorination on the Wettability of High Density Polyethylene. J. Fluorine Chem. 1995, 74, 43–48. 10.1016/0022-1139(94)03218-o. [DOI] [Google Scholar]
- Lee S.; Park J.-S.; Lee T. R. The Wettability of Fluoropolymer Surfaces: Influence of Surface Dipoles. Langmuir 2008, 24, 4817–4826. 10.1021/la700902h. [DOI] [PubMed] [Google Scholar]
- Achereiner F.Verbesserung von Adhäsionseigenschaften Verschiedener Polymerwerkstoffe Durch Gasphasenfluorierung. Doctoral Thesis (PhD), University Nuernberg-Erlangen, 2009. [Google Scholar]
- Tressaud A.; Durand E.; Labrugère C.; Kharitonov A. P.; Kharitonova L. N. Modification of Surface Properties of Carbon-Based and Polymeric Materials through Fluorination Routes: From Fundamental Research to Industrial Applications. J. Fluorine Chem. 2007, 128, 378–391. 10.1016/j.jfluchem.2006.12.015. [DOI] [Google Scholar]
- Chen M.; Ouyang L.; Lu T.; Wang H.; Meng F.; Yang Y.; Ning C.; Ma J.; Liu X. Enhanced Bioactivity and Bacteriostasis of Surface Fluorinated Polyetheretherketone. ACS Appl. Mater. Interfaces 2017, 9, 16824–16833. 10.1021/acsami.7b02521. [DOI] [PubMed] [Google Scholar]
- Sanderson R. D.; Du Toit F. J.; Carstens P. A. B.; Wagener J. B. Fluorination Rates of Polyolefins as a Function of Structure and Gas Atmosphere. J. Therm. Anal. Calorim. 1994, 41, 563–581. 10.1007/bf02549335. [DOI] [Google Scholar]
- Beamson G.; Briggs D.. High Resolution XPS of Organic Polymers: The Scienta ESCA 300 Database; Wiley, 1992.
- Ferraria A. M.; Lopes da Silva J. D.; Botelho do Rego A. M. XPS Studies of Directly Fluorinated HDPE: Problems and Solutions. Polymer 2003, 44, 7241–7249. 10.1016/j.polymer.2003.08.038. [DOI] [Google Scholar]
- O’Hagan D. Understanding Organofluorine Chemistry. An Introduction to the C–F Bond. Chem. Soc. Rev. 2008, 37, 308–319. 10.1039/b711844a. [DOI] [PubMed] [Google Scholar]
- Mayrhofer L.; Moras G.; Mulakaluri N.; Rajagopalan S.; Stevens P. A.; Moseler M. Fluorine-Terminated Diamond Surfaces as Dense Dipole Lattices: The Electrostatic Origin of Polar Hydrophobicity. J. Am. Chem. Soc. 2016, 138, 4018–4028. 10.1021/jacs.5b04073. [DOI] [PubMed] [Google Scholar]
- Roach P.; Eglin D.; Rohde K.; Perry C. C. Modern Biomaterials: A Review—Bulk Properties and Implications of Surface Modifications. J. Mater. Sci.: Mater. Med. 2007, 18, 1263–1277. 10.1007/s10856-006-0064-3. [DOI] [PubMed] [Google Scholar]
- Rabe M.; Verdes D.; Seeger S. Understanding Protein Adsorption Phenomena at Solid Surfaces. Adv. Colloid Interface Sci. 2011, 162, 87–106. 10.1016/j.cis.2010.12.007. [DOI] [PubMed] [Google Scholar]
- Tamada Y.; Ikada Y. Effect of Preadsorbed Proteins on Cell Adhesion to Polymer Surfaces. J. Colloid Interface Sci. 1993, 155, 334–339. 10.1006/jcis.1993.1044. [DOI] [Google Scholar]
- Tamada Y.; Ikada Y. Fibroblast Growth on Polymer Surfaces and Biosynthesis of Collagen. J. Biomed. Mater. Res. 1994, 28, 783–789. 10.1002/jbm.820280705. [DOI] [PubMed] [Google Scholar]
- Faucheux N.; Schweiss R.; Lützow K.; Werner C.; Groth T. Self-Assembled Monolayers with Different Terminating Groups as Model Substrates for Cell Adhesion Studies. Biomaterials 2004, 25, 2721–2730. 10.1016/j.biomaterials.2003.09.069. [DOI] [PubMed] [Google Scholar]
- Khalifehzadeh R.; Ciridon W.; Ratner B. D. Surface Fluorination of Polylactide as a Path to Improve Platelet Associated Hemocompatibility. Acta Biomater. 2018, 78, 23–35. 10.1016/j.actbio.2018.07.042. [DOI] [PubMed] [Google Scholar]
- Grinnell F.; Feld M. K. Initial Adhesion of Human Fibroblasts in Serum-Free Medium: Possible Role of Secreted Fibronectin. Cell 1979, 17, 117–129. 10.1016/0092-8674(79)90300-3. [DOI] [PubMed] [Google Scholar]
- Lee J. W.; Kim Y. H.; Park K. D.; Jee K. S.; Shin J. W.; Hahn S. B. Importance of Integrin Β1-Mediated Cell Adhesion on Biodegradable Polymers under Serum Depletion in Mesenchymal Stem Cells and Chondrocytes. Biomaterials 2004, 25, 1901–1909. 10.1016/j.biomaterials.2003.08.037. [DOI] [PubMed] [Google Scholar]
- Hoshiba T.; Yoshikawa C.; Sakakibara K. Characterization of Initial Cell Adhesion on Charged Polymer Substrates in Serum-Containing and Serum-Free Media. Langmuir 2018, 34, 4043–4051. 10.1021/acs.langmuir.8b00233. [DOI] [PubMed] [Google Scholar]
- Bettinger C. J.; Langer R.; Borenstein J. T. Engineering Substrate Microand Nanotopography to Control Cell Function. Angew. Chem., Int. Ed. Engl. 2009, 48, 5406–5415. 10.1002/anie.200805179. [DOI] [PMC free article] [PubMed] [Google Scholar]
- Choi C.-H.; Hagvall S. H.; Wu B. M.; Dunn J. C. Y.; Beygui R. E. Cell Interaction with Three-Dimensional Sharp-Tip Nanotopography. Biomaterials 2007, 28, 1672–1679. 10.1016/j.biomaterials.2006.11.031. [DOI] [PubMed] [Google Scholar]
- Owens D. K.; Wendt R. C. Estimation of the Surface Free Energy of Polymers. J. Appl. Polym. Sci. 1969, 13, 1741–1747. 10.1002/app.1969.070130815. [DOI] [Google Scholar]
- Smoluchowski M.Handbuch Der Elektrizität Und Des Magnetismus; Barth Verlag: Leipzig, 1921; Vol. 2. [Google Scholar]
- Sader J. E.; Chon J. W. M.; Mulvaney P. Calibration of Rectangular Atomic Force Microscope Cantilevers. Rev. Sci. Instrum. 1999, 70, 3967–3969. 10.1063/1.1150021. [DOI] [Google Scholar]
- Mould A. P. Analyzing Integrin-Dependent Adhesion. Curr. Protoc. Cell Biol. 2011, 53, 9.4.1–9.4.17. 10.1002/0471143030.cb0904s53. [DOI] [PubMed] [Google Scholar]


