

Abstract
Background
The presence and progression of hepatic (liver) fibrosis into cirrhosis is a prognostic variable having impact on survival in people with alcoholic liver disease. Liver biopsy, although an invasive method, is the recommended 'reference standard' for diagnosis and staging of hepatic fibrosis in people with liver diseases. Transient elastography is a non‐invasive method for assessing and staging hepatic fibrosis.
Objectives
To determine the diagnostic accuracy of transient elastography for diagnosis and staging hepatic fibrosis in people with alcoholic liver disease when compared with liver biopsy. To identify the optimal cut‐off values for differentiating the five stages of hepatic fibrosis.
Search methods
The Cochrane Hepato‐Biliary Group Controlled and Diagnostic Test Accuracy Studies Registers, The Cochrane Library, MEDLINE (OvidSP), EMBASE (OvidSP), and the Science Citation Index Expanded (last search August 2014).
Selection criteria
Diagnostic cohort and diagnostic case‐control study designs that assessed hepatic fibrosis in participants with alcoholic liver disease with transient elastography and liver biopsy, irrespective of language or publication status. The study participants could be of any sex and ethnic origin, above 16 years old, hospitalised or managed as outpatients. We excluded participants with viral hepatitis, autoimmunity, metabolic diseases, and toxins.
Data collection and analysis
We followed the guidelines in the draft Cochrane Handbook for Systematic Reviews of Diagnostic Test Accuracy.
Main results
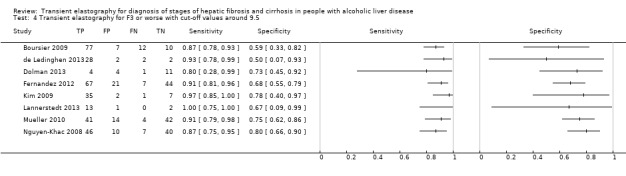
Five retrospective and nine prospective cohort studies with 834 participants provided data for the review analyses. Authors of seven of those studies sent us individual participant data. The risk of bias in the included studies was high in all but three studies. We could identify no serious concerns regarding the applicability of the studies in answering the main study question of our review, namely to use transient elastography to diagnose hepatic fibrosis. We could not identify the optimal cut‐off values for the fibrosis stages. The definition of the diagnosis of alcoholic liver disease was not provided in one study and was not clearly defined in two studies, but it was clear in the remaining 11 studies. The study authors used different liver stiffness cut‐off values of transient elastography for the hepatic fibrosis stages.
There was only one study (103 participants) with data on hepatic fibrosis stage F1 or worse, with a cut‐off of 5.9 kPa, and reporting sensitivity of 0.83 (95% confidence interval (CI) 0.74 to 0.90) and specificity of 0.88 (95% CI 0.47 to 1.00). The summary sensitivity and specificity of transient elastography for F2 or worse (seven studies with 338 participants and with cut‐offs around 7.5 kPa (range 7.00 to 7.8 kPa)) were 0.94 and 0.89 with LR+ 8.2 and LR‐ 0.07, which suggests that transient elastography could be useful to rule out the presence of significant hepatic fibrosis, thus avoiding liver biopsy.
Due to the wide range of cut‐off values (from 8.0 to 17.0 kPa) found in the 10 studies with 760 participants with hepatic fibrosis F3 or worse, we fitted a hierarchical summary receiver operating characteristic (HSROC) model and estimated a summary ROC (SROC) curve. The sensitivity of the 10 studies varied from 72% to 100% and the specificity from 59% to 89%. We performed an additional analysis by including the studies with a cut‐off value of around and equal to 9.5 kPa (range 8.0 to 11.0 kPa). The summary sensitivity and specificity of transient elastography (eight studies with 564 participants) were 0.92 and 0.70 with LR+ 3.1 and LR‐ 0.11, which suggests that transient elastography could also be useful to rule out the presence of severe hepatic fibrosis (F3 or worse), avoiding liver biopsy. We carried out a sensitivity analysis by considering only the studies with a cut‐off value equal to 9.5 kPa and the result did not differ.
We performed an HSROC analysis and reported an SROC curve for hepatic fibrosis stage F4 (cirrhosis). The HSROC analysis suggested that when the cut‐off value changes, there is a wide variation in specificity and a more limited variation in sensitivity. We performed an additional analysis with the studies with the most commonly used cut‐off value of 12.5 kPa. The summary sensitivity and specificity of transient elastography (seven studies with 330 participants) were 0.95 and 0.71 with LR+ 3.3 and LR‐ 0.07, which again suggests that transient elastography could be useful to rule out the presence of cirrhosis, avoiding liver biopsy.
Authors' conclusions
We identified a small number of studies with a few participants and were unable to include several studies, which raises the risk of outcome reporting bias. With these caveats in mind, transient elastography may be used as a diagnostic method to rule out liver cirrhosis (F4) in people with alcoholic liver disease when the pre‐test probability is about 51% (range 15% to 79%). Transient elastography may also help in ruling out severe fibrosis (F3 or worse). Liver biopsy investigation remains an option if the certainty to rule in or rule out the stage of hepatic fibrosis or cirrhosis remains insufficient after a clinical follow‐up or any other non‐invasive test considered useful by the clinician.
The proposed cut‐off values for the different stages of hepatic fibrosis may be used in clinical practice, but caution is needed, as those values reported in this review are only the most common cut‐off values used by the study authors. The best cut‐off values for hepatic fibrosis in people with alcoholic liver disease could not be established yet.
In order to diagnose correctly the stage of hepatic fibrosis in people with alcoholic liver disease using transient elastography assessment, the studies should consider a single aetiology. Hepatic fibrosis should be diagnosed with both transient elastography and liver biopsy and in this sequence, and transient elastography cut‐off values should be pre‐specified and validated. The time interval between the two investigations should not exceed three months, which is the interval mainly valid for people without cirrhosis, and assessment of results should be properly blinded. Only studies with low risk of bias, fulfilling the Standards for Reporting of Diagnostic Accuracy may answer the review question.
Keywords: Humans; Disease Progression; Elasticity Imaging Techniques; Elasticity Imaging Techniques/methods; Liver Cirrhosis; Liver Cirrhosis/diagnostic imaging; Liver Cirrhosis/pathology; Liver Diseases, Alcoholic; Liver Diseases, Alcoholic/complications; Prospective Studies; Retrospective Studies; Sensitivity and Specificity
Plain language summary
Transient elastography for measurement of liver fibrosis and cirrhosis in people with alcoholic liver disease
Background
Liver fibrosis is a change in the microscopic structure of the liver because of liver inflammation. After many years of excessive alcohol consumption, liver fibrosis progresses to cirrhosis. Abstaining from alcohol may stop the fibrosis from further progression into significant or severe fibrosis and cirrhosis. The latter lead to complications of underlying diseases, including cancer.
Measurement of the amount of fibrosis is called staging. There are five stages (F0: no scarring (no fibrosis); F1: minimal scarring; F2: scarring has occurred and extends outside the liver area (significant fibrosis); F3: fibrosis spreading and forming bridges with other fibrotic liver areas (severe fibrosis); F4: cirrhosis or advanced scarring). Cut‐off values may distinguish between the different stages of fibrosis, but in people with alcoholic liver disease, the best cut‐off values have not been determined yet.
Rationale
Liver biopsy is where a sample of tissue is taken from the liver using a small needle. It is the standard method of detecting and measuring fibrosis.
Transient elastography measures stiffening of the liver caused by progressive scarring, but it has not been validated in people with alcoholic liver disease.
Aims
To find out how well transient elastography may determine the presence or absence of fibrosis and if it can stage fibrosis in people with alcoholic liver disease when compared with liver biopsy.
Methods
Using Cochrane methods and searching the literature (August 2014), the review authors obtained results from 14 studies (834 participants), out of which only seven included people with only alcoholic liver disease. Participants underwent both transient elastography (the index test) and liver biopsy (the standard test).
Findings and conclusions
The number of studies and participants was small and the participants had different severity of liver fibrosis. Only four studies were judged good quality.
Transient elastography fibrosis stage F2 or worse (significant fibrosis)
There were seven studies with 338 participants: 81% of people had significant fibrosis. Out of 1000 people, 810 will have significant fibrosis. Of these 810 people, 49 people would be missed even though they had significant fibrosis. A clinical follow‐up could provide physicians with knowledge for the next diagnostic step. The remaining 190 people would not have significant fibrosis; 21 people would have unnecessary worries about their liver fibrosis stage.
Transient elastography fibrosis stage F3 or worse (severe fibrosis)
There were eight studies with 564 participants: 61% of people had severe fibrosis. Out of 1000 people, 610 would have severe fibrosis. Of these 610 people, 49 people would be missed even though they had severe fibrosis. A clinical follow‐up could provide physicians with knowledge for the next diagnostic step. The remaining 390 people would not have severe fibrosis; 117 people would have unnecessary worries about their liver fibrosis stage.
Transient elastography fibrosis stage F4 (cirrhosis)
There were seven studies with 330 participants: 51% of people had cirrhosis. Out of 1000 people, 510 will have cirrhosis. Of these 510 people, 26 people would be missed even though they had cirrhosis. A clinical follow‐up could provide physicians with knowledge for the next diagnostic step. The remaining 490 people would not have cirrhosis; 143 people would have unnecessary worries about their liver fibrosis stage.
Transient elastography may be used as a diagnostic tool to rule out liver cirrhosis and may also help in ruling out severe fibrosis in people with alcoholic liver disease. Liver biopsy investigation still remains an option if the certainty to rule in or rule out the stage of hepatic fibrosis or cirrhosis remains insufficient after a clinical follow‐up or any other non‐invasive test considered useful by the clinician.
The best cut‐off values for differentiating between the five liver fibrosis stages could still not be established.
Future studies should include only people with alcoholic liver disease. Hepatic fibrosis should be diagnosed with transient elastography followed by liver biopsy and the transient elastography cut‐off values of liver stiffness for the different stages of liver fibrosis should be decided before the test occurs. The time interval between the two tests should not exceed three months, an interval that is mainly valid for people without cirrhosis. Assessors of results should be unaware of the treatment given.
Summary of findings
Summary of findings'. 'Transient elastography for diagnosis of stages of hepatic fibrosis and cirrhosis in people with alcoholic liver disease.
| What is the diagnostic accuracy of transient elastography examination for the different stages of hepatic fibrosis or cirrhosis at different cut‐off values? | ||||||
|
Patients/population: people (men and women) diagnosed with alcoholic liver disease on liver biopsy and transient elastography. Prior testing: ‐ Settings: outpatients and inpatients. Index test: transient elastography. Importance: transient elastography is a non‐invasive test. The risk of the liver biopsy performance and complications is avoided. Reference standard: liver biopsy. Studies: cross‐sectional studies. No case‐control studies were found. Individual patient data: obtained from 7 studies. | ||||||
| Stage of hepatic fibrosis | Summary accuracy (95% CI) | No. of participants (studies) |
Prevalence mean (range) |
Implications |
Post‐test probability Post‐test probability when the test is positive Post‐test probability when the test is negative |
Quality and comments |
| Transient elastography fibrosis stage F2 or worse | ||||||
| Cut‐off around 7.5 kPa (range 7.0 to 7.8). Significant fibrosis. | Sensitivity 0.94 (95% CI 0.86 to 0.97) Specificity 0.89 (95% CI 0.76 to 0.95) LR+ 8.2 (95% CI 3.6 to 18.5) LR‐ 0.07 (95% CI 0.03 to 0.17) |
338 participants (7 studies) | 81% (range 29% to 97%) | With a prevalence of 81%, 810 out of 1000 people will have significant fibrosis. Of these 810 people, 49 (6% of 810) people will be missed as having significant fibrosis. A clinical follow‐up can provide physicians with knowledge for the next diagnostic step that should be taken. The remaining 190 people will not have significant fibrosis. 21 people (11% of 190), i.e., the false positives, will have unnecessary worries about their liver fibrosis stage. However, as the treatment is not a pharmacological treatment, there should be no serious adverse physical outcomes for these people.** |
Positive test 97%* Negative test 23%* |
The overall quality of the studies in terms of bias risk was assessed as moderate. 3 (43%) of the studies included 20 or < than 20 participants. Study design (mixed aetiologies); risk of selection bias (not all participants included in the analyses). |
| Transient elastography fibrosis stage F3 or worse | ||||||
| Cut‐off around 9.5 kPa (range 8.0 to 11.0). Severe fibrosis. |
Sensitivity 0.92 (95% CI 0.89 to 0.96) Specificity 0.70 (95% CI 0.61 to 0.79) LR+ 3.1 (95% CI 2.1 to 4.1) LR‐ 0.11 (95% CI 0.06 to 0.16) |
564 participants (8 studies) | 61% (range 25% to 88%) | With a prevalence of 61%, 610 out of 1000 people will have severe fibrosis. Of these 610 people, 49 (8% of 610) people will be missed as having severe fibrosis. A clinical follow‐up can provide physicians with knowledge for the next diagnostic step that should be taken. The remaining 390 people will not have severe fibrosis. 117 people (30% of 390), i.e., the false positives, will have unnecessary worries about their liver fibrosis stage. However, as the treatment is not a pharmacological treatment, there should be no serious adverse physical outcomes for these people.** |
Positive test 83%* Negative test 15%* |
The overall quality of the studies in terms of bias risk was assessed as moderate. 2 (25%) of the studies included 20 or < 20 participants. Study design (mixed aetiologies); risk of selection bias (not all participants included in the analyses). |
| Transient elastography fibrosis stage F4 | ||||||
| Cut‐off of 12.5 (most common). Cirrhosis. | Sensitivity 0.95 (95% CI 0.87 to 0.98) Specificity 0.71 (95% CI 0.56 to 0.82) LR+ 3.3 (95% CI 2.1 to 5.0) LR‐ 0.07 (95% CI 0.03 to 0.19) |
330 participants (7 studies) | 51% (range 15% to 79%) | With a prevalence of 51%, 510 out of 1000 people will have cirrhosis. Of these 510 people, 26 (5% of 510) people will be missed as having severe fibrosis. A clinical follow‐up can provide physicians with knowledge for the next diagnostic step that should be taken. The remaining 490 people will not have cirrhosis. 143 (29% of 490) people, i.e., the false positives, will have unnecessary worries about their liver fibrosis stage. However, as the treatment is not a pharmacological treatment, there should be no serious adverse physical outcomes for these people.** |
Positive test 77%* Negative test 7%* |
The overall quality of the studies in terms of bias risk was assessed as moderate. 3 (43%) of the studies included 20 or < 20 participants. Study design (mixed aetiologies); risk of selection bias (not all participants included in the analyses). |
LR+: likelihood ratio positive; LR‐: likelihood ratio negative.
* The post‐test probability when the test is positive and when the test is negative is calculated based on the pre‐test probability estimated by the prevalence of significant fibrosis.
** We considered the mean prevalence of significant or severe fibrosis for the calculations of the number reported in 'Consequences in a cohort of 1000 participants'. The number of false negatives were calculated using the pooled summary sensitivity, and the number of false positives were calculated using the summary specificity (as reported in the table).
Note: the results in this table should not be interpreted in isolation from the results of the individual included studies contributing to each summary test accuracy measure. These are reported in the main body of the text of the review.
Background
Transient elastography is a widely used non‐invasive method for assessing and staging hepatic fibrosis (scarring of the liver tissue). Transient elastography measures stiffening of the liver, which is caused by progressive scarring. Transient elastography assessment of hepatic (liver) fibrosis has already been validated in many people with chronic liver diseases of various aetiologies (Sandrin 2003; Nahon 2008). It is important to define the cut‐off values that could differentiate hepatic fibrosis stages. In fact, cut‐off levels for specific stages of hepatic fibrosis vary according to the aetiology of the chronic liver disease. In people with alcoholic liver disease, such cut‐off values have not been established and validated yet (Rockey 2008).
Excessive alcohol consumption may lead to alcohol‐related liver disease. Every year, alcohol use kills 2.5 million people, including 320,000 young people between 15 and 29 years of age. Alcohol is the third leading risk factor for poor health globally, and harmful use of alcohol was responsible for almost 4% of all deaths in the world, according to the estimates for 2004 (WHO 2010). Alcoholism is a disease that damages the brain, liver, heart, and other organs. Heavy alcohol consumption can lead to brain shrinkage, dementia, alcoholism, cancer, and death. Negative effects of alcohol include liver damage and multiple liver diseases, including liver cirrhosis and cancer (Bruha 2012).
The presence and progression of hepatic fibrosis into cirrhosis is a main prognostic variable having impact on survival in people with alcoholic liver disease. Transient elastography may indicate the amount of hepatic fibrosis in people with alcoholic liver disease (de Lédinghen 2010). A number of clinical studies have compared liver stiffness measured by transient elastography with presence and histological staging of hepatic fibrosis by liver biopsy, reaching a conclusion that transient elastography is a reliable method for assessment of hepatic fibrosis (Foucher 2006; Gómez‐Domínguez 2006; Ivashkin 2011a; Tsochatzis 2011). In addition, studies have found a correlation between the level of liver stiffness and the degree of hepatic fibrosis in people with alcoholic liver disease (Nguyen‐Khac 2008; Nahon 2009; Mueller 2010). The prevalence of hepatic fibrosis in heavy drinkers is not well known. In a series of 1407 people with alcoholic liver disease diagnosed on liver biopsy, 809 (57.5%) people had developed hepatic fibrosis (Naveau 1997). Accurate detection of hepatic fibrosis stage is important for prognosis of hepatic fibrosis and choice of treatment in people with alcohol‐related liver injury (O'Shea 2010).
Target condition being diagnosed
Hepatic fibrosis in people with alcoholic liver disease
All people with alcoholic liver disease are at risk of developing hepatic fibrosis. This risk is considered higher in people who are binge drinkers, people with increased serum alanine aminotransferase (ALT) and aspartate aminotransferase (AST) levels, or in people with severe alcohol hepatitis on liver biopsy (Bouchier 1992).
Hepatic fibrosis may develop as a result of weekly alcohol consumption of seven to 13 alcoholic beverages for women (one beverage = 12 g alcohol) and 14 to 27 alcoholic beverages for men in the course of five or more years (Savolainen 1993; Becker 1996). The risk ratio of progression of fibrosis to cirrhosis increases significantly with a daily consumption of 20 g to 40 g ethanol in women and more than 80 g ethanol in men (Sherlock 1997; O'Shea 2010).
The liver is the main site of alcohol metabolism acting through two hepatic enzymes, alcohol dehydrogenase and cytochrome P‐450 (CYP) 2E1. Increased alcohol intake disrupts the metabolic liver function, and, as a result, alcoholic liver disease develops (Stewart 2001). Histologically, alcoholic liver disease occurs in three forms: fatty liver or steatosis, alcoholic hepatitis, and chronic hepatitis with hepatic fibrosis and cirrhosis (O'Shea 2010). Morphological features that predict progression to hepatic fibrosis and cirrhosis include severe steatosis, giant mitochondria, and the presence of mixed macrovesicular‐microvesicular steatosis (Teli 1995).
Early staging of hepatic fibrosis in people with alcoholic liver diseases could motivate patients and physicians in finding an optimal strategy for achieving abstinence. A single staging system for evaluating hepatic fibrosis in alcoholic liver disease does not exist. METAVIR is the most widely used scoring system for interpretation of liver biopsy results based on the stage of fibrosis where F0 indicates no fibrosis, F1 indicates portal fibrous expansion, F2 indicates thin fibrous septa emanating from portal triads, F3 indicates fibrous septa bridging portal triads and central veins, and F4 indicates cirrhosis (Table 2). Hepatic fibrosis could be considered clinically significant if defined as F2 or worse than F2, using METAVIR score (Franciscus 2007). Hepatic fibrosis could be considered clinically severe if defined as F3 or worse than F3, using METAVIR score (F3 and F4). In Table 2, we have also included other widely used systems for classification of hepatic fibrosis in people with alcoholic liver disease (Knodell 1981; Desmet 1994; Ishak 1995; Brunt 1999; Kleiner 2005), as liver pathologists have reached no universal consensus on the standardisation of scoring systems.
1. Semi‐quantitative histopathological scoring systems for progression of fibrosis to cirrhosis. Conversion grid for the stages of hepatic fibrosis*.
| Stage of estimated fibrosis | ||||||
| METAVIR | Knodell | Ishak | Kleiner | Desmet | Brunt | Batts‐Ludwig |
| F0 | F0 | F0 | F0 | F0 | F0 | F0 |
| F1 | F1 | F1 | F1 | F1 | F1 | F1 |
| F1 | F1 | F2 | F1 | F1 | F1 | F1 |
| F2 | F3 | F3 | F2 | F2 | F2 | F2 |
| F3 | F3 | F4 | F2 | F3 | F3 | F3 |
| F4 | F4 | F5 | F3 | F4 | F4 | F4 |
| F4 | F4 | F6 | F4 | F4 | F4 | F4 |
F: stage of hepatic fibrosis F0: no fibrosis; F1: portal fibrous expansion; F2: thin fibrous septa emanating from portal triads; F3: fibrous septa bridging portal triads and central veins; F4: cirrhosis. Clinically significant fibrosis is generally defined as F2 or worse (on the METAVIR scale from F0 to F4 with F4 being cirrhosis). METAVIR, Knodell, Ishak, Kleiner, Desmet, and Brunt scoring systems are used to classify fibrosis (and steatosis) due to alcoholic liver disease. For references, please see review text. *Adapted from Goodman 2007.
Index test(s)
Transient elastography is designed to measure liver stiffness, using FibroScan® equipment (Echosens, Paris, France; Echosens 2009). A probe, consisting of an ultrasound transducer located at the end of a vibrating piston, is put on the skin surface overlying the liver while the person is in the supine position. After pressing the button on the probe, a pulse wave is transmitted across the liver parenchyma. After a short interval, a second ultrasound wave is transmitted. The difference between the velocities of the two waves in the liver parenchyma is calculated using the Doppler technique (Sandrin 2003; Nahon 2008). As it is known from physical principles, the velocity of the pulse wave increases with the stiffness of the liver parenchyma, corresponding to increasing severity of fibrosis.
Liver stiffness is expressed as the median value of 10 valid measurements in kiloPascals (kPa). The findings of 'normal' liver stiffness values for apparently healthy women and men differ in different studies, lying between 3.3 kPa and 7.0 kPa, using the 5th and 95th percentiles (Roulot 2008; Kim 2012). While age is does not affect liver stiffness, men compared to women have slightly higher liver stiffness values (Roulot 2008). A pre‐defined cut‐off of 8.00 kPa is predictive of severe hepatic fibrosis in alcoholic liver disease, of F3 or worse by the METAVIR scoring system (Mueller 2010). The transient elastography method is non‐invasive, simple, highly reproducible, and allows examination of at least 100 times larger volume of liver tissue compared to a liver sample obtained through liver biopsy (de Lédinghen 2008). This is why the sampling error of transient elastography investigation is considered less than with liver biopsy (Ingiliz 2009). Transient elastography increases its diagnostic accuracy when applied in combination with serum markers (Castera 2010). The diagnostic accuracy of transient elastography was compared with alternative tests such as acoustic radiation forced impulse (ARFI) imaging and enhanced liver fibrosis (ELF) test, concluding that transient elastography can be used for diagnosis of hepatic fibrosis alone or in combination with any of them (Crespo 2012). Janssens et al. have shown that transient elastography is more accurate than currently available serum markers for people with chronic hepatitis C (Janssens 2010). However, the diagnostic accuracy of transient elastography in people with alcoholic liver disease is not established yet.
Alternative test(s)
Different methods to perform elasticity measurements have been developed since 1990. They are aimed at quantifying the elasticity or viscoelasticity of the liver tissue. There are two common elements in every elasticity imaging method: a force or stress is applied on the liver tissue and the obtained mechanical response is measured.
Siemens Ltd. (i.e., ACUSON S2000) has developed a medical technology that can detect hepatic fibrosis, and hence, it enables the quantification of the hepatic fibrosis in its different stages. The technology is also called liver elastography, performed using ARFI imaging (Iyo 2009). ARFI imaging is faster than conventional methods as ARFI uses higher frequencies that are comparable to those used in colour Doppler imaging. The images have greater contrast and the boundary of the focal lesions are better defined compared with the conventional ultrasonography imagining techniques (Iyo 2009).
Ultrasonography measures the progression or regression of hepatic fibrosis in alcoholic liver disease (Caballeria 1998). It allows investigation of the hepatic tissue through generation of ultrasonic waves. Different ultrasonography impedance indices based on Echo‐colour Doppler variables of the liver blood flow have been proposed for indirect estimation of the stage of hepatic fibrosis (Ersoz 1999; Hizli 2010; Ivashkin 2011a). We undertook this systematic review to assess the diagnostic accuracy of ultrasonography for staging hepatic fibrosis and detecting cirrhosis in people with alcoholic liver disease (Pavlov 2014a).
Supersonic shear imaging (SSI) is a technique that uses tissue elasticity to detect hepatic fibrosis and steatosis. It is based on velocity estimation of a shear wave, generated by a radiation force (Bercoff 2004).
Magnetic resonance elastography (MRE) combines magnetic resonance imaging (MRI) with sound waves to create a visual map (elastogram) showing the stiffness of the liver tissue. It is used primarily to detect hardening of the liver caused by different types of liver diseases, including those of alcoholic aetiology (Jin 2007).
Other alternative non‐invasive tests (apart from venepuncture) to transient elastography are laboratory tests such as AST (aspartate aminotransferase) to ALT (alanine aminotransferase) ratio, prothrombin index, hyaluronic acid, ELF, etc. (Crespo 2012; Liu 2012). All of these tests are used as surrogate markers for staging of hepatic fibrosis (Gluud 2007). In addition, different combinations of biochemical tests such as FibroTest® and Fibrometre® are used for diagnosis and staging of hepatic fibrosis in people with alcoholic liver disease (Morra 2007; Poynard 2007; Poynard 2008; Angulo 2009a). We are also undertaking a systematic review to determine the diagnostic accuracy of transient elastography plus FibroTest® versus FibroTest® alone for diagnosis of hepatic fibrosis in adults with chronic hepatitis C (Pavlov 2014b).
Clinical pathway
Figure 1 presents the clinical pathway in diagnosis of alcoholic liver disease.
1.
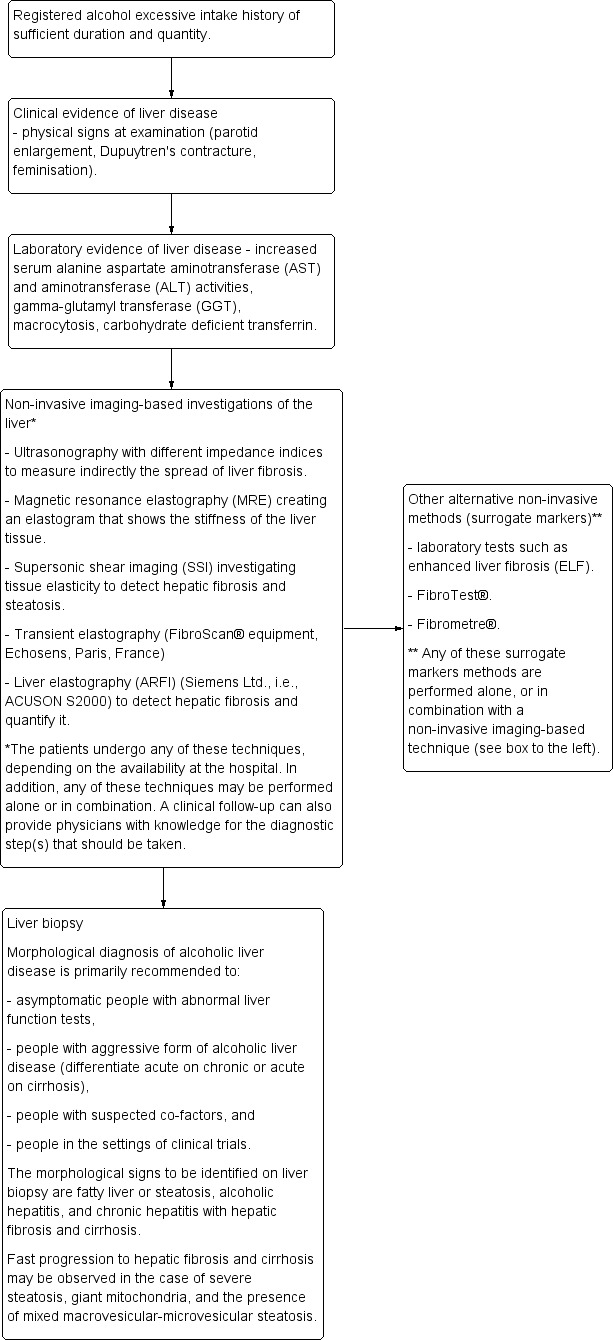
Clinical pathway in the diagnosis of alcoholic liver disease.
Rationale
Liver biopsy has so far been considered the standard method for detection of hepatic fibrosis and its staging, using different semi‐quantitative morphological scores on liver tissue samples with a size of no more than 1 to 2 cm3 (Table 2). One advantage of liver biopsy is that it may give diagnostic information for concurrent liver diseases (Poulsen 1979; Ismail 2011). However, there are a number of disadvantages with liver biopsy. It is invasive, and it may have potential risks to the person, such as punctures of abdominal organs and haemorrhage. Liver biopsy can be painful, time‐consuming, and stressful for the person and depends on the physician's experience and skills (Grant 1999; O'Shea 2010; Ivashkin 2011b). The risk of haemorrhage and death after a percutaneous liver biopsy is especially higher in people with a platelet count of 60,000 per mm3 or less, and also in people with an international normalisation ratio greater than 1.3 (Seeff 2010). Transjugular liver biopsy seemed a safer alternative for people with low numbers of platelets or clotting abnormalities. The small size of the tissue samples, either obtained transcutaneously or via the transjugular route, may also lead to sampling errors.
Consensus on using transient elastography as a non‐invasive method for diagnosis of hepatic fibrosis has not been established (Rockey 2008; Sagir 2008; Colli 2010; Yashima 2011; Yoshioka 2013). As for interventions, clinicians should request solid evidence for diagnostic tests (Colli 2014). It has been shown that confounding factors such as inflammation, cholestasis, and increased hepatic vein congestion (e.g., chronic heart failure), influence the precision of transient elastography irrespective of the aetiology of the underlying liver disease (Rockey 2008; Colli 2010). Increased body mass index, sex, and age are not considered confounding factors, but they may affect the number of reliable results (i.e., success rate).
Published meta‐analyses demonstrated that cause of liver disease is the most important factor leading to heterogeneity of transient elastography results, thus indicating that the different chronic liver diseases should be analysed separately (Friedrich‐Rust 2008; Poynard 2008; Stebbing 2010; Tsochatzis 2011). However, these meta‐analyses obtained results for all causes of liver disease together, which may become a limitation for determining the diagnostic accuracy of the method of transient elastography when used to diagnose hepatic fibrosis in people with alcoholic liver disease. Furthermore, these meta‐analyses did not examine in detail the possible confounding influences of factors such as the degree of hepatic steatosis or the level of liver inflammation activity in people with alcoholic liver disease (Savolainen 1993). This review aimed to complete present research and to study further the diagnostic accuracy of transient elastography in detecting the presence or absence of hepatic fibrosis in people with alcoholic liver disease, and to establish the optimal cut‐off values for differentiating between the hepatic fibrosis stages, following The Cochrane Collaboration methodology (SRDTA Handbook). In addition, this review will help researchers working on designing interventions for people with alcoholic liver disease by knowing the grade and progression of fibrosis and cirrhosis.
Objectives
To determine the diagnostic accuracy of transient elastography for diagnosis and staging hepatic fibrosis in people with alcoholic liver disease when compared with liver biopsy. In addition, to identify the optimal cut‐off values for differentiating the five stages of hepatic fibrosis.
Methods
Criteria for considering studies for this review
Types of studies
We sought to include diagnostic cohort studies and diagnostic case‐control studies that had assessed hepatic fibrosis in participants with alcoholic liver disease through transient elastography and liver biopsy, irrespective of language or publication status, or whether data were collected prospectively or retrospectively. We considered studies for inclusion also if they had included participants with different aetiologies of liver disease.
Participants
The studies had to include participants of any sex and ethnic origin, above 16 years old, and diagnosed with alcoholic liver disease. The participants could have been hospitalised or managed as outpatients. The diagnosis of alcoholic liver disease in the study participants had to be established based on registered history of excessive intake of alcohol of sufficient duration and quantity together with clinical evidence of liver disease expressed with physical signs at examination and followed by laboratory evidence of liver disease. To ascertain the diagnosis of alcoholic liver disease and study the presence or absence of hepatic fibrosis or cirrhosis, the studies had to perform both transient elastography and liver biopsy (Bouchier 1992).
For this review, we did not consider for inclusion data on participants diagnosed with alcoholic liver disease and having a concomitant liver disease such as non‐alcoholic fatty liver disease, chronic hepatitis C virus infection, chronic hepatitis B virus infection, autoimmune liver disease, or human immunodeficiency virus (HIV) infection. We extracted data on study participants with alcoholic liver disease alone whenever such data were available in the study report or whenever we could obtain the data required for the review through personal communication with study authors. In the latter case, we disregarded some of the data presented in the publication and used the data provided by the study authors through personal communication.
Index tests
Transient elastography, a non‐invasive test measuring liver stiffness in kiloPascals (kPa).
Following the recommended technical parameters for transient elastography and to ensure the validity of the transient elastography result for every participant in the single studies, participants should have undergone at least 10 validated stiffness measurements at the same measurement point. The measurements should have had an interquartile range of 30% or less, and the ratio of the number of successful measurements to the total number of acquisitions should have been 60% or less (Echosens 2009). We only considered data from people who provided the full set of the described data.
Transient elastography is not recommended for use in pregnant women, people with pacemakers, and people with ascites. Factors that may influence the success of transient elastography investigation are experience of the operator and body mass index of the person. Liver stiffness measurement can produce biased results depending on the grade of necro‐inflammation and grade of steatosis (Myers 2010).
Target conditions
The presence of hepatic fibrosis in people with alcoholic liver disease. Based on the METAVIR histopathological score for interpreting liver biopsy, there are five stages of hepatic fibrosis (Table 2).
F0: no fibrosis.
F1: mild fibrosis.
F2: significant fibrosis.
F3: severe fibrosis.
F4: cirrhosis.
We dichotomised the hepatic fibrosis estimated by the METAVIR score as follows:
people with METAVIR score of F1 or worse were considered 'diseased' and people with METAVIR score of F0 are considered 'non‐diseased';
people with METAVIR score of F2 or worse were considered 'diseased' and people with METAVIR score of F0 plus F1 are considered 'non‐diseased';
people with METAVIR score of F3 or worse were considered 'diseased' and people with METAVIR score of F0 plus F1 plus F2 are considered 'non‐diseased';
people with METAVIR score of F4 were considered 'diseased' and people with METAVIR score of F0 plus F1 plus F2 plus F3 are considered 'non‐diseased'.
Reference standards
Liver biopsy is the reference standard that is obtained by percutaneous needle techniques, transjugular method, ultrasound‐guided fine‐needle, or surgical specimens (Kuntz 2008; Ivashkin 2011b).
Liver biopsy is the only existing reference standard so far for diagnosing hepatic fibrosis stages in people with alcoholic liver disease. Specimens of liver tissue with a mean length of at least 15 mm and at least seven portal tracts are among the factors that can provide reliable morphological staging of hepatic fibrosis and grading of inflammation (Rockey 2009).
If liver biopsy samples were reported with any of the semi‐quantitative scores, that is, METAVIR (Franciscus 2007), Knodell (Franciscus 2007), Ishak (Franciscus 2007), Kleiner (Kleiner 2005), Scheuer (Regev 2002), Brunt (Brunt 1999), or Batts‐Ludwig (Haque 2010), we used a conversion grid for hepatic fibrosis staging adapted after Goodman 2007 (Table 2) to unify results on the grade of hepatic fibrosis on liver biopsy. For grading alcoholic steatosis, we used the Nonalcoholic Steatohepatitis Clinical Research Network scoring system (Kleiner 2005) (Table 3).
2. Nonalcoholic Steatohepatitis Clinical Research Network scoring system for grade of hepatic steatosis.
| Evaluation of parenchymal involvement by steatosis | Steatosis grade |
| < 5% | 0 |
| 5% to 33% | 1 |
| 34% to 66% | 2 |
| > 66% | 3 |
Search methods for identification of studies
We combined electronic searches with reading references of identified studies of possible interest.
Electronic searches
We searched The Cochrane Hepato‐Biliary Group Controlled Trials Register (August 2014), The Cochrane Hepato‐Biliary Group Diagnostic Test Accuracy Studies Register (August 2014), The Cochrane Library (2014, Issue 7), MEDLINE (OvidSP) (1946 to August 2014), EMBASE (OvidSP) (1974 to August 2014), and Science Citation Index Expanded (1900 to August 2014) (Royle 2003; de Vet 2008).
We also screened references of the retrieved studies to identify other potentially relevant studies for inclusion in our review.
Appendix 1 shows the search strategies for the different databases with the time spans for the searches. The given search strategies did not differ from those provided in the published protocol.
Searching other resources
Abstracts, published in conference proceedings or presented as posters, were also eligible for inclusion if retrieved with the search results or if found in the reference lists of the studies of interest to this review.
Data collection and analysis
We followed the guidelines provided in the Cochrane Handbook for Diagnostic Test Accuracy Reviews, which is still in preparation (Reitsma 2005; de Vet 2008).
Selection of studies
Two review authors (CP and DN) independently identified studies for possible inclusion in the review. By reading titles or abstracts or both of the identified studies, we excluded references with a study design not fulfilling the inclusion criteria of our review protocol. Then, we retrieved the full text of the remaining references. During this second selection, we grouped multiple publications on a study fulfilling the inclusion criteria together, and then screened these publications for complimentary data or checked them for discrepancies of data. If in doubt, CP and DN wrote emails to the study authors.
The studies that we included assessed transient elastography in the diagnosis of hepatic fibrosis severity using liver biopsy as the reference standard.
The maximum time interval between liver biopsy and transient elastography investigations was not to exceed three months. However, at the time of extraction of study data for our review, we decided to also include studies with intervals of more than three months, and then perform sensitivity analyses in which we included studies with up to three months' interval between the liver biopsy and transient elastography assessments.
Data extraction and management
Two review authors (CP and DN) extracted data, using a data extraction sheet. Two other review authors (GC and ET) checked the extraction of all data. A fifth review author (CG) was an arbitrator in case of disagreements between the review authors who extracted the information.
We extracted the following data: study origin, year and language of publication, study design, participants' epidemiological and laboratory characteristics, definition of alcoholic liver disease as defined by the authors of the individual studies considered for inclusion, technical failures in undertaking liver biopsy and transient elastography, cut‐off values of liver stiffness, grade of hepatic fibrosis estimated by a morphological score, and information related to the QUADAS‐2 items for evaluation of the bias risk of the studies (Whiting 2011).
In order to provide data for our analyses, the studies had to provide data that could help us calculate the true positive (TP), false positive (FP), true negative (TN), and false negative (FN) diagnostic values of the reference standard, liver biopsy, as well as the index test, transient elastography, for diagnosing the stages of hepatic fibrosis, based on semi‐quantitative morphological scores and cut‐off points for liver stiffness, and as described by the authors of the identified studies.
If information on any of the TP, FP, FN, and TN diagnostic test values or results were missing, we attempted to contact the authors of the included studies in order to obtain this or other missing information.
In the cases when authors sent us individual data, we extracted data on the TP, FP, FN, and TN using the most common cut‐off value for each target condition.
Assessment of methodological quality
Design flaws in test accuracy studies can produce biased results (Lijmer 1999; Whiting 2004; Rutjes 2006). In addition, evaluation of study results is quite often impossible due to incomplete reporting (Smidt 2005).
To limit the influence of different biases, three review authors (CP, GC, and DN) independently assessed the bias risk of the included diagnostic test accuracy studies, using QUADAS‐2 domains (Whiting 2011). A fourth review author (ET) acted as an arbitrator in case of disagreements between the review authors assessing the bias risk of the studies. To assess correctly the bias risk of the studies, we attempted to contact study authors for more information on methodology
The presented items in Appendix 2 are adopted to serve the purposes of our review in addressing the patient spectrum, index test, target condition, and reference standard, and flow and timing, and which answers would also reflect the overall quality of the included studies.
QUADAS‐2 is not used to generate a summary 'quality score' because of the well‐known problems associated with such scores (Jüni 1999; Whiting 2005). If a study is judged as 'low' on all domains relating to bias or applicability, then it is appropriate to have an overall judgement of 'low risk of bias' or 'low concern regarding applicability' for that study. If a study is judged as 'high' or 'unclear' on one or more domains, then it may be judged 'at risk of bias' or as having 'concerns regarding applicability'.
We used tabular and graphical displays to summarise QUADAS‐2 assessments.
Statistical analysis and data synthesis
We carried out the analyses following Chapter 10 (Analysing and Presenting Results), as recommended in the Cochrane Handbook for Systematic Reviews of Diagnostic Test Accuracy (Macaskill 2010). We used the Review Manager 5 software for analyses and plots (RevMan 2012).
We built two‐by‐two tables of the transient elastography performance (TP, TN, FP, FN) for each primary study and for all of the pre‐defined target conditions (mild hepatic fibrosis, significant hepatic fibrosis, severe hepatic fibrosis, and cirrhosis). We estimated sensitivity, specificity, positive and negative likelihood ratios (LR+ and LR‐), positive and negative predictive values (PPV and NPV) with their 95% confidence intervals (CI). First, we performed a graphical descriptive analysis of the included studies: we reported forest plots (sensitivity and specificity separately, with their 95% CIs) and we provided a graphical representation of the studies in the receiver operating characteristic (ROC) space (sensitivity against 1 ‐ specificity). Second, where appropriate, we performed a meta‐analysis. When the primary studies reported accuracy estimates of transient elastography using different cut‐off points, we used the hierarchical summary ROC model (HSROC) to pool data (sensitivities and specificities) and to plot a summary ROC (SROC) curve (Rutter 2001). When considering studies with a common cut‐off, we used the bivariate model and we provided the estimate of the summary operating point (the point with mean sensitivity and mean specificity). Finally, when, due to a low variability of sensitivity or specificity (or both) across studies, the bivariate model failed to converge, we fitted a bivariate model without random effects, and we estimated a summary operating point. In particular, we performed the analyses using bivariate models with random effects for only specificity (or for only sensitivity) or bivariate models without random effects, as appropriate (Macaskill 2010).
The pooled estimates obtained from the fitted models were used to calculate summary estimates of LRs. We assessed the usefulness of transient elastography to rule in or to rule out hepatic fibrosis by considering the estimates of likelihood ratios. An LR+ greater than 10 means that there is a large increase in post‐test probability, starting from pre‐test probability. An LR‐ lower than 0.1 means that there is a large decrease in post‐test probability, starting from pre‐test probability (Schoenfeld 1999).
For primary studies that reported accuracy results for more than one cut‐off point, we reported sensitivities and specificities for all of the cut‐off points, but we used a single cut‐off point for each study in HSROC (or bivariate model) analysis. We planned to base the choice of the cut‐off value on the maximum of the Youden's index (sensitivity + specificity ‐ 1), but instead, we decided to use the most commonly reported cut‐off value for each stage of hepatic fibrosis whenever these data were available in the published articles or retrieved through personal communication.
Finally, whenever possible, we added some relevant co‐variates (see Investigations of heterogeneity) to the bivariate or HSROC model to investigate the effect of the pre‐defined sources of heterogeneity.
One review author (GC) did all statistical analyses performed with SAS statistical software, release 9.2 (SAS Institute Inc., Cary, NC, USA).
Investigations of heterogeneity
We attempted to investigate the sources of heterogeneity by evaluating differences of diagnostic accuracy in pre‐defined subgroups, related to:
-
liver biopsy as the reference standard:
different grade of inflammation according to the liver biopsy (below two grades compared to two or greater grades of activity);
different lengths of liver biopsy sample (less than 15 mm compared to 15 mm or more than 15 mm);
different number of portal tracts included in a liver biopsy sample (less than seven compared to seven or more than seven);
different grades of steatosis according to the liver biopsy (less than 5% compared to 5% or more than 5%);
mild fibrosis compared to significant fibrosis compared to severe fibrosis or cirrhosis as estimated by the different semi‐quantitative histopathological scoring systems used (see Table 2);
-
population group:
different body mass indices (below 25 kg/m2 compared to 25 kg/m2 or more than 25 kg/m2) (WHO);
serum levels of AST activity (normal, i.e., 5 to 35 U/L, compared to twice the upper limit (Dufour 2000));
definition of alcoholic liver disease.
We attempted to evaluate the effect of the above‐mentioned sources of heterogeneity on the accuracy estimates by adding co‐variates to the bivariate or HSROC models.
Sensitivity analyses
We attempted to assess the effect of risk of bias of the included studies on the diagnostic accuracy by performing a sensitivity analysis, excluding studies with high risk of bias. We classified a study with high risk of bias if judged as high risk of bias or unclear risk of bias in at least one of the domains of QUADAS‐2 (Appendix 2).
Moreover, to assess the effect of time interval between transient elastography and liver biopsy, we performed a second sensitivity analysis by considering only studies with up to three months' interval.
Due to variation of cut‐off values, overlap of cut‐off values, and lack of sufficient data to produce subgroup analyses, we performed one additional sensitivity analysis in which we removed studies with cut‐off values different to the most common cut‐off value of 9.5 kPa for severe fibrosis and cirrhosis (see Data table 5).
5. Test.
Transient elastography for F3 or worse with a cut‐off value equal to 9.5.
Assessment of reporting bias
Using the suggested method by Deeks et al. (Deeks 2005), we performed a funnel plot to investigate the reporting bias by visual inspection of the patterns drawn from study data, where lack of symmetry should denote high risk of reporting bias (Figure 2).
2.
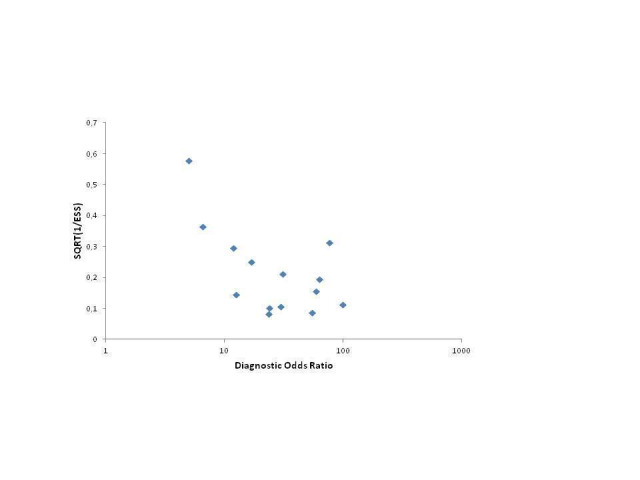
Funnel plot for reporting bias for liver fibrosis F4 in 14 included studies
Even though the Figure is not in the form of a funnel plot, it seems that there is no clear indication of reporting bias as the points were equally distributed along the x‐ and y‐axes. There seems to be two outliers (to the right) (Bardou‐Jacquet 2013; Carl 2012): both studies had a small number of participants (eight and four).
Results
Results of the search
We identified 3111 references through electronic searches of the Cochrane Hepato‐Biliary Group Controlled Trials Register (two references), Cochrane Hepato‐Biliary Group Diagnostic Test Accuracy Register (27 references), The Cochrane Library (38 references), MEDLINE (OvidSP) (485 references), EMBASE (OvidSP) (1671), and Science Citation Index Expanded (885 references). We identified no additional studies by searching other sources. After exclusion of duplicates, 2198 references remained. Having performed two selections, we found 2129 hits to be irrelevant references. Forty‐one references seemed to fulfil the inclusion criteria. However, we had to exclude 13 of these, and thus 28 references remained for further assessment. As data for the two‐by‐two tables could not be extracted from seven of these study publications, 21 references remained, describing 14 studies and providing data for the meta‐analysis. We added one additional reference towards the final stage of the review because we received a substantial amount of information from the study author (de Ledinghen 2013). Thus, 22 references describing 14 studies provided data for the meta‐analysis of our review.
Eight of the 13 excluded studies (referred to above) could have been included in our review had the number of participants been five or more than five and had it been possible to build up a two‐by‐two table with the available data (Characteristics of excluded studies). An exception from the latter explanation was the included study by Carl 2012 with four participants only, as we received individual participant data from the study author, and in this way, we could use the provided data in a two‐by‐two table. In the remaining 13 included studies, the number of participants ranged from eight to 147. As some of the studies included participants with different liver diseases, for the purpose of our review, we extracted data only on participants diagnosed with alcoholic liver disease alone (see Included studies; Characteristics of included studies).
In total, seven study authors provided individual participant data of people with alcoholic liver disease (Boursier 2009; Kim 2009; Anastasiou 2010; Carl 2012; de Ledinghen 2013; Dolman 2013; Lannerstedt 2013) (for details, see Characteristics of included studies). However, even after personal communication, we could not collect all missing information of relevance to our review analyses.
We found no diagnostic case‐control studies that met the selection criteria. No studies are awaiting classification. Figure 3 shows the reference flow.
3.
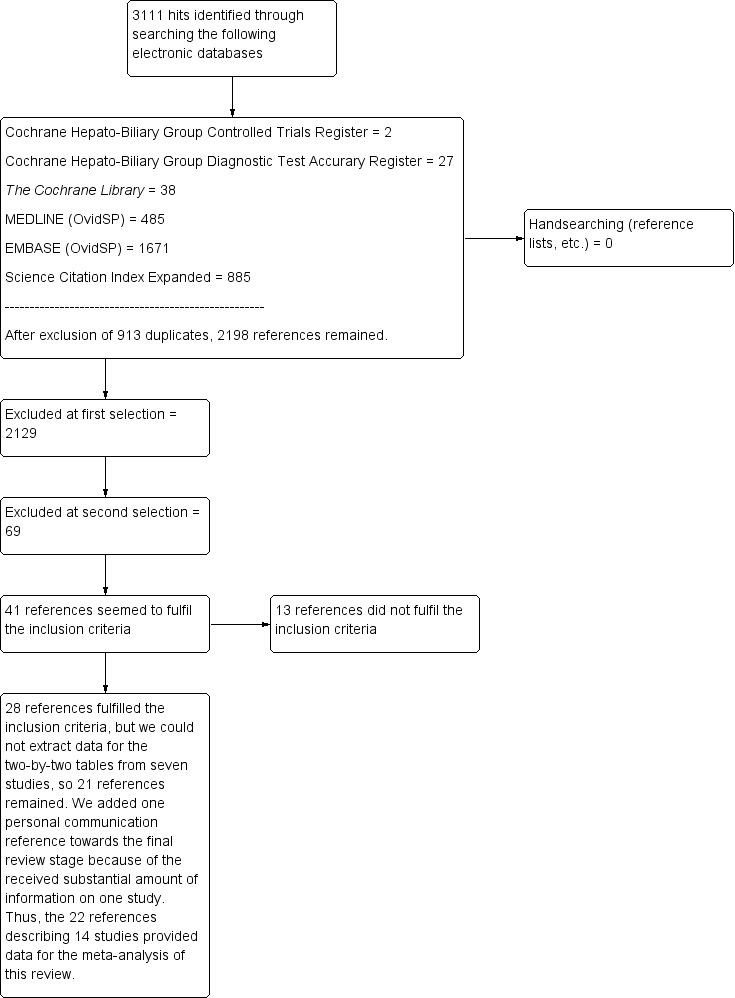
Flow chart.
Characteristics of included studies
We have summarised the characteristics of the 14 included studies in the Characteristics of included studies table.
Study design
Nine of the included studies were prospective cohort studies (Nahon 2008; Lemoine 2008; Nguyen‐Khac 2008; Boursier 2009; Kim 2009; Anastasiou 2010; Janssens 2010; Mueller 2010; de Ledinghen 2013), and five were retrospective cohort studies (Carl 2012; Fernandez 2012; Bardou‐Jacquet 2013; Dolman 2013; Lannerstedt 2013).
Funding
Five of the studies declared no financial interest and support by the manufacturer of transient elastography equipment (Nahon 2008; Lemoine 2008; Nguyen‐Khac 2008; Janssens 2010; Dolman 2013), while this information was either missing or unclear in the remaining nine studies.
Participants
Only seven of the 14 studies included participants with alcoholic liver disease aetiology (Nahon 2008; Nguyen‐Khac 2008; Kim 2009; Janssens 2010; Mueller 2010; Fernandez 2012; Bardou‐Jacquet 2013); the participants in the remaining seven studies had chronic liver disease with different aetiologies, among which was alcoholic liver disease. The number of participants with alcoholic liver disease in the 14 studies was 834, and all participants underwent both the index test (transient elastography) and the reference standard (liver biopsy) and were included in our analyses. The definition of the diagnosis of alcoholic liver disease was not provided in one study (Carl 2012), was not clearly defined in two studies (Fernandez 2012; Dolman 2013), but the definition was clear in the remaining 11 studies.
Seven studies reported the body mass index of participants as 25 kg/m2 or greater (Nahon 2008; Nguyen‐Khac 2008; Boursier 2009; Janssens 2010; Mueller 2010; de Ledinghen 2013; Dolman 2013), three studies below 25 kg/m2 (Kim 2009; Anastasiou 2010; Lannerstedt 2013), and four studies provided no information.
In 12 studies, the serum levels of AST activity was greater than 35 U/L. Bardou‐Jacquet 2013 provided AST data for 13 abstinent and 24 relapsers separately; however, it was not possible to extract the data separately for the eight participants included in our analyses. There was no information provided in the study by Dolman 2013, but through personal communication with the study author, we understood that AST had not been routinely available in their centre at the time of the study.
The maximum time interval of investigation with liver biopsy and transient elastography was within six months in 11 studies (Nahon 2008; Lemoine 2008; Nguyen‐Khac 2008; Boursier 2009; Kim 2009; Anastasiou 2010; Janssens 2010; Mueller 2010; Fernandez 2012; de Ledinghen 2013; Dolman 2013). The time interval in the study by Lannerstedt 2013 was less than three months in 50% of the participants and more than three months (range 1.9 to 8.6 years) in the remaining 50%. Bardou‐Jacquet 2013 reported a median time interval of 32.5 weeks in six of the eight participants. The time internal in the study by Carl 2012 was unclear.
Liver biopsy morphological scoring systems
The morphological scoring systems in the 14 studies used to assess hepatic fibrosis on liver biopsy were as follows: METAVIR in nine studies (Nguyen‐Khac 2008; Boursier 2009; Anastasiou 2010; Janssens 2010; Fernandez 2012; Bardou‐Jacquet 2013; de Ledinghen 2013; Dolman 2013; Lannerstedt 2013), and Ishak (Carl 2012), Batts‐Ludwig (Kim 2009), Chevallier (Lemoine 2008), Kleiner (Mueller 2010), and Brunt and Chevallier (Nahon 2008), in one study each.
Length of liver biopsy specimen
Nine studies provided the length of liver biopsy specimen and it was more than 10 mm (Nahon 2008; Lemoine 2008; Nguyen‐Khac 2008; Boursier 2009; Kim 2009; Anastasiou 2010; de Ledinghen 2013; Dolman 2013; Lannerstedt 2013). The remaining five studies provided no information.
Number of portal tracts
Three studies reported the number of portal tracts to be more than seven (Nguyen‐Khac 2008; Dolman 2013; Lannerstedt 2013). The remaining 11 studies provided no information.
Level of inflammation
Five studies reported the level of inflammation less than two grades of activity (Nahon 2008; Nguyen‐Khac 2008; Anastasiou 2010; Dolman 2013; Lannerstedt 2013). The remaining nine studies provided no information.
Grade of steatosis
Seven studies found the grade of steatosis to be more than 5% (Nahon 2008; Nguyen‐Khac 2008; Kim 2009; Janssens 2010; de Ledinghen 2013; Dolman 2013; Lannerstedt 2013). The remaining seven studies provided no information.
Study information on the index test ‐ transient elastography
In six of the 14 studies, the authors used pre‐defined cut‐off values for staging hepatic fibrosis (Nahon 2008; Janssens 2010; Mueller 2010; Bardou‐Jacquet 2013; Dolman 2013; Lannerstedt 2013). In the remaining eight studies, the authors used cut‐off values that were established during the study.
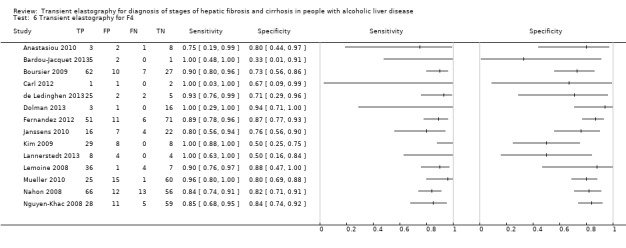
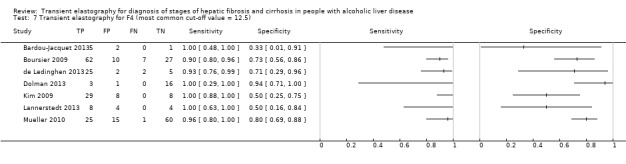
One study with 103 participants provided data for fibrosis stages F1 or worse (Nguyen‐Khac 2008); eight studies with 342 participants provided data for fibrosis stages F2 or worse (Nguyen‐Khac 2008; Boursier 2009; Kim 2009; Anastasiou 2010; Carl 2012; de Ledinghen 2013; Dolman 2013; Lannerstedt 2013); 10 studies with 760 participants provided data for fibrosis stages F3 or worse (Nahon 2008; Nguyen‐Khac 2008; Boursier 2009; Kim 2009; Janssens 2010; Mueller 2010; Fernandez 2012; de Ledinghen 2013; Dolman 2013; Lannerstedt 2013); and all 14 studies with 834 participants provided data for fibrosis stage F4 (i.e., cirrhosis).
Methodological quality of included studies
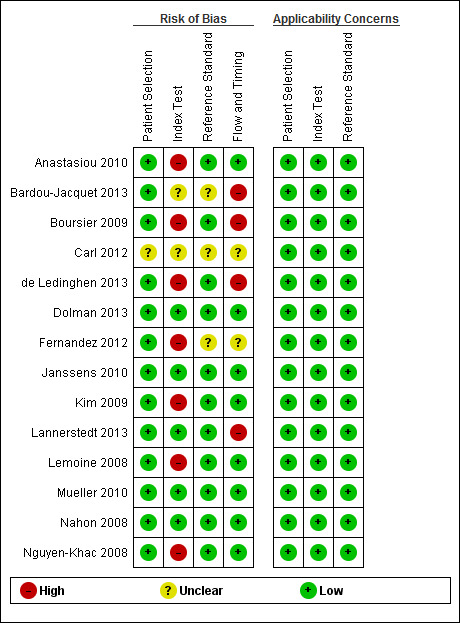
Figure 4 and Figure 5 summarise the methodological quality in the included studies. Only four studies were at low risk of bias in all domains (Nahon 2008; Janssens 2010; Mueller 2010; Dolman 2013).
4.
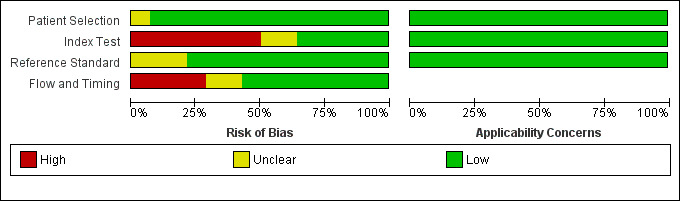
Risk of bias and applicability concerns graph: review authors' judgements about each domain presented as percentages across included studies.
5.
Risk of bias and applicability concerns summary: review authors' judgements about each domain for each included study.
Participant selection
Thirteen studies were at low risk of bias in the 'patient selection' domain (Nahon 2008; Lemoine 2008; Nguyen‐Khac 2008; Boursier 2009; Kim 2009; Anastasiou 2010; Janssens 2010; Mueller 2010; Fernandez 2012; Bardou‐Jacquet 2013; de Ledinghen 2013; Dolman 2013; Lannerstedt 2013). One study was at unclear risk of bias in the 'patient selection' domain as it was not clear if Carl et al. had avoided inappropriate exclusions (Carl 2012) (Figure 5). However, we judged that all 14 studies had low concern about applicability in this domain (Figure 5).
Index test
Five studies were at low risk of bias as they had pre‐specified cut‐off values and results were interpreted without the knowledge of the reference standard result (i.e., blinding) (Nahon 2008; Janssens 2010; Mueller 2010; Dolman 2013; Lannerstedt 2013), seven studies were at high risk of bias as cut‐off values were not pre‐specified (Lemoine 2008; Nguyen‐Khac 2008; Boursier 2009; Kim 2009; Anastasiou 2010; Fernandez 2012; de Ledinghen 2013), and two studies were at unclear risk of bias in the 'index test' domain (Carl 2012 (no information about blinding or pre‐specified cut‐off values); Bardou‐Jacquet 2013 (no information about blinding)) (Figure 5). Besides lack of pre‐specified cut‐off values in Fernandez 2012, it was unclear whether the index test results were interpreted without the knowledge of the reference standard result. We judged that all 14 studies had low concern about applicability in this domain (Figure 5).
Reference standard
Eleven studies were at low risk of bias (Nahon 2008; Lemoine 2008; Nguyen‐Khac 2008; Boursier 2009; Kim 2009; Anastasiou 2010; Janssens 2010; Mueller 2010; de Ledinghen 2013; Dolman 2013; Lannerstedt 2013), and three were at unclear risk of bias in the 'reference standard' domain as there was no information about blinding (Carl 2012; Fernandez 2012; Bardou‐Jacquet 2013) (Figure 5). However, we judged that all 14 studies had low concern about applicability in this domain (Figure 5).
Flow and timing
Eight studies were at low risk of bias (Lemoine 2008; Nahon 2008; Nguyen‐Khac 2008; Kim 2009; Anastasiou 2010; Janssens 2010; Mueller 2010; Dolman 2013), four studies were at high risk of bias (Bardou‐Jacquet 2013 (due to inappropriate time interval and exclusion of participants from the analyses); Boursier 2009 (due to exclusion of participants from the analyses); de Ledinghen 2013 (due to exclusion of participants from the analyses); Lannerstedt 2013 (due to inappropriate time interval)), and two studies were at unclear risk of bias in the 'flow and timing' domain due to unclear time intervals in the studies (Carl 2012; Fernandez 2012) (Figure 5).
We made our judgements based on the following information.
Bardou‐Jacquet 2013 reported that two of the eight participants had their liver biopsy within four weeks' interval and the remaining six participants had their liver biopsy performed during the follow‐up period of between 15 and 85 weeks. The study included participants with excessive alcohol consumption, and at the end of follow‐up all but one participant were relapsers and had advanced stage of fibrosis on liver biopsy and transient elastography (i.e., cirrhosis). In the de Ledinghen 2013 study, even though the flow and timing was within one week, not all participants were included in the analyses, which made the study of high risk of bias in this domain.
The time interval between liver biopsy and transient elastography was not clear in three studies. Carl 2012 reported that participants underwent liver biopsy and transient elastography between 1 May 2008 and 31 July 2011; Fernandez 2012 reported that transient elastography was performed within six months of liver biopsy in the 139 consecutive participants with alcoholic liver disease; and Lannerstedt 2013 reported that the time interval between liver biopsy and transient elastography was less than three months in 50% of the participants and more than three months (range 1.9 to 8.6 years) in the remaining 50%). As all of the eight participants (i.e., 50%) with the time interval of more than six months had cirrhosis, it is unlikely that the stage of fibrosis (i.e., cirrhosis) would improve.
Liver biopsy seemed to have been performed before transient elastography in six studies (Nahon 2008; Nguyen‐Khac 2008; Boursier 2009; Anastasiou 2010; Fernandez 2012; Lannerstedt 2013), and after transient elastography in three studies (Lemoine 2008; Janssens 2010; Dolman 2013). In the remaining five studies, it was unclear which test was performed first.
Findings
Transient elastography for F1 or worse
One study with 103 participants provided data for transient elastography assessing people with hepatic fibrosis stage F1 or worse (Nguyen‐Khac 2008) (Data table 1). The cut‐off value for F1 was 5.9 kPa.
1. Test.
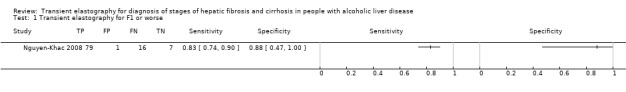
Transient elastography for F1 or worse.
Transient elastography for F2 or worse
Eight studies with 342 participants provided data for transient elastography assessing people with hepatic fibrosis stage F2 or worse (Nguyen‐Khac 2008; Boursier 2009; Kim 2009; Anastasiou 2010; Carl 2012; de Ledinghen 2013; Dolman 2013; Lannerstedt 2013) (Data table 2). The sensitivity of the eight studies varied from 75% to 100% and the specificity from 80% to 100% (Figure 6). The cut‐off values in seven studies were around 7.5 kPa (range 7.00 to 7.8 kPa). As the cut‐off value in one study with four participants was 13.5 kPa (Carl 2012), we decided to conduct a meta‐analysis by including the studies with cut‐off values around 7.5 kPa only.
2. Test.
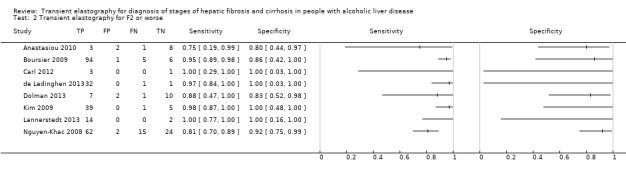
Transient elastography for F2 or worse.
6.
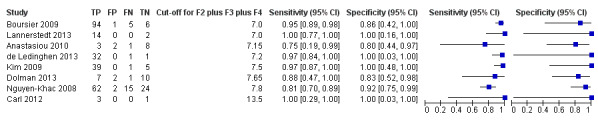
Forest plot: Transient elastography for F2 or worse.
We fitted the bivariate model to the seven studies with 338 participants and estimated a summary operating point (a point with the mean sensitivity and specificity of the transient elastography test). We obtained the following results: sensitivity 0.94 (95% CI 0.86 to 0.97); specificity 0.89 (95% CI 0.76 to 0.95); positive likelihood ratio (LR+) 8.2 (95% CI 3.6 to 18.5); negative likelihood ratio (LR‐) 0.07 (95% CI 0.03 to 0.17) (Figure 7).
7.
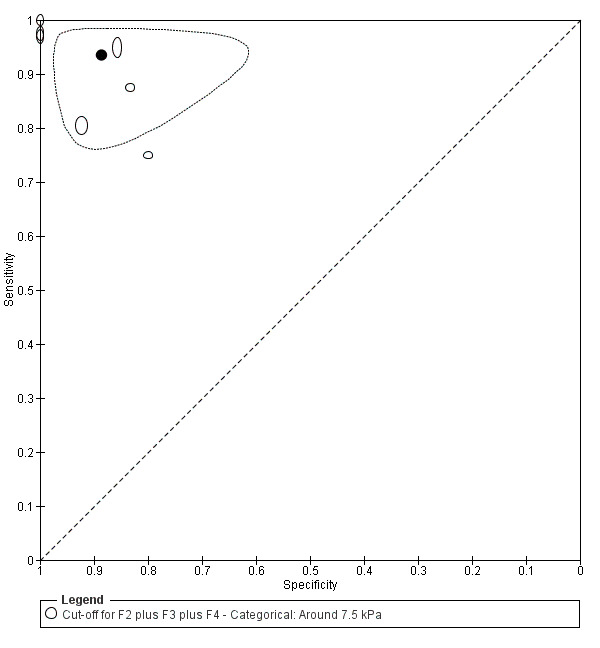
Summary operating point and 95% confidence region: Transient elastography for F2 or worse with cut‐offs around 7.5 kPa.
The mean prevalence of F2 or worse in the seven studies was 81%. Using this value as a pre‐test probability, we obtained a post‐test probability of 97% when the test was positive and a post‐test probability of 23% when the test was negative (Table 1).
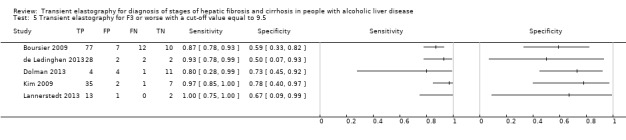
Transient elastography for F3 or worse
Ten studies with 760 participants provided data for transient elastography assessing people with hepatic fibrosis stage F3 or worse (Nahon 2008; Nguyen‐Khac 2008; Boursier 2009; Kim 2009; Janssens 2010; Mueller 2010; Fernandez 2012; de Ledinghen 2013; Dolman 2013; Lannerstedt 2013) (Data table 3). The sensitivity of the 10 studies varied from 72% to 100% and the specificity from 59% to 89% (Figure 8). The cut‐off values in the 10 studies ranged from 8.0 to 17.0 kPa. We used the HSROC model and it was possible to estimate a summary receiver‐operating characteristic curve (SROC) (Data and analyses; Figure 9).
3. Test.
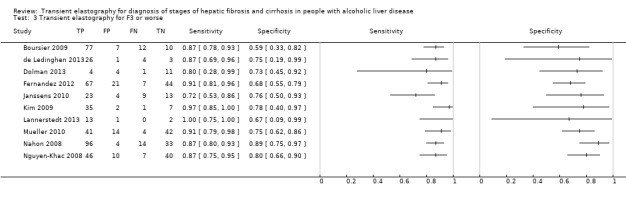
Transient elastography for F3 or worse.
8.
Forest plot: Transient elastography for F3 or worse.
9.
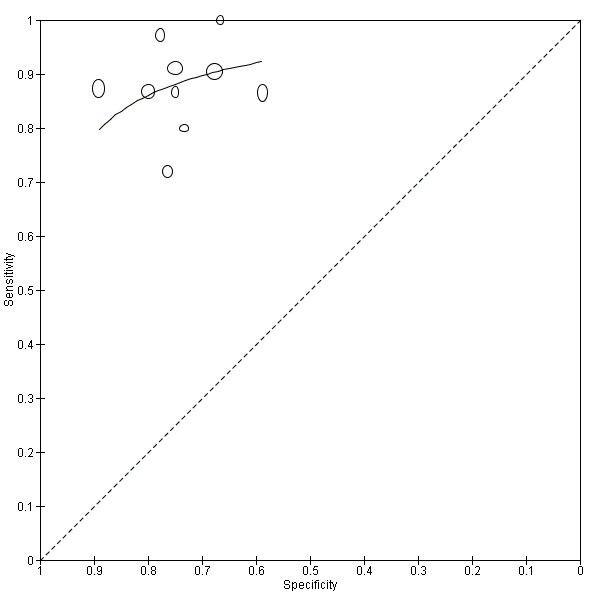
Hierarchical summary receiver operating characteristic (ROC) curve: Transient elastography for F3 or worse. The cut‐offs in the nine studies ranged from 8.0 to 17.0 kPa.
The sensitivity analysis on studies with up to three months' interval could not provide results, due to a statistical problem (the model did not converge).
Transient elastography for F3 or worse with cut‐off values around 9.5 KPa
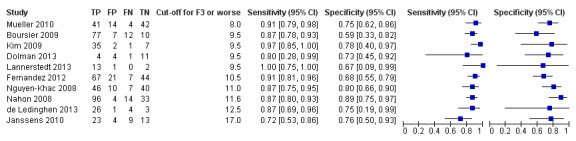
When we considered the eight studies with 564 participants using cut‐off values around 9.5 KPa (range 8 to 11 kPa), it was possible to estimate a summary operating point (a point with the mean sensitivity and specificity of the transient elastography test) (Nguyen‐Khac 2008; Boursier 2009; Kim 2009; Mueller 2010; Fernandez 2012; de Ledinghen 2013; Dolman 2013; Lannerstedt 2013) (Data table 4). The sensitivity of the eight studies varied from 80% to 100% and the specificity from 50% to 80% (Figure 10). Using a bivariate method (with random effect for only specificity), we obtained the following results: sensitivity 0.92 (95% CI 0.89 to 0.96); specificity 0.70 (95% CI 0.61 to 0.79); positive likelihood ratio (LR+) 3.1 (95% CI 2.1 to 4.1); negative likelihood ratio (LR‐) 0.11 (95% CI 0.06 to 0.16) (Figure 11).
4. Test.
Transient elastography for F3 or worse with cut‐off values around 9.5.
10.
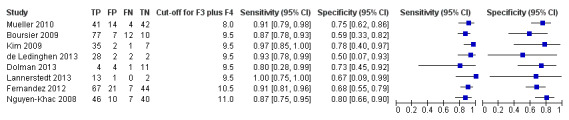
Forest plot: Transient elastography for F3 or worse with cut‐offs around 9.5 kPa.
11.
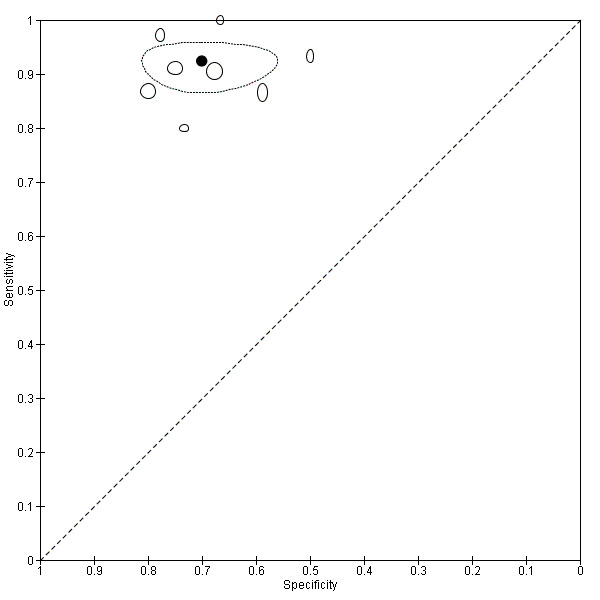
Summary operating point and 95% confidence region: Transient elastography for F3 or worse with cut‐offs around 9.5 kPa.
The mean prevalence of F3 or worse in these eight studies was 61%. Using this value as a pre‐test probability, we obtained a post‐test probability of 83% when the test was positive and a post‐test probability of 15% when the test was negative (Table 1).
Transient elastography for F3 or worse with cut‐off values around 9.5 kPa and time interval within three months ‐ sensitivity analysis
When we considered only the seven studies with 425 participants with up to three months' interval between transient elastography and liver biopsy, the pooled estimates obtained using a bivariate method (with random effect for only specificity) were as follows: sensitivity 0.90 (95% CI 0.86 to 0.95); specificity 0.69 (95% CI 0.46 to 0.92); positive likelihood ratio (LR+) 2.9 (95% CI 0.8 to 5.1); negative likelihood ratio (LR‐) 0.14 (95% CI 0.06 to 0.22), showing that the pooled results were not noticeably affected when we excluded the study with a time interval longer than three months (Fernandez 2012).
Transient elastography for F3 or worse with a cut‐off value of 9.5 kPa ‐ sensitivity analysis
When we considered the five studies with 221 participants using a cut‐off of 9.5 kPa, it was possible to estimate a summary operating point (a point with the mean sensitivity and specificity of the transient elastography test). Using a bivariate method, we obtained the following results: sensitivity 0.92 (95% CI 0.83 to 0.97); specificity 0.68 (95% CI 0.52 to 0.80); positive likelihood ratio (LR+) 2.9 (95% CI 1.8 to 4.5); negative likelihood ratio (LR‐) 0.11 (95% CI 0.05 to 0.27).
The mean prevalence of F3 or worse in these five studies was 78%. Using this value as a pre‐test probability, we obtained a post‐test probability of 91% when the test was positive and a post‐test probability of 28% when the test was negative (Table 1).
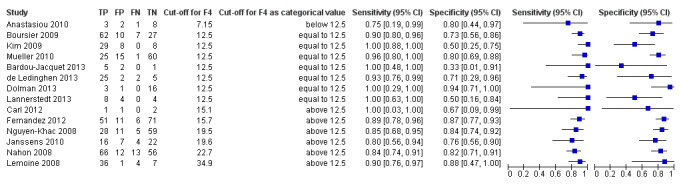
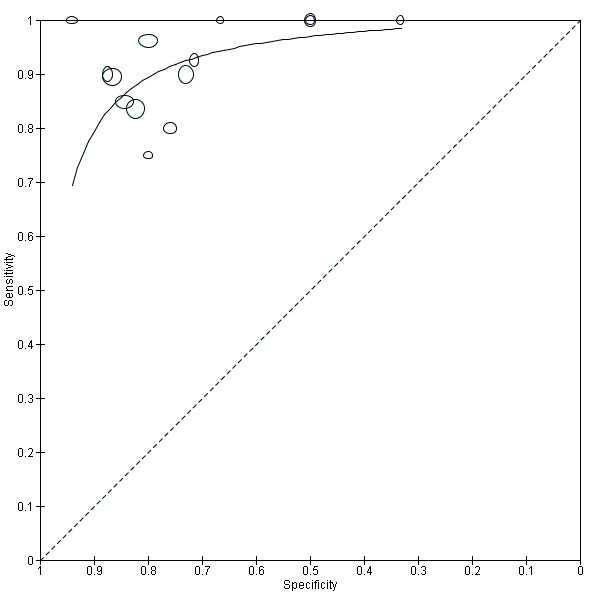
Transient elastography for F4
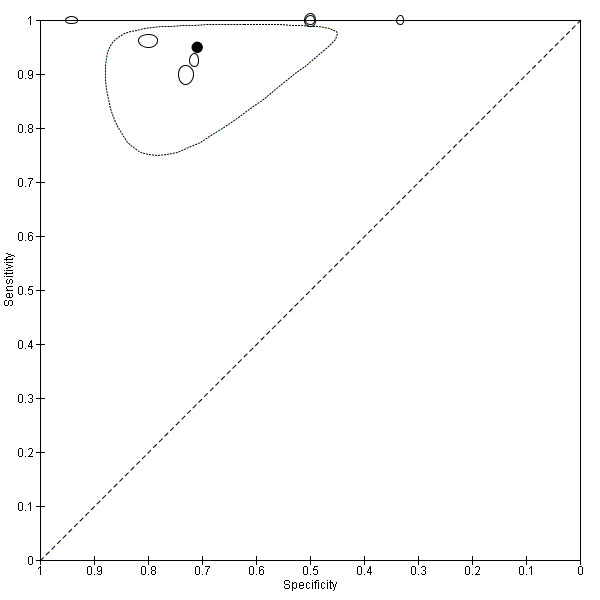
Fourteen studies with 834 participants using nine different cut‐off values ranging from 7.15 to 34.9 kPa provided data for transient elastography assessing people with hepatic fibrosis for F4 (Nahon 2008; Nguyen‐Khac 2008; Lemoine 2008; Boursier 2009; Kim 2009; Anastasiou 2010; Janssens 2010; Mueller 2010; Carl 2012; Fernandez 2012; Bardou‐Jacquet 2013; de Ledinghen 2013; Dolman 2013; Lannerstedt 2013) (Data table 6). The sensitivity of the 14 studies varied from 75% to 100% and the specificity from 33% to 94% (Figure 12). We used the HSROC model and it was possible to estimate the SROC curve (Figure 13), which showed that the variation between the different values of the cut‐off values seemed to affect more specificity than the sensitivity of the index test.
6. Test.
Transient elastography for F4.
12.
Forest plot: Transient elastography for F4.
13.
Hierarchical summary receiver operating characteristic (ROC) curve: Transient elastography for F4.
Transient elastography for F4 and time interval within three months ‐ sensitivity analysis
When we considered only the 10 studies with 667 participants with up to three months' interval between transient elastography and liver biopsy, the obtained SROC curve (Figure 14) was similar to the curve obtained when considering all 14 studies; the results were not noticeably affected when we excluded the four studies with time intervals longer than three months (Carl 2012; Fernandez 2012; Bardou‐Jacquet 2013; Lannerstedt 2013).
14.
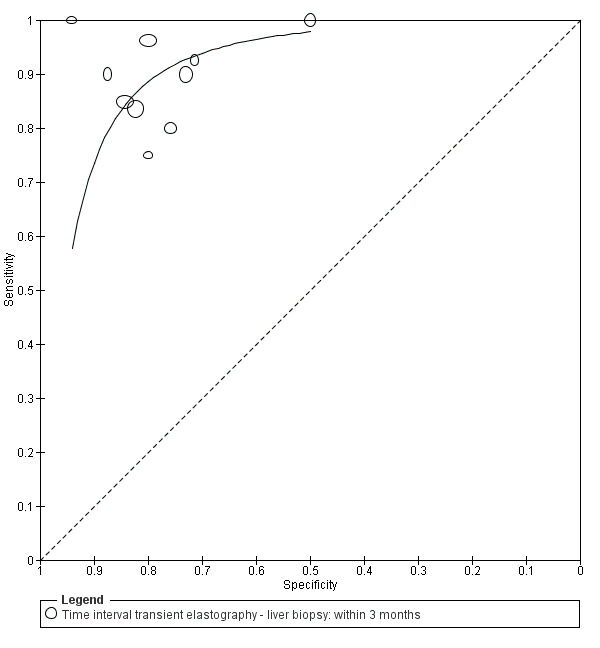
Hierarchical summary receiver operating characteristic (ROC) curve: Transient elastography for F4 (cirrhosis): only studies with time interval between transient elastography and liver biopsy within three months.
Transient elastography for F4 with a cut‐off value 12.5 kPa ‐ sensitivity analysis
We performed the analysis with seven studies reporting a cut‐off of 12.5 kPa (the most common cut‐off for F4) in which 330 participants were tested (Boursier 2009; Kim 2009; Mueller 2010; Bardou‐Jacquet 2013; de Ledinghen 2013; Dolman 2013; Lannerstedt 2013) (Data table 7). The sensitivity of the seven studies varied from 90% to 100% and the specificity from 33% to 94% (Figure 15). Using a bivariate model, we obtained the following results: sensitivity 0.95 (95% CI 0.87 to 0.98); specificity 0.71 (95% CI 0.56 to 0.82); positive likelihood ratio (LR+) 3.3 (95% CI 2.1 to 5.0); negative likelihood ratio (LR‐) 0.07 (95% CI 0.03 to 0.19) (Figure 16).
7. Test.
Transient elastography for F4 (most common cut‐off value = 12.5).
15.
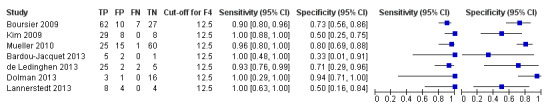
Forest plot: Transient elastography for F4 (most common cut‐off = 12.5 kPa).
16.
Summary operating point and 95% confidence region: Transient elastography for F4 (cirrhosis) with the most common cut‐off = 12.5 kPa.
The mean prevalence of F4 in these seven studies was 51%. Using this value as a pre‐test probability, we obtained a post‐test probability of 77% when the test was positive and a post‐test probability of 7% when the test was negative (Table 1).
Transient elastography for F4 with a cut‐off value 12.5 kPa and time interval within three months ‐ sensitivity analysis
In order to provide an estimate for accuracy with the most common cut‐off of 12.5 kPa and considering only the studies with up to three months' interval between transient elastography and the liver biopsy, we performed a separate analysis in which five studies with 306 participants could be included (Boursier 2009; Kim 2009; Mueller 2010; de Ledinghen 2013; Dolman 2013). The results changed slightly: sensitivity 0.94 (95% CI 0.87 to 0.97); specificity 0.76 (95% CI 0.63 to 0.85); positive likelihood ratio (LR+) 3.8 (95% CI 2.5 to 6.0); negative likelihood ratio (LR‐) 0.08 (95% CI 0.04 to 0.17), showing that the pooled results were not affected when we excluded the two studies with time interval longer than three months (Bardou‐Jacquet 2013; Lannerstedt 2013).
Investigation of heterogeneity
Despite the fact that we could collect data for sources of heterogeneity, it was not possible to perform formal analyses to explore the effect as almost all studies had the same covariate values.
Reporting bias
The funnel plot for investigation of reporting bias in the 14 studies reporting on hepatic fibrosis F4 (cirrhosis) did not seem to raise concerns as the studies were equally distributed along the x‐ and y‐ axes and the two outliers were studies with a small number of participants (four participants, Carl 2012; eight participants, Bardou‐Jacquet 2013) (Figure 2). For stages of fibrosis of F1 to F3, we did not attempt to construct funnel plots, as the number of studies with data were fewer than 10.
Discussion
Summary of main results
In this review, we aimed to determine the diagnostic accuracy of transient elastography for the diagnosis of hepatic fibrosis in people with alcoholic liver disease compared with the reference standard, liver biopsy. We also attempted to identify the optimal cut‐off values for the five stages of hepatic fibrosis. We identified 21 studies including participants with alcoholic liver disease of which only 14 studies with 834 participants provided data for the review analyses and hence constituted the included studies of this review. In addition to published article data, we used individual participant data obtained through correspondence with authors of seven of these studies. Participants in all 14 studies had undergone both transient elastography and liver biopsy investigations. The lack of usable data from seven out of 21 studies raised the risk of outcome reporting bias.
Study authors used a variety of different cut‐off values for transient elastography in an attempt to discriminate between the stages of hepatic fibrosis. Hence, our analyses using the most common cut‐off values did not allow us to establish the best cut‐off values for the separate stages of hepatic fibrosis that could be recommended for clinical practice.
Detection of fibrosis F0 or F1 is of no clinical relevance as these initial hepatic fibrosis stages do not influence prognosis and if the person abstains from alcohol consumption, the fibrosis will reverse.
Transient elastography for F2 or worse
For F2 or worse with a cut‐off of around 7.5 kPa, summary sensitivity was 0.94 and specificity was 0.89. Prevalence of F2 or worse was 81%. Most of the participants were alcohol abusers.
Transient elastography for F3 or worse
For F3 or worse with a cut‐off of around 9.5 kPa, summary sensitivity was 0.92 and specificity was 0.70. The result suggests that transient elastography may rule out the presence of severe fibrosis, considering the prevalence of 61%.
Transient elastography for F4
For F4 with a cut‐off of 12.5 kPa, summary sensitivity was 0.95 and specificity was 0.71. The result suggests that transient elastography could be useful to rule out the presence of cirrhosis following the data results of LR‐ and considering the prevalence of 51%. As the post‐test probability becomes 7%, further testing may not be needed to rule out cirrhosis. Thus, liver biopsy could be avoided. This result was consistent with the results of the analysis considering all the studies with the different cut‐off values (Figure 13) and the sensitivity analysis on the studies with time interval between liver biopsy and transient elastography less than three months (Figure 14), as the point representing the summary sensitivity and specificity (summary operating point) was close to the two hierarchical SROC curves.
Out of 1000 participants, we would identify 510 with cirrhosis, but we would miss 26 people with cirrhosis and 143 participants would be wrongly diagnosed due to transient elastography error.
Strengths and weaknesses of the review
The aims of our review were to provide pooled estimates of accuracy of transient elastography and to find the best cut‐off values of transient elastography for the five stages of hepatic fibrosis in people with alcoholic liver disease.
We judged only 29% of the studies at low risk of bias. Despite the fact that all included studies were published after 2003, that is, the STARD initiative was published (www.stard‐statement.org), clinically relevant information was missing. We could not investigate whether grade of inflammation, lengths of liver biopsy sample, portal tracts, grades of steatosis, severity of fibrosis, and body mass index as sources of possible heterogeneity had an impact on our results because the collected data were not sufficient for analyses.
The role of transient elastography for determining the cut‐off values for differentiating the five stages of hepatic fibrosis (F0 to F4) in people diagnosed with alcoholic liver disease has not been previously validated. Therefore, this is the first diagnostic test accuracy review with meta‐analyses that attempted to determine the diagnostic test accuracy thresholds for distinguishing the stages of hepatic fibrosis, focusing only on people with alcoholic liver disease and using rigorous Cochrane Collaboration methodology (SRDTA Handbook). However, due to the very few number of studies assessing mild fibrosis and the huge variation of cut‐off values in studies with participants with significant or severe hepatic fibrosis or cirrhosis, we could not establish the optimal cut‐off values that could serve as thresholds for mild, significant, or severe fibrosis and cirrhosis.
Variation of cut‐off values is the main source of heterogeneity in diagnostic studies. In addition, when studies reported accuracy estimates considering similar cut‐off values, our analyses showed that some heterogeneity was still present, most probably due to differences in clinical characteristics of the participants (abstinent or not), as suggested by the variability of prevalence among the studies.
The observed heterogeneity for F4 seemed to affect mainly the specificity of transient elastography.
The small number of included studies with data for stages F2 or worse and F3 or worse, was one of the limitations of our systematic review, as we could not perform a comprehensive analysis to study the influence of potential sources of heterogeneity. Furthermore, the small number of studies might have had an effect on the reliability of the estimates obtained by the bivariate or HSROC model, especially when some sensitivity analyses were performed. In addition, in some analyses there was no evidence of heterogeneity in sensitivity, which we believe may be the main reason for the failure of convergence of the statistical model. However, we have been able to obtain accuracy estimates by fitting a model with the random effect for only specificity. Unfortunately, in some sensitivity analyses, the reason of lack of convergence of the statistical models was not identified and we were unable to provide a summary result. Hence, our findings for stages F2 or worse and F3 or worse (analyses with no more than 10 studies) might be limited by the small number of studies. As the CIs for the obtained estimates of hepatic fibrosis stages were wide, caution is needed when interpreting the results.
A strength of our review is that we managed to obtain individual patient data of people with alcoholic liver disease through correspondence with authors of seven studies. By doing this, we decreased the amount of missing information and we were able to increase the number of the included studies. Contacting Echosens® with a request for published and unpublished studies yielded a list with published studies only, so we failed at identification of any unpublished studies relevant to the review questions.
We cannot judge if lack of intention to diagnose in seven of the studies that included participants with various liver disease aetiology and the lack of information in another study would have affected the sensitivities and specificities of the transient elastography, as it was impossible to conduct such analyses.
Despite that liver biopsy is considered the reference standard, it may also present problems with its accuracy and reproducibility, which may reflect on the true estimates of the accuracy of transient elastography.
We could find only one systematic review that also included an economic evaluation assessing FibroScan® for the detection of hepatic fibrosis in people with suspected alcohol‐related liver disease (Stevenson 2012). However, the authors identified only six studies to 2010 and the authors concluded that, as the number of people with suspected alcoholic liver disease was small in all the studies, the estimated sensitivities and specificities were not robust.
Only five studies reported results based on a pre‐defined cut‐off and it was the cut‐off established for chronic hepatitis C. We were unable to define the optimal cut‐off values for the stages of hepatic fibrosis in people with alcoholic liver disease, as the data that we obtained were not sufficient to perform the planned review analyses. In addition, the lack of pre‐specified cut‐off values in most of the included studies might have led to overestimation of the accuracy of transient elastography.
Clinicians and researchers alike will be helped by knowing the sensitivities and specificities of the most common cut‐off values used for staging of hepatic fibrosis in people with alcoholic liver disease.
As transient elastography in our studies was not used as a screening or a triage test, we could not present any results in a population with a low prevalence of F3 or worse (significant hepatic fibrosis or cirrhosis) or for F4 (cirrhosis alone) in people with alcoholic liver disease. For clarity, we provided two tables.
Table 4 presented post‐test probabilities obtained in our review from minimum, medium, and high pre‐test probabilities when LR‐ is 0.11 (obtained in our analyses for F3 or worse). A negative test result will convert a pre‐test probability of 25%, 61%, and 88% to a post‐test probability of 4%, 15%, and 45%. Hence, the use of transient elastography to diagnose people with hepatic fibrosis stage 3 or worse seems reasonable and could avoid liver biopsy testing when the pre‐test probability is not high.
3. Post‐test probabilities (calculated in case of negative test results), starting from three pre‐test probabilities for F3 or worse with a cut‐off around 9.5 kPa.
| Pre‐test probability | LR‐ | Post‐test probability |
| 25% (minimum)* | 0.11 | 4% |
| 61% (mean)* | 0.11 | 15% |
| 88% (maximum)* | 0.11 | 45% |
F3 or F4: significant hepatic fibrosis or cirrhosis (or both) in participants with alcoholic liver disease. * as it is reported in this review.
Table 5 presented post‐test probabilities obtained in our review from minimum, medium, and high pre‐test probabilities for hepatic cirrhosis (F4) with most common cut‐off of 12.5 kPa when the LR‐ is 0.07. A negative test result will convert a pre‐test probability of 15%, 51%, and 79% to a post‐test probability of 1%, 7%, and 21%. Hence, the use of transient elastography to diagnose people with F4 seems reasonable and could avoid liver biopsy testing when the pre‐test probability is not high.
4. Post‐test probabilities (calculated in case of negative test results), starting from three pre‐test probabilities for F4 with most common cut‐off of 12.5 kPa.
| Pre‐test probability | LR‐ | Post‐test probability |
| 15% (minimum)* | 0.07 | 1% |
| 51% (mean)* | 0.07 | 7% |
| 79% (maximum)* | 0.07 | 21% |
F4: cirrhosis. * as it is reported in this review.
The results of our review confirm that transient elastography is an accurate test for differentiating the different stages of hepatic fibrosis, also in the subgroup of people with alcoholic liver disease.
The high prevalence of significant or severe fibrosis and cirrhosis found in the included studies has some consequences on the clinical usefulness of transient elastography, as such scenarios are not often encountered in clinical practice. When the pre‐test probability of cirrhosis is too high, clinicians should reconsider testing with transient elastography, as it is unlikely to add any further relevant information to the clinical diagnosis of cirrhosis. The more likely reason for the high prevalence is in the aetiology of the liver disease. People with alcoholic liver disease visit clinicians when they are at a more advanced stage of hepatic fibrosis than people diagnosed with other aetiologies of liver diseases. An advanced stage of hepatic fibrosis, severe or worse, is easily recognised by clinicians, which may limit the clinical utility of transient elastography test in people with alcoholic liver disease.
We assessed transient elastography in people who had liver index test conducted before, close to, or after the conduct of the reference standard, liver biopsy. As any post‐liver biopsy intrahepatic bleeding may have affected the results of a following transient elastography, this sequence of tests may have affected our results.
Applicability of findings to the review question
The aims of our review were to provide pooled estimates of diagnostic accuracy performance of transient elastography with regard to the five stages of hepatic fibrosis in people with alcoholic liver disease and their differentiation by finding the optimal cut‐off values for each stage of hepatic fibrosis.
Despite the fact that we could not establish the best cut‐off values for differentiating the hepatic fibrosis stages, we judged that our review findings raise small applicability concerns defined through judgement of the three QUADAS‐2 applicability domains: participant selection, index test, and reference standard.
The included participants were people with alcoholic liver disease, from various settings, and having different stages of hepatic fibrosis. We found a large variance of prevalence of the different stages of hepatic fibrosis across the studies, but we believe that this does not affect the applicability of our findings.
Transient elastography investigations were performed as prescribed by the manufacturers and as usually performed and reported in clinical practice.
Liver biopsy was performed following the clinical guideline for liver biopsy investigation and morphological results were estimated by the most often used semi‐quantitative morphological scores.
Authors' conclusions
Implications for practice.
We identified a small number of studies with a few participants each and were unable to include several studies, which raises the risk of outcome reporting bias. With these caveats in mind, transient elastography may be used as a diagnostic method to rule out liver cirrhosis (F4) in people with alcoholic liver disease when the pre‐test probability is 51% (range 15% to 79%). Transient elastography may also help in ruling out severe fibrosis (F3 or worse). The use of transient elastography for severe fibrosis and cirrhosis may lead to a reduced need for liver biopsy. Liver biopsy investigation still remains an option if the certainty to rule in or rule out the stage of hepatic fibrosis or cirrhosis remains insufficient after a clinical follow‐up or any other non‐invasive test considered useful by the clinician.
The proposed cut‐off values for the different stages of hepatic fibrosis may be used in clinical practice, but one should be very cautious, as those reported in this review were only the most common cut‐off values used by the study authors. The best cut‐off values for hepatic fibrosis in people with alcoholic liver disease could not be established yet.
Implications for research.
In order to obtain precise and reliable accuracy results of transient elastography, used for diagnosing hepatic fibrosis in people with alcoholic liver disease, prospective studies of adequate sample size, enrolling only participants with alcoholic liver disease, need to be performed. Hepatic fibrosis should be diagnosed with both transient elastography and liver biopsy (the reference standard) and in this sequence, and the optimal cut‐off values of transient elastography should be identified and validated for hepatic fibrosis in people with alcoholic liver disease. The time interval between transient elastography and liver biopsy investigations in people without cirrhosis should not exceed three months, and assessment of results should be properly blinded, as only studies with low risk of bias, fulfilling the Standards for Reporting of Diagnostic Accuracy (The STARD statement) may answer the review questions.
Acknowledgements
We would like to thank G Crespo, M Fraquelli, CG Nudo, P Stål, and J Trabut, for replies on our questions regarding unclear or missing information in their study publications. Due to the few number of participants with alcoholic liver disease in their studies, we could not include them in our review meta‐analyses. However, the studies are listed under excluded studies.
We would also to thank J Anastasiou, J Boursier, I Carl, V de Ledinghen, GE Dolman, SG Kim, and H Lannerseted for the individual patient data. Our thanks also go to RT Marinho who replied to our questions on a publication he authored.
We thank Marousja Tzanova for help with a publication in Portuguese.
We thank Mirella Fraquelli, Italy, and Agostino Colli, Italy, from The Cochrane Hepato‐Biliary Group Diagnostic Accuracy Reviews Editorial Team for their valuable assistance throughout the review preparation.
Peer reviewers: anonymous ‐ names known by the UK Diagnostic Test Accuracy Review Editorial Team.
Contact editors from The Cochrane Hepato‐Biliary Group: Mirella Fraquelli, Italy; Agostino Colli, Italy.
Appendices
Appendix 1. Search strategy
| Database | date of search | Search strategy |
| Cochrane Hepato‐Biliary Group Controlled Trials Register | August 2014 | (transient elastograph* OR fibroscan) AND ((hepatic OR liver) AND (fibrosis OR cirrhosis)) AND liver biops* |
| Cochrane Hepato‐Biliary Group Diagnostic Test Accuracy Register | August 2014 | (transient elastograph* OR fibroscan) AND ((hepatic OR liver) AND (fibrosis OR cirrhosis)) AND liver biops* |
| The Cochrane Library | Issue 7 of 12, 2014 | #1 MeSH descriptor: [Elasticity Imaging Techniques] explode all trees #2 transient elastograph* or fibroscan #3 #1 or #2 #4 MeSH descriptor: [Liver Cirrhosis] explode all trees #5 (hepatic or liver) and (fibrosis or cirrhosis) #6 #4 or #5 #7 MeSH descriptor: [Biopsy, Needle] explode all trees #8 liver biops* #9 #7 or #8 #10 #3 and #6 and #9 |
| MEDLINE (OvidSP) | 1946 to August 2014 | 1. exp Elasticity Imaging Techniques/ 2. (transient elastograph* or fibroscan).mp. [mp=title, abstract, original title, name of substance word, subject heading word, keyword heading word, protocol supplementary concept word, rare disease supplementary concept word, unique identifier] 3. 1 or 2 4. exp liver cirrhosis/ 5. ((hepatic or liver) and (fibrosis or cirrhosis)).mp. [mp=title, abstract, original title, name of substance word, subject heading word, keyword heading word, protocol supplementary concept word, rare disease supplementary concept word, unique identifier] 6. 4 or 5 7. exp Biopsy, Needle/ 8. liver biops*.mp. [mp=title, abstract, original title, name of substance word, subject heading word, keyword heading word, protocol supplementary concept word, rare disease supplementary concept word, unique identifier] 9. 7 or 8 10. 3 and 6 and 9 |
| EMBASE (OvidSP) | 1974 to August 2014 | 1. exp elastography/ 2. (transient elastograph* or fibroscan).mp. [mp=title, abstract, subject headings, heading word, drug trade name, original title, device manufacturer, drug manufacturer, device trade name, keyword] 3. 1 or 2 4. exp liver cirrhosis/ 5. ((hepatic or liver) and (fibrosis or cirrhosis)).mp. [mp=title, abstract, subject headings, heading word, drug trade name, original title, device manufacturer, drug manufacturer, device trade name, keyword] 6. 4 or 5 7. exp liver biopsy/ 8. liver biops*.mp. [mp=title, abstract, subject headings, heading word, drug trade name, original title, device manufacturer, drug manufacturer, device trade name, keyword] 9. 7 or 8 10. 3 and 6 and 9 |
| Science Citation Index Expanded | 1900 to August 2014 | #4 #3 AND #2 AND #1 #3 TS=(liver biops*) #2 TS=((hepatic or liver) and (fibrosis or cirrhosis)) #1 TS=(transient elastograph* or fibroscan) |
Appendix 2. QUADAS‐2
| DOMAIN | PARTICIPANT SELECTION | INDEX TEST | REFERENCE STANDARD | FLOW AND TIMING |
| Description |
Describe methods of participant selection: describe included participants (prior testing, presentation, intended use of index test and setting): The studies that fulfilled the inclusion criteria of this review should have included participants of any sex and ethnic origin, above 16 years old, and who were diagnosed with alcoholic liver disease. The participants could have been hospitalised or outpatients. The diagnosis of alcoholic liver disease should have been established in the study participants based on registered history of alcohol excessive intake of sufficient duration and quantity together with clinical evidence of liver disease expressed with physical signs at examination and followed by laboratory evidence of liver disease. To ascertain the diagnosis of alcoholic liver disease and study the presence or absence of liver fibrosis or cirrhosis or both in each of the study participants, both transient elastography and liver biopsy should have been performed. |
Describe the index test and how it was conducted and interpreted: Transient elastography for grading hepatic fibrosis conducted either before or after liver biopsy. The recommended technical parameters of transient elastography investigation are at least 10 validated stiffness measurements at the same measurement point, an interquartile range of no more than 30%, and the ratio of the number of successful measurements to the total investigational number of acquisitions should be no less than 60% (www.echosens.com/pdf/FS402_WEB.pdf). |
Describe the reference standard and how it was conducted and interpreted: Liver biopsy is useful in establishing the grade of hepatic fibrosis in people with alcoholic liver disease. The morphological interpretation of the liver biopsy samples is reported with semi‐quantitative scores, such as METAVIR, Knodell, Ishak, Kleiner, Scheuer, or Brunt (see Table 2). The Nonalcoholic Steatohepatitis Clinical Research Network scoring system is used for grading steatosis (Kleiner 2005) (Table 3). |
Describe any people who did not receive the index test(s) or reference standard (or both) or who were excluded from the 2 x 2 table (refer to flow diagram): describe the time interval and any interventions between index test(s) and reference standard: As fibrosis may develop rapidly with time, we excluded participants if the time interval between diagnostic liver biopsy and transient elastography investigations was longer than 6 months, an arbitrary chosen time interval. |
| Signalling questions: yes/no/unclear |
Was a consecutive or random sample of participants enrolled? Yes: all consecutive participants or random sample of people with diagnosed alcoholic liver disease were enrolled in the study. No: selected participants were not included. Unclear: insufficient data were reported to permit a judgement. |
Were the index test results interpreted without knowledge of the results of the reference standard? Yes: transient elastography test results were interpreted without knowledge of the results of the liver biopsy. No: transient elastography results were interpreted with knowledge of the results of the liver biopsy. Unclear: insufficient data were reported to permit a judgement. |
Is the reference standard likely to classify the target condition correctly? Yes: if all participants had undergone liver biopsy and the morphological results were correctly reported. No: if all participants had not undergone liver biopsy or morphological results were not correctly reported. Unclear: insufficient data were reported to permit a judgement. |
Was there an appropriate interval between index test(s) and reference standard? Yes: the interval between the transient elastography and liver biopsy was ≤ 6 months. No: the interval between the transient elastography test and liver biopsy was > 6 months. Unclear: insufficient data were reported to permit a judgement. |
|
Was a case‐control design avoided? Yes: case‐control design was avoided. No: case‐control design was not avoided. Unclear: insufficient information was reported to permit a judgement. |
If a threshold was used, was it pre‐specified? Yes: if the threshold for a positive test was pre‐specified. No: if the threshold for a positive test was not pre‐specified. Unclear: insufficient data were reported to permit a judgement. |
Were the reference standard results interpreted without knowledge of the results of the index test? Yes: liver biopsy results were interpreted without knowledge of the results of the transient elastography test. No: liver biopsy results were interpreted with the knowledge of the results of the transient elastography test. Unclear: insufficient data were reported to permit a judgement. |
Did all participants receive the reference standard? Yes: all participants underwent the reference standard, liver biopsy. No: not all participants underwent liver biopsy. Unclear: insufficient data were reported to permit a judgement. |
|
|
Did the study avoid inappropriate exclusions? Yes: the study avoided inappropriate exclusions (i.e., difficult to diagnose participants). No: the study excluded patients inappropriately. Unclear: insufficient data were reported to permit a judgement. |
Did all participants receive the same reference standard? Yes: all participants received the same reference standard, i.e., liver biopsy. No: not all participants received the same reference standard, i.e., liver biopsy. Unclear: insufficient data were reported to permit a judgement. |
|||
|
Were all participants included in the analysis? Yes: all participants meeting the selection criteria (selected participants) were included in the analysis, or data on all the selected participants were available so that a 2 x 2 table including all selected participants could be constructed. No: not all participants meeting the selection criteria were included in the analysis or the 2 x 2 table could not be constructed using data on all selected participants. Unclear: insufficient data were reported to permit a judgement. | ||||
| Risk of bias: high/low/unclear |
Could the selection of participants have introduced bias? High risk of bias: yes, if the selection of participants introduced bias. Low risk of bias: no, if the selection of participants not introduced bias. Unclear risk of bias: insufficient data on participants selection were reported to permit a judgement on the risk of bias. |
Could the conduct or interpretation of the index test have introduced bias? High risk of bias: if the answer to the signalling questions on the conduct or interpretation of the index test was "no". Low risk of bias: if the answer to the signalling questions on the conduct or interpretation of the index test was "yes". Unclear risk of bias: if the answers to the 2 signalling questions on the conduct or interpretation of the index test was either "unclear" or any combination of "unclear" with "yes" or "no". |
Could the reference standard, its conduct, or its interpretation have introduced bias? High risk of bias: if the answer to the signalling questions on the reference standard, its conduct, or its interpretation was "no". Low risk of bias: if the answer to the signalling questions on the reference standard, its conduct, or its interpretation was "yes". Unclear risk of bias: if the answers to the 3 signalling questions on the reference standard, its conduct, or its interpretation was either "unclear" or any combination of "unclear" with "yes" or "no". |
Could the participant flow have introduced bias? High risk of bias: if the answer to the signalling questions on flow and timing was "no". Low risk of bias: if the answer to the signalling questions on flow and timing was "yes". Unclear risk of bias: if the answers to the 4 signalling questions on flow and timing was either "unclear" or any combination of "unclear" with "yes" or "no". |
| Concerns regarding applicability: high/low/unclear |
Were there concerns that the included participants did not match the review question? High concern: there was high concern that the included participants do not match the review question. Low concern: there was low concern that the included participants did not match the review question. Unclear concern: if it was unclear. |
Were there concerns that the index test, its conduct, or interpretation differed from the review question? High concern: there was high concern that the conduct or interpretation of the transient elastography test differs from the way it is likely to be used in clinical practice. Low concern: there was low concern that the conduct or interpretation of the transient elastography test differed from the way it is likely to be used in clinical practice. Unclear concern: if it was unclear. |
Were there concerns that the target condition as defined by the reference standard did not match the review question? High concern: all participants did not undergo liver biopsy for grading hepatic fibrosis. Low concern: all participants underwent liver biopsy for grading hepatic fibrosis. Unclear concern: if it was unclear. |
‐ |
Data
Presented below are all the data for all of the tests entered into the review.
Tests. Data tables by test.
Characteristics of studies
Characteristics of included studies [ordered by study ID]
Anastasiou 2010.
| Study characteristics | |||
| Patient sampling | Prospective cohort study. Consecutive participants. | ||
| Patient characteristics and setting | Number of participants: 14 participants diagnosed with alcoholic liver disease. See personal communication in 'Notes'. Otherwise, 76 participants with chronic liver disease underwent liver biopsy, transient elastography, and FibroTest/ActiTest. | ||
| Index tests | Transient elastography. | ||
| Target condition and reference standard(s) | Participants with alcoholic liver disease and liver biopsy. | ||
| Flow and timing | The interval between the liver biopsy and the transient elastography measurement was on the same day following Anastasiou 2010 and 3 days, following personal communication on 27 July 2011. | ||
| Comparative | |||
| Notes | Email sent to J Anastasiou and colleagues 20 July 2011. Reply received 27 July 2011.
The following data were received through personal communication with J Anastasiou: "Dear Dr Pavlov, Thank you for taking into consideration our article. Our alcoholic liver disease group was categorized as follows: 14 patients with liver fibrosis stage (METAVIR) F:0/1/2/3/4 of 8/2/0/0/4 respectively. (table 1). Taking into account the size of the ALD (alcoholic liver disease) subgroup, only an F (fibrosis) above or equal of 2, analysis was feasible. The results are as follows: Optimal cut‐off value: 7.15 kPa Sensitivity: 0.75 Specificity: 0.80 Positive predictive value: 0.89 Negative predictive value: 0.6 AUROC: 0.83 Asymptomatic significance: 0.06 The interval between the liver biopsy and the transient elastography measurement was 3 days. Transient elastography was performed as an add on test to the liver biopsy. Kindest regards, Dr Anastasiou" |
||
| Methodological quality | |||
| Item | Authors' judgement | Risk of bias | Applicability concerns |
| DOMAIN 1: Patient Selection | |||
| Was a consecutive or random sample of patients enrolled? | Yes | ||
| Was a case‐control design avoided? | Yes | ||
| Did the study avoid inappropriate exclusions? | Yes | ||
| Low | Low | ||
| DOMAIN 2: Index Test All tests | |||
| Were the index test results interpreted without knowledge of the results of the reference standard? | Yes | ||
| If a threshold was used, was it pre‐specified? | No | ||
| High | Low | ||
| DOMAIN 3: Reference Standard | |||
| Is the reference standards likely to correctly classify the target condition? | Yes | ||
| Were the reference standard results interpreted without knowledge of the results of the index tests? | Yes | ||
| Low | Low | ||
| DOMAIN 4: Flow and Timing | |||
| Was there an appropriate interval between index test and reference standard? | Yes | ||
| Did all patients receive the same reference standard? | Yes | ||
| Were all patients included in the analysis? | Yes | ||
| Low | |||
Bardou‐Jacquet 2013.
| Study characteristics | |||
| Patient sampling | Retrospective cohort study. | ||
| Patient characteristics and setting | Only participants followed by trained addictologists with definite information regarding alcohol consumption were included. People were excluded if they presented other causes of chronic liver disease. 37 participants corresponded to the study criteria and were considered for analyses (7 women and 30 men). 8 participants had liver biopsy during follow‐up. |
||
| Index tests | Transient elastography. | ||
| Target condition and reference standard(s) | Participants with alcoholic liver disease and liver biopsy. | ||
| Flow and timing | 2 biopsies within 4 weeks, and 6 biopsies within the median of follow‐up 32.5 weeks (15 weeks to 85 weeks). | ||
| Comparative | |||
| Notes | No letter sent to the study authors. Unclear when liver biopsy was performed in the 8 participants, but 8 participants had liver biopsy during follow‐up. Transient elastography was performed at an interval of more than 1 week apart by a senior operator. | ||
| Methodological quality | |||
| Item | Authors' judgement | Risk of bias | Applicability concerns |
| DOMAIN 1: Patient Selection | |||
| Was a consecutive or random sample of patients enrolled? | Yes | ||
| Was a case‐control design avoided? | Yes | ||
| Did the study avoid inappropriate exclusions? | Yes | ||
| Low | Low | ||
| DOMAIN 2: Index Test All tests | |||
| Were the index test results interpreted without knowledge of the results of the reference standard? | Unclear | ||
| If a threshold was used, was it pre‐specified? | Yes | ||
| Unclear | Low | ||
| DOMAIN 3: Reference Standard | |||
| Is the reference standards likely to correctly classify the target condition? | Yes | ||
| Were the reference standard results interpreted without knowledge of the results of the index tests? | Unclear | ||
| Unclear | Low | ||
| DOMAIN 4: Flow and Timing | |||
| Was there an appropriate interval between index test and reference standard? | Unclear | ||
| Did all patients receive the same reference standard? | Yes | ||
| Were all patients included in the analysis? | No | ||
| High | |||
Boursier 2009.
| Study characteristics | |||
| Patient sampling | Prospective cross‐sectional cohort study. | ||
| Patient characteristics and setting | From personal communication, we obtained the information that "out of 390 patients, 106 had alcoholic liver disease..." "Liver steatosis evaluation on liver biopsy was not available in our study." Hospitalised. |
||
| Index tests | Transient elastography. | ||
| Target condition and reference standard(s) | Participants with alcoholic liver disease and liver biopsy. | ||
| Flow and timing | 1 week. | ||
| Comparative | |||
| Notes | Email sent to Jerome Boursier and colleagues 26 February 2013. Replies received 19 February 2013 and 21 May 2013. Individual participant data, sent by the study author, were used for our review analyses. The impression is that liver biopsy was performed first and then transient elastography. | ||
| Methodological quality | |||
| Item | Authors' judgement | Risk of bias | Applicability concerns |
| DOMAIN 1: Patient Selection | |||
| Was a consecutive or random sample of patients enrolled? | Yes | ||
| Was a case‐control design avoided? | Yes | ||
| Did the study avoid inappropriate exclusions? | Yes | ||
| Low | Low | ||
| DOMAIN 2: Index Test All tests | |||
| Were the index test results interpreted without knowledge of the results of the reference standard? | Yes | ||
| If a threshold was used, was it pre‐specified? | No | ||
| High | Low | ||
| DOMAIN 3: Reference Standard | |||
| Is the reference standards likely to correctly classify the target condition? | Yes | ||
| Were the reference standard results interpreted without knowledge of the results of the index tests? | Yes | ||
| Low | Low | ||
| DOMAIN 4: Flow and Timing | |||
| Was there an appropriate interval between index test and reference standard? | Yes | ||
| Did all patients receive the same reference standard? | Yes | ||
| Were all patients included in the analysis? | No | ||
| High | |||
Carl 2012.
| Study characteristics | |||
| Patient sampling | Retrospective cohort study. | ||
| Patient characteristics and setting | 4 people with alcoholic liver disease were included in the analyses (see personal communication in 'Notes'.). In total, 266 participants underwent FibroScan®. | ||
| Index tests | Transient elastography. | ||
| Target condition and reference standard(s) | People with alcoholic liver disease and liver biopsy. | ||
| Flow and timing | Participants who were included between 1 May 2008 and 31 July 2011. | ||
| Comparative | |||
| Notes | Email sent 1 March 2013. Reply received 15 April 2013. Individual participant data, sent by the study author, were used for our review analyses. Unclear of the sequence, but reported "All patients who underwent liver biopsy and FibroScan® between 1 May 2008 and 31 July 2011". |
||
| Methodological quality | |||
| Item | Authors' judgement | Risk of bias | Applicability concerns |
| DOMAIN 1: Patient Selection | |||
| Was a consecutive or random sample of patients enrolled? | Yes | ||
| Was a case‐control design avoided? | Yes | ||
| Did the study avoid inappropriate exclusions? | Unclear | ||
| Unclear | Low | ||
| DOMAIN 2: Index Test All tests | |||
| Were the index test results interpreted without knowledge of the results of the reference standard? | Unclear | ||
| If a threshold was used, was it pre‐specified? | Unclear | ||
| Unclear | Low | ||
| DOMAIN 3: Reference Standard | |||
| Is the reference standards likely to correctly classify the target condition? | Yes | ||
| Were the reference standard results interpreted without knowledge of the results of the index tests? | Unclear | ||
| Unclear | Low | ||
| DOMAIN 4: Flow and Timing | |||
| Was there an appropriate interval between index test and reference standard? | Unclear | ||
| Did all patients receive the same reference standard? | Yes | ||
| Were all patients included in the analysis? | Yes | ||
| Unclear | |||
de Ledinghen 2013.
| Study characteristics | |||
| Patient sampling | Prospective cohort study. | ||
| Patient characteristics and setting | In our review analysis, we could include 34 participants as we received individual data. | ||
| Index tests | Transient elastography. | ||
| Target condition and reference standard(s) | Participants with alcoholic liver disease and liver biopsy. | ||
| Flow and timing | Within 1 week. | ||
| Comparative | |||
| Notes | Email request sent about additional data to Victor De‐Ledinghen on 22 July 2011. Received an Excel sheet with data on 25 July 2011. In summary, retrieved data from 51 people with liver biopsy and transient elastography. After removing duplicate entries of participants, 34 participants remained. It is not clear which test/investigation was performed first. |
||
| Methodological quality | |||
| Item | Authors' judgement | Risk of bias | Applicability concerns |
| DOMAIN 1: Patient Selection | |||
| Was a consecutive or random sample of patients enrolled? | Yes | ||
| Was a case‐control design avoided? | Yes | ||
| Did the study avoid inappropriate exclusions? | Yes | ||
| Low | Low | ||
| DOMAIN 2: Index Test All tests | |||
| Were the index test results interpreted without knowledge of the results of the reference standard? | Yes | ||
| If a threshold was used, was it pre‐specified? | No | ||
| High | Low | ||
| DOMAIN 3: Reference Standard | |||
| Is the reference standards likely to correctly classify the target condition? | Yes | ||
| Were the reference standard results interpreted without knowledge of the results of the index tests? | Yes | ||
| Low | Low | ||
| DOMAIN 4: Flow and Timing | |||
| Was there an appropriate interval between index test and reference standard? | Yes | ||
| Did all patients receive the same reference standard? | Yes | ||
| Were all patients included in the analysis? | No | ||
| High | |||
Dolman 2013.
| Study characteristics | |||
| Patient sampling | Retrospective study using data from a consecutive cohort of participants; among the people with chronic liver disease with different aetiologies, 20 had alcoholic liver disease. | ||
| Patient characteristics and setting | There were 20 participants with alcoholic liver disease. See personal communication in 'Notes'. | ||
| Index tests | Transient elastography. | ||
| Target condition and reference standard(s) | Participants with alcoholic liver disease and liver biopsy. | ||
| Flow and timing | 2 months. | ||
| Comparative | |||
| Notes | Email sent to Grace Dolman on 26 May 2013. Replies received 18 June 2013, 9 April 2013, and 22 October 2013. Received individual data of interest to our review protocol on 20 participants. "There were 20 patients in our study with alcoholic liver disease. This was defined as the presence of steatohepatitis with or without fibrosis, with alcohol as the most likely aetiology (and parenchymal chronic liver screen negative). All patients had transient elastography and biopsy. AST was not routinely available in our centre at the time of the study, but I have included ALT as requested. BMI was missing from the notes when we reviewed them for the study for all (BMI in 2 categories a) < 25 b) ≥25 kg/m2) but one patient. Steatosis was divided into 2 categories a) < 5% steatosis; b) ≥ 5% steatosis. We did not calculate sensitivity/specificity by aetiology in the study due to the small numbers in the cohort. Grace Dolman" Participants were included if they had a liver biopsy within 2 months of a validated transient elastography measurement. |
||
| Methodological quality | |||
| Item | Authors' judgement | Risk of bias | Applicability concerns |
| DOMAIN 1: Patient Selection | |||
| Was a consecutive or random sample of patients enrolled? | Yes | ||
| Was a case‐control design avoided? | Yes | ||
| Did the study avoid inappropriate exclusions? | Yes | ||
| Low | Low | ||
| DOMAIN 2: Index Test All tests | |||
| Were the index test results interpreted without knowledge of the results of the reference standard? | Yes | ||
| If a threshold was used, was it pre‐specified? | Yes | ||
| Low | Low | ||
| DOMAIN 3: Reference Standard | |||
| Is the reference standards likely to correctly classify the target condition? | Yes | ||
| Were the reference standard results interpreted without knowledge of the results of the index tests? | Yes | ||
| Low | Low | ||
| DOMAIN 4: Flow and Timing | |||
| Was there an appropriate interval between index test and reference standard? | Yes | ||
| Did all patients receive the same reference standard? | Yes | ||
| Were all patients included in the analysis? | Yes | ||
| Low | |||
Fernandez 2012.
| Study characteristics | |||
| Patient sampling | Retrospective cohort study. | ||
| Patient characteristics and setting | 139 people with alcoholic liver disease. | ||
| Index tests | Transient elastography. | ||
| Target condition and reference standard(s) | Participants with alcoholic liver disease and liver biopsy. | ||
| Flow and timing | Within 6 months. | ||
| Comparative | |||
| Notes | No email sent. Liver biopsy was performed first and then within the 6 months, participants underwent transient elastography testing (among other tests). | ||
| Methodological quality | |||
| Item | Authors' judgement | Risk of bias | Applicability concerns |
| DOMAIN 1: Patient Selection | |||
| Was a consecutive or random sample of patients enrolled? | Yes | ||
| Was a case‐control design avoided? | Yes | ||
| Did the study avoid inappropriate exclusions? | Yes | ||
| Low | Low | ||
| DOMAIN 2: Index Test All tests | |||
| Were the index test results interpreted without knowledge of the results of the reference standard? | Unclear | ||
| If a threshold was used, was it pre‐specified? | No | ||
| High | Low | ||
| DOMAIN 3: Reference Standard | |||
| Is the reference standards likely to correctly classify the target condition? | Yes | ||
| Were the reference standard results interpreted without knowledge of the results of the index tests? | Unclear | ||
| Unclear | Low | ||
| DOMAIN 4: Flow and Timing | |||
| Was there an appropriate interval between index test and reference standard? | Yes | ||
| Did all patients receive the same reference standard? | Yes | ||
| Were all patients included in the analysis? | Yes | ||
| Unclear | |||
Janssens 2010.
| Study characteristics | |||
| Patient sampling | Prospective cohort study. | ||
| Patient characteristics and setting | "Two hundred fifty‐five patients admitted between January 1, 2006 and February 29, 2008 to our unit for alcohol detoxification and rehabilitation. Final analysis was performed on a total of 49 patients (34 men and 15 women). Median age was 53 years (range: 29 to 73 y) and median body mass index was 25 (range: 17 to 38). Number of patients: 49. Sex: male/female: 34 men/15 women. Age (years): 53 (29 to 73). BMI = 25 (17 to 38). AST = 87IU/l (25 to 311). ALT = 51IU/l (17 to 168)." |
||
| Index tests | Transient elastography. | ||
| Target condition and reference standard(s) | Participants with alcoholic liver disease and liver biopsy. | ||
| Flow and timing | Liver biopsy performed after transient elastography investigation in 1 week. | ||
| Comparative | |||
| Notes | No mail sent. The impression was that transient elastography was performed before liver biopsy. See also p. 581 of the primary publication. | ||
| Methodological quality | |||
| Item | Authors' judgement | Risk of bias | Applicability concerns |
| DOMAIN 1: Patient Selection | |||
| Was a consecutive or random sample of patients enrolled? | Yes | ||
| Was a case‐control design avoided? | Yes | ||
| Did the study avoid inappropriate exclusions? | Yes | ||
| Low | Low | ||
| DOMAIN 2: Index Test All tests | |||
| Were the index test results interpreted without knowledge of the results of the reference standard? | Yes | ||
| If a threshold was used, was it pre‐specified? | Yes | ||
| Low | Low | ||
| DOMAIN 3: Reference Standard | |||
| Is the reference standards likely to correctly classify the target condition? | Yes | ||
| Were the reference standard results interpreted without knowledge of the results of the index tests? | Yes | ||
| Low | Low | ||
| DOMAIN 4: Flow and Timing | |||
| Was there an appropriate interval between index test and reference standard? | Yes | ||
| Did all patients receive the same reference standard? | Yes | ||
| Were all patients included in the analysis? | Yes | ||
| Low | |||
Kim 2009.
| Study characteristics | |||
| Patient sampling | Prospective cohort study. | ||
| Patient characteristics and setting | 45 people with alcoholic liver disease enrolled. Fibrosis stage assessed using the Batts‐Ludwig scoring system. Aim of study was to determine the diagnostic accuracy of the FibroScan® in the detection of cirrhosis in people with alcoholic liver disease. Clinical data for 29 people with cirrhosis Sex: male/female: 24 men/5 women. Age (years): 47.9 ± 7.8. BMI = 23.1 ± 3.8. AST = 114.9 IU/L ± 71.4. ALT = 62.6 U/L ± 92.2. Clinical data for 16 people without cirrhosis Sex: male/female: 13 men/3 women. Age (years): 44.9 ± 7.5. BMI = 23.1 ± 4.0. AST = 81.8 IU/L ± 63.1. ALT = 69.1 U/L ± 48.4. |
||
| Index tests | Transient elastography. | ||
| Target condition and reference standard(s) | Participants with alcoholic liver disease and liver biopsy. | ||
| Flow and timing | Liver biopsy and transient elastography performed with the interval of 11.2 ± 22 days (0 to about 92 days). | ||
| Comparative | |||
| Notes | Mail sent 26 March 2013 and replies received on the same day. Unclear, but FibroScan® was mentioned before liver biopsy testing. | ||
| Methodological quality | |||
| Item | Authors' judgement | Risk of bias | Applicability concerns |
| DOMAIN 1: Patient Selection | |||
| Was a consecutive or random sample of patients enrolled? | Yes | ||
| Was a case‐control design avoided? | Yes | ||
| Did the study avoid inappropriate exclusions? | Yes | ||
| Low | Low | ||
| DOMAIN 2: Index Test All tests | |||
| Were the index test results interpreted without knowledge of the results of the reference standard? | Yes | ||
| If a threshold was used, was it pre‐specified? | No | ||
| High | Low | ||
| DOMAIN 3: Reference Standard | |||
| Is the reference standards likely to correctly classify the target condition? | Yes | ||
| Were the reference standard results interpreted without knowledge of the results of the index tests? | Yes | ||
| Low | Low | ||
| DOMAIN 4: Flow and Timing | |||
| Was there an appropriate interval between index test and reference standard? | Yes | ||
| Did all patients receive the same reference standard? | Yes | ||
| Were all patients included in the analysis? | Yes | ||
| Low | |||
Lannerstedt 2013.
| Study characteristics | |||
| Patient sampling | Retrospective, cohort study. Participants with different chronic liver diseases. | ||
| Patient characteristics and setting | 16 people with alcoholic liver disease. 418 participants in total. | ||
| Index tests | Transient elastography. | ||
| Target condition and reference standard(s) | Participants with alcoholic liver disease and liver biopsy. | ||
| Flow and timing | 8 participants (50%) had transient elastography at < 2 months, and 8 participants (50%) had transient elastography at > 1.9 years to 8.6 years. | ||
| Comparative | |||
| Notes | Emails sent 28 February 2013. Replies received 21 May 2013 and 23 May 2013. We received individual participant data (relevant to our review information) for 16 people with alcoholic liver disease. It seems that liver biopsy was performed before transient elastography (it was also a retrospective study). However, the time interval was most likely not an issue in terms of haematoma should liver biopsy have been performed before transient elastography. | ||
| Methodological quality | |||
| Item | Authors' judgement | Risk of bias | Applicability concerns |
| DOMAIN 1: Patient Selection | |||
| Was a consecutive or random sample of patients enrolled? | Yes | ||
| Was a case‐control design avoided? | Yes | ||
| Did the study avoid inappropriate exclusions? | Yes | ||
| Low | Low | ||
| DOMAIN 2: Index Test All tests | |||
| Were the index test results interpreted without knowledge of the results of the reference standard? | Yes | ||
| If a threshold was used, was it pre‐specified? | Yes | ||
| Low | Low | ||
| DOMAIN 3: Reference Standard | |||
| Is the reference standards likely to correctly classify the target condition? | Yes | ||
| Were the reference standard results interpreted without knowledge of the results of the index tests? | Yes | ||
| Low | Low | ||
| DOMAIN 4: Flow and Timing | |||
| Was there an appropriate interval between index test and reference standard? | No | ||
| Did all patients receive the same reference standard? | Yes | ||
| Were all patients included in the analysis? | Yes | ||
| High | |||
Lemoine 2008.
| Study characteristics | |||
| Patient sampling | Prospective cohort study. | ||
| Patient characteristics and setting | Alcoholic participants. 48 people had alcohol‐related cirrhosis. (Another 44 had hepatitis C virus‐related cirrhosis.) | ||
| Index tests | Transient elastography. "Liver stiffness measurement was performed using FibroScan® (Echosens) by two experienced operators who were not aware of the haemodynamic results. Briefly, FibroScan® was performed as previously described on the right lobe of the liver, in the intercostal space with the patient lying in dorsal decubitus with the right arm in maximal abduction. Only procedures with 10 validated acquisitions, interquartile range ≤ 30% of the median value and a success rate of at least 70% were considered reliable. The median value of all validated acquisitions was considered as LSM and the results were expressed in kilopascal (kPa)." |
||
| Target condition and reference standard(s) | Participants with alcoholic liver disease and liver biopsy. | ||
| Flow and timing | Transient elastography and liver biopsy were performed on the same day. | ||
| Comparative | |||
| Notes | No mail sent. Transient elastography and liver biopsy (transjugular route) were performed on the same day, and it seems that transient elastography was performed first. | ||
| Methodological quality | |||
| Item | Authors' judgement | Risk of bias | Applicability concerns |
| DOMAIN 1: Patient Selection | |||
| Was a consecutive or random sample of patients enrolled? | Yes | ||
| Was a case‐control design avoided? | Yes | ||
| Did the study avoid inappropriate exclusions? | Yes | ||
| Low | Low | ||
| DOMAIN 2: Index Test All tests | |||
| Were the index test results interpreted without knowledge of the results of the reference standard? | Yes | ||
| If a threshold was used, was it pre‐specified? | No | ||
| High | Low | ||
| DOMAIN 3: Reference Standard | |||
| Is the reference standards likely to correctly classify the target condition? | Yes | ||
| Were the reference standard results interpreted without knowledge of the results of the index tests? | Yes | ||
| Low | Low | ||
| DOMAIN 4: Flow and Timing | |||
| Was there an appropriate interval between index test and reference standard? | Yes | ||
| Did all patients receive the same reference standard? | Yes | ||
| Were all patients included in the analysis? | Yes | ||
| Low | |||
Mueller 2010.
| Study characteristics | |||
| Patient sampling | Prospective cohort study of 101 people with alcoholic liver disease. | ||
| Patient characteristics and setting | Validation cohort: in the second part of the study, the study authors included 101 (73 men and 28 women) people with histologically staged alcoholic liver disease. (In the first part of the study, sequential analyses of liver stiffness was performed in 50 people presenting at a university medical centre for alcohol detoxification.) | ||
| Index tests | Transient elastography. | ||
| Target condition and reference standard(s) | Participants with alcoholic liver disease and liver biopsy. | ||
| Flow and timing | A mean observation interval of 5.3 days. Range 3 to 10 days. | ||
| Comparative | |||
| Notes | No mail sent. Unclear. The FibroScan® examination (with M probe) was performed at the time of liver biopsy, i.e., at the same time in 100 participants. | ||
| Methodological quality | |||
| Item | Authors' judgement | Risk of bias | Applicability concerns |
| DOMAIN 1: Patient Selection | |||
| Was a consecutive or random sample of patients enrolled? | Yes | ||
| Was a case‐control design avoided? | Yes | ||
| Did the study avoid inappropriate exclusions? | Yes | ||
| Low | Low | ||
| DOMAIN 2: Index Test All tests | |||
| Were the index test results interpreted without knowledge of the results of the reference standard? | Yes | ||
| If a threshold was used, was it pre‐specified? | Yes | ||
| Low | Low | ||
| DOMAIN 3: Reference Standard | |||
| Is the reference standards likely to correctly classify the target condition? | Yes | ||
| Were the reference standard results interpreted without knowledge of the results of the index tests? | Yes | ||
| Low | Low | ||
| DOMAIN 4: Flow and Timing | |||
| Was there an appropriate interval between index test and reference standard? | Yes | ||
| Did all patients receive the same reference standard? | Yes | ||
| Were all patients included in the analysis? | Yes | ||
| Low | |||
Nahon 2008.
| Study characteristics | |||
| Patient sampling | Prospective blinded cohort study that included consecutive participants with suspected alcoholic liver disease. | ||
| Patient characteristics and setting | Out of 174 participants fulfilling the study inclusion criteria, 147 participants remained to be included. | ||
| Index tests | Transient elastography. | ||
| Target condition and reference standard(s) | Participants with alcoholic liver disease and liver biopsy. | ||
| Flow and timing | Transient elastography and liver biopsy on the same day. | ||
| Comparative | |||
| Notes | No mail sent. Liver biopsy seems to have been performed first, followed by transient elastography on the same day. | ||
| Methodological quality | |||
| Item | Authors' judgement | Risk of bias | Applicability concerns |
| DOMAIN 1: Patient Selection | |||
| Was a consecutive or random sample of patients enrolled? | Yes | ||
| Was a case‐control design avoided? | Yes | ||
| Did the study avoid inappropriate exclusions? | Yes | ||
| Low | Low | ||
| DOMAIN 2: Index Test All tests | |||
| Were the index test results interpreted without knowledge of the results of the reference standard? | Yes | ||
| If a threshold was used, was it pre‐specified? | Yes | ||
| Low | Low | ||
| DOMAIN 3: Reference Standard | |||
| Is the reference standards likely to correctly classify the target condition? | Yes | ||
| Were the reference standard results interpreted without knowledge of the results of the index tests? | Yes | ||
| Low | Low | ||
| DOMAIN 4: Flow and Timing | |||
| Was there an appropriate interval between index test and reference standard? | Yes | ||
| Did all patients receive the same reference standard? | Yes | ||
| Were all patients included in the analysis? | Yes | ||
| Low | |||
Nguyen‐Khac 2008.
| Study characteristics | |||
| Patient sampling | Prospective cohort study. | ||
| Patient characteristics and setting | The number of participants included in the final analyses was 103. Otherwise, 160 participants met the inclusion criteria. Rehabilitation outpatients and inpatients with alcohol abuse, prospectively included from April 2005 to January 2007. | ||
| Index tests | Transient elastography. | ||
| Target condition and reference standard(s) | Participants with alcoholic liver disease and liver biopsy. | ||
| Flow and timing | Transient elastography and liver biopsy on the same day. | ||
| Comparative | |||
| Notes | No mail sent. It seemed that liver biopsy (percutaneously) was performed before transient elastography. Both on the same day. | ||
| Methodological quality | |||
| Item | Authors' judgement | Risk of bias | Applicability concerns |
| DOMAIN 1: Patient Selection | |||
| Was a consecutive or random sample of patients enrolled? | Yes | ||
| Was a case‐control design avoided? | Yes | ||
| Did the study avoid inappropriate exclusions? | Yes | ||
| Low | Low | ||
| DOMAIN 2: Index Test All tests | |||
| Were the index test results interpreted without knowledge of the results of the reference standard? | Yes | ||
| If a threshold was used, was it pre‐specified? | No | ||
| High | Low | ||
| DOMAIN 3: Reference Standard | |||
| Is the reference standards likely to correctly classify the target condition? | Yes | ||
| Were the reference standard results interpreted without knowledge of the results of the index tests? | Yes | ||
| Low | Low | ||
| DOMAIN 4: Flow and Timing | |||
| Was there an appropriate interval between index test and reference standard? | Yes | ||
| Did all patients receive the same reference standard? | Yes | ||
| Were all patients included in the analysis? | Yes | ||
| Low | |||
AST: aspartate aminotransferase; BMI: body mass index; F: fibrosis; FT/AT = FibroTest (ActiTest); LSM: liver stiffness measurement; TE (FS): transient elastography (FibroScan®).
Characteristics of excluded studies [ordered by study ID]
| Study | Reason for exclusion |
|---|---|
| Angulo 2009b | Review article (serum markers). |
| Baba 2011 | No reference standard. |
| Bureau 2008 | Aim was to assess the correlation between liver stiffness and hepatic venous pressure gradient and to investigate the performance of transient elastography for the diagnosis of significant portal hypertension in participants with liver diseases (however, the cause of liver abnormalities in 51 (34%) out of 150 participants was alcohol). |
| Crespo 2010 | Preliminary abstract published in 2010 of a study published later by Crespo 2012. |
| Crespo 2012 | Only 4 participants with alcoholic liver disease. This information was received through email on 13 March 2014. "....Please find attached the individual data of the patients included. There were only 15 patients with alcoholic disease, and among them 11 had been transplanted (so no alcohol‐related liver disease at all was present at the moment of biopsy and TE [transient elastography]). So in the end, there were only 4 "pure" immunocompetent patients with alcohol‐related chronic liver disease. I have anyway included the data required of all patients just in case you decide to use them. I regret the low number of patients with which we can contribute to the review, and I understand you may decide not to use them. Thanks. Gonzalo Crespo" |
| Ebinuma 2011 | Aim was to evaluate the clinical utility of transient elastography with acoustic radiation force impulse and to compare the results with this method and those of the FibroScan® procedure. |
| Fraquelli 2007 | No data for the 5 people with alcoholic liver disease. |
| Ganne‐Carrié 2006 | Data on 75 people with alcoholic liver disease were expected to be received from Celine Fournier working at Echosens. We understood that the data are the property of the firm. In addition, it is written in the publication that there is participant overlap with another study by Ziol et al. published in Ziol 2005 that had included people with chronic hepatitis C. Reading the 3 publications under the main reference of the included study by de Ledinghen 2013, its seemed that data on the 75 participants that we were interested in were a consistent part of the Excel sheet with individual participant data obtained through personal communication with de Ledinghen on 8 March 2013. As we cannot be completely sure, we refer to the Ganne‐Carrié publication twice, i.e., under included and excluded studies. |
| Gómez‐Dominguez 2006 | No data for the 3 people with alcoholic liver disease. |
| Ingiliz 2009 | Aim was to investigate the liver stiffness measurement applicability and variability with reference to 3 probe positions according to the region of liver biopsy. |
| Kircheis 2012 | Reference standard was transient elastography. |
| Klibansky 2012 | Aim of the study was to determine whether transient elastography could identify people with chronic liver disease at risk of clinical decompensation. |
| Krawczyk 2011 | Aim was to investigate variant adiponutrin as genetic determinant of liver fibrosis. |
| Marinho 2007 | Participants were with concomitant liver diseases. |
| McCorry 2012 | Participants were suspected of having a chronic liver disease; however, aetiology was not reported. |
| Nudo 2008 | During the time of liver biopsy or FibroScan® measurements, people with alcoholic liver disease were abstinent. |
| Rath 2011 | Only 2 people with alcoholic liver disease, i.e., the number of participants with alcoholic liver disease was too low and the data were not given separately. |
| Roulot 2011 | Data on people with alcoholic liver disease alone could not be obtained separately. |
| Stål 2009 | Only 2 people with alcoholic liver disease. Some information on these 2 people was received from P Stål on 20 June 2013. |
| Trabut 2012 | Only 1 person (too low number) with alcoholic liver disease. The information below was received through email on 26 May 2013. " ...... We only had 1 patient with alcoholic liver disease. The majority of the subjects in our study had chronic hepatitis C. There were individuals biopsied for elevated liver enzymes of unknown etiology, but alcohol consumption was not significant in these individuals and the biopsy histology was not consistent with alcoholic liver disease. The one subject was male and 44 years old. BMI 25.9, FibroScan®= 48 kPa, Biopsy showed grade 3 and stage 4 on both left and right liver lobes. (2 biopsies per lobe). The biopsy and FibroScan® were performed 21 days apart. Unfortunately that is all the data I have. Please do not hesitate to contact me if you have any further question. Thank‐you, Carmine Nudo, MD CM, FRCPC" |
BMI: body mass index.
Differences between protocol and review
We added a second objective: "In addition, to identify the optimal cut‐off values for differentiating the five stages of hepatic fibrosis."
We excluded study design (diagnostic cohort study designs compared to case‐control study designs) from investigation of heterogeneity, as it is a QUADAS‐2 item. In addition, in our review, all included studies were cohort studies.
Contributions of authors
Chavdar Pavlov (CP): selected studies for inclusion, extracted study data and performed bias risk assessment, drafted the review, and is a guarantor of the review. Giovanni Casazza (GC): checked and analysed study data, performed statistical analyses, drafted the review, commented and advised on the review during the review preparation. Dimitrinka Nikolova (DN): selected studies for inclusion, extracted study data, and performed bias risk assessment. Vladimir T Ivashkin: revised the review. Emmanuel Tsochatzis (ET): checked data extraction and suggested comments for improvement of the review. Andrew K Burroughs had contributed to the draft text of the review before Andrew passed away 15 March 15 2014. Christian Gluud (CG): discussed review results and revised the review.
All authors agreed on the final version of the review.
Sources of support
Internal sources
The Editorial Team Office, The Cochrane Hepato‐Biliary Group, The Copenhagen Trial Unit, Centre for Clinical Intervention Research, Rigshospitalet, Copenhagen, Denmark.
External sources
No sources of support supplied
Declarations of interest
Chavdar Pavlov: none known. Giovanni Casazza: none known. Dimitrinka Nikolova: none known. Emmanuel Tsochatzis: none known. Andrew K Burroughs: none known. Vladimir T Ivashkin: none known. Christian Gluud: none known.
Deceased.
New
References
References to studies included in this review
Anastasiou 2010 {published data only}
- Anastasiou J, Alisa A, Virtue S, Portmann B, Murray‐Lyon I, Williams R. Noninvasive markers of fibrosis and inflammation in clinical practice: prospective comparison with liver biopsy. European Journal of Gastroenterology & Hepatology 2010;22(4):474‐80. [DOI] [PubMed] [Google Scholar]
Bardou‐Jacquet 2013 {published data only}
- Bardou‐Jacquet E, Legros L, Soro D, Latournerie M, Guillygomarc'h A, Lan C, et al. Effect of alcohol consumption on liver stiffness measured by transient elastography. World Journal of Gastroenterology 2013;19(4):516‐22. [DOI] [PMC free article] [PubMed] [Google Scholar]
Boursier 2009 {published data only}
- Boursier J, Vergniol J, Sawadogo A, Dakka T, Michalak S, Gallois Y, et al. The combination of a blood test and FibroScan improves the non‐invasive diagnosis of liver fibrosis. Liver International 2009;29(10):1507‐15. [DOI] [PubMed] [Google Scholar]
Carl 2012 {published and unpublished data}
- Carl I, Addley J, McDoughall NI, Cash WJ. Transient hepatic elastography reliably excludes cirrhosis in an unselected liver disease population. Journal of Hepatology 2012;56:S389‐548. [Google Scholar]
de Ledinghen 2013 {published data only}
- Foucher J, Chanteloup E, Vergniol J, Castéra L, Bail B, Adhoute X, et al. Diagnosis of cirrhosis by transient elastography (FibroScan): a prospective study. Gut 2006;55(3):403‐8. [DOI] [PMC free article] [PubMed] [Google Scholar]
- Ganne‐Carrié N, Ziol M, Ledinghen V, Douvin C, Marcellin P, Castera L, et al. Accuracy of liver stiffness measurement for the diagnosis of cirrhosis in patients with chronic liver diseases. Hepatology 2006;44(6):1511‐7. [DOI] [PubMed] [Google Scholar]
- Ledinghen V. (See notes in Included studies table). (Personal communication) 2013.
- Ledinghen V, Wong VW, Vergniol J, Wong GL, Foucher J, Chu SH, et al. Diagnosis of liver fibrosis and cirrhosis using liver stiffness measurement: comparison between M and XL probe of FibroScan. Journal of Hepatology 2012;56(4):833‐9. [DOI] [PubMed] [Google Scholar]
Dolman 2013 {published data only}
Fernandez 2012 {published data only}
- Fernandez M. FibroScan (transient elastography) is the most reliable non‐invasive method for the assessment of severe fibrosis and cirrhosis in alcoholic liver disease [poster for AASLD 2012]. www.biopredictive.com. (accessed 1 December 2014).
Janssens 2010 {published data only}
- Janssens F, Suray N, Piessevaux H, Horsmans Y, Timary P, Stärkel P. Can transient elastography replace liver histology for determination of advanced fibrosis in alcoholic patients: a real‐life study. Journal of Clinical Gastroenterology 2010;44(8):575‐82. [DOI] [PubMed] [Google Scholar]
Kim 2009 {published data only}
- Kim SG, Kim YS, Jung SW, Kim HK, Jang JY, Moon JH, et al. The usefulness of transient elastography to diagnose cirrhosis in patients with alcoholic liver disease. Korean Journal of Hepatology 2009;15(1):42‐51. [DOI] [PubMed] [Google Scholar]
Lannerstedt 2013 {published data only}
- Lannerstedt H, Konopski Z, Sandvik L, Haaland T, Løberg EM, Haukeland JW. Combining transient elastography with FIB4 enhances sensitivity in detecting advanced fibrosis of the liver. Scandinavian Journal of Gastroenterology 2013;48(1):93‐100. [DOI] [PubMed] [Google Scholar]
Lemoine 2008 {published data only}
- Lemoine M, Katsahian S, Ziol M, Nahon P, Ganne‐Carrie N, Kazemi F, et al. Liver stiffness measurement as a predictive tool of clinically significant portal hypertension in patients with compensated hepatitis C virus or alcohol‐related cirrhosis. Alimentary Pharmacology & Therapeutics 2008;28(9):1102‐10. [DOI] [PubMed] [Google Scholar]
Mueller 2010 {published data only}
- Mueller S, Millonig G, Friedrich S, Stickel F, Longerich T, Schirmacher P, et al. Increased liver stiffness in alcoholic liver disease: dissecting fibrosis from steatohepatitis. Alcoholism, Clinical and Experimental Research 2010;34(Suppl S3):141A. [DOI] [PMC free article] [PubMed] [Google Scholar]
- Mueller S, Millonig G, Friedrich S, Stickel F, Longerich T, Schirmacher P, et al. Increased liver stiffness in alcoholic liver disease: dissecting fibrosis from steatohepatitis. Journal of Hepatology 2010;52(Suppl 1):S169. [DOI] [PMC free article] [PubMed] [Google Scholar]
- Mueller S, Millonig G, Sarovska L, Friedrich S, Reimann FM, Pritsch M, et al. Increased liver stiffness in alcoholic liver disease: differentiating fibrosis from steatohepatitis. World Journal of Gastroenterology 2010;16(8):966‐72. [DOI] [PMC free article] [PubMed] [Google Scholar]
- Mueller S, Millonig G, Sarovska L, Friedrich SS, Reimann FM, Pritsch M, et al. Alcoholic steatohepatitis increases liver stiffness independent of fibrosis stage: criteria for noninvasive fibrosis assessment. Gastroenterology 2009;136(5 Suppl 1):A‐420. [Google Scholar]
- Mueller S, Millonig G, Stickel F, Longerich T, Schirmacher P, Seitz HK, et al. Improved diagnostic accuracy of transient elastography for cirrhosis using histology plus clinics as gold standard. Journal of Hepatology 2010;52(Suppl 1):S168. [Google Scholar]
Nahon 2008 {published data only}
- Nahon P, Kettaneh A, Tengher‐Barna I, Ziol M, Lédinghen V, Douvin C, et al. Assessment of liver fibrosis using transient elastography in patients with alcoholic liver disease. Journal of Hepatology 2008;49(6):1062‐8. [DOI] [PubMed] [Google Scholar]
Nguyen‐Khac 2008 {published data only}
- Balabaud CP, Bioulac‐Sage P. Transient elastography: is liver stiffness in alcoholic patients all fibrosis? (comment). Alimentary Pharmacology & Therapeutics 2009;29(12):1309‐10. [DOI] [PubMed] [Google Scholar]
- Nguyen‐Khac E, Chatelain D, Tramier B, Decrombecque C, Robert B, Joly JP, et al. Assessment of asymptomatic liver fibrosis in alcoholic patients using FibroScan: prospective comparison with seven non‐invasive laboratory tests. Alimentary Pharmacology & Therapeutics 2008;28(10):1188‐98. [DOI] [PubMed] [Google Scholar]
References to studies excluded from this review
Angulo 2009b {published data only}
Baba 2011 {published data only}
- Baba M, Furuya K, Bandou H, Kasai K, Sadaoka K. Discrimination of individuals in a general population at high‐risk for alcoholic and non‐alcoholic fatty liver disease based on liver stiffness: a cross section study. BMC Gastroenterology 2011;11:70. [DOI] [PMC free article] [PubMed] [Google Scholar]
Bureau 2008 {published data only}
- Bureau C, Metivier S, Peron JM, Selves J, Robic MA, Gourraud PA, et al. Transient elastography accurately predicts presence of significant portal hypertension in patients with chronic liver disease. Alimentary Pharmacology & Therapeutics 2008;27(12):1261‐8. [DOI] [PubMed] [Google Scholar]
Crespo 2010 {published data only}
- Crespo G, Fernandez‐Varo G, Martinez SM, Miquel R, Gilabert R, Forns X, et al. Non invasive assessment of liver fibrosis using acoustic radiation force impulse (ARFI): a prospective comparison with transient elastography and serum markers. Hepatology 2010;52(Suppl S1):962A. [Google Scholar]
Crespo 2012 {published data only}
- Crespo G, Fernandez‐Varo G, Marino Z, Casals G, Miquel R, Martinez SM, et al. ARFI, FibroScan, ELF, and their combinations in the assessment of liver fibrosis: a prospective study. Journal of Hepatology 2012;57(2):281‐7. [DOI] [PubMed] [Google Scholar]
Ebinuma 2011 {published data only}
- Ebinuma H, Saito H, Komuta M, Ojiro K, Wakabayashi K, Usui S, et al. Evaluation of liver fibrosis by transient elastography using acoustic radiation force impulse: comparison with FibroScan®. Journal of Gastroenterology 2011;46:1238‐48. [DOI] [PubMed] [Google Scholar]
Fraquelli 2007 {published data only}
- Fraquelli M, Rigamonti C, Casazza G, Conte D, Donato MF, Ronchi G, et al. Reproducibility of transient elastography in the evaluation of liver fibrosis in patients with chronic liver disease. Gut 2007;56(7):968‐73. [DOI] [PMC free article] [PubMed] [Google Scholar]
Ganne‐Carrié 2006 {published data only}
- Ganne‐Carrié N, Ziol M, Ledinghen V, Douvin C, Marcellin P, Castera L, et al. Accuracy of liver stiffness measurement for the diagnosis of cirrhosis in patients with chronic liver diseases. Hepatology 2006;44(6):1511‐7. [DOI] [PubMed] [Google Scholar]
Gómez‐Dominguez 2006 {published data only}
- Gómez‐Dominguez E, Mendoza J, Rubio S, Moreno‐Monteagudo JA, Garcia‐Buey L, Moreno‐Otero R. Transient elastography: a valid alternative to biopsy in patients with chronic liver disease. Alimentary Pharmacology & Therapeutics 2006;24(3):513‐8. [DOI] [PubMed] [Google Scholar]
Ingiliz 2009 {published data only}
- Ingiliz P, Chhay KP, Munteanu M, Lebray P, Ngo Y, Roulot D, et al. Applicability and variability of liver stiffness measurements according to probe position. World Journal of Gastroenterology 2009;15(27):3398‐404. [DOI] [PMC free article] [PubMed] [Google Scholar]
Kircheis 2012 {published data only}
- Kircheis G, Sagir A, Vogt C, Vom Dahl S, Kubitz R, Häussinger D. Evaluation of acoustic radiation force impulse imaging for determination of liver stiffness using transient elastography as a reference. World Journal of Gastroenterology 2012;18(10):1077‐84. [DOI] [PMC free article] [PubMed] [Google Scholar]
Klibansky 2012 {published data only}
- Klibansky DA, Mehta SH, Curry M, Nasser I, Challies T, Afdhal NH. Transient elastography for predicting clinical outcomes in patients with chronic liver disease. Journal of Viral Hepatitis 2012;19(2):e184‐93. [DOI] [PubMed] [Google Scholar]
Krawczyk 2011 {published data only}
- Krawczyk M, Grünhage F, Zimmer V, Lammert L. Variant adiponutrin (PNPLA3) represents a common fibrosis risk gene: non‐invasive elastography‐based study in chronic liver disease. Journal of Hepatology 2011;55(2):299‐306. [DOI] [PubMed] [Google Scholar]
Marinho 2007 {published data only}
- Marinho R, Serejo F, Velosa J, Moura MC. Clinical usefulness of transitory hepatic elastography (FibroScan®) in the diagnosis of cirrhosis [Utilidade da elastografia hepática transitória (FibroScan®) na cirrose hepática]. Jornal Português de Gastrenterologia 2007;14(1):16‐21. [ 0872‐8178] [Google Scholar]
McCorry 2012 {published data only}
- McCorry RB, Palaniyappan N, Chivinge A, Kaye P, James MW, Aithal GP. Development and evaluation of a nurse‐led transient elastography service for the staging of hepatic fibrosis in patients with suspected chronic liver disease. QJM: Monthly Journal of the Association of Physicians 2012;105(8):749‐54. [DOI] [PubMed] [Google Scholar]
Nudo 2008 {published data only}
- Nudo CG, Jeffers LJ, Bejarano PA, Servin‐Abad LA, Leibovici Z, Medina M, et al. Correlation of laparoscopic liver biopsy to elasticity measurements (FibroScan) in patients with chronic liver disease. Gastroenterology & Hepatology 2008;4(12):862‐70. [PMC free article] [PubMed] [Google Scholar]
Rath 2011 {published data only}
- Rath T, Roderfeld M, Güler C, Wenzel C, Graf J, Beitinger F, et al. YKL‐40 and transient elastography, a powerful team to assess hepatic fibrosis. Scandinavian Journal of Gastroenterology 2011;46:1369‐80. [DOI] [PubMed] [Google Scholar]
Roulot 2011 {published data only}
- Roulot D, Costes JL, Buyck JF, Warzocha U, Gambier N, Czernichow S, et al. Transient elastography as a screening tool for liver fibrosis and cirrhosis in a community‐based population aged over 45 years. Gut 2011;60(7):977‐84. [DOI] [PubMed] [Google Scholar]
Stål 2009 {published data only}
- Stål P, Seth E, Bergquist A, Nemeth A, Weiland O. Elastography ‐ a new tool for diagnosis of chronic liver diseases. Might replace liver biopsy, but not always. Läkartidningen 2009;106(50‐51):3412‐4. [PubMed] [Google Scholar]
Trabut 2012 {published data only}
Additional references
Angulo 2009a
- Angulo P. Noninvasive assessment of fibrosis and steatosis in NASH and ASH. Gastroenterologie Clinique et Biologique 2009;33(10‐11):940‐8. [DOI] [PubMed] [Google Scholar]
Becker 1996
- Becker U, Deis A, Sørensen TI, Grønbaek M, Borch‐Johnsen K, Muller CF, et al. Prediction of risk of liver disease by alcohol intake, sex, and age: a prospective population study. Hepatology 1996;23(5):1025‐9. [DOI] [PubMed] [Google Scholar]
Bercoff 2004
- Bercoff J, Tanter M, Fink M. Supersonic shear imaging: a new technique for soft tissue elasticity imaging. IEEE Transactions on Ultrasonics, Ferroelectrics and Frequency Control 2004;51(4):396‐409. [DOI] [PubMed] [Google Scholar]
Bouchier 1992
- Bouchier IA, Hislop WS, Prescott RJ. A prospective study of alcoholic liver disease and mortality. Journal of Hepatology 1992;16:290‐7. [DOI] [PubMed] [Google Scholar]
Bruha 2012
- Bruha R, Dvorak K, Petrtyl J. Alcoholic liver disease. World Journal of Hepatology 2012;4(3):8‐90. [DOI] [PMC free article] [PubMed] [Google Scholar]
Brunt 1999
- Brunt EM, Janney CG, Bisceglie AM, Neuschwander‐Tetri BA, Bacon BR. Nonalcoholic steatohepatitis: a proposal for grading and staging the histological lesions. American Journal of Gastroenterology 1999;94(9):2467‐74. [DOI] [PubMed] [Google Scholar]
Caballeria 1998
- Caballeria J, Pares A, Bru C, Mercader J, Garcia Plaza A, Caballeria L, et al. Metadoxine accelerates fatty liver recovery in alcoholic patients: results of a randomized double‐blind, placebo‐control trial Spanish Group for the Study of Alcoholic Fatty Liver. Journal of Hepatology 1998;28(1):54‐60. [DOI] [PubMed] [Google Scholar]
Castera 2010
- Castera L, Pinzani M. Biopsy and non‐invasive methods for the diagnosis of liver fibrosis: does it take two to tango?. Gut 2010;59(7):861‐6. [DOI] [PubMed] [Google Scholar]
Colli 2010
Colli 2014
- Colli A, Fraquelli M, Casazza G, Conte D, Nikolova D, Duca P, et al. The architecture of diagnostic research: from bench to bedside ‐ research guidelines using liver stiffness as an example. Hepatology 2014;60(1):408‐18. [DOI] [PubMed] [Google Scholar]
de Lédinghen 2008
- Lédinghen V, Vergniol J. Transient elastography (FibroScan). Gastroentérologie Clinique et Biologique 2008;32(6 Suppl 1):58‐67. [DOI] [PubMed] [Google Scholar]
de Lédinghen 2010
- Lédinghen V, Vergniol J. Transient elastography for the diagnosis of liver fibrosis. Expert Review of Medical Devices 2010;7(6):811‐23. [DOI] [PubMed] [Google Scholar]
de Vet 2008
- Vet HCW, Eisinga A, Riphagen II, Aertgeerts B, Pewsner D. Chapter 7: Searching for Studies. Cochrane Handbook for Systematic Reviews of Diagnostic Test Accuracy Version 0.4 [updated September 2008]. The Cochrane Collaboration, 2008. [Google Scholar]
Deeks 2005
- Deeks JJ, Macaskill P, Irwig L. The performance of tests of publication bias and other sample size effects in systematic reviews of diagnostic test accuracy was assessed. Journal of Clinical Epidemiology 2005;58(9):882‐93. [PUBMED: 16085191] [DOI] [PubMed] [Google Scholar]
Desmet 1994
- Desmet VJ, Gerber M, Hoofnagle JH, Manns M, Scheuer PJ. Classification of chronic hepatitis: diagnosis, grading and staging. Hepatology 1994;19:1513‐20. [PubMed] [Google Scholar]
Dufour 2000
- Dufour DR, Lott JA, Nolte FS, Gretch DR, Koff RS, Seeff LB. Diagnosis and monitoring of hepatic Injury. I. Performance characteristics of laboratory tests. Clinical Chemistry 2000;46:2027‐49. [PubMed] [Google Scholar]
Ersoz 1999
- Ersoz G, Demir A, Akarca OS, Yilmaz F, Ozutemiz O, Karasu Z, et al. The value of ultrasonography in the diagnosis of early cirrhosis. Turkish Journal of Gastroenterology 1999;10(1):7‐10. [Google Scholar]
Foucher 2006
- Foucher J, Chanteloup E, Vergniol J, Castéra L, Bail B, Adhoute X. Diagnosis of cirrhosis by transient elastography (FibroScan): a prospective study. Gut 2006;55:403‐8. [DOI] [PMC free article] [PubMed] [Google Scholar]
Franciscus 2007
- Franciscus A. HCV diagnostic tools: grading and staging a liver biopsy (version 2.2), 2007. www.hcvadvocate.org (accessed 7 February 2011).
Friedrich‐Rust 2008
- Friedrich‐Rust M, Ong MF, Martens S, Sarrazin C, Bojunga J, Zeuzem S, et al. Performance of transient elastography for the staging of liver fibrosis: a meta‐analysis. Gastroenterology 2008;134(4):960‐74. [PUBMED: 18395077] [DOI] [PubMed] [Google Scholar]
Gluud 2007
- Gluud C, Brok J, Gong Y, Koretz RL. Hepatology may have problems with putative surrogate outcome measures. Journal of Hepatology 2007;46(4):734‐42. [DOI] [PubMed] [Google Scholar]
Goodman 2007
- Goodman ZD. Grading and staging systems for inflammation and fibrosis in chronic liver diseases. Journal of Hepatology 2007;47(4):598‐607. [DOI] [PubMed] [Google Scholar]
Grant 1999
- Grant A. Guidelines on the use of liver biopsy in clinical practice. Gut 1999;45(Suppl 4):IV1‐11. [DOI: 10.1136/gut.45.2008.iv1] [DOI] [PMC free article] [PubMed] [Google Scholar]
Gómez‐Domínguez 2006
- Gómez‐Domínguez E, Mendoza J, Rubio S, Moreno‐Monteagudo JA, García‐Buey L, Moreno‐Otero R. Transient elastography: a valid alternative to biopsy in patients with chronic liver disease. Alimentary Pharmacology & Therapeutics 2006;24(3):513‐8. [DOI] [PubMed] [Google Scholar]
Haque 2010
- Haque M, Robinson C, Owen D, Yoshida EM, Harris A. Comparison of acoustic radiation force impulse imaging (ARFI) to liver biopsy histologic scores in the evaluation of chronic liver disease: a pilot study. Annals of Hepatology 2010;9(3):289‐93. [PubMed] [Google Scholar]
Hizli 2010
- Hizli S, Kocyigit A, Arslan N, Tuncel S, Demircioglu F, Cakmakci H, et al. The role of ultrasonographic hepatic artery resistive index in the diagnosis of insulin resistance in obese children with non‐alcoholic fatty liver disease. Turkish Journal of Medical Sciences 2010;40(3):335‐42. [Google Scholar]
Ishak 1995
- Ishak K, Baptista A, Bianchi L, Callea F, Groote J, Gudat F, et al. Histological grading and staging of chronic hepatitis. Journal of Hepatology 1995;22:696‐9. [DOI] [PubMed] [Google Scholar]
Ismail 2011
- Ismail MH, Pinzani M. Reversal of hepatic fibrosis: pathophysiological basis of antifibrotic therapies. Hepatic Medicine: Evidence and Research 2011;3:69‐80. [DOI] [PMC free article] [PubMed] [Google Scholar]
Ivashkin 2011a
- Ivashkin VT, Pavlov CS. Non‐invasive diagnostic of liver fibrosis. Liver elastometry. In: Ivashkin VT, Pavlov CS editor(s). Liver Fibrosis. Moscow: Geotar‐Media, 2011:76‐85. [ISBN 978‐5‐9704‐1893‐2] [Google Scholar]
Ivashkin 2011b
- Ivashkin VT, Pavlov CS. Liver biopsy and morphological investigation of chronic liver disease. In: Ivashkin VT, Pavlov CS editor(s). Liver Fibrosis. Moscow: Geotar‐Media, 2011:13‐22. [ISBN 978‐5‐9704‐1893‐2] [Google Scholar]
Iyo 2009
- Iyo AY. Acoustic radiation force impulse imaging: a literature review. Journal of Diagnostic Medical Sonography 2009;25(4):204‐11. [Google Scholar]
Jin 2007
- Jin M, Talwalkar JA, Glaser KJ, Manduca A, Grimm RC, Rossman PJ, et al. Assessment of hepatic fibrosis with magnetic resonance elastography. Clinical Gastroenterology and Hepatology 2007;5(10):1207‐13.e2. [DOI] [PMC free article] [PubMed] [Google Scholar]
Jüni 1999
- Jüni P, Witschi A, Bloch R, Egger M. The hazards of scoring the quality of clinical trials for meta‐analysis. JAMA 1999;282(11):1054‐60. [DOI] [PubMed] [Google Scholar]
Kim 2012
- Kim BK, Kim SU, Choi GH, Han WK, Park MS, Kim EH, et al. "Normal" liver stiffness values differ between men and women: a prospective study for healthy living liver and kidney donors in a native Korean population. Journal of Gastroenterology and Hepatology 2012;27(4):781‐8. [DOI] [PubMed] [Google Scholar]
Kleiner 2005
- Kleiner DE, Brunt EM, Natta M, Behling C, Contos MJ, Cummings OW, et al. Nonalcoholic Steatohepatitis Clinical Research Network. Design and validation of a histological scoring system for nonalcoholic fatty liver disease. Hepatology 2005;41(6):1313‐21. [DOI] [PubMed] [Google Scholar]
Knodell 1981
- Knodell RG, Ishak KG, Black WC, Chen TS, Craig R, Kaplowitz N, et al. Formulation and application of a numerical scoring system for assessing histological activity in asymptomatic chronic active hepatitis. Hepatology 1981;1(5):431‐5. [DOI] [PubMed] [Google Scholar]
Kuntz 2008
- Kuntz E, Kuntz H‐D. Hepatology. 3rd Edition. Berlin: Springer Medizin Verlag, 2008. [Google Scholar]
Lijmer 1999
- Lijmer JG, Mol BW, Heisterkamp S, Bonsel GJ, Prins MH, Meulen JH, et al. Empirical evidence of design‐related bias in studies of diagnostic tests. JAMA 1999;282(11):1061‐6. [DOI] [PubMed] [Google Scholar]
Liu 2012
- Liu T, Wang X, Karsdal MH, Leeming DJ, Genovese F. Molecular serum markers of liver fibrosis. Biomark Insights 2012;7:105‐17. [DOI] [PMC free article] [PubMed] [Google Scholar]
Macaskill 2010
- Macaskill P, Gatsonis C, Deeks JJ, Harbord RM, Takwoingi Y. Chapter 10: Analysing and presenting results. In: Deeks JJ, Bossuyt PM, Gatsonis C (editors). Cochrane Handbook for Systematic Reviews of Diagnostic Test Accuracy Version 1.0 [updated September 2010]. The Cochrane Collaboration, 2010. Available from: http://srdta.cochrane.org/.
Morra 2007
- Morra R, Munteanu M, Imbert‐Bismut F, Messous D, Ratziu V, Poynard T. FibroMAX: towards a new universal biomarker of liver disease?. Expert Review of Molecular Diagnostics 2007;7(5):481‐90. [DOI] [PubMed] [Google Scholar]
Myers 2010
- Myers RP, Elkashab M, Ma M, Crotty P, Pomier‐Layrargues G. Transient elastography for the noninvasive assessment of liver fibrosis: a multicentre Canadian study. Canadian Journal of Gastroenterology 2010;24(11):661‐70. [DOI] [PMC free article] [PubMed] [Google Scholar]
Nahon 2009
- Nahon P, Kettaneh A, Lemoine M, Seror O, Barget N, Trinchet JC. Liver stiffness measurement in patients with cirrhosis and hepatocellular carcinoma: a case‐control study. European Journal of Gastroenterology and Hepatology 2009;21(2):214‐9. [DOI] [PubMed] [Google Scholar]
Naveau 1997
- Naveau S, Giraud V, Borotto E, Aubert A, Capron F, Chaput JC. Excess weight risk factor for alcoholic liver disease. Hepatology 1997;25(1):108‐11. [DOI] [PubMed] [Google Scholar]
O'Shea 2010
- O'Shea RS, Dasarathy S, McCullough AJ, the Practice Guideline Committee of the American Association for the Study of Liver Diseases and the Practice Parameters Committee of the American College of Gastroenterology. Alcoholic liver disease. Hepatology 2010;51(1):307‐28. [DOI] [PubMed] [Google Scholar]
Pavlov 2014a
- Pavlov CS, Casazza G, Tsochatzis M, Nikolova D, Gluud C. Ultrasonography for diagnosis of cirrhosis in patients with alcoholic liver disease. Cochrane Database of Systematic Reviews [in editorial consideration]. [DOI] [PMC free article] [PubMed]
Pavlov 2014b
- Pavlov CS, Casazza G, Tsochatzis M, Nikolova D, Gluud C. Transient elastography and FibroTest® for diagnosis of hepatic fibrosis in adult patients with chronic hepatitis C. Cochrane Database of Systematic Reviews [under preparation].
Poulsen 1979
- Poulsen HE, Christoffersen P. Atlas of Liver Biopsies. Copenhagen: Munksgaard, 1979. [Google Scholar]
Poynard 2007
- Poynard T, Morra R, Halfon P, Castera L, Ratziu V, Imbert‐Bismut F, et al. Meta‐analyses of FibroTest diagnostic value in chronic liver disease. BMC Gastroenterology 2007;7:40. [DOI: 10.1186/1471-230X-7-40] [DOI] [PMC free article] [PubMed] [Google Scholar]
Poynard 2008
- Poynard T, Morra R, Ingiliz P, Imbert‐Bismut F, Thabut D, Messous D. Assessment of liver fibrosis: noninvasive means. Saudi Journal of Gastroenterology 2008;14(4):163‐73. [DOI] [PMC free article] [PubMed] [Google Scholar]
Regev 2002
- Regev A, Berho M, Jeffers LJ, Milikowski C, Molina EG, Pyrsopoulos NT, et al. Sampling error and intraobserver variation in liver biopsy in patients with chronic HCV infection. American Journal of Gastroenterology 2002;97(10):2614‐8. [DOI] [PubMed] [Google Scholar]
Reitsma 2005
RevMan 2012 [Computer program]
- The Nordic Cochrane Centre, The Cochrane Collaboration. Review Manager (RevMan). Version 5.2. Copenhagen: The Nordic Cochrane Centre, The Cochrane Collaboration, 2012.
Rockey 2008
- Rockey DC. Noninvasive assessment of liver fibrosis and portal hypertension with transient elastography. Gastroenterology 2008;134(1):8‐14. [DOI] [PubMed] [Google Scholar]
Rockey 2009
- Rockey DC, Caldwell SH, Goodman ZD, Nelson RC, Smith AD. Liver biopsy. Hepatology 2009;49(3):1017‐44. [DOI] [PubMed] [Google Scholar]
Roulot 2008
- Roulot D, Czernichow S, Clésiau H, Costes JL, Vergnaud AC, Beaugrand M. Liver stiffness values in apparently healthy subjects: influence of gender and metabolic syndrome. Journal of Hepatology 2008;48(4):606‐13. [DOI] [PubMed] [Google Scholar]
Royle 2003
- Royle P, Milne R. Literature searching for randomized controlled trials used in Cochrane reviews: rapid versus exhaustive searches. International Journal of Technology Assessment in Health Care 2003;19(4):591‐603. [DOI] [PubMed] [Google Scholar]
Rutjes 2006
- Rutjes AW, Reitsma JB, Nisio M, Smidt N, Rijn JC, Bossuyt PM. Evidence of bias and variation in diagnostic accuracy studies. Canadian Medical Association Journal 2006;174(4):469‐76. [DOI] [PMC free article] [PubMed] [Google Scholar]
Rutter 2001
- Rutter CA, Gatsonis CA. A hierarchical regression approach to meta‐analysis of diagnostic test accuracy evaluations. Statistics in Medicine 2001;20:2865‐84. [DOI] [PubMed] [Google Scholar]
Sagir 2008
- Sagir A, Erhardt A, Schmitt M, Häussinger D. Transient elastography is unreliable for detection of cirrhosis in patients with acute liver damage. Hepatology 2008;47:592‐5. [DOI] [PubMed] [Google Scholar]
Sandrin 2003
- Sandrin L, Fourquet B, Hasquenoph J‐M, Yon S, Fournier C, Mal F, et al. Transient elastography: a new noninvasive method for assessment of hepatic fibrosis. Ultrasound in Medicine and Biology 2003;29:1705‐13. [DOI] [PubMed] [Google Scholar]
Savolainen 1993
- Savolainen VT, Liesto K, Männikkö A, Penttilä A, Karhunen PJ. Alcohol consumption and alcoholic liver disease: evidence of a threshold level of effects of ethanol. Alcoholism, Clinical and Experimental Research 1993;17:1112‐7. [DOI] [PubMed] [Google Scholar]
Schoenfeld 1999
- Schoenfeld P, Guyatt G, Hamilton F, Laine L, Cook D, Bjorkman D, et al. An evidence‐based approach to gastroenterology diagnosis. Gastroenterology 1999;116:1230‐7. [DOI] [PubMed] [Google Scholar]
Seeff 2010
- Seeff LB, Everson GT, Morgan TR, Curto TM, Lee WM, Ghany MG, et al. Complication rate of percutaneous liver biopsies among persons with advanced chronic liver disease in the HALT‐C trial. Clinical Gastroenterology and Hepatology 2010;8:877‐83. [DOI] [PMC free article] [PubMed] [Google Scholar]
Sherlock 1997
- Sherlock S, Dooley J. Alcohol and the liver. Diseases of the Liver and Biliary System. 10th Edition. Oxford: Blackwell Science, 1997:385‐403. [Google Scholar]
Smidt 2005
- Smidt N, Rutjes AW, Windt DA, Ostelo RW, Reitsma JB, Bossuyt PM, et al. Quality of reporting of diagnostic accuracy studies. Radiology 2005;235:347‐53. [DOI] [PubMed] [Google Scholar]
Stebbing 2010
- Stebbing J, Farouk L, Panos G, Anderson M, Jiao LR, Mandalia S, et al. A meta‐analysis of transient elastography for the detection of hepatic fibrosis. Journal of Clinical Gastroenterology 2010;44(3):214‐9. [DOI] [PubMed] [Google Scholar]
Stevenson 2012
- Stevenson M, Lloyd‐Jones M, Morgan MY, Wong R. Non‐invasive diagnostic assessment tools for the detection of liver fibrosis in patients with suspected alcohol‐related liver disease: a systematic review and economic evaluation. Health Technology Assessment 2012; Vol. 16, issue 4:1‐174. [DOI] [PMC free article] [PubMed]
Stewart 2001
- Stewart S, Jones D, Day CP. Alcoholic liver disease: new insights into mechanisms and preventative strategies. Trends in Molecular Medicine 2001;7(9):408‐13. [DOI] [PubMed] [Google Scholar]
Teli 1995
- Teli MR, Day CP, Burt AD, Bennett MK, James OF. Determinants of progression to cirrhosis and fibrosis in pure alcoholic fatty liver. Lancet 1995;356:987‐90. [DOI] [PubMed] [Google Scholar]
Tsochatzis 2011
- Tsochatzis EA, Gurusamy KS, Ntaoula S, Cholongitas E, Davidson BR, Burroughs AK. Elastography for the diagnosis of severity of fibrosis in chronic liver disease: a meta‐analysis of diagnostic accuracy. Journal of Hepatology 2011;54(4):650‐9. [DOI] [PubMed] [Google Scholar]
Whiting 2004
- Whiting P, Rutjes AW, Reitsma JB, Glas AS, Bossuyt PM, Kleijnen J. Sources of variation and bias in studies of diagnostic accuracy: a systematic review. Annals of Internal Medicine 2004;140(3):189‐202. [DOI] [PubMed] [Google Scholar]
Whiting 2005
- Whiting P, Harbord R, Kleijnen J. No role for quality scores in systematic reviews of diagnostic accuracy studies. BMC Medical Research Methodology 2005;5:19. [DOI] [PMC free article] [PubMed] [Google Scholar]
Whiting 2011
- Whiting PF, Weswood ME, Rutjes AW, Reitsma JB, Bossuyt PN, Kleijnen J. QUADAS‐2: a revised tool for the quality assessment of diagnostic accuracy studies. Annals of Internal Medicine 2011;155:529‐36. [DOI] [PubMed] [Google Scholar]
WHO
- World Health Organization. BMI classification. http://apps.who.int/bmi/index.jsp?introPage=intro_3.html (accessed 21 January 2015).
WHO 2010
- World Health Organization. Global strategy to reduce the harmful use of alcohol, 2010. www.who.int/substance_abuse/alcstratenglishfinal.pdf (accessed 15 January 2015).
Yashima 2011
- Yashima Y, Tsujino T, Masuzaki R, Nakai Y, Hirano K, Tateishi R, et al. Increased liver elasticity in patients with biliary obstruction. Jornal of Gastroenterology 2011;46(1):86‐91. [DOI] [PubMed] [Google Scholar]
Yoshioka 2013
- Yoshioka K. How to adjust the inflammation‐induced overestimation of liver fibrosis using transient elastography?. Hepatology Research 2013;43(2):182‐4. [DOI] [PubMed] [Google Scholar]
Ziol 2005
- Ziol M, Handra‐Luca A, Kettaneh A, Christidis C, Mal F, Kazemi F, et al. Noninvasive assessment of liver fibrosis by measurement of stiffness in patients with chronic hepatitis C. Hepatology 2005;41(1):48‐54. [DOI] [PubMed] [Google Scholar]